Embed Size (px)
Citation preview
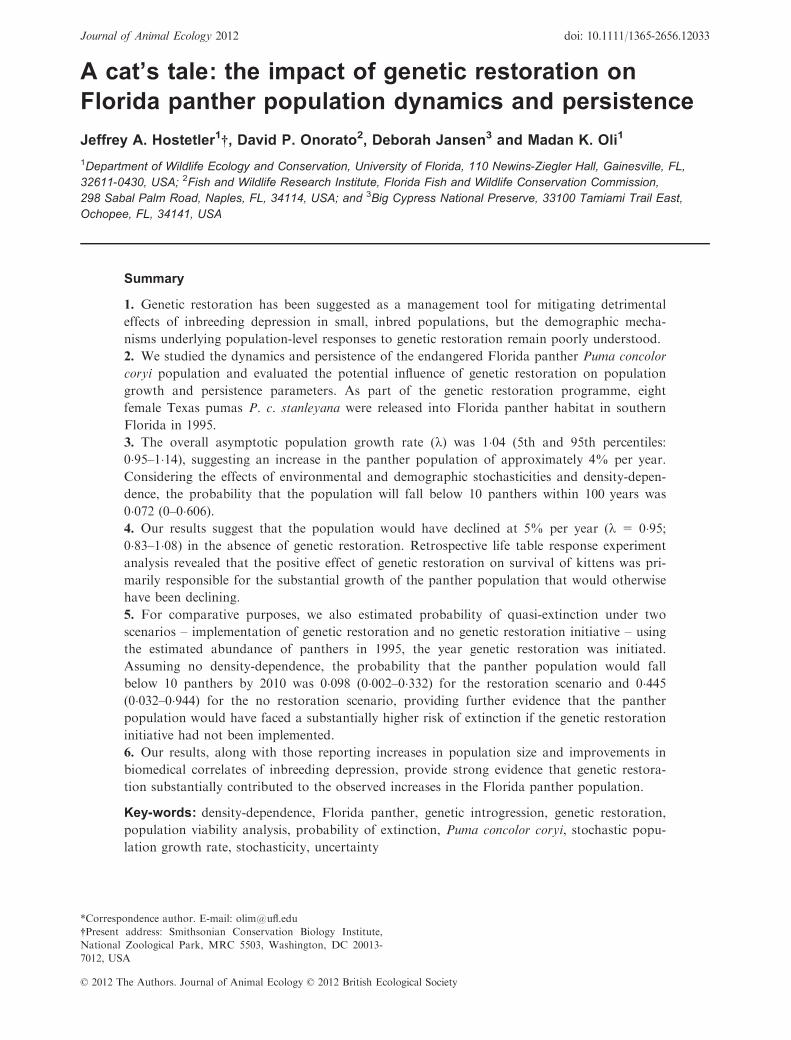
A cat’s tale: the impact of genetic restoration on
Florida panther population dynamics and persistence
Jeffrey A. Hostetler1†, David P. Onorato2, Deborah Jansen3 and Madan K. Oli1
1Department of Wildlife Ecology and Conservation, University of Florida, 110 Newins-Ziegler Hall, Gainesville, FL,
32611-0430, USA; 2Fish and Wildlife Research Institute, Florida Fish and Wildlife Conservation Commission,
298 Sabal Palm Road, Naples, FL, 34114, USA; and 3Big Cypress National Preserve, 33100 Tamiami Trail East,
Ochopee, FL, 34141, USA
Summary
1. Genetic restoration has been suggested as a management tool for mitigating detrimental
effects of inbreeding depression in small, inbred populations, but the demographic mecha-
nisms underlying population-level responses to genetic restoration remain poorly understood.
2. We studied the dynamics and persistence of the endangered Florida panther Puma concolor
coryi population and evaluated the potential influence of genetic restoration on population
growth and persistence parameters. As part of the genetic restoration programme, eight
female Texas pumas P. c. stanleyana were released into Florida panther habitat in southern
Florida in 1995.
3. The overall asymptotic population growth rate (k) was 1�04 (5th and 95th percentiles:
0�95–1�14), suggesting an increase in the panther population of approximately 4% per year.
Considering the effects of environmental and demographic stochasticities and density-depen-
dence, the probability that the population will fall below 10 panthers within 100 years was
0�072 (0–0�606).4. Our results suggest that the population would have declined at 5% per year (k = 0�95;0�83–1�08) in the absence of genetic restoration. Retrospective life table response experiment
analysis revealed that the positive effect of genetic restoration on survival of kittens was pri-
marily responsible for the substantial growth of the panther population that would otherwise
have been declining.
5. For comparative purposes, we also estimated probability of quasi-extinction under two
scenarios – implementation of genetic restoration and no genetic restoration initiative – using
the estimated abundance of panthers in 1995, the year genetic restoration was initiated.
Assuming no density-dependence, the probability that the panther population would fall
below 10 panthers by 2010 was 0�098 (0�002–0�332) for the restoration scenario and 0�445(0�032–0�944) for the no restoration scenario, providing further evidence that the panther
population would have faced a substantially higher risk of extinction if the genetic restoration
initiative had not been implemented.
6. Our results, along with those reporting increases in population size and improvements in
biomedical correlates of inbreeding depression, provide strong evidence that genetic restora-
tion substantially contributed to the observed increases in the Florida panther population.
Key-words: density-dependence, Florida panther, genetic introgression, genetic restoration,
population viability analysis, probability of extinction, Puma concolor coryi, stochastic popu-
lation growth rate, stochasticity, uncertainty
*Correspondence author. E-mail: [email protected]
†Present address: Smithsonian Conservation Biology Institute,
National Zoological Park, MRC 5503, Washington, DC 20013-
7012, USA
© 2012 The Authors. Journal of Animal Ecology © 2012 British Ecological Society
Journal of Animal Ecology 2012 doi: 10.1111/1365-2656.12033

Introduction
Loss of genetic variation and an increase in inbreeding are
inevitable in small, isolated populations (Frankham,
Briscoe, & Ballou 2002). Many such populations ultimately
suffer from inbreeding depression due to reduced heterozy-
gosity and/or increased expression of deleterious recessive
alleles (Frankham, Briscoe, & Ballou 2002; Tallmon,
Luikart, & Waples 2004; Charlesworth & Willis 2009).
Indeed, many field studies have reported that inbreeding
leads to reduction in survival (Keller et al. 1994; Liberg
et al. 2005; Hostetler et al. 2010), reproduction (Ortego
et al. 2007; Charpentier et al. 2008) and, ultimately, fitness
(Slate et al. 2000; H€oglund et al. 2002). At the population
level, inbreeding depression can reduce population growth
rate and increase extinction risk (Nieminen et al. 2001;
Haag et al. 2002; Reed, Nicholas, & Stratton 2007; Aguirre
& Marshall 2012). Low levels of immigration have been
suggested to help alleviate detrimental effects of inbreeding
depression (Ingvarsson 2001; Tallmon, Luikart, & Waples
2004). Improvements in fitness of inbred populations from
natural or experimentally induced immigration of geneti-
cally divergent individuals (known variously as genetic res-
cue, genetic restoration and genetic introgression; Tallmon,
Luikart, & Waples 2004) has been successful in enhancing
demographic performance of several wildlife species
(Westemeier et al. 1998; Vil�a et al. 2003; Madsen, Ujvari,
& Olsson 2004; Hogg et al. 2006).
The endangered Florida panther Puma concolor coryi
exemplifies the challenges faced by small populations that
are genetically and demographically isolated from other
conspecific populations. Once widely distributed through-
out the south-eastern US, panthers currently occur in a
single, isolated population in south Florida (Onorato
et al. 2010). After a remnant population of panthers was
documented in 1972, a sustained research programme ini-
tiated in 1980 revealed that the population had declined
to fewer than 20–25 adults (McBride et al. 2008). Further-
more, it became evident that the population was charac-
terized by a low level of genetic variation and suffered
from a plethora of morphological and biomedical abnor-
malities including atrial septal defects, cryptorchidism and
low sperm count and quality (Roelke, Martenson, &
O’Brien 1993; Barone et al. 1994; Culver et al. 2000).
These abnormalities were thought to be indicative of
inbreeding depression and ultimately led to the recom-
mendation that genetic restoration might help alleviate
these issues (Seal & Lacy 1994). This was a controversial
recommendation (Maehr & Caddick 1995), but one that
was implemented following vigorous debate and careful
planning (Seal & Lacy 1994; Hedrick 1995; Beier et al.
2003). As part of this programme, eight female Texas
pumas P. c. stanleyana were released into Florida panther
habitat in south Florida in 1995, a process that would in
essence mimic gene flow that historically occurred
between the subspecies. Since 1995, panther abundance
has increased substantially (McBride et al. 2008), genetic
variation has increased and the frequency of documented
biomedical abnormalities has declined (Johnson et al.
2010). Recent studies suggest that age-specific survival rates
were generally higher for admixed panthers than those for
canonical (or pure) Florida panthers (Hostetler et al. 2010;
Benson et al. 2011), but that admixed females did not have
reproductive advantages (Hostetler et al. 2012b). Nonethe-
less, the role of the genetic restoration in observed demo-
graphic responses has been debated (Creel 2006; Maehr
et al. 2006; Pimm, Bass, & Dollar 2006a; Pimm, Dollar, &
Bass 2006b), and the demographic mechanisms underlying
the observed population growth remain uncertain.
Concerns regarding persistence of the Florida panther
population have led to several population viability
analyses (PVA) (Maehr et al. 2002; Root 2004). After a
thorough evaluation, a Scientific Review Team (SRT;
commissioned by the Florida Fish and Wildlife Conserva-
tion Commission and U. S. Fish and Wildlife Service to
review Florida panther science), noted that previous PVAs
were based on unreliable estimates of demographic
parameters, required too many arbitrary assumptions,
performed insufficient sensitivity analyses, and used ‘con-
sensus’ approaches to determine parameter values and
model structure (Beier et al. 2003, 2006). The SRT recom-
mended rigorous analyses of available data to estimate
demographic parameters and to perform demographic
analyses using those empirically estimated parameters.
Now that statistically rigorous estimates of demo-
graphic parameters for the Florida panther are available
(Hostetler et al. 2010, 2012b; Benson et al. 2011), the
most appropriate next step is to use those parameters for
a thorough assessment of the Florida panther population
dynamics and persistence.
Our goal was to investigate whether and to what extent
genetic restoration contributed to the observed population
growth and to discern demographic mechanisms underly-
ing the improvements in population growth and persis-
tence parameters following the restoration. Specifically,
we: (i) estimated deterministic and stochastic population
growth rates for Florida panthers; (ii) performed prospec-
tive sensitivity analyses and quantified the elasticity of
deterministic and stochastic population growth rates to
vital demographic parameters; (iii) estimated probability
of extinction and distribution of extinction times; (iv)
estimated deterministic population growth rate for a
hypothetical population of canonical panthers; (v) decom-
posed the observed difference in population growth rate
between the overall population post-restoration and the
canonical panther population, using a retrospective life-
table response experiment analysis; and (vi) estimated
probabilities of extinction between 1995 and 2010 for sce-
narios with and without genetic restoration. We explicitly
address two sources of uncertainties that are frequently
ignored (i.e. parametric and model selection uncertainty)
and three factors that influence dynamics and persistence
of small populations (i.e. environmental stochasticity,
demographic stochasticity and density dependence).
© 2012 The Authors. Journal of Animal Ecology © 2012 British Ecological Society, Journal of Animal Ecology
2 J. A. Hostetler et al.
Materials and methods
field and genetic methods
Since 1981, Florida panthers have been treed, captured, radio-col-
lared and tracked by biologists from the Florida Fish and Wild-
life Conservation Commission (FWC) and National Park Service
(NPS) using methods described previously (Belden et al. 1988;
Land et al. 2008; Onorato et al. 2011). Starting in 1995, Florida
panther kittens from radio-collared females were counted, sexed
and PIT tagged at the den; some kittens were subsequently recap-
tured alive or recovered dead as described previously (Land,
Garman, & Holt 1998; Benson, Lotz, & Jansen 2008; Hostetler
et al. 2010).
We divided female panthers into four age categories: kittens
(age 0–1 year), sub-adults (age 1–2�5 years), prime adults (age
2�5–10 years), and older adults (age � 10 years). Male age cate-
gories were the same except that sub-adult panthers became
prime adult at age 3�5 years. Age of captured panthers was
known for those captured and tagged as kittens; when exact age
was not known, it was estimated based on tooth wear and pelage
characteristics (Ashman & Greer 1976). The effect of potential
error in estimates of age on parameter estimates was previously
reported to be insubstantial (Benson et al. 2011).
Genetic samples for Florida panthers were analysed using 23
microsatellite loci to delineate genetic heritage of individuals
(see Johnson et al. 2010 for analytical details). These data per-
mitted us to categorize panthers as canonical (individuals repre-
sentative of the population prior to genetic restoration) or as
products of the genetic restoration process (e.g. F1 admixed,
backcrosses).
population model structure anddeterministic demographic analyses
For deterministic and stochastic demographic analyses, we used
age-structured matrix population models focusing on the female
segment of the population (Caswell 2001). We assumed that
female panthers can live until age 18�5 years, which corresponds
to the estimated age of the oldest radio-collared female in this
study (18�6 years). We also assumed female panthers can repro-
duce until age 18�5 years. However, the probability of successful
reproduction by older adults was very low (Hostetler et al.
2010); this was because of the fact the oldest female panther in
our data set that reproduced was age 11 years. Therefore, the
population projection matrix had dimensions 19 9 19, and was
of the form:
At ¼
Ft1 Ft
2 � � � � � � Ft19
Pt1 0 � � � � � � 0
0 Pt2
. .. . .
. ...
..
. . .. . .
. . .. ..
.
0 0 � � � Pt18 0
26666664
37777775
where F and P indicate age-specific fertility and survival rates for
female panthers respectively; subscripts indicate age classes and t
stands for time-specificity (superscripts do not apply to determin-
istic demographic analyses; Appendix S1, Supporting informa-
tion). Because Florida panthers reproduce throughout the year,
we used birth-flow methods for estimating Pi’s and Fi’s (Leslie
1945; Caughley 1977; Caswell 2001). Details on estimation of Pi’s
and Fi’s and vital demographic parameters are presented in
Appendix S1.
The asymptotic deterministic annual population growth rate
(k) and elasticity of k to demographic parameters were estimated
using methods described in Caswell (2001). We also estimated
generation time (T) and life expectancy for female panthers start-
ing in age class 1 following Caswell (2001).
incorporating environmental stochastic ity
Environmental stochasticity can substantially affect dynamics and
persistence of populations (Tuljapurkar 1989; Caswell 2001; Boyce
et al. 2006). Thus, we incorporated environmental stochasticity in
demographic parameters for which there was evidence of tempo-
ral variation, as indicated by random effect of year-of-study
(Hostetler et al. 2010, 2012b; Benson et al. 2011). Temporal vari-
ance of litter size was essentially zero, so we did not consider
environmental stochasticity for this parameter (Hostetler et al.
2012b). However, there was evidence for environmental stochas-
ticity in age-specific survival probabilities (kitten, sub-adult and
adult survival), and age-specific probability of reproduction
(Hostetler et al. 2010, 2012b; Benson et al. 2011). We assumed
no temporal correlation among the three groups of parameters
(survival of kittens, survival of sub-adult and adult panthers and
reproduction probabilities); these parameters were estimated
using different data sets and statistical methods, and we do not
know of any reasonable methods to estimate temporal correlation
among them.
estimating stochastic population growth andelasticit ies
We used a simulation approach (50 000 time steps) to estimate
the stochastic population growth rate or log(ks) and elasticity
of log(ks) to demographic parameters under the assumption of
identically and independently distributed (iid) environments
(Caswell 2001; Morris & Doak 2002; Haridas & Tuljapurkar
2005). In each time step, estimates of vital demographic param-
eters were obtained as described in Appendix S1 and a time-
specific population projection matrix was compiled and stored.
This sequence of 50 000 population projection matrices were
then used to estimate log(ks) and elasticity of log(ks) to mean
and standard deviation of demographic parameters as well as
overall stochastic elasticities (Tuljapurkar, Horvitz, & Pascarella
2003; Caswell 2005; Haridas & Tuljapurkar 2005). We expon-
entiated log(ks) to obtain finite stochastic population growth
rate (ks).
population viab il ity analysis: estimatingextinction parameters
We used a two-sex, age-structured matrix population model and
a stochastic simulation approach to PVA, explicitly incorporating
two sources of uncertainty (parametric and model selection
uncertainty) and three factors that can strongly influence dynam-
ics and persistence of small populations (environmental stochas-
ticity, demographic stochasticity, and density-dependence).
Simulation details are provided in Appendix S2, Supporting
information.
© 2012 The Authors. Journal of Animal Ecology © 2012 British Ecological Society, Journal of Animal Ecology
Genetic restoration and population persistence 3
The two-sex population projection matrix was of the form:
Atn ¼
Ft1 Nð Þ Ft
2 Nð Þ � � � � � � Ft19 Nð Þ 0 � � � � � � 0
Pt1 Nð Þ 0 � � � � � � 0 0 � � � � � � 0
0 Pt2 Nð Þ . .
. . .. ..
. ... . .
. . .. ..
.
..
. . .. . .
. . .. ..
. ... . .
. . .. ..
.
0 0 � � � Pt18 Nð Þ 0 0 � � � � � � 0
Mt1 Nð Þ Mt
2 Nð Þ � � � � � � Mt19 Nð Þ 0 � � � � � � 0
0 0 � � � � � � 0 Qt1 Nð Þ . .
. . .. ..
.
..
. ... . .
. . .. ..
.0 . .
. . .. ..
.
0 0 � � � � � � 0 0 � � � Qt14 Nð Þ 0
2666666666666666664
3777777777777777775
where Fit (N) and Pi
t (N) are age- and time-specific fertility and
survival rates for female panthers as described previously, except
that these rates can now be density-dependent [indicated by (N),
where N is total population size at time t; see Incorporating Den-
sity-dependence, below]; M is the rate at which male kittens are
produced by females of different age classes (assuming 50 : 50
sex ratio), and Q is age-specific survival of male panthers. We
estimated survival probabilities of sub-adult, prime adult, and
older adult males (Qsa, Qpa and Qoa) using Cox proportional-haz-
ard models as described in Benson et al. (2011, also see Appendix
S1). We assumed that male panthers can live up to age
14�5 years, which corresponds to the estimated age of the oldest
radio-collared male in our study (14�4 years). The population was
then projected as: n(t + 1) = Ant n(t), where n(t) is the population
vector at time t, and includes age-specific abundance of both
male and female panthers. In this modelling framework, males
contribute to the population dynamics only via survival.
Environmental stochasticity was incorporated using a simula-
tion approach as described previously. A brief description of how
we incorporated density-dependence and demographic stochastici-
ty and estimated extinction parameters follows.
Incorporating density-dependence – There was strong evidence
for negative density-dependence in kitten survival, moderate evi-
dence for positive density-dependence in probability of successful
reproduction, weak evidence for negative density-dependence in
sub-adult and adult survival, and weak evidence for positive den-
sity-dependence in litter size (Hostetler et al. 2010, 2012b, Appen-
dix S1). Because density-dependence in demographic parameters
and functional form thereof can affect the estimated probability
of extinction (Henle et al. 2004; Coulson et al. 2008), we included
models that did and did not include the effect of panther abun-
dance on demographic parameters in our simulations, and ran a
separate PVA with no density-dependence in demographic
parameters.
The annual index of abundance was the minimum count of
older kittens (out of the den, but still dependent on their moth-
ers), sub-adult and adult panthers of both sexes (McBride et al.
2008). Since age class 1 in our birth-flow model represents pan-
thers of age 0�5–1�5 years, total population size at each time step
was the sum of the population vector at time t.
Most, but not all models in our model sets included density-
dependence on demographic parameters, and simulations with
density-independent demographic parameters could grow expo-
nentially, leading to very large population sizes. For biological
plausibility and computational efficiency, we imposed a ceiling
density limit of 1 000 panthers for all simulations. When the
population size exceeded 1 000 panthers, we removed panthers
proportionally from all age and sex classes to reach a total popu-
lation size of 1 000.
Incorporating demographic stochasticity – At small population
sizes, demographic stochasticity can substantially affect popula-
tion dynamics and persistence (Caswell 2001; Morris & Doak
2002). We used an individual-based simulation approach (Caswell
2001) to incorporate the effect of demographic stochasticity by
applying the time-specific demographic parameters (influenced by
environmental stochasticity and/or density-dependence) to the
fates of individual panthers. The number of females and males
that survived a year in each age class was determined by drawing
uniform random numbers between 0 and 1 and comparing them
with the annual survival probabilities (Pit and Qi
t respectively).
We also used an individual-based simulation approach to incor-
porate the effect of demographic stochasticity on reproductive
parameters; details are given in Appendix S1.
When the number of panthers in every sex and/or age class
exceeded 20, we did not incorporate demographic stochasticity,
but rounded entries of the projected population vector so they
could be used with demographic stochasticity (which operates on
individuals) the next year (Morris & Doak 2002). This was done
to reduce computational burden and because the influence of
demographic stochasticity is insubstantial in large populations
(Morris & Doak 2002).
Estimating extinction parameters – We simulated populations
for 200 years starting with the 2010 abundance index (100 total
panthers), distributed according to stable age and sex distribu-
tions. If a simulated trajectory fell below a critical threshold
(Ncrit; set at 1, 10 and 30 panthers) it was considered extinct or
quasi-extinct from that point forward. In addition to probabilities
of extinction and quasi-extinction, we were interested in the tim-
ing of these events. Therefore, we also noted when each simula-
tion first fell below each Ncrit (extinction and quasi-extinction
times; Morris & Doak 2002).
Sensitivity analysis of extinction probabilities – To examine the
effects of model parameters on probabilities of extinction, we per-
formed a life stage simulation analysis (LSS; Wisdom, Mills, &
Doak 2000; Tinker, Doak, & Estes 2008; Bakker et al. 2009).
For the top set of statistical models for demographic parameters
(Appendix S1), we ran 1 000 parametric bootstraps of 1 000 sim-
ulations (Appendix S2, Supporting information, but without
selecting different models), and regressed the intercept and slope
parameters that determine the demographic parameter values
(Appendix S1) against arcsine square-root transformed probabili-
ties of extinction. We present squared semi-partial correlation
coefficients (SSPCC) for each intercept and slope parameter,
which quantify a combination of the influence of these parameter
on extinction probability, and of the uncertainty in estimates of
those parameters (Bakker et al. 2009). Because this approach
cannot explicitly incorporate model selection uncertainty, we also
performed this analysis using estimates of intercept and slope
parameters obtained from the second-best supported statistical
model for each group of demographic parameters (Appendix S1).
incorporating parameter and modelselection uncertainty
We incorporated parameter uncertainty into our demographic
analyses and PVA via a parametric bootstrap method (Efron &
Tibshirani 1993). We estimated a variance-covariance matrix for
each set of parameters: (i) kitten survival (on logit scale); (ii) sub-
© 2012 The Authors. Journal of Animal Ecology © 2012 British Ecological Society, Journal of Animal Ecology
4 J. A. Hostetler et al.
adult and adult survival (baseline survival converted to logit scale
and log-hazard effect sizes); (iii) probability of reproduction (on
complementary log-log scale); and (iv) number of kittens pro-
duced in the year per female panther that successfully reproduced
(on cumulative logit scale). We assumed no overall covariance
among the four categories of demographic variables, but used the
estimated covariances within categories. We ran multiple para-
metric bootstraps (50 000 for deterministic and stochastic demo-
graphic analyses and 1 000 for PVAs), selecting slope and
intercept parameter values from a multivariate normal distribu-
tion with vectors of the parameter means (on the appropriate
scales) and variance-covariance matrices, and then converting the
results to the real scale, for each bootstrap run. In this way, we
sampled values of parameters from the empirically estimated dis-
tributions and parameter values.
Another source of statistical uncertainty in demographic analy-
ses is model selection uncertainty – incertitude about whether the
minimum AIC (or QAICc) model for a parameter is actually the
best model in the model set (Burnham and Anderson 2002). We
incorporated this form of uncertainty by randomly selecting sta-
tistical models for each set of parameters, weighted by their AIC
(or QAICc) weights (Bakker et al. 2009). For deterministic and
stochastic demographic analyses, we restricted model sets to den-
sity-independent models only (Appendix S1).
For each analysis for which model selection uncertainty was
incorporated, parameter uncertainty was also incorporated by
selecting parameter values from their distributions as discussed
above for the model selected, and then estimating the output
parameters (such as deterministic k, sensitivities, and elasticities).
This process was repeated multiple times (50 000 for deterministic
and stochastic demographic analyses and 1 000 for PVAs).
For all output variables (except for generation time and life
expectancy) we report mean and/or median and 5th and 90th per-
centiles of parametric and/or model selection bootstrap runs. We
also report minimum and maximum extinction and quasi-extinc-
tion times.
what if the restoration never happened?
An interesting question in the management of the Florida pan-
ther is: what might have happened to the panther population if
genetic restoration had not occurred? To address this question,
we estimated demographic parameters for canonical panthers
only (Appendix S3, Supporting information). However, we used
estimates of temporal variation in vital rates estimated for the
overall population as described previously. We assumed that
demographic parameter estimates based on canonical panthers
after restoration were representative of a hypothetical post-1995
canonical panther population. Using these estimates, we parame-
terized a population projection matrix and estimated population
growth rate for a canonical population (k(c)); we incorporated
parametric and model selection uncertainty as described above.
To determine which demographic parameters contributed the
most to the observed difference between k and k(c), we performed
a fixed effect, one way life-table response experiment analysis
(LTRE; Caswell 2001).
In addition to population growth rate, we also investigated
how genetic restoration affected the probability of extinction. We
conducted PVAs for the overall population and canonical
population with a starting population size estimated for 1995
(McBride et al. 2008). Of the 26 pumas believed to be present in
1995, 18 were Florida panthers (assumed to be at stable age and
sex distribution for the canonical population) and 8 were female
Texas pumas (two of age 3 years, and six of age 4 years; McBride
et al. 2008; Onorato, unpublished data). To separate the potential
benefits of ‘genetic rescue’ and ‘demographic rescue’ (Creel 2006),
we conducted PVAs using a starting population size that did and
did not include the eight Texas puma females. We ran 1000 runs
of 1000 simulations, each for 15 years (1995–2010) using proce-
dures described previously. We chose to run these simulations
until 2010 only because we were examining ‘what might have
happened’, rather than what could happen in the future. As the
starting panther population sizes were <30, we only estimated
probability of quasi-extinction and extinction times for critical
thresholds of 1 and 10 panthers. Because the population size in
1995 was quite small and we had difficulty obtaining realistic
estimates of the effects of abundance and genetic ancestry simul-
taneously, we assumed no density-dependent effects on
demographic parameters. However, we imposed a ceiling density-
dependence of 100, the minimum panther count for 2010.
Results
growth rate and perturbation analysis
The estimate of deterministic k using demographic param-
eters obtained from the best supported set of statistical
models for vital rates was 1�06 (5th and 95th percentiles:
0�96–1�16). When model selection uncertainty was incor-
porated, k dropped to 1�04 (both mean and median; 0�95–1�14). Estimated generation time was 4�45 years. A female
starting in age class 1 (average starting age of 6 months)
was estimated to live on average 5�05 more years
(SD = 4�85 years).
The estimate of ks obtained from the best supported set
of statistical models for vital rates was 1�05 (0�96–1�13).With model selection uncertainty included, the estimate of
ks was 1�03 (0�95–1�11). Overall stochastic elasticities were
similar to deterministic ones (data not shown), with log
(ks) being proportionately most sensitive to changes in
prime adult survival (Fig. 1a). The log(ks) was propor-
tionately most sensitive to the mean of prime adult sur-
vival, but was proportionately most sensitive to the
standard deviation of kitten survival. Most of the overall
stochastic elasticity was contributed by elasticity to the
means of parameters; contribution of temporal standard
deviations to overall stochastic elasticities was substan-
tially smaller (Fig. 1b and c).
extinction parameters
The probability of extinction within the next 100 years
was 0�057 (0–0�458; Fig. 2a). The probabilities of quasi-
extinction within the next 100 years were 0�072 (0–0�606)and 0�128 (0–0�839) for critical threshold (Ncrit) of 10 and
30 panthers respectively (Fig. 2b and c). At 200 years, 5th
and 95th percentiles for probability of (quasi-)extinc-
tion ranged from zero to >0�8 at all critical thresholds.
Conditional on extinction within 200 years, the median
© 2012 The Authors. Journal of Animal Ecology © 2012 British Ecological Society, Journal of Animal Ecology
Genetic restoration and population persistence 5
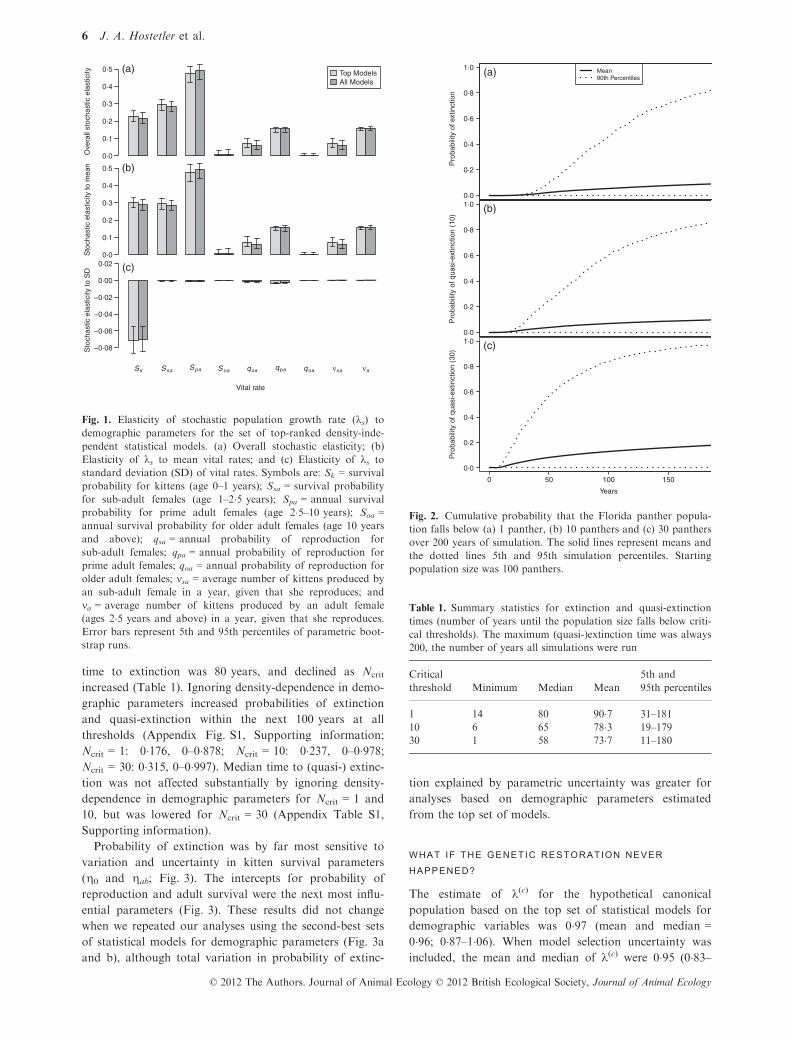
time to extinction was 80 years, and declined as Ncrit
increased (Table 1). Ignoring density-dependence in demo-
graphic parameters increased probabilities of extinction
and quasi-extinction within the next 100 years at all
thresholds (Appendix Fig. S1, Supporting information;
Ncrit = 1: 0�176, 0–0�878; Ncrit = 10: 0�237, 0–0�978;Ncrit = 30: 0�315, 0–0�997). Median time to (quasi-) extinc-
tion was not affected substantially by ignoring density-
dependence in demographic parameters for Ncrit = 1 and
10, but was lowered for Ncrit = 30 (Appendix Table S1,
Supporting information).
Probability of extinction was by far most sensitive to
variation and uncertainty in kitten survival parameters
(g0 and gab; Fig. 3). The intercepts for probability of
reproduction and adult survival were the next most influ-
ential parameters (Fig. 3). These results did not change
when we repeated our analyses using the second-best sets
of statistical models for demographic parameters (Fig. 3a
and b), although total variation in probability of extinc-
tion explained by parametric uncertainty was greater for
analyses based on demographic parameters estimated
from the top set of models.
what if the genetic restoration neverhappened?
The estimate of k(c) for the hypothetical canonical
population based on the top set of statistical models for
demographic variables was 0�97 (mean and median =0�96; 0�87–1�06). When model selection uncertainty was
included, the mean and median of k(c) were 0�95 (0�83–
Ove
rall
stoc
hast
ic e
last
icity
0·0
0·1
0·2
0·3
0·4
0·5 Top ModelsAll Models
(a)
Sto
chas
tic e
last
icity
to m
ean
0·0
0·1
0·2
0·3
0·4
0·5 (b)
Sk Ssa Spa Soa qsa qpa qoa νsa νa
Vital rate
Sto
chas
tic e
last
icity
to S
D
−0·08
−0·06
−0·04
−0·02
0·00
0·02 (c)
Fig. 1. Elasticity of stochastic population growth rate (ks) to
demographic parameters for the set of top-ranked density-inde-
pendent statistical models. (a) Overall stochastic elasticity; (b)
Elasticity of ks to mean vital rates; and (c) Elasticity of ks to
standard deviation (SD) of vital rates. Symbols are: Sk = survival
probability for kittens (age 0–1 years); Ssa = survival probability
for sub-adult females (age 1–2�5 years); Spa = annual survival
probability for prime adult females (age 2�5–10 years); Soa =annual survival probability for older adult females (age 10 years
and above); qsa = annual probability of reproduction for
sub-adult females; qpa = annual probability of reproduction for
prime adult females; qoa = annual probability of reproduction for
older adult females; msa = average number of kittens produced by
an sub-adult female in a year, given that she reproduces; and
ma = average number of kittens produced by an adult female
(ages 2�5 years and above) in a year, given that she reproduces.
Error bars represent 5th and 95th percentiles of parametric boot-
strap runs.
0·0
0·2
0·4
0·6
0·8
1·0
Pro
babi
lity
of e
xtin
ctio
n
Mean90th Percentiles
(a)
0·0
0·2
0·4
0·6
0·8
1·0
Pro
babi
lity
of q
uasi
-ext
inct
ion
(10)
(b)
0 50 100 150
0·0
0·2
0·4
0·6
0·8
1·0
Years
Pro
babi
lity
of q
uasi
-ext
inct
ion
(30)
(c)
Fig. 2. Cumulative probability that the Florida panther popula-
tion falls below (a) 1 panther, (b) 10 panthers and (c) 30 panthers
over 200 years of simulation. The solid lines represent means and
the dotted lines 5th and 95th simulation percentiles. Starting
population size was 100 panthers.
Table 1. Summary statistics for extinction and quasi-extinction
times (number of years until the population size falls below criti-
cal thresholds). The maximum (quasi-)extinction time was always
200, the number of years all simulations were run
Critical
threshold Minimum Median Mean
5th and
95th percentiles
1 14 80 90�7 31–18110 6 65 78�3 19–17930 1 58 73�7 11–180
© 2012 The Authors. Journal of Animal Ecology © 2012 British Ecological Society, Journal of Animal Ecology
6 J. A. Hostetler et al.

1�08). Patterns of elasticities (data not shown) were similar
to those for the overall population.
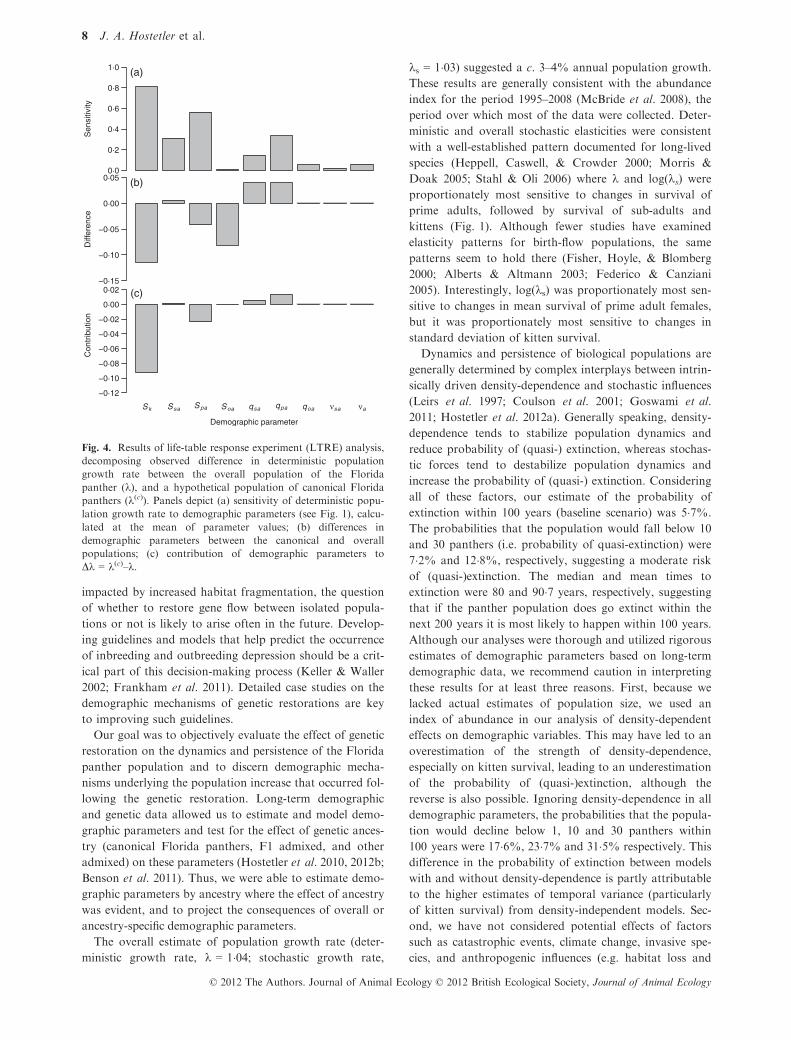
The difference between k and k(c) was 0�10; the largest
contributor to this difference in growth rate was kitten
survival probability (Sk; Fig. 4). This was due to both a
substantially lower kitten survival for canonical panthers
(�0�133; Fig. 4b) and a large sensitivity of population
growth rate to Sk (Fig. 4a). Prime adult survival probabil-
ity also contributed to the lower k for the canonical
population, while prime-adult probability of reproduction,
sub-adult probability of reproduction and sub-adult sur-
vival probability had slightly compensatory effects on kfor the canonical population (Fig. 4). Although canonical
panthers in general had lower survival than the overall
panther population, the estimate for Ssa(c) based on the
best supported model for this parameter was slightly
higher for canonical panthers (Appendix S1 and S3, Sup-
porting information); this was likely because of the fact
that estimates of Ssa(c) came from a subset of the data for
a period (1997–2006) when survival rates of sub-adult
females were generally higher. The k(c) predicted by the
LTRE model (calculated as the sum of the contributions
from all demographic parameters) was also 0�95, indicat-ing that the LTRE approximation was reasonable.
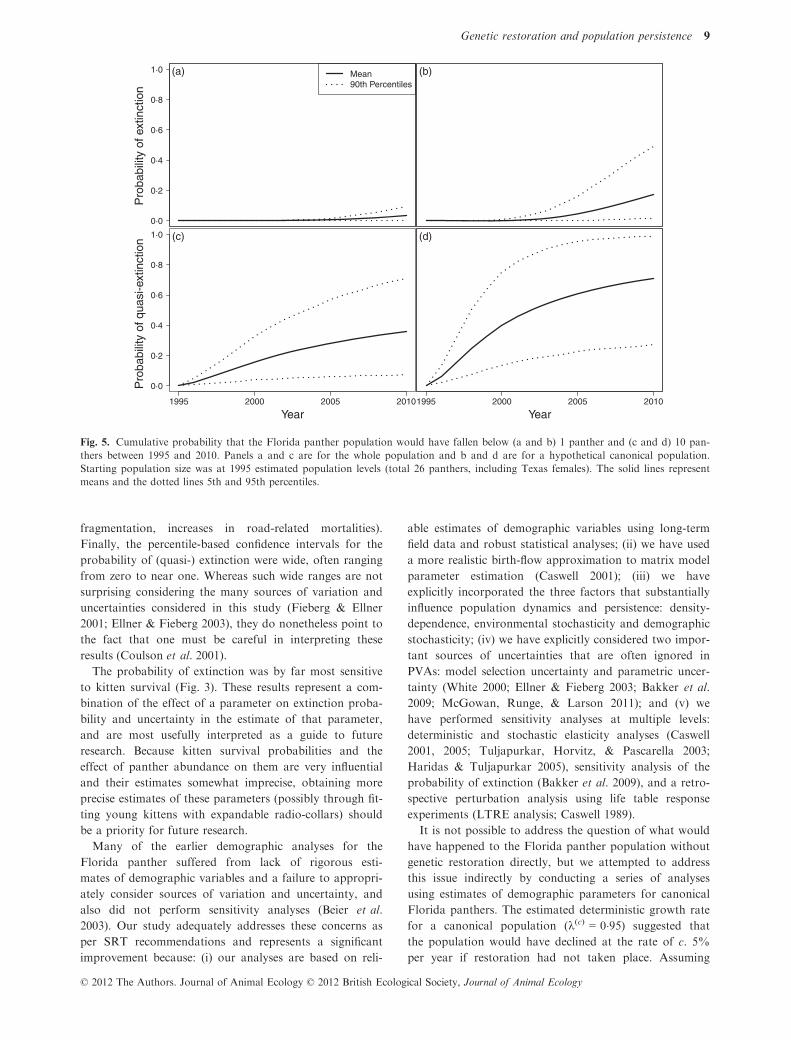
With the starting population size of 26 panthers, the
probability of extinction between 1995 and 2010 was
0�004 (0–0�015; Fig. 5a) for the overall population, and
0�069 (0�001–0�285; Fig. 5b) for the canonical population.
The probabilities of quasi-extinction (Ncrit = 10 panthers)
within the same period were 0�098 (0�002–0�332) and
0�445 (0�032–0�944) for the overall and canonical popula-
tions respectively (Figure 5c and d). Probabilities of
extinction and quasi-extinction were higher for both pop-
ulations with a starting population size of 18 panthers
(Appendix S4, Supporting information). However, these
probabilities were higher for the canonical population
with the higher starting population size than those for the
overall population with the lower starting population size
(Fig. 5b and d and Appendix Fig. S2 A and C, Support-
ing information). These results suggest that improved
demographic performance of the population was due pri-
marily to improvement in demographic parameters attrib-
utable to genetic restoration; demographic benefits of an
additional eight females were much smaller.
Discussion
Several laboratory and field studies have revealed that
genetic restoration can help alleviate detrimental effects of
inbreeding depression (Westemeier et al. 1998; Ebert et al.
2002; Vil�a et al. 2003; Bijlsma et al. 2010). However, evi-
dence to the contrary also exists, and one cannot rule out
the possibility of potentially detrimental effects of such
management actions, including outbreeding depression
and genomic sweep (Tallmon, Luikart, & Waples 2004;
Reed 2010; Adams et al. 2011). With many species being
SS
PC
C (
Mod
el S
et 1
)
0·00
0·05
0·10
0·15
0·20
0·25
0·30
*
(a)
SS
PC
C (
Mod
el S
et 2
)
0·00
0·01
0·02
0·03
0·04
* *
(b)
η0 ηab logit(Sfpa) ιm ιsa ιoa ιab ιm:sa γ0 γoa γab θ1 θ2 θ3 θ4 βab
Kitten survival Sub-adult and adult survival Probability of reproduction Kittens produced
Fig. 3. Squared semi-partial correlation coefficients (SSPCC) for population viability analysis parameters, representing a sensitivity anal-
ysis of probability of extinction to model parameters. Panels depict SSPCC for (a) the top set of statistical models and (b) the set of
‘next to top’ statistical models for each group of parameters (see Appendix S1). Asterisks (*) represent parameters not included in that
set of models. Symbols are: g0 = intercept for kitten survival; gab = slope for abundance index on kitten survival (above threshold; see
Appendix S1); logit(Spa) = annual survival probability for prime adult females (ages 2�5–10 years) transformed to the logit scale;
ιm = log-hazard slope for being male on sub-adult and adult survival; ιsa = log-hazard slope for being a sub-adult on survival; ιoa = log-
hazard slope for being an older adult on survival; ιab = log-hazard slope for abundance index on sub-adult and adult survival; ιm:
sa = log-hazard interaction term for male sub-adults survival; c0 = intercept for probability of female reproduction; coa = slope for being
an older adult on probability of female reproduction; cab = slope for abundance index on probability of female reproduction; hs = inter-
cept for annual number of offspring being at most s; and bab = slope for abundance index on kitten production.
© 2012 The Authors. Journal of Animal Ecology © 2012 British Ecological Society, Journal of Animal Ecology
Genetic restoration and population persistence 7
impacted by increased habitat fragmentation, the question
of whether to restore gene flow between isolated popula-
tions or not is likely to arise often in the future. Develop-
ing guidelines and models that help predict the occurrence
of inbreeding and outbreeding depression should be a crit-
ical part of this decision-making process (Keller & Waller
2002; Frankham et al. 2011). Detailed case studies on the
demographic mechanisms of genetic restorations are key
to improving such guidelines.
Our goal was to objectively evaluate the effect of genetic
restoration on the dynamics and persistence of the Florida
panther population and to discern demographic mecha-
nisms underlying the population increase that occurred fol-
lowing the genetic restoration. Long-term demographic
and genetic data allowed us to estimate and model demo-
graphic parameters and test for the effect of genetic ances-
try (canonical Florida panthers, F1 admixed, and other
admixed) on these parameters (Hostetler et al. 2010, 2012b;
Benson et al. 2011). Thus, we were able to estimate demo-
graphic parameters by ancestry where the effect of ancestry
was evident, and to project the consequences of overall or
ancestry-specific demographic parameters.
The overall estimate of population growth rate (deter-
ministic growth rate, k = 1�04; stochastic growth rate,
ks = 1�03) suggested a c. 3–4% annual population growth.
These results are generally consistent with the abundance
index for the period 1995–2008 (McBride et al. 2008), the
period over which most of the data were collected. Deter-
ministic and overall stochastic elasticities were consistent
with a well-established pattern documented for long-lived
species (Heppell, Caswell, & Crowder 2000; Morris &
Doak 2005; Stahl & Oli 2006) where k and log(ks) were
proportionately most sensitive to changes in survival of
prime adults, followed by survival of sub-adults and
kittens (Fig. 1). Although fewer studies have examined
elasticity patterns for birth-flow populations, the same
patterns seem to hold there (Fisher, Hoyle, & Blomberg
2000; Alberts & Altmann 2003; Federico & Canziani
2005). Interestingly, log(ks) was proportionately most sen-
sitive to changes in mean survival of prime adult females,
but it was proportionately most sensitive to changes in
standard deviation of kitten survival.
Dynamics and persistence of biological populations are
generally determined by complex interplays between intrin-
sically driven density-dependence and stochastic influences
(Leirs et al. 1997; Coulson et al. 2001; Goswami et al.
2011; Hostetler et al. 2012a). Generally speaking, density-
dependence tends to stabilize population dynamics and
reduce probability of (quasi-) extinction, whereas stochas-
tic forces tend to destabilize population dynamics and
increase the probability of (quasi-) extinction. Considering
all of these factors, our estimate of the probability of
extinction within 100 years (baseline scenario) was 5�7%.
The probabilities that the population would fall below 10
and 30 panthers (i.e. probability of quasi-extinction) were
7�2% and 12�8%, respectively, suggesting a moderate risk
of (quasi-)extinction. The median and mean times to
extinction were 80 and 90�7 years, respectively, suggesting
that if the panther population does go extinct within the
next 200 years it is most likely to happen within 100 years.
Although our analyses were thorough and utilized rigorous
estimates of demographic parameters based on long-term
demographic data, we recommend caution in interpreting
these results for at least three reasons. First, because we
lacked actual estimates of population size, we used an
index of abundance in our analysis of density-dependent
effects on demographic variables. This may have led to an
overestimation of the strength of density-dependence,
especially on kitten survival, leading to an underestimation
of the probability of (quasi-)extinction, although the
reverse is also possible. Ignoring density-dependence in all
demographic parameters, the probabilities that the popula-
tion would decline below 1, 10 and 30 panthers within
100 years were 17�6%, 23�7% and 31�5% respectively. This
difference in the probability of extinction between models
with and without density-dependence is partly attributable
to the higher estimates of temporal variance (particularly
of kitten survival) from density-independent models. Sec-
ond, we have not considered potential effects of factors
such as catastrophic events, climate change, invasive spe-
cies, and anthropogenic influences (e.g. habitat loss and
Sen
sitiv
ity
0·0
0·2
0·4
0·6
0·8
1·0 (a)D
iffer
ence
−0·15
−0·10
−0·05
0·00
0·05 (b)
Sk Ssa Spa Soa qsa qpa qoa νsa νa
Demographic parameter
Con
trib
utio
n
−0·12
−0·10
−0·08
−0·06
−0·04
−0·02
0·00
0·02 (c)
Fig. 4. Results of life-table response experiment (LTRE) analysis,
decomposing observed difference in deterministic population
growth rate between the overall population of the Florida
panther (k), and a hypothetical population of canonical Florida
panthers (k(c)). Panels depict (a) sensitivity of deterministic popu-
lation growth rate to demographic parameters (see Fig. 1), calcu-
lated at the mean of parameter values; (b) differences in
demographic parameters between the canonical and overall
populations; (c) contribution of demographic parameters to
Dk = k(c)–k.
© 2012 The Authors. Journal of Animal Ecology © 2012 British Ecological Society, Journal of Animal Ecology
8 J. A. Hostetler et al.
fragmentation, increases in road-related mortalities).
Finally, the percentile-based confidence intervals for the
probability of (quasi-) extinction were wide, often ranging
from zero to near one. Whereas such wide ranges are not
surprising considering the many sources of variation and
uncertainties considered in this study (Fieberg & Ellner
2001; Ellner & Fieberg 2003), they do nonetheless point to
the fact that one must be careful in interpreting these
results (Coulson et al. 2001).
The probability of extinction was by far most sensitive
to kitten survival (Fig. 3). These results represent a com-
bination of the effect of a parameter on extinction proba-
bility and uncertainty in the estimate of that parameter,
and are most usefully interpreted as a guide to future
research. Because kitten survival probabilities and the
effect of panther abundance on them are very influential
and their estimates somewhat imprecise, obtaining more
precise estimates of these parameters (possibly through fit-
ting young kittens with expandable radio-collars) should
be a priority for future research.
Many of the earlier demographic analyses for the
Florida panther suffered from lack of rigorous esti-
mates of demographic variables and a failure to appropri-
ately consider sources of variation and uncertainty, and
also did not perform sensitivity analyses (Beier et al.
2003). Our study adequately addresses these concerns as
per SRT recommendations and represents a significant
improvement because: (i) our analyses are based on reli-
able estimates of demographic variables using long-term
field data and robust statistical analyses; (ii) we have used
a more realistic birth-flow approximation to matrix model
parameter estimation (Caswell 2001); (iii) we have
explicitly incorporated the three factors that substantially
influence population dynamics and persistence: density-
dependence, environmental stochasticity and demographic
stochasticity; (iv) we have explicitly considered two impor-
tant sources of uncertainties that are often ignored in
PVAs: model selection uncertainty and parametric uncer-
tainty (White 2000; Ellner & Fieberg 2003; Bakker et al.
2009; McGowan, Runge, & Larson 2011); and (v) we
have performed sensitivity analyses at multiple levels:
deterministic and stochastic elasticity analyses (Caswell
2001, 2005; Tuljapurkar, Horvitz, & Pascarella 2003;
Haridas & Tuljapurkar 2005), sensitivity analysis of the
probability of extinction (Bakker et al. 2009), and a retro-
spective perturbation analysis using life table response
experiments (LTRE analysis; Caswell 1989).
It is not possible to address the question of what would
have happened to the Florida panther population without
genetic restoration directly, but we attempted to address
this issue indirectly by conducting a series of analyses
using estimates of demographic parameters for canonical
Florida panthers. The estimated deterministic growth rate
for a canonical population (k(c) = 0�95) suggested that
the population would have declined at the rate of c. 5%
per year if restoration had not taken place. Assuming
0·0
0·2
0·4
0·6
0·8
1·0
Pro
babi
lity
of e
xtin
ctio
n
Mean90th Percentiles
(a) (b)
1995 2000 2005 2010
0·0
0·2
0·4
0·6
0·8
1·0
Year
Pro
babi
lity
of q
uasi
-ext
inct
ion (c)
1995 2000 2005 2010
Year
(d)
Fig. 5. Cumulative probability that the Florida panther population would have fallen below (a and b) 1 panther and (c and d) 10 pan-
thers between 1995 and 2010. Panels a and c are for the whole population and b and d are for a hypothetical canonical population.
Starting population size was at 1995 estimated population levels (total 26 panthers, including Texas females). The solid lines represent
means and the dotted lines 5th and 95th percentiles.
© 2012 The Authors. Journal of Animal Ecology © 2012 British Ecological Society, Journal of Animal Ecology
Genetic restoration and population persistence 9
exponential growth and ignoring stochastic factors, the
population would have declined to half its original size
in about 14 years (from 18 canonical panthers in 1995 to
c. 9 in 2009). Next, we asked: which demographic param-
eter(s) affected by genetic restoration contributed most to
the observed post-restoration population growth? Retro-
spective LTRE analysis revealed that most of the
observed increase in population growth rate was attribut-
able to improvements in kitten survival in response to the
genetic restoration, followed by prime adult survival.
Thus, improved survival of kitten and prime adults in
response to genetic restoration likely turned the declining
panther population to an increasing one. Finally, we
asked: would the panther population have gone extinct by
now without genetic restoration? Without the eight Texas
cougars released in the panther habitat, and without
improvements in demographic parameters due to genetic
restoration, we estimated that the probability that the
population would have fallen below 10 panthers by 2010
was 70�8% (Appendix S4), as opposed to 9�8% with both
benefits. Demographic parameters for canonical panthers
were estimated using data collected for a period when
canonical and admixed panthers coexisted; a purely
canonical population might have experienced a higher
growth rate and lower (quasi-) extinction probabilities in
the absence of competition from admixed panthers. Con-
versely, because this hypothetical population would not
have benefitted from the improved reproductive capacity
of admixed males (Johnson et al. 2010), reproductive out-
put might have been lower and this population’s demo-
graphic performance might have been even worse than
reported here. Given the evidence that a canonical
population would have declined, possibly catastrophically
(or at least continued to not increase), concerns of conser-
vation and wildlife biologists and managers about the
demographic and genetic health of the panther population
in the early 1990s seem warranted (Fergus 1991; Roelke,
Martenson, & O’Brien 1993; Seal & Lacy 1994).
Population projection models in general and PVAs in
particular tend to be forward-looking. However, back-
wards-looking models can also be useful for model vali-
dation (Brook et al. 2000; Ball, Lindenmayer, &
Possingham 2003; Lindenmayer et al. 2003) and for eval-
uating the impacts of past management actions (Schwartz
1999; Kauffman, Frick, & Linthicum 2003). Determining
‘what would have happened’ if management actions had
been different can be at least as challenging as trying to
predict the future. However, notwithstanding these chal-
lenges, both forward- and backward-looking demographic
analyses can be useful; evaluating the effects of past man-
agement actions on population dynamics and persistence,
and modelling potential future population changes and
risks are critical tools for choosing appropriate manage-
ment actions. Coulson et al. (2001) have persuasively
argued that PVA results must be interpreted relative to
the quantity and quality of data, future distribution of
vital rates, and factors and processes affecting population
dynamics and persistence. Fieberg & Ellner (2001) and
Ellner et al. (2002) showed that long-term estimates
of extinction risk can be highly imprecise, even with
considerable quantities of data. Our results are consistent
with these findings. Despite this, we disagree with the
notion that the apparently inherent imprecision of PVA
results makes them useless to science or management.
PVAs are generally the best tools science has to offer for
assessing extinction risk and it is generally preferable to
make use of what science has to tell us (taking into
account the uncertainty) than to ignore it in favour of
subjective assessments (Brook et al. 2002). An estimate of
probability of extinction, even with wide confidence inter-
vals, still represents an objective and quantitative measure
of risk faced by a population.
Although the imminent demise of the Florida panther
population appears to have been averted for now, the
population continues to face a multitude of threats.
Panthers still exist in a single, isolated population, with
no realistic possibility of natural gene flow (Onorato et al.
2010). Consequently, inbreeding remains a concern, and
additional genetic management may be required to
prevent future episodes of inbreeding depression. The
population faces substantial risk due to demographic
stochasticity, and catastrophic events such as disease out-
breaks can potentially negatively impact the population
(Onorato et al. 2010). Road-related mortalities, an impor-
tant cause of panther mortality (Benson et al. 2011), have
continued to increase, and given the projected human
population growth and imminent increase in traffic vol-
umes (Zwick & Carr 2006), this source of mortality is
unlikely to subside. The south Florida ecosystem faces
threats from many invasive species of plants and animals,
which can alter prey availability; some invasive species
(e.g. pythons) may directly compete with panthers for prey
(Dorcas et al. 2012). Finally, models of climate change
suggest that the sea level is likely to rise dramatically in
south Florida, which (along with human population
growth) can negatively affect habitat availability (Fei,
Cox, & Whittle 2011). The long-term persistence of the
Florida panther, a flagship species and one of the last
remaining symbols of wilderness in Florida, will depend
on the ability of wildlife managers to identify and address
these potential threats in a timely fashion, a process that
may be assisted via the findings of this and subsequent
incarnations of population persistence models.
Acknowledgements
We thank D. Land, M. Cunningham, R. McBride, J. Benson, M. Lotz, D.
Shindle, M. Criffield, S. Schulze, D. Giardina, A. Johnson, J. Kellam, L.
Oberhofer, M. Alvarado, H. Fitting and Rocky, Rowdy and C. McBride
and others for assistance with fieldwork. All genetic and ancestry analyses
were performed at the National Cancer Institute by W. Johnson, M. Roelke,
and S. O’Brien; we are greatly indebted to them. We also thank B. Bolker, J.
Nichols, and V. Bakker for modelling advice, and B. Bolker, J. Nichols, M.
Sunquist, J. Ballou, C. Belden, D. Land, T. O’Meara, M. van de Kerk and
one anonymous reviewer for reviewing earlier drafts of this manuscript. This
work was funded through the Florida Panther Research and Management
© 2012 The Authors. Journal of Animal Ecology © 2012 British Ecological Society, Journal of Animal Ecology
10 J. A. Hostetler et al.

Trust Fund, National Park Service, University of Florida, and grant Agree-
ment no.: 401816G091 from the United States Fish and Wildlife Service.
The views and conclusions presented herein are those of the authors and do
not necessarily reflect the views and conclusions of the federal government.
References
Adams, J.R., Vucetich, L.M., Hedrick, P.W., Peterson, R.O. & Vucetich,
J.A. (2011) Genomic sweep and potential genetic rescue during limiting
environmental conditions in an isolated wolf population. Proceedings of
the Royal Society B: Biological Sciences, 278, 3336–3344.Aguirre, J.D. & Marshall, D.J. (2012) Genetic diversity increases popula-
tion productivity in a sessile marine invertebrate. Ecology, 93, 1134–1142.Alberts, S.C. & Altmann, J. (2003) Matrix models for primate life history
analysis. Primate Life Histories and Socioecology (eds P.M. Kappeler &M.
E. Pereira), pp. 66–102. University of Chicago Press, Chicago, IL, USA.
Ashman, D.L. & Greer, K. (1976) Age techniques. Transactions of the
Mountain Lion Workshop. US Fish and Wildlife Service, Portland,
Oregon, USA. pp. 199–204.Bakker, V.J., Doak, D.F., Roemer, G.W., Garcelon, D.K., Coonan, T.J.,
Morrison, S.A., Lynch, C., Ralls, K. & Shaw, R. (2009) Incorporating
ecological drivers and uncertainty into a demographic population viabil-
ity analysis for the island fox. Ecological Monographs, 79, 77–108.Ball, S.J., Lindenmayer, D.B. & Possingham, H.P. (2003) The predictive
accuracy of population viability analysis: a test using data from two
small mammal species in a fragmented landscape. Biodiversity and
Conservation, 12, 2393–2413.Barone, M.A., Roelke, M.E., Howard, J.G., Brown, J.L., Anderson, A.E.
& Wildt, D.E. (1994) Reproductive characteristics of male Florida pan-
thers: comparative studies from Florida, Texas, Colorado, Latin Amer-
ica, and North American zoos. Journal of Mammalogy, 75, 150–162.Beier, P., Vaughan, M.R., Conroy, M.J. & Quigley, H. (2003) An Analysis
of Scientific Literature Related to the Florida Panther. Bureau of Wild-
life Diversity Conservation, Florida Fish and Wildlife Conservation
Commission, Tallahassee, FL, USA.
Beier, P., Vaughan, M.R., Conroy, M.J. & Quigley, H. (2006) Evaluating
scientific inferences about the Florida panther. Journal of Wildlife Man-
agement, 70, 236–245.Belden, R.C., Frankenberger, W.B., McBride, R.T. & Schwikert, S.T.
(1988) Panther habitat use in southern Florida. The Journal of Wildlife
Management, 53, 660–663.Benson, J.F., Lotz, M.A. & Jansen, D. (2008) Natal den selection by Flor-
ida panthers. The Journal of Wildlife Management, 72, 405–410.Benson, J.F., Hostetler, J.A., Onorato, D.P., Johnson, W.E., Roelke, M.E.,
O’Brien, S.J., Jansen, D. & Oli, M.K. (2011) Intentional genetic intro-
gression influences survival of adults and subadults in a small, inbred
felid population. Journal of Animal Ecology, 80, 958–967.Bijlsma, R., Westerhof, M.D.D., Roekx, L.P. & Pen, I. (2010) Dynamics
of genetic rescue in inbred Drosophila melanogaster populations. Conser-
vation Genetics, 11, 449–462.Boyce, M.S., Haridas, C.V., Lee, C.T. & the NCEAS Stochastic Demogra-
phy Working Group, C.T. (2006) Demography in an increasingly vari-
able world. Trends in Ecology & Evolution, 21, 141–148.Brook, B.W., O’Grady, J.J., Chapman, A.P., Burgman, M.A., Akcakaya,
H.R., Frankham, R., et al. (2000) Predictive accuracy of population
viability analysis in conservation biology. Nature, 404, 385–387.Brook, B.W., Burgman, M.A., Akc�akaya, H.R., O’Grady, J.J. & Frank-
ham, R. (2002) Critiques of PVA ask the wrong questions: throwing the
heuristic baby out with the numerical bath water. Conservation Biology,
16, 262–263.Burnham, K.P. & Anderson, D.R. (2002) Model Selection and Multimodel
Inference: A Practical Information-Theoretic Approach, 2nd edn.
Springer, New York, NY, USA.
Caswell, H. (1989) Analysis of life table response experiments I. Decom-
position of effects on population growth rate. Ecological Modelling, 46,
221–237.Caswell, H. (2001) Matrix Population Models: Construction, Analysis, and
Interpretation, 2nd ed. Sinauer Associates, Sunderland, MA, USA.
Caswell, H. (2005) Sensitivity analysis of the stochastic growth rate: three
extensions. Australian & New Zealand Journal of Statistics, 47, 75–85.Caughley, G. (1977) Analysis of Vertebrate Populations. John Wiley &
Sons, New York, NY, USA.
Charlesworth, D. & Willis, J.H. (2009) The genetics of inbreeding depres-
sion. Nature Reviews Genetics, 10, 783–796.
Charpentier, M.J.E., Tung, J., Altmann, J. & Alberts, S.C. (2008) Age at
maturity in wild baboons: genetic, environmental and demographic
influences. Molecular Ecology, 17, 2026–2040.Coulson, T., Catchpole, E.A., Albon, S.D., Morgan, B.J.T., Pemberton, J.M.,
Clutton-Brock, T.H., Crawley, M.J. & Grenfell, B.T. (2001) Age, sex,
density, winter weather, and population crashes in Soay sheep. Science,
292, 1528–1531.Coulson, T., Ezard, T.H.G., Pelletier, F., Tavecchia, G., Stenseth, N.C.,
Childs, D.Z., Pilkington, J.G., Pemberton, J.M., Kruuk, L.E.B., Clut-
ton-Brock, T.H. & Crawley, M.J. (2008) Estimating the functional form
for the density dependence from life history data. Ecology, 89, 1661–1674.
Creel, S. (2006) Recovery of the Florida panther–genetic rescue,
demographic rescue, or both? Response to Pimm et al. (2006). Animal
Conservation, 9, 125–126.Culver, M., Johnson, W.E., Pecon-Slattery, J. & O’Brien, S.J. (2000)
Genomic ancestry of the American puma (Puma concolor). Journal of
Heredity, 91, 186–197.Dorcas, M.E., Willson, J.D., Reed, R.N., Snow, R.W., Rochford, M.R.,
Miller, M.A., Meshaka Jr, W.E., Andreadis, P.T., Mazzotti, F.J.,
Romagosa, C.M. & Hart, K.M. (2012) Severe mammal declines coincide
with proliferation of invasive Burmese pythons in Everglades national
park. Proceedings of the National Academy of Sciences, 109, 2418–2422.Ebert, D., Haag, C., Kirkpatrick, M., Riek, M., Hottinger, J.W. & Pajunen,
V.I. (2002) A selective advantage to immigrant genes in a Daphnia
metapopulation. Science, 295, 485–488.Efron, B. & Tibshirani, R. (1993) An Introduction to the Bootstrap. Chap-
man & Hall/CRC, Boca Raton, FL, USA.
Ellner, S.P. & Fieberg, J. (2003) Using PVA for management despite
uncertainty: effects of habitat, hatcheries, and harvest on salmon. Ecol-
ogy, 84, 1359–1369.Ellner, S.P., Fieberg, J., Ludwig, D. & Wilcox, C. (2002) Precision of pop-
ulation viability analysis. Conservation Biology, 16, 258–261.Federico, P. & Canziani, G.A. (2005) Modeling the population dynamics
of capybara Hydrochaeris hydrochaeris: a first step towards a manage-
ment plan. Ecological Modelling, 186, 111–121.Fei, S., Cox, J. & Whittle, A. (2011) A perfect storm may threaten Florida
panther recovery. Frontiers in Ecology and the Environment, 9, 317–318.Fergus, C. (1991) The Florida panther verges on extinction. Science, 251,
1178–1180.Fieberg, J. & Ellner, S.P. (2001) Stochastic matrix models for conservation
and management: a comparative review of methods. Ecology Letters, 4,
244–266.Fisher, D.O., Hoyle, S.D. & Blomberg, S.P. (2000) Population dynamics
and survival of an endangered wallaby: a comparison of four methods.
Ecological Applications, 10, 901–910.Frankham, R., Briscoe, D.A. & Ballou, J.D. (2002) Introduction to Conser-
vation Genetics. Cambridge University Press, New York, NY, USA.
Frankham, R., Ballou, J.D., Eldridge, M.D.B., Lacy, R.C., Ralls, K.,
Dudash, M.R. & Fenster, C.B. (2011) Predicting the probability of out-
breeding depression. Conservation Biology, 25, 465–475.Goswami, V.R., Getz, L.L., Hostetler, J.A., Ozgul, A. & Oli, M.K. (2011)
Synergistic influences of phase, density, and climatic variation on the
dynamics of fluctuating populations. Ecology, 92, 1680–1690.Haag, C.R., Hotinger, J.W., Riex, M. & Ebert, D. (2002) Strong inbreed-
ing depression in a Daphnia metapopulation. Evolution, 56, 518–526.Haridas, C.V. & Tuljapurkar, S. (2005) Elasticities in variable environments:
properties and implications. The American Naturalist, 166, 481–495.Hedrick, P.W. (1995) Gene flow and genetic restoration: the Florida
panther as a case study. Conservation Biology, 9, 996–1007.Henle, K., Sarre, S. & Wiegand, K. (2004) The role of density regulation
in extinction processes and population viability analysis. Biodiversity
and Conservation, 13, 9–52.Heppell, S.S., Caswell, H. & Crowder, L.B. (2000) Life histories and elas-
ticity patterns: perturbation analysis for species with minimal demo-
graphic data. Ecology, 81, 654–665.Hogg, J.T., Forbes, S.H., Steele, B.M. & Luikart, G. (2006) Genetic rescue
of an insular population of large mammals. Proceedings of the Royal
Society B: Biological Sciences, 273, 1491–1499.H€oglund, J., Piertney, S.B., Alatalo, R.V., Lindell, J., Lundberg, A. &
Rintam€aki, P.T. (2002) Inbreeding depression and male fitness in black
grouse. Proceedings of the Royal Society of London. Series B: Biological
Sciences, 269, 711–715.Hostetler, J.A., Onorato, D.P., Nichols, J.D., Johnson, W.E., Roelke, M.
E., O’Brien, S.J., Jansen, D. & Oli, M.K. (2010) Genetic introgression
© 2012 The Authors. Journal of Animal Ecology © 2012 British Ecological Society, Journal of Animal Ecology
Genetic restoration and population persistence 11
and the survival of Florida panther kittens. Biological Conservation,
143, 2789–2796.Hostetler, J.A., Kneip, E., Van Vuren, D.H. & Oli, M.K. (2012a) Stochas-
tic population dynamics of a montane ground-dwelling squirrel. PLoS
ONE, 7, e34379.
Hostetler, J.A., Onorato, D.P., Bolker, B.M., Johnson, W.E., O’Brien, S.
J., Jansen, D. & Oli, M.K. (2012b) Does genetic introgression improve
female reproductive performance? A test on the endangered Florida
panther. Oecologia, 168, 289–300.Ingvarsson, P.K. (2001) Restoration of genetic variation lost–the genetic
rescue hypothesis. Trends in Ecology & Evolution, 16, 62–63.Johnson, W.E., Onorato, D.P., Roelke, M.E., Land, E.D., Cunningham, M.,
Belden, R.C., McBride, R., Jansen, D., Lotz, M., Shindle, D., Howard, J.,
Wildt, D.E., Penfold, L.M., Hostetler, J.A., Oli, M.K. & O’Brien, S.J.
(2010) Genetic restoration of the Florida panther. Science, 329, 1641–1645.Kauffman, M.J., Frick, W.F. & Linthicum, J. (2003) Estimation of habi-
tat-specific demography and population growth for peregrine falcons in
California. Ecological Applications, 13, 1802–1816.Keller, L.F. & Waller, D.M. (2002) Inbreeding effects in wild populations.
Trends in Ecology & Evolution, 17, 230–241.Keller, L.F., Arcese, P., Smith, J.N.M., Hochachka, W.M. & Stearns, S.C.
(1994) Selection against inbred song sparrows during a natural popula-
tion bottleneck. Nature, 372, 356–357.Land, E.D., Garman, D.R. & Holt, G.A. (1998) Monitoring female Flor-
ida panthers via cellular telephone. Wildlife Society Bulletin, 26, 29–31.Land, E.D., Shindle, D.B., Kawula, R.J., Benson, J.F., Lotz, M.A. &
Onorato, D.P. (2008) Florida panther habitat selection analysis of
concurrent GPS and VHF telemetry data. Journal of Wildlife Manage-
ment, 72, 633–639.Leirs, H., Stenseth, N.C., Nichols, J.D., Hines, J.E., Verhagen, R. &
Verheyen, W. (1997) Stochastic seasonality and nonlinear density-
dependent factors regulate population size in an African rodent. Nat-
ure, 389, 176–180.Leslie, P.H. (1945) On the use of matrices in certain population mathemat-
ics. Biometrika, 33, 183–212.Liberg, O., Andr�en, H., Pedersen, H.C., Sand, H., Sejberg, D., Wabakken,
P.,��Akesson, M. & Bensch, S. (2005) Severe inbreeding depression in a
wild wolf Canis lupus population. Biology Letters, 1, 17–20.Lindenmayer, D.B., Possingham, H.P., Lacy, R.C., McCarthy, M.A. &
Pope, M.L. (2003) How accurate are population models? Lessons from
landscape-scale tests in a fragmented system. Ecology Letters, 6, 41–47.Madsen, T., Ujvari, B. & Olsson, M. (2004) Novel genes continue to
enhance population growth in adders (Vipera berus). Biological Conser-
vation, 120, 145–147.Maehr, D.S. & Caddick, G.B. (1995) Demographics and genetic introgres-
sion in the Florida panther. Conservation Biology, 9, 1295–1298.Maehr, D.S., Lacy, R.C., Land, E.D., Bass Jr, O.L. & Hoctor, T.S. (2002)
Evolution of population viability assessments for the Florida panther: a
multiperspective approach. Population Viability Analysis (eds S.R. Beis-
singer & D.R. McCullough), pp. 284–311. University of Chicago Press,
Chicago, Illinois, USA.
Maehr, D.S., Crowley, P., Cox, J.J., Lacki, M.J., Larkin, J.L., Hoctor, T.S.,
Harris, L.D. & Hall, P.M. (2006) Of cats and Haruspices*: genetic
intervention in the Florida panther. Response to Pimm et al. (2006).
Animal Conservation, 9, 127–132.McBride, R.T., McBride, R.T., McBride, R.M. & McBride, C.E. (2008)
Counting pumas by categorizing physical evidence. Southeastern Natu-
ralist, 7, 381–400.McGowan, C.P., Runge, M.C. & Larson, M.A. (2011) Incorporating para-
metric uncertainty into population viability analysis models. Biological
Conservation, 144, 1400–1408.Morris, W.F. & Doak, D.F. (2002) Quantitative Conservation Biology:
Theory and Practice of Population Viability Analysis. Sinauer Associates,
Sunderland, MA, USA.
Morris, W.F. & Doak, D.F. (2005) How general are the determinants of
the stochastic population growth rate across nearby sites? Ecological
Monographs, 75, 119–137.Nieminen, M., Singer, M.C., Fortelius, W., Sch€ops, K. & Hanski, I.
(2001) Experimental confirmation that inbreeding depression increases
extinction risk in butterfly populations. The American Naturalist, 157,
237–244.Onorato, D.P., Belden, R.C., Cunningham, M.W., Land, E.D., McBride,
R.T. & Roelke, M.E. (2010) Long-term research on the Florida panther
(Puma concolor coryi): historical findings and future obstacles to
population persistence. Biology and Conservation of Wild Felids (eds D.
W. MacDonald & A.J. Loveridge), pp. 453–469. Oxford University
Press, Oxford, UK.
Onorato, D.P., Criffield, M., Lotz, M., Cunningham, M., McBride, R.,
Leone, E.H., Bass Jr, O.L. & Hellgren, E.C. (2011) Habitat selection by
critically endangered Florida panthers across the diel period: implica-
tions for land management and conservation. Animal Conservation, 14,
196–205.Ortego, J.I.N., Calabuig, G., Cordero, P.J. & Aparicio, J.M. (2007) Egg
production and individual genetic diversity in lesser kestrels. Molecular
Ecology, 16, 2383–2392.Pimm, S.L., Bass Jr, O.L. & Dollar, L. (2006a) Ockham and Garp. Reply
to Maehr et al.’s (2006) response to Pimm et al. (2006). Animal Conser-
vation, 9, 133–134.Pimm, S.L., Dollar, L. & Bass Jr, O.L. (2006b) The genetic rescue of the
Florida panther. Animal Conservation, 9, 115–122.Reed, D.H. (2010) Albatrosses, eagles and newts, Oh My!: exceptions to
the prevailing paradigm concerning genetic diversity and population
viability? Animal Conservation, 13, 448–457.Reed, D.H., Nicholas, A.C. & Stratton, G.E. (2007) Genetic quality of
individuals impacts population dynamics. Animal Conservation, 10, 275–283.
Roelke, M.E., Martenson, J.S. & O’Brien, S.J. (1993) The consequences of
demographic reduction and genetic depletion in the endangered Florida
panther. Current Biology, 3, 340–350.Root, K. (2004) Florida panther (Puma concolor coryi): Using models to
guide recovery efforts. Species Conservation and Management, Case
Studies (eds H.R. Akc�akaya, M.A. Burgman, O. Kindvall, C.C. Wood,
P. Sjogren-Gulve, J. Hatfield & M.A. McCarthy), pp. 491–504. Oxford
University Press, New York, NY, USA.
Schwartz, M.W. (1999) Choosing the appropriate scale of reserves for
conservation. Annual Review of Ecology and Systematics, 30, 83–108.Seal, U.S. & Lacy, R.C. (1994) A Plan for Genetic Restoration and Man-
agement of the Florida Panther (Felis concolor coryi). Fl. Game and
Fresh Water Fish Commission. Conservation Breeding Specialist
Group, Apple Valley, MN, USA.
Slate, J., Kruuk, L.E.B., Marshall, T.C., Pemberton, J.M. & Clutton-
Brock, T.H. (2000) Inbreeding depression influences lifetime breeding
success in a wild population of red deer (Cervus elaphus). Proceedings of
the Royal Society of London. Series B: Biological Sciences, 267, 1657–1662.
Stahl, J.T. & Oli, M.K. (2006) Relative importance of avian life-history
variables to population growth rate. Ecological Modelling, 198, 23–39.Tallmon, D.A., Luikart, G. & Waples, R.S. (2004) The alluring simplicity
and complex reality of genetic rescue. Trends in Ecology & Evolution,
19, 489–496.Tinker, M.T., Doak, D.F. & Estes, J.A. (2008) Using demography and
movement behavior to predict range expansion of the southern sea
otter. Ecological Applications, 18, 1781–1794.Tuljapurkar, S. (1989) An uncertain life: demography in random environ-
ments. Theoretical Population Biology, 35, 227–294.Tuljapurkar, S., Horvitz, C.C. & Pascarella, J.B. (2003) The many growth
rates and elasticities of populations in random environments. American
Naturalist, 48, 9–502.Vil�a, C., Sundqvist, A.K., Flagstad, Ø., Seddon, J., Kojola, I., Casulli, A.,
Sand, H., Wabakken, P., Ellegren, H., et al. (2003) Rescue of a severely
bottlenecked wolf (Canis lupus) population by a single immigrant. Pro-
ceedings of the Royal Society of London. Series B: Biological Sciences,
270, 91–97.Westemeier, R.L., Brawn, J.D., Simpson, S.A., Esker, T.L., Jansen, R.W.,
Walk, J.W., Kershner, E.L., Bouzat, J.L. & Paige, K.N. (1998) Track-
ing the long-term decline and recovery of an isolated population. Sci-
ence, 282, 1695–1698.White, G.C. (2000) Population viability analysis: data requirements and
essential analyses. Research Techniques in Animal Ecology: Controversies
and Consequences (eds L. Boitani & T.K. Fuller), pp. 288–331. Colum-
bia University Press, New York, NY, USA.
Wisdom, M.J., Mills, L.S. & Doak, D.F. (2000) Life stage simulation
analysis: estimating vital-rate effects on population growth for conserva-
tion. Ecology, 81, 628–641.Zwick, P.D. & Carr, M.H. (2006) Florida 2060: A Population Distribution
Scenario for the State of Florida. 1000 Friends of Florida, Gainesville,
FL, USA.
Received 29 August 2012; accepted 6 November 2012
© 2012 The Authors. Journal of Animal Ecology © 2012 British Ecological Society, Journal of Animal Ecology
12 J. A. Hostetler et al.

Supporting Information
Additional Supporting Information may be found in the online version
of this article.
Appendix S1. Parameter estimation and methodological details.
Appendix S2. Pseudo-code used for estimating probability of
extinction and quasi-extinction.
Appendix S3. Demographic parameters for canonical Florida
panthers.
Appendix S4. Results of additional population viability analysis
scenarios.
© 2012 The Authors. Journal of Animal Ecology © 2012 British Ecological Society, Journal of Animal Ecology
Genetic restoration and population persistence 13