Embed Size (px)
Citation preview

In vivo bone strain and finite element modeling of themandible of Alligator mississippiensisLaura B. Porro,1,2 Keith A. Metzger,3 Jose Iriarte-Diaz1 and Callum F. Ross1
1Department of Organismal Biology and Anatomy, University of Chicago, Chicago, IL, USA2School of Earth Sciences, University of Bristol, Bristol, UK3Department of Science Education, Hofstra North Shore – LIJ School of Medicine, Hempstead, NY, USA
Abstract
Forces experienced during feeding are thought to strongly influence the morphology of the vertebrate
mandible; in vivo strain data are the most direct evidence for deformation of the mandible induced by these
loading regimes. Although many studies have documented bone strains in the mammalian mandible, no
information is available on strain magnitudes, orientations or patterns in the sauropsid lower jaw during
feeding. Furthermore, strain gage experiments record the mechanical response of bone at a few locations, not
across the entire mandible. In this paper, we present bone strain data recorded at various sites on the lower
jaw of Alligator mississippiensis during in vivo feeding experiments. These data are used to understand how
changes in loading regime associated with changes in bite location are related to changes in strain regime on
the working and balancing sides of the mandible. Our results suggest that the working side mandible is bent
dorsoventrally and twisted about its long-axis during biting, and the balancing side experiences primarily
dorsoventral bending. Strain orientations are more variable on the working side than on the balancing side
with changes in bite point and between experiments; the balancing side exhibits higher strain magnitudes. In
the second part of this paper, we use principal strain orientations and magnitudes recorded in vivo to evaluate
a finite element model of the alligator mandible. Our comparison demonstrates that strain orientations and
mandibular deformation predicted by the model closely match in vivo results; however, absolute strain
magnitudes are lower in the finite element model.
Key words: biomechanics; crocodilians; feeding; validation.
Introduction
Understanding the extent towhich combinations of external
forces (loading regimes) acting on the skeleton are associ-
ated with internal stress, strain and deformation regimes is
fundamental in evaluating hypotheses regarding form–
function relationships and is an important objective of biome-
chanics, functional morphology and vertebrate paleontology
(Bock & Von Wahlert, 1965; Plotnick & Baumiller, 2000;
Schwenk, 2000). Moreover, obtaining such data from several
taxa can be used to relate interspecific differences in skeletal
morphology to differences in behavior, habitat or diet.
The vertebrate mandible is an important structure in
which to investigate the association between loading
regime and stress and strain regimes because of its role in
feeding, during which it transmits forces to and from the
organism and environment. Relationships between in vivo
loading regimes, strain regimes and mandibular morphol-
ogy have been examined in numerous mammalian taxa,
including rabbits (Weijs & De Jongh, 1977), pigs (Liu &
Herring, 2000; Herring et al. 2001), hyraxes (Lieberman
et al. 2004), selenodont artiodactyls (Williams et al. 2008,
2009) and primates (Hylander, 1979b, 1981, 1984; Hylander
et al. 1987, 1998), but we know of no published in vivo
bone strain studies examining the sauropsid (Testu-
dines + Squamates + Archosaurs) lower jaw. As a result,
comparative hypotheses regarding the functional signifi-
cance of variation in mandibular morphology across verte-
brates are currently limited (but see Hylander & Crompton,
1986). Additionally, numerous morphological features char-
acteristic of sauropsids, including the presence of mandibu-
lar sutures, a mandibular fenestra, and lack of adductor
musculature lateral to the mandibular ramus, are absent in
mammals, making extrapolation of sauropsid mandibular
function from mammalian studies tenuous (Weishampel,
1995). Documenting in vivo mechanical behavior of the
Alligator mandible is a first step towards understanding
Correspondence
Laura B. Porro, Department of Organismal Biology and Anatomy,
University of Chicago, 1027 East 57th Street, Chicago, IL 60637, USA.
Accepted for publication 13 June 2013
Article published online 15 July 2013
© 2013 Anatomical Society
J. Anat. (2013) 223, pp195--227 doi: 10.1111/joa.12080
Journal of Anatomy
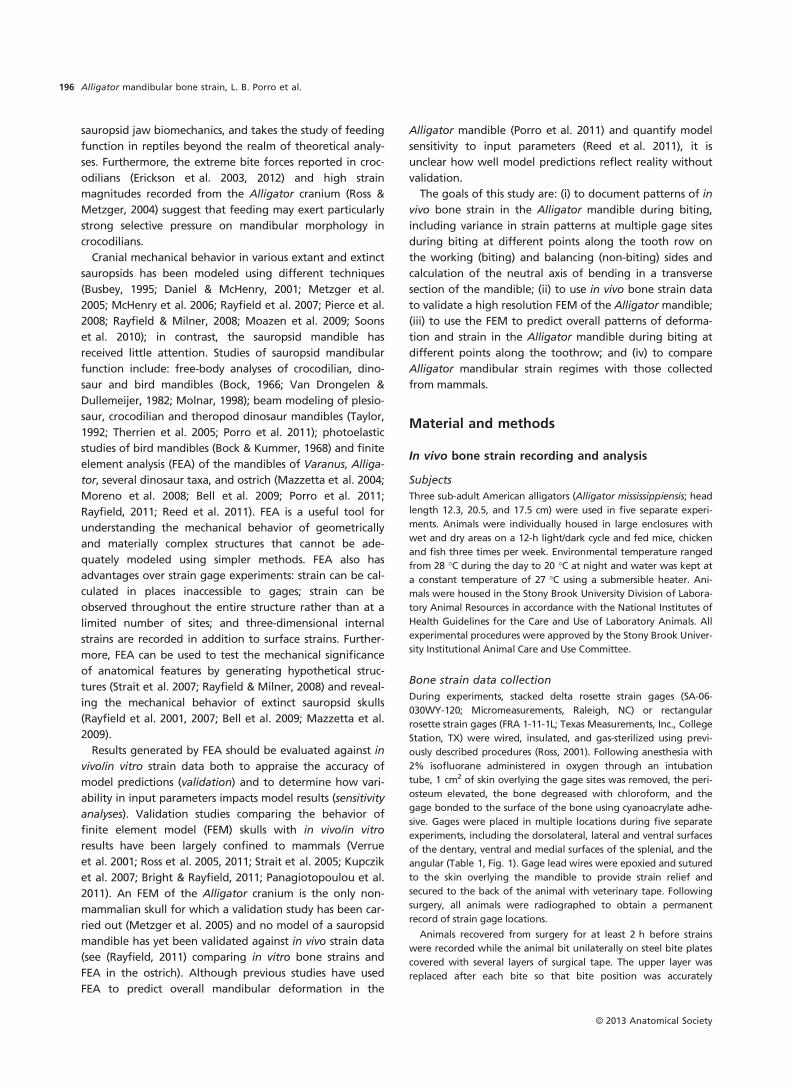
sauropsid jaw biomechanics, and takes the study of feeding
function in reptiles beyond the realm of theoretical analy-
ses. Furthermore, the extreme bite forces reported in croc-
odilians (Erickson et al. 2003, 2012) and high strain
magnitudes recorded from the Alligator cranium (Ross &
Metzger, 2004) suggest that feeding may exert particularly
strong selective pressure on mandibular morphology in
crocodilians.
Cranial mechanical behavior in various extant and extinct
sauropsids has been modeled using different techniques
(Busbey, 1995; Daniel & McHenry, 2001; Metzger et al.
2005; McHenry et al. 2006; Rayfield et al. 2007; Pierce et al.
2008; Rayfield & Milner, 2008; Moazen et al. 2009; Soons
et al. 2010); in contrast, the sauropsid mandible has
received little attention. Studies of sauropsid mandibular
function include: free-body analyses of crocodilian, dino-
saur and bird mandibles (Bock, 1966; Van Drongelen &
Dullemeijer, 1982; Molnar, 1998); beam modeling of plesio-
saur, crocodilian and theropod dinosaur mandibles (Taylor,
1992; Therrien et al. 2005; Porro et al. 2011); photoelastic
studies of bird mandibles (Bock & Kummer, 1968) and finite
element analysis (FEA) of the mandibles of Varanus, Alliga-
tor, several dinosaur taxa, and ostrich (Mazzetta et al. 2004;
Moreno et al. 2008; Bell et al. 2009; Porro et al. 2011;
Rayfield, 2011; Reed et al. 2011). FEA is a useful tool for
understanding the mechanical behavior of geometrically
and materially complex structures that cannot be ade-
quately modeled using simpler methods. FEA also has
advantages over strain gage experiments: strain can be cal-
culated in places inaccessible to gages; strain can be
observed throughout the entire structure rather than at a
limited number of sites; and three-dimensional internal
strains are recorded in addition to surface strains. Further-
more, FEA can be used to test the mechanical significance
of anatomical features by generating hypothetical struc-
tures (Strait et al. 2007; Rayfield & Milner, 2008) and reveal-
ing the mechanical behavior of extinct sauropsid skulls
(Rayfield et al. 2001, 2007; Bell et al. 2009; Mazzetta et al.
2009).
Results generated by FEA should be evaluated against in
vivo/in vitro strain data both to appraise the accuracy of
model predictions (validation) and to determine how vari-
ability in input parameters impacts model results (sensitivity
analyses). Validation studies comparing the behavior of
finite element model (FEM) skulls with in vivo/in vitro
results have been largely confined to mammals (Verrue
et al. 2001; Ross et al. 2005, 2011; Strait et al. 2005; Kupczik
et al. 2007; Bright & Rayfield, 2011; Panagiotopoulou et al.
2011). An FEM of the Alligator cranium is the only non-
mammalian skull for which a validation study has been car-
ried out (Metzger et al. 2005) and no model of a sauropsid
mandible has yet been validated against in vivo strain data
(see (Rayfield, 2011) comparing in vitro bone strains and
FEA in the ostrich). Although previous studies have used
FEA to predict overall mandibular deformation in the
Alligator mandible (Porro et al. 2011) and quantify model
sensitivity to input parameters (Reed et al. 2011), it is
unclear how well model predictions reflect reality without
validation.
The goals of this study are: (i) to document patterns of in
vivo bone strain in the Alligator mandible during biting,
including variance in strain patterns at multiple gage sites
during biting at different points along the tooth row on
the working (biting) and balancing (non-biting) sides and
calculation of the neutral axis of bending in a transverse
section of the mandible; (ii) to use in vivo bone strain data
to validate a high resolution FEM of the Alligator mandible;
(iii) to use the FEM to predict overall patterns of deforma-
tion and strain in the Alligator mandible during biting at
different points along the toothrow; and (iv) to compare
Alligator mandibular strain regimes with those collected
from mammals.
Material and methods
In vivo bone strain recording and analysis
Subjects
Three sub-adult American alligators (Alligator mississippiensis; head
length 12.3, 20.5, and 17.5 cm) were used in five separate experi-
ments. Animals were individually housed in large enclosures with
wet and dry areas on a 12-h light/dark cycle and fed mice, chicken
and fish three times per week. Environmental temperature ranged
from 28 °C during the day to 20 °C at night and water was kept at
a constant temperature of 27 °C using a submersible heater. Ani-
mals were housed in the Stony Brook University Division of Labora-
tory Animal Resources in accordance with the National Institutes of
Health Guidelines for the Care and Use of Laboratory Animals. All
experimental procedures were approved by the Stony Brook Univer-
sity Institutional Animal Care and Use Committee.
Bone strain data collection
During experiments, stacked delta rosette strain gages (SA-06-
030WY-120; Micromeasurements, Raleigh, NC) or rectangular
rosette strain gages (FRA 1-11-1L; Texas Measurements, Inc., College
Station, TX) were wired, insulated, and gas-sterilized using previ-
ously described procedures (Ross, 2001). Following anesthesia with
2% isofluorane administered in oxygen through an intubation
tube, 1 cm2 of skin overlying the gage sites was removed, the peri-
osteum elevated, the bone degreased with chloroform, and the
gage bonded to the surface of the bone using cyanoacrylate adhe-
sive. Gages were placed in multiple locations during five separate
experiments, including the dorsolateral, lateral and ventral surfaces
of the dentary, ventral and medial surfaces of the splenial, and the
angular (Table 1, Fig. 1). Gage lead wires were epoxied and sutured
to the skin overlying the mandible to provide strain relief and
secured to the back of the animal with veterinary tape. Following
surgery, all animals were radiographed to obtain a permanent
record of strain gage locations.
Animals recovered from surgery for at least 2 h before strains
were recorded while the animal bit unilaterally on steel bite plates
covered with several layers of surgical tape. The upper layer was
replaced after each bite so that bite position was accurately
© 2013 Anatomical Society
Alligator mandibular bone strain, L. B. Porro et al.196

recorded using tooth impressions. To investigate variance in strain
patterns with changes in bite point, the location of each recorded
bite was assigned to one of 10 equal-sized regions of the mandible:
left or right anterior, anterior/middle, middle, middle/posterior, and
posterior regions (Fig. 1) (additionally, strains were recorded during
biting at the midline anterior end of the jaws; results for these bites
are presented in Tables 2–6 but not discussed). Biting side and loca-
tion as well as the presence of any unusual activity (shake,
attempted twisting) were recorded on a data sheet; data from
these activities were excluded from the present study.
Voltage changes in the gages were conditioned and amplified on
Vishay 2100 bridge-amplifiers. Data were acquired at 1 kHz through
a National Instruments DAQ board run by MIDAS data acquisition
software package (Xcitex, Cambridge, MA) and saved to a PC.
In vivo bone strain data analysis
In vivo strain data were filtered and processed in IGOR PRO 4.0 (Wave-
Metrics, Inc., Lake Oswego, OR) using custom-written software. The
strain data (strain is a dimensionless unit, e, that represents change
in length over original length or DL/L) were converted to micro-
strain (le, which are equal to 1 9 10�6 inches per inch or mm per
mm) using calibration files produced during the recording sessions.
The magnitude of maximum (e1) and minimum (e2) principal strains
were calculated (Hibbeler, 2000) (Tables 2–6). Maximum principal
strain (e1) is usually the largest tensile strain value, and the mini-
mum principal strain is usually the largest compressive strain value
(e2). The ratios of maximum to minimum principal strains (|e1/e2|)
were calculated (Tables 2–6) as was shear strain (c), which is equal
to |e1–e2|. The orientations of the maximum principal strains (e1)
were also calculated (Tables 2–6). For consistency, e1 orientations
for in vivo experiments and the FEM (as presented in tables and vec-
tor plots, as well as those used in statistical analyses) are calculated
for a right mandible. The orientation of e1 in lateral, medial and
ventral views were calculated relative to a reference axis aligned
between the most anterior point of the external mandibular fenes-
tra to the posterior base of the sixth dentary tooth; the reference
plane was defined by this axis and another line parallel to either
the ventral (for medial and lateral views) or medial (for ventral
view) border of the mandible (Fig. 1). Converting strain orientations
to this common reference axis enables comparisons between differ-
ent experiments and between in vivo and FEM data. By convention,
positive values are those rotated counterclockwise from the refer-
ence axis (vectors rotated clockwise from the axis are negative)
when viewed from the right (for medial and lateral views) or from
below (for ventral view). Custom software in IGOR PRO 4.0 was used
to convert strain orientations and magnitudes to vectors within
polar coordinates. Vector plots (Figs 2 and 3), in which the relative
magnitudes and orientations of e1 for all gage sites during all
recorded bites are displayed, were created using ADOBE ILLUSTRATOR CS
5.1 (Adobe System Incorporated, San Jose, CA).
Data from experiments in which three gages were placed around
the circumference of the lower jaw allow normal strain distribution
to be reconstructed at the section of the gages. From this distribu-
tion, maximum and minimum normal strains for the cross-section
can be calculated (Rybicki et al. 1977; Demes et al. 2001; Demes,
2007). This gives an indication of the maximum tensile and com-
pressive strains experienced in the section and allows the orienta-
tion of the neutral axis within the cross-section to be determined.
The orientation of the neutral axis was calculated using data from
four experiments (75, 99, 102 and 103) in which there were three or
more gages placed around the circumference of the mandible in a
coronal plane. To calculate the orientation of the neutral axis of
bending, normal strains (strains normal to the plane of the cross-
section) were calculated from peak principal strains recorded during
each bite. Orientation of the neutral axis is reliant upon both nor-
mal strains and bone cross-sectional geometry (Rybicki et al. 1977;
Carter et al. 1981; Demes, 2007). The orientation of the neutral axis
was determined using the formula:
tan ¼ a ¼ Imax=Iminð Þ= tan h ð1Þ
where a = angle of the neutral axis with maximum principal axis,
h = angle of external bending direction with maximum principal
axis, and Imax, min = maximum and minimum principal moments of
cross-section (Hibbeler, 2000). Cross-sectional geometry of the man-
dible was determined from postmortem CT scans of the specimens.
Normal strains were calculated assuming that material properties
are homogeneous through the cross-section and that sutures do
not dissipate or reorient strains. Calculations of normal strains and
neutral axis were conducted using a custom macro for IGOR PRO
provided by B. Demes, Stony Brook University.
Finite element analysis
Model construction
Strain data collected in vivo were compared with predictions from a
high-resolution FEM of the Alligator mandible; additionally, the
FEM was used to relate the in vivo strain data to global strain pat-
terns and deformation throughout the Alligator mandible. The
FEM described here has been used previously to understand the
Table 1 Experimental summary including strain gage locations by
experiment. For gages with nearly identical placement in different
experiments, only one site was analyzed in the FEM.
Experiment
ID number
Animal
ID
Mandible
side Gage location
FEM gage
ID number
56 1 Right Anterior ventral
dentary
1
Posterior ventral
dentary
2
Ventral angular 3
75 1 Left Lateral dentary 4
Ventral dentary 5
Medial splenial 6
99 2 Right Dorsolateral
dentary
7
Lateral dentary 4
Ventral dentary 5
Medial splenial 6
102 3 Left Dorsolateral
dentary
8
Lateral dentary 9
Ventral dentary 10
Ventral splenial 11
Medial splenial 12
103 3 Right Dorsolateral
dentary
7
Lateral dentary 13
Ventral dentary 1
Medial splenial 14
© 2013 Anatomical Society
Alligator mandibular bone strain, L. B. Porro et al. 197
impact of material properties on mandible deformation (Reed et al.
2011) and has been compared with results from simpler beam mod-
eling and free-body analyses (Porro et al. 2011).
The preserved head (mandibular length of 189 mm) of one of
the individuals used in our experiments was CT scanned at Stony
Brook University Medical Center using a GE LightSpeed 16 CT scan-
ner at 100 kV per 70 mA to produce 645 coronal slices with a slice
thickness of 0.31 mm and a resolution of 0.25 mm per pixel. Scans
were segmented in AMIRA 5.2.2 (Visage Imaging GmbH, Berlin,
Germany) to generate a 3D surface model in which individual man-
dibular bones, sutures, periodontal ligament, and teeth were trea-
ted as separate parts; the cranium, including all bones and teeth,
was segmented as a single part. The surface model was meshed
with linear tetrahedra in the finite element software package
STRAND7 2.4.1 (Strand7 Pty Ltd, Sydney, Australia) and the jaws of the
model set at a gape angle of 30°.
The attachment sites of 16 jaw elevator muscles (the superficial,
medial and deep portions of the external adductor; superficial and
deep pseudotemporalis; posterior adductor; and dorsal and ventral
portions of the pterygoideus on both sides of the head), and
depressor mandibulae, were mapped onto the skull using informa-
tion from dissections and the literature (Holliday & Witmer, 2007).
The reduced physiological cross-sectional area (PCSA), accounting
for muscle mass, pinnation, and fiber and sarcomere lengths, was
determined for each muscle (Porro et al. 2011); reduced PCSA was
multiplied by 300 kN m�2 to yield the maximum contractile force
generated by each muscle (Sinclair & Alexander, 1987). Muscle
forces were loaded onto the FEM using the VISUAL BASIC script BONELOAD
(Grosse et al. 2007) which accounts for tensile, tangential and nor-
mal traction loads due to muscles wrapping around bone surfaces.
The model was constrained at three nodes aligned mediolaterally
across the joint surfaces of the quadrates (cranium) and articulars
(mandible), preventing rigid body motion and generating joint
reaction forces. Additionally, the tip of a single right dentary tooth
(and its closest opposing premaxillary or maxillary tooth) was fixed
to generate bite force. Five loading conditions were analyzed: ante-
rior (3rd tooth), anterior-middle (7th tooth), middle (12th tooth),
middle-posterior (14th tooth), and posterior (19th tooth) bite
points, corresponding to similar areas in in vivo experiments. In all
cases, the right side of the FEM was the working side and the left
side was the balancing side. A single node was constrained on the
medial surface of each mandible (opposite its contact with the pter-
ygoid flange) to restrict medial bending and torsion of the mandib-
ular ramus (the importance of this constraint is described in Porro
et al. 2011).
Alligator mandibular bone properties applied to the FEM were
obtained from an individual similar in size to the animals used in
our experiment (Zapata et al. 2010; Porro et al. 2011). Mandibular
sutures and periodontal ligament were assigned a density and Pois-
son’s ratio reflecting the average reported in the literature (Currey,
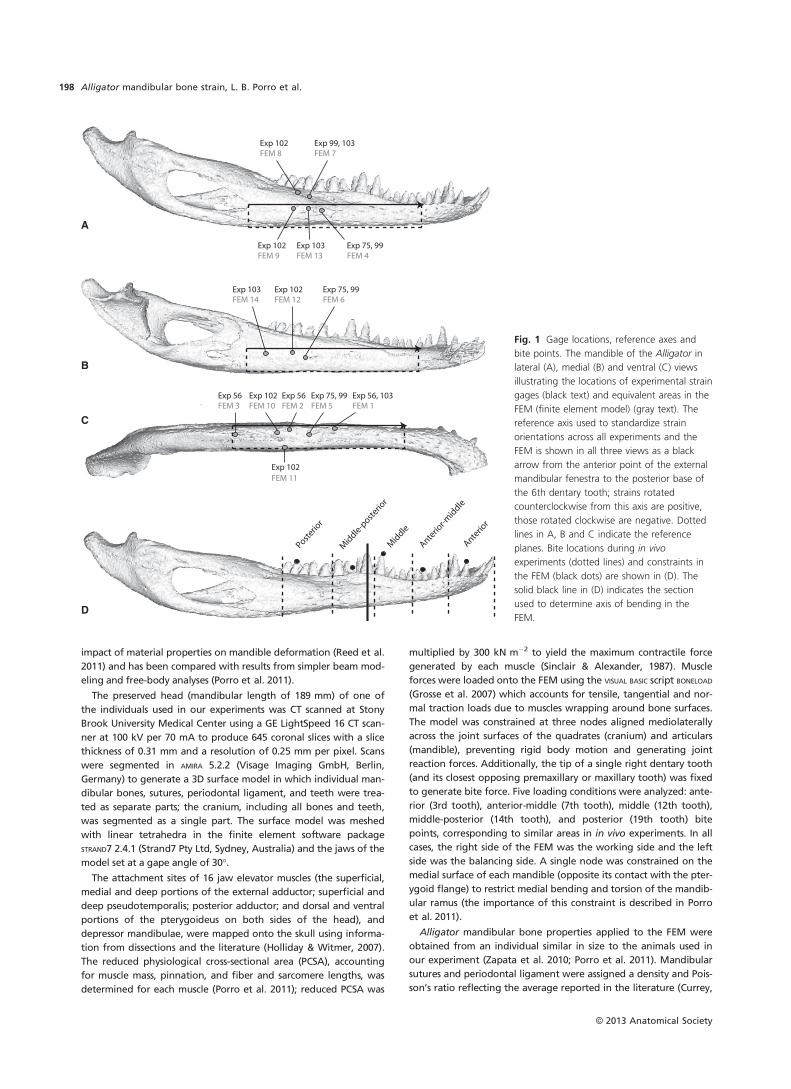
Fig. 1 Gage locations, reference axes and
bite points. The mandible of the Alligator in
lateral (A), medial (B) and ventral (C) views
illustrating the locations of experimental strain
gages (black text) and equivalent areas in the
FEM (finite element model) (gray text). The
reference axis used to standardize strain
orientations across all experiments and the
FEM is shown in all three views as a black
arrow from the anterior point of the external
mandibular fenestra to the posterior base of
the 6th dentary tooth; strains rotated
counterclockwise from this axis are positive,
those rotated clockwise are negative. Dotted
lines in A, B and C indicate the reference
planes. Bite locations during in vivo
experiments (dotted lines) and constraints in
the FEM (black dots) are shown in (D). The
solid black line in (D) indicates the section
used to determine axis of bending in the
FEM.
© 2013 Anatomical Society
Alligator mandibular bone strain, L. B. Porro et al.198

2002; Kupczik et al. 2007). Material properties for bone were
anisotropic: X refers to the mediolateral axis, Y to the dorsoventral
axis, and Z to the anteroposterior axis of the mandible. The follow-
ing properties were applied to the model: bone [density of
1662.8 kg m�3; elastic moduli of 8.1 GPA (X), 9.26 GPA (Y) and
19.71 GPA (Z); shear moduli of 3.17 GPA (XY), 4.45 GPA (XZ), and
5.51 GPA (YZ); Poisson’s ratios of 0.38 (XY), 0.08 (XZ), and 0.15
(YZ)]; teeth (density of 2076 kg m�3; elastic modulus of 21 GPA;
Poisson’s ratio of 0.31); sutures and periodontal ligament (density
of 1200 kg m�3; elastic modulus of 0.09 GPA; Poisson’s ratio of
0.3). The FEM was solved using the linear static solver in STRAND7.
In silico strain data extraction
Prior to analysis, bricks on the surface of the FEM most closely
corresponding to gage sites in the experiments were identified on
both the working (right) and balancing (left) sides. The three-
dimensional 2nd-order strain tensor of each brick within these sites
were exported from STRAND7 to MATLAB (MathWorks, Nantick, MA)
where custom-written code (Ross et al. 2011) was used to calculate
the magnitude and orientation of the maximum and minimum
principal surface strains in the FEM (Table 7). The orientations of
the e1 surface strains were transformed relative to the reference axis
described above using MATLAB, and strain orientations and magni-
tudes converted to vectors within polar coordinates in IGOR PRO 4.0,
making e1 orientations from the FEM and in vivo experiments
directly comparable (Table 7). Vectors representing the mean e1 ori-
entation of all bricks within a gage site during anterior and poster-
ior biting are superimposed over in vivo data in vector plots (Figs 2
and 3). Additionally, the ratio of maximum to minimum principal
strains (|e1/e2|) and maximum shear strain (c-max) were calculated
for FEM gage sites.
To determine the neutral axis of bending in the FEM, cross-
sections of the working and balancing sides at the level of the 13th
dentary tooth were analyzed for strain perpendicular to the section.
For each bite point, contour plots were used to determine the
orientation of the neutral axis and the maximum and minimum
principal strains within the section.
In vivo and FEM bone strain data statistical analyses
To quantify the effect of bite point on strain in the mandible, data
were split into the 10 toothrow regions described above. On all
data tables for in vivo experiments (Tables 2–6), missing data indi-
cate that no strains were recorded for a particular bite position.
Table 2 Descriptive statistics for principal (e1 and e2) and |(e1/e2)| strain magnitude and e1 orientation for Experiment 56.
Gauge
location Bite side
Bite
position n
e1 e2 e1/e2 ratio
e1orientation
Mean SD Max. Mean SD Max. Mean SD Mean SD
Right
ventral
angular
Left (BS) a 4 71 45 122 �120 49 �148 0.61 0.27 113 33
p 5 56 21 88 �129 41 �183 0.48 0.25 101 28
All left 9 63 34 122 �125 42 �183 0.54 0.25 107 28
Right (WS) a/m 2 35 31 57 �205 158 �317 0.16 0.03 66 3
m 4 15 10 26 �178 27 �202 0.08 0.06 73 13
m/p 1 3 3 �273 0.01 72
p 6 14 4 20 �206 61 �314 0.07 0.03 66 6
All right 13 17 14 57 �202 67 �314 0.09 0.05 69 9
All bites 22 34 31 122 �163 70 �317 0.27 0.27 85 27
Right
anterior
dentary
Midline 2 426 193 563 �648 354 �899 0.68 0.07 110 7
Left (BS) a 4 779 291 1003 �1076 476 �1487 0.75 0.09 �1 1
p 6 457 149 703 �568 230 �962 0.82 0.05 6 4
All left 10 600 257 1003 �794 403 �1487 0.79 0.07 3 4
Right (WS) a/m 2 782 117 865 �570 53 �608 1.37 0.08 �25 2
m 4 816 319 1244 �908 426 �1427 0.94 0.13 �40 11
m/p 1 952 952 �819 �819 1.16 �29
p 6 543 165 830 �443 156 �744 1.24 0.17 �21 3
All right 13 695 247 1244 �634 320 �1427 1.16 0.21 �28 10
All bites 22 637 254 1244 �695 359 �1487 0.98 0.26 0 53
Right
posterior
dentary
Midline 2 37 28 56 �81 12 �89 0.43 0.28 �33 8
Left (BS) a 4 125 45 182 �77 29 �105 1.65 0.16 12 6
p 6 118 30 142 �95 29 �140 1.36 0.51 20 24
All left 10 121 47 182 �87 26 �140 1.49 0.4 17 19
Right (WS) a/m 2 54 16 65 �47 30 �68 1.57 1.33 �12 14
m 4 176 61 218 �209 73 �281 0.84 0.09 �27 2
m/p 1 139 �226 �226 0.62 �25
p 6 159 62 238 �229 118 �318 0.76 0.15 �29 1
All right 13 147 66 238 �195 107 �318 0.9 0.5 �26 8
All bites 22 128 61 238 �145 97 �318 1.08 0.56 �13 54
a, anterior; a/m, anterior/middle; m, middle; m/p, middle/posterior; p, posterior.
© 2013 Anatomical Society
Alligator mandibular bone strain, L. B. Porro et al. 199

Principal strain orientations are axial circular data in which an e1orientation of 0° is equal to 180° and the zero point is arbitrary.
These data cannot be analyzed using traditional statistical methods.
Quantitative analyses of in vivo principal strain data were per-
formed in ORIANA 3.13 (Kovach Computing Services, Anglesey, UK;
www.kovcomp.com). To conduct these analyses, all angle data were
converted to positive values, thus �30° was converted to 330°.
Additionally, ORIANA converts all axial data to values between 0 and
180°. Readers are urged to note these changes when comparing
descriptive statistics from Tables 2–7 to circular statistics from
Tables 8–10.
Descriptive circular statistics (Tables 8–10) were calculated for e1orientations at each gage site, with data grouped according to
broad regions of the mandible (i.e. lateral, medial or ventral
surfaces) and whether bites were ipsilateral or contralateral to the
gage site (yielding working- and balancing-side bites). The statistics
presented here include: the mean angle of the vectors (l) relative
to the reference axis describe above; length of the mean vector (r),
ranging from 0 to 1, which is a measure of angular dispersion with
values closer to 1 indicating that individual observations are
clustered more closely around the mean; the concentration (k),
which measures the departure of the distribution from a uniform
distribution (or perfect circle); circular variance (V), which is calcu-
lated as V = 1 � r and is equivalent to its linear counterpart; the cir-
cular standard deviation (S), calculated as S = [�2ln(2)]1/2; the
standard error of the mean; and the 95 and 99% confidence inter-
vals derived from standard error. Additionally, Rayleigh’s test of
uniformity and Watson’s U2 test were used to determine whether
data are derived from a von Mises distribution (continuous proba-
bility distribution on a circle, not to be confused with von Mises
stress). A more detailed review of circular statistics can be found in
Zar (1999).
Table 3 Descriptive statistics for principal (e1 and e2) and |(e1/e2)| strain magnitude and e1 orientation for experiment 75.
Gauge
location Bite side
Bite
position n
e1 e2 e1/e2 Ratio
e1Orientation
Mean SD Max Mean SD Max Mean SD Mean SD
Left
lateral
dentary
Left (WS) a/m 4 1098 420 1434 �1131 449 �1389 0.98 0.08 �37 6
m 6 530 271 848 �387 321 �961 1.66 0.44 �29 12
m/p 12 1379 976 2846 �976 786 �2006 1.88 0.85 �35 9
p 8 1006 382 1386 �615 283 �1003 1.79 0.45 �41 8
All left 30 1073 727 2846 �783 604 �2006 1.69 0.67 �36 9
Right (BS) a 4 648 90 731 �453 58 �492 1.43 0.04 31 2
a/m 3 1328 203 1543 �983 179 �1172 1.36 0.04 33 1
m 19 1492 290 1868 �1157 248 �1481 1.3 0.04 34 1
m/p 7 946 508 1728 �714 427 �1388 1.37 0.12 33 3
p 15 1191 446 1714 �893 352 �1325 1.35 0.07 32 2
All right 48 1238 443 1868 �941 365 �1481 1.34 0.07 33 2
All bites 78 1174 571 2846 �880 474 �2006 1.48 0.45 2 34
Left
ventral
dentary
Left (WS) a/m 4 924 488 1382 �1362 470 �1632 0.63 0.22 �51 3
m 6 623 347 1118 �420 388 �1098 2.26 1.04 �37 10
m/p 12 1930 1261 4016 �1225 888 �2714 1.9 0.59 �29 7
p 6 2639 1027 3538 �1569 687 �2133 1.76 0.24 �21 1
All left 30 1723 1221 4016 �1174 793 �2713 1.76 0.75 �32 11
Right (BS) a 4 839 135 976 �1181 213 �1419 0.71 0.02 67 2
a/m 3 1759 300 2064 �2404 399 �2791 0.73 0.01 61 0
m 19 2017 476 2530 �2757 644 �3405 0.73 0.01 61 1
m/p 7 1216 742 2311 �1661 1015 �3113 0.74 0.02 61 1
p 15 1584 650 2379 �2204 908 �3307 0.72 0.02 62 0
All right 48 1651 655 2530 �2271 894 �3405 0.73 0.01 62 1
All bites 78 1679 908 4016 �1849 1007 �3405 1.13 0.69 19 43
Left
medial
splenial
Left (WS) a/m 4 336 181 532 �724 422 �1131 0.48 0.04 110 4
m 6 198 85 264 �410 186 �595 0.5 0.08 113 2
m/p 12 242 132 454 �541 302 �949 0.47 0.07 115 3
p 8 252 52 332 �552 130 �708 0.46 0.06 113 2
All left 30 249 116 532 �542 267 �1131 0.47 0.07 114 3
Right (BS) a 4 112 26 139 �199 50 �246 0.57 0.04 113 2
a/m 3 96 29 127 �182 58 �243 0.53 0.01 112 1
m 19 112 32 196 �179 47 �243 0.68 0.35 103 25
m/p 7 119 60 232 �243 133 �496 0.5 0.07 112 1
p 15 156 89 423 �278 155 �735 0.57 0.07 111 2
All right 48 126 61 423 �221 112 �735 0.6 0.23 109 16
All bites 78 173 105 532 �345 243 �1131 0.55 0.19 111 13
a, anterior; a/m, anterior/middle; m, middle; m/p, middle/posterior; p. posterior.
© 2013 Anatomical Society
Alligator mandibular bone strain, L. B. Porro et al.200

To determine whether working and balancing sides strain
regimes differ, principal strain orientations recorded within the
same gage during ipsilateral vs. contralateral biting were com-
pared using a nonparametric Mardia–Watson–Wheeler test (for
data that did not match a von Mises distribution) or a parametric
Watson–Williams F-test (when data matched a von Mises distribu-
tion). These tests determine whether two or more distributions are
identical; significant differences between distributions lead to a
large W statistic and low probability of distributions being identi-
cal. To determine whether strain orientation changed as load mag-
nitude increased, circular-linear correlation coefficients were
calculated between e1 orientation and magnitude (Zar, 1999).
Table 4 Descriptive statistics for principal (e1 and e2) and |(e1/e2)| strain magnitude and e1 orientation for experiment 99.
Gauge
location Bite side
Bite
position n
e1 e2 e1/e2 Ratio
e1Orientation
Mean SD Max Mean SD Max Mean SD Mean SD
Right
dorsolateral
dentary
Midline 6 188 83 342 �149 73 �284 1.31 0.39 �2 7
Left (BS) m 2 272 3 274 �201 1 �202 1.35 0.01 20 0
p 1 137 137 �157 �157 0.87 �26
All left 3 227 78 342 �186 �26 �202 1.19 0.27 4 27
Right (WS) a/m 2 797 583 1210 �618 638 �1069 1.72 0.82 �25 21
m 7 365 375 1188 �145 185 �554 3.1 0.86 �18 14
m/p 2 52 9 58 �2 1 �2 54.33 20.53 �22 1
p 9 382 399 1415 �199 212 �722 2.26 0.8 �32 29
All right 20 384 399 1415 �202 274 �1069 7.71 19.73 �25 22
All bites 29 327 342 1415 �190 229 �1069 5071 16.54 �18 23
Right
lateral
dentary
Midline 6 608 185 966 �589 157 �892 1.02 0.05 16 25
Left (BS) a 1 1072 1072 �894 �894 1.2 31
m 3 1364 288 1630 �1106 209 �1299 1.23 0.03 30 0
m/p 4 572 70 676 �444 60 �531 1.29 0.02 29 1
p 2 756 172 877 �594 145 �697 1.27 0.02 27 2
All left 10 897 388 1072 �718 322 �1299 1.26 0.04 29 2
Right (WS) a/m 2 1381 60 1424 �1531 30 �1553 0.9 0.02 �47 1
m 7 1229 578 2226 �1192 490 �1779 1.02 0.18 �45 3
m/p 2 409 110 487 �250 116 �332 1.72 0.36 �45 0
p 9 944 316 1436 �606 199 �986 1.63 0.63 �50 6
All right 20 1034 469 2226 �868 501 �1779 1.35 0.54 �48 5
All bites 36 925 433 2226 �780 422 �1779 1.27 0.42 �6 55
Right
ventral
dentary
Midline 6 1072 218 1423 �1938 385 �2463 0.55 0.03 97 6
Left (BS) a 1 1046 1046 �1712 �1712 0.61 90
m 3 1313 277 1560 �2132 459 �2537 0.62 0 90 0
m/p 4 509 66 604 �813 118 �985 0.63 0.01 90 1
p 2 832 462 1158 �1453 849 �2053 0.58 0.02 93 4
All left 10 869 411 1560 �1427 689 �2537 0.61 0.02 91 2
Right (WS) a/m 2 960 180 1087 �1711 626 �2153 0.58 0.11 �50 7
m 7 754 295 1251 �807 320 �1230 1 0.35 �32 16
m/p 2 428 82 486 �187 43 �217 2.31 0.09 �2 1
p 9 1922 685 2987 �971 336 �1470 1.97 0.1 4 2
All right 20 1268 782 2987 �909 478 �2153 1.53 0.63 �15 23
All bites 36 1124 643 2987 �1224 650 �2537 1.11 0.66 33 57
Right
medial
splenial
Midline 6 765 131 967 �1398 280 �1847 0.55 0.02 53 6
Left (BS) a 1 754 754 �1567 �1567 0.48 �43
m 3 920 142 1066 �2139 512 �2606 0.44 0.05 �43 1
m/p 4 307 61 390 �709 114 �880 0.43 0.04 �47 1
p 2 632 261 816 �1366 711 �1868 0.48 0.06 �46 3
All left 10 601 297 1066 �1355 717 �2606 0.45 0.04 �45 2
Right (WS) a/m 2 678 483 1019 �1084 686 �1569 0.61 0.06 �80 2
m 7 386 255 876 �554 255 �1032 0.66 0.13 �70 19
m/p 2 183 36 209 �272 33 �295 0.67 0.05 �37 1
p 9 518 468 1693 �547 269 �1181 0.84 0.28 35 32
All right 20 455 376 1693 �575 337 �1569 0.74 0.22 �38 57
All bites 36 547 340 1693 �929 605 �2606 0.63 0.21 �31 45
a, anterior; a/m, anterior/middle; m, middle; m/p, middle/posterior; p, posterior.
© 2013 Anatomical Society
Alligator mandibular bone strain, L. B. Porro et al. 201

Table 5 Descriptive statistics for principal (e1 and e2) and |(e1/e2)| strain magnitude and e1 orientation for experiment 102.
Gauge
location Bite side
Bite
position n
e1 e2 e1/e2 Ratio
e1Orientation
Mean SD Max Mean SD Max Mean SD Mean SD
Left
dorsolateral
dentary
Left (WS) a/m 3 916 470 1450 �560 352 �960 1.71 0.19 �19 5
m 12 1311 590 2256 �753 335 �1202 1.76 0.14 �23 6
m/p 2 1290 763 1830 �596 383 �867 2.21 0.14 �26 4
p 5 1264 570 2244 �565 267 �889 2.39 0.63 �79 12
All left 22 1245 558 2256 �670 316 �1202 1.94 0.42 �35 25
Right (BS) m 5 1056 254 1414 �1127 263 �1472 0.94 0.03 27 2
m/p 4 1158 413 1642 �1203 419 �1678 0.96 0.04 24 2
p 5 1372 539 1777 �1379 581 �1742 1.03 0.1 23 2
All right 14 1198 410 1777 �1239 422 �1742 0.98 0.07 24 2
All bites 36 1227 500 2256 �891 453 �1742 1.56 0.58 �10 35
Left
lateral
dentary
Midline 3 844 183 985 �973 151 �1078 0.86 0.06 �39 1
Left (WS) a 2 337 70 426 �509 133 �603 0.75 0.06 �35 2
a/m 9 860 246 1207 �876 293 �1338 1.01 0.15 �39 1
m 19 1482 696 2728 �1301 636 �2142 1.16 0.13 �38 9
m/p 6 1231 728 2589 �829 645 �1801 2.15 1.83 �38 4
p 11 1174 488 2312 �183 198 �629 11.08 8.68 �47 18
All left 47 1212 628 2728 �864 650 �2142 3.4 5.69 �40 11
Right (BS) a 2 836 48 870 �851 24 �868 0.98 0.03 40 0
a/m 2 1308 159 1420 �1343 202 �1486 0.98 0.03 40 1
m 8 1457 223 1694 �1525 248 �1800 0.96 0.01 37 1
m/p 11 1232 389 1855 �1279 449 �2027 0.98 0.07 36 1
p 13 1336 465 1901 �1413 541 �2072 0.97 0.08 36 2
All right 36 1302 385 1901 �1362 442 �2072 0.97 0.06 36 2
All bites 83 1227 532 2728 �1071 608 �2142 2.25 4.34 �4 39
Left
ventral
dentary
Midline 3 590 24 618 �1066 105 �1142 0.56 0.05 60 1
Left (WS) a 2 390 45 422 �383 69 �432 1.03 0.07 �39 1
a/m 9 296 68 368 �316 60 �454 0.96 0.24 �39 12
m 19 291 95 413 �420 136 �787 0.72 0.23 �37 13
m/p 6 188 53 282 �377 119 �558 0.56 0.28 �57 22
p 11 540 391 1641 �569 375 �1266 1.11 0.56 �81 42
All left 47 341 228 1641 �428 219 �1266 0.85 0.38 �50 29
Right (BS) a 2 330 101 401 �747 98 �816 0.44 0.08 �62 2
a/m 2 511 174 633 �1127 371 �1390 0.45 0.01 �63 0
m 8 659 113 829 �1488 281 �1935 0.44 0.02 �68 3
m/p 11 547 210 924 �1344 545 �2326 0.41 0.03 �65 3
p 12 598 248 989 �1470 648 �2527 0.41 0.03 �66 3
All right 35 576 206 989 �1374 526 �2527 0.42 0.03 �66 3
All bites 82 445 244 1641 �839 595 �2527 0.66 0.35 �47 23
Left
ventral
splenial
Midline 1 723 723 �1900 �1900 0.38 89
Left (WS) a 2 638 237 805 �1527 531 �1902 0.42 0.01 �82 23
a/m 6 455 141 615 �966 301 �1366 0.47 0.02 �80 2
m 7 258 128 407 �365 141 �519 0.69 0.2 �70 15
m/p 4 375 211 664 �356 232 �668 1.31 0.79 �33 44
p 4 1482 481 1794 �768 149 �896 1.89 0.42 11 4
All left 23 576 492 1794 �691 435 �1902 0.93 0.64 �53 39
Right (BS) a 2 341 159 454 �994 330 �1228 0.33 0.05 �98 4
a/m 2 554 319 780 �1709 742 �2234 0.31 0.05 �95 4
m 3 781 112 907 �2300 357 �2670 0.34 0.01 �92 1
m/p 7 481 251 812 �1374 778 �2390 0.4 0.19 �105 35
p 8 662 306 1187 �1773 881 �3454 0.38 0.02 �93 1
All right 22 581 271 1187 �1641 780 �3454 0.37 0.11 �97 19
All bites 46 576 391 1794 �1174 783 �3454 0.64 0.54 58 37
© 2013 Anatomical Society
Alligator mandibular bone strain, L. B. Porro et al.202

Lastly, two-way ANOVAS were carried out using the Circular Statistics
Toolbox for MATLAB (Berens, 2009) to determine whether differences
in e1 orientations from gage sites located in dorsolateral, lateral,
ventral and medial areas of the jaw across all experiments were
due to changes in bite point or individual variation (Table 11).
All statistical tests discussed below were conducted using SPSS
v11.5 (SPSS Inc., Chicago, IL). Shear strain data were averaged
across in vivo experiments (and not sorted into different bite
point locations for this analysis); summarized results for the entire
mandible and for the dentary and splenial bones are indicated in
Table 12. To quantitatively evaluate the degree of variation in
strain orientation with changes in bite point, ANOVAS were
performed to assess whether significant differences in e1 orienta-
tion existed among bite points for individual gages during all
experiments (Table 13).
Results
Principal strain (e1) orientations: lateral mandible
In vivo strain orientations
During biting ipsilateral to the gages (i.e. in the working
side mandible) e1 strains on the lateral aspect of the man-
dible (dorsolateral and lateral gages) are oriented antero-
inferiorly, between �12 and �79° from the reference axis
(Fig. 2, Tables 3–6). The only exception is the lateral gage
in Experiment 103, which exhibits e1 strains oriented anter-
osuperiorly at an angle of approximately 30°. With the
exception of Experiment 75, e1 strain orientations tend to
rotate clockwise as the bite point moves posteriorly.
During biting contralateral to the gage site (i.e. in the
balancing side mandible) (Fig. 3, Tables 3–6), e1 is oriented
anterosuperiorly between 23 and 40° from the reference
axis. Exceptions include the dorsolateral gage in Experiment
99 (e1 orientations ranging from 20 to �26°) and, as during
ipsilateral biting, the lateral gage in Experiment 103 in
which e1 is oriented posterosuperiorly. Contralateral biting
does not produce any observable trends of changes in e1orientation with changes in bite point. Mean vector length
and concentration (Table 8) reveal that e1 strains are more
concentrated (i.e. orientations are less variable) during con-
tralateral than ipsilateral biting.
In all experiments, Mardia–Watson–Wheeler and
Wheeler–Williams tests show that lateral gage e1 orienta-
tions during ipsilateral bites are significantly different from
those recorded during contralateral biting (Table 8). Two-
way ANOVA (Table 11) suggests that bite point has a signifi-
cant impact on e1 orientations in lateral gages (ipsilateral
and contralateral biting) and dorsolateral gages (ipsilateral
biting) but not in dorsolateral gages during contralateral
bites. Additionally, analyses reveal significant differences in
e1 orientation between similarly located gages (dorsolateral
and lateral gages) in different experiments when both bit-
ing side and bite point are taken into account (Table 11);
this may be due to slight differences in gage location
between experiments or individual differences between
research subjects. For most dorsolateral and lateral gage
sites, strain orientation appears to be strongly correlated
with strain magnitude (Table 8), although these compari-
sons are rarely statistically significant.
FEM strain orientations
Working side strain orientations at dorsolateral gages are
directed horizontally to anteroinferiorly, ranging from +1
to �83° (Fig. 2, Table 7). At working side lateral gage
locations, orientations range from superior (90°) to ante-
roinferior (�78°). e1 orientations tend to rotate clockwise
Table 5. (continued)
Gauge
location Bite side
Bite
position n
e1 e2 e1/e2 Ratio
e1Orientation
Mean SD Max Mean SD Max Mean SD Mean SD
Left
medial
splenial
Midline 3 582 118 698 �839 95 �948 0.69 0.09 148 7
Left (WS) a 2 449 160 562 �959 338 �1198 0.47 0 113 1
a/m 9 512 175 773 �903 363 �1428 0.59 0.09 100 6
m 19 654 319 1070 �927 451 �1549 0.71 0.1 93 9
m/p 6 577 250 950 �560 382 �1177 1.33 0.78 72 27
p 11 956 252 1401 �363 144 �608 2.86 0.79 40 9
All left 47 679 306 1401 �745 431 �1549 1.26 1.03 80 27
Right (BS) a 2 514 39 541 �548 27 �567 0.94 0.12 �15 5
a/m 2 764 49 798 �837 145 �939 0.92 0.1 �17 4
m 8 810 109 905 �903 131 �1027 0.9 0.03 �15 1
m/p 11 666 192 966 �757 267 �1218 0.9 0.08 �15 3
p 12 733 231 1010 �825 329 �1246 0.97 0.19 �14 7
All right 35 71 190 1010 �806 260 �1246 0.93 0.14 �15 5
All bites 82 688 259 1401 �770 360 �1549 1.1 0.78 41 53
a, anterior; a/m, anterior/middle; m, middle; m/p, middle/posterior; p, posterior.
© 2013 Anatomical Society
Alligator mandibular bone strain, L. B. Porro et al. 203
as bite point moves posteriorly, although there is no clear
trend for FEM gage site 4, corresponding to the lateral
gage of Experiment 75. Strain orientations on the lateral
side of the mandible vary with gage location and bite
point, as seen in FEM strain fields (strain fields are close-
up views of the FEM with vectors illustrating e1 orienta-
tion for each element) (Fig. 4). During anterior and
middle bites, e1 is oriented anteroinferiorly at all lateral
gage sites; however, during posterior biting (when the
bite point is immediately superior to the gages) there are
strong local variations in strain orientation.
On the balancing side (Fig. 3, Table 7), e1 orientations are
directed horizontally to anteroinferiorly for dorsolateral
gages (ranging from 1 to �55°) but anterosuperiorly (from
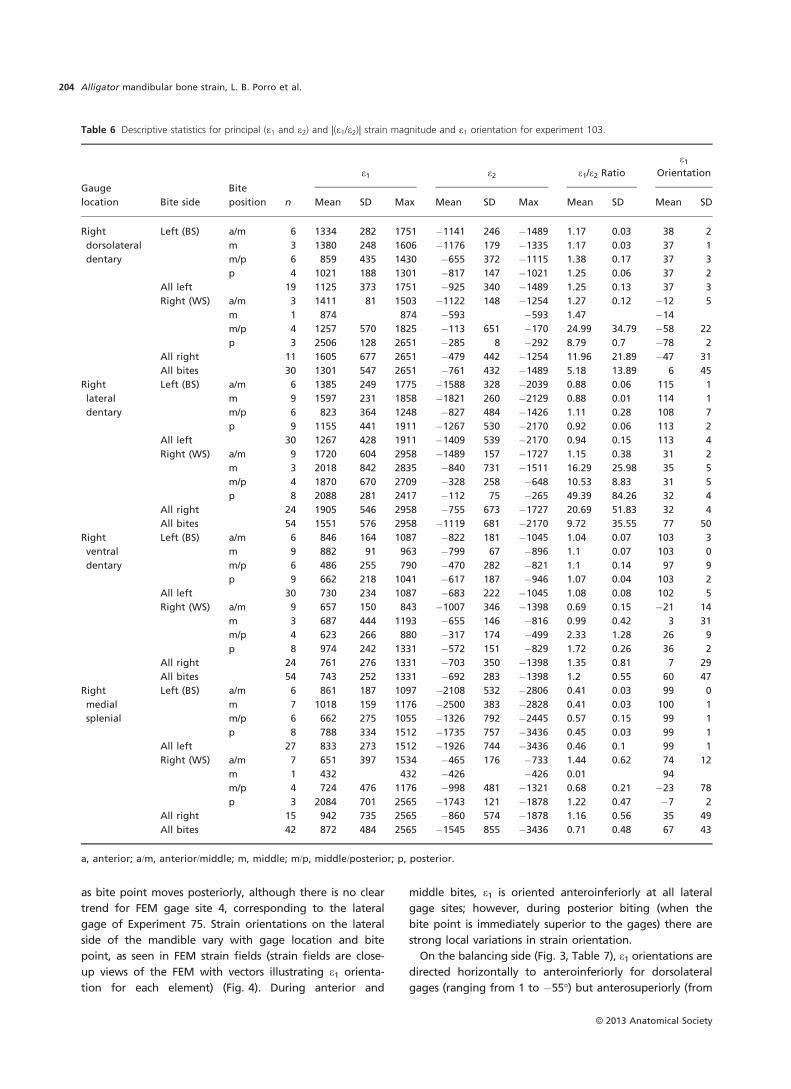
Table 6 Descriptive statistics for principal (e1 and e2) and |(e1/e2)| strain magnitude and e1 orientation for experiment 103.
Gauge
location Bite side
Bite
position n
e1 e2 e1/e2 Ratio
e1Orientation
Mean SD Max Mean SD Max Mean SD Mean SD
Right
dorsolateral
dentary
Left (BS) a/m 6 1334 282 1751 �1141 246 �1489 1.17 0.03 38 2
m 3 1380 248 1606 �1176 179 �1335 1.17 0.03 37 1
m/p 6 859 435 1430 �655 372 �1115 1.38 0.17 37 3
p 4 1021 188 1301 �817 147 �1021 1.25 0.06 37 2
All left 19 1125 373 1751 �925 340 �1489 1.25 0.13 37 3
Right (WS) a/m 3 1411 81 1503 �1122 148 �1254 1.27 0.12 �12 5
m 1 874 874 �593 �593 1.47 �14
m/p 4 1257 570 1825 �113 651 �170 24.99 34.79 �58 22
p 3 2506 128 2651 �285 8 �292 8.79 0.7 �78 2
All right 11 1605 677 2651 �479 442 �1254 11.96 21.89 �47 31
All bites 30 1301 547 2651 �761 432 �1489 5.18 13.89 6 45
Right
lateral
dentary
Left (BS) a/m 6 1385 249 1775 �1588 328 �2039 0.88 0.06 115 1
m 9 1597 231 1858 �1821 260 �2129 0.88 0.01 114 1
m/p 6 823 364 1248 �827 484 �1426 1.11 0.28 108 7
p 9 1155 441 1911 �1267 530 �2170 0.92 0.06 113 2
All left 30 1267 428 1911 �1409 539 �2170 0.94 0.15 113 4
Right (WS) a/m 9 1720 604 2958 �1489 157 �1727 1.15 0.38 31 2
m 3 2018 842 2835 �840 731 �1511 16.29 25.98 35 5
m/p 4 1870 670 2709 �328 258 �648 10.53 8.83 31 5
p 8 2088 281 2417 �112 75 �265 49.39 84.26 32 4
All right 24 1905 546 2958 �755 673 �1727 20.69 51.83 32 4
All bites 54 1551 576 2958 �1119 681 �2170 9.72 35.55 77 50
Right
ventral
dentary
Left (BS) a/m 6 846 164 1087 �822 181 �1045 1.04 0.07 103 3
m 9 882 91 963 �799 67 �896 1.1 0.07 103 0
m/p 6 486 255 790 �470 282 �821 1.1 0.14 97 9
p 9 662 218 1041 �617 187 �946 1.07 0.04 103 2
All left 30 730 234 1087 �683 222 �1045 1.08 0.08 102 5
Right (WS) a/m 9 657 150 843 �1007 346 �1398 0.69 0.15 �21 14
m 3 687 444 1193 �655 146 �816 0.99 0.42 3 31
m/p 4 623 266 880 �317 174 �499 2.33 1.28 26 9
p 8 974 242 1331 �572 151 �829 1.72 0.26 36 2
All right 24 761 276 1331 �703 350 �1398 1.35 0.81 7 29
All bites 54 743 252 1331 �692 283 �1398 1.2 0.55 60 47
Right
medial
splenial
Left (BS) a/m 6 861 187 1097 �2108 532 �2806 0.41 0.03 99 0
m 7 1018 159 1176 �2500 383 �2828 0.41 0.03 100 1
m/p 6 662 275 1055 �1326 792 �2445 0.57 0.15 99 1
p 8 788 334 1512 �1735 757 �3436 0.45 0.03 99 1
All left 27 833 273 1512 �1926 744 �3436 0.46 0.1 99 1
Right (WS) a/m 7 651 397 1534 �465 176 �733 1.44 0.62 74 12
m 1 432 432 �426 �426 0.01 94
m/p 4 724 476 1176 �998 481 �1321 0.68 0.21 �23 78
p 3 2084 701 2565 �1743 121 �1878 1.22 0.47 �7 2
All right 15 942 735 2565 �860 574 �1878 1.16 0.56 35 49
All bites 42 872 484 2565 �1545 855 �3436 0.71 0.48 67 43
a, anterior; a/m, anterior/middle; m, middle; m/p, middle/posterior; p, posterior.
© 2013 Anatomical Society
Alligator mandibular bone strain, L. B. Porro et al.204

29 to 38°) for lateral gages. e1 orientations rotate clockwise
as bite point moves posteriorly; however, e1 orientation
does not vary by more than 5° within any balancing side
dorsolateral or lateral gage site. Strain fields (Fig. 4) reveal
that the strain orientations on the lateral aspect of the bal-
ancing side remain similar across gage sites.
Strain orientations within dorsolateral and lateral gages
vary less with changes in bite point on the balancing
side (Fig. 3) than on the working side of the FEM (Figs 2
and 4). The range of strain orientations predicted by the
FEM overlapped the range of in vivo e1 orientations
recorded in dorsolateral gages (Experiments 99, 102, 103)
during ipsilateral biting, lateral gages (Experiments 75,
99, 102) during ipsilateral and contralateral biting, and
the lateral gage of Experiment 103 during ipsilateral
biting. In contrast, FEM strain orientations did not match
in vivo orientations at dorsolateral gages during
contralateral biting, and were nearly perpendicular to e1orientations recorded at the lateral gage of Experiment
103 during contralateral biting; in this context, it should
be observed that the strain orientations recorded during
Experiment 103 are anomalous.
Principal strain (e1) orientations: medial mandible
In vivo strain orientations
In vivo strain orientations recorded on the medial aspect of
the mandible during ipsilateral biting (Fig. 2, Tables 3–6)
are highly variable both within and between experiments,
and it is difficult to make generalizations regarding the
strain orientations for this region. In contrast, during contra-
lateral biting, e1 on themedial aspect of themandible is con-
Fig. 2 Orientations of maximum principal
strain (e1) on the working side mandible.
Colored arrows represent variations in bite
point in in vivo experiments (see inset for
color key); strain orientation for every
recorded bite during experiments is shown
for every gage site in five experiments for
lateral (B,E,H,K), ventral (A,C,F,I,L) and medial
(D,G,J,M) views. Black arrows represent strain
orientations during anterior (solid line) and
posterior bites (broken line) in the FEM (finite
element model) in areas corresponding to in
vivo gage sites. Note difference in scale
between in vivo and FEM strain in the inset.
© 2013 Anatomical Society
Alligator mandibular bone strain, L. B. Porro et al. 205

sistently oriented anteroinferiorly from the reference axis
(Fig. 3; Tables 3–6) with values ranging from �14 to �81°.
Neither ipsilateral nor contralateral biting produce any
observable trends of changes in e1 orientation with changes
in bite point. As with lateral gages, e1 strains on the medial
aspect of the mandible are more concentrated during con-
tralateral biting than during ipsilateral biting (Table 9).
In all experiments, medial e1 orientations during ipsilat-
eral bites are significantly different from those recorded
during contralateral biting (Table 9). Two-way ANOVA
(Table 11) suggests that differences in gage site/research
subject across experiments has a significant impact on med-
ial e1 orientations (ipsilateral and contralateral biting) and
that bite point has a significant impact on medial e1 orien-
tations during ipsilateral biting but not during contralateral
biting. Circular-linear correlations do not reveal strong rela-
tionships between strain orientation and magnitude at
most medial gage sites (Table 9).
FEM strain orientations
Strain orientations on the medial working side of the FEM
were directed anterosuperiorly to anteroinferiorly, ranging
from 32 to �86° (Fig. 2, Table 7). On the balancing side
(Fig. 3, Table 7), e1 orientations were directed anteroinferi-
orly, ranging from �54 to �63°, and varied by no more 4°
within any individual gage site, again demonstrating that
strain orientations varied less with changes in bite point on
the balancing side than on the working side of the FEM.
Fig. 3 Orientations of maximum principal
strain (e1) on the balancing side mandible.
Colored arrows represent variations in bite
point in in vivo experiments (see inset for
color key); strain orientation for every
recorded bite during experiments is shown
for every gage site in five experiments for
lateral (B,E,H,K), ventral (A,C,F,I,L) and medial
(D,G,J,M) views. Black arrows represent strain
orientations during anterior (solid line) and
posterior bites (broken line) in the FEM (finite
element model) in areas corresponding to in
vivo gage sites. Note difference in scale
between in vivo and FEM strain in the inset.
© 2013 Anatomical Society
Alligator mandibular bone strain, L. B. Porro et al.206

Table 7 Descriptive statistics for principal (e1 and e2) and |(e1/e2)| strain magnitude and e1 orientation for the gage sites in the FEM. Maximum
and mean values as well as standard deviations are based on results from bricks within gage sites.
Gage ID Gage side
No. of
bricks
Bite
position*
E1 E2
E1
orientation E1/E2 ratio
Mean SD Max Mean SD Max Mean SD Mean SD
1 Ventral
anterior
dentary
Right (WS) 24 a 61 8 71 �291 28 �342 64 2 0.21 0.02
a/m 63 4 72 �226 10 �243 74 2 0.28 0.02
m 57 8 73 �77 19 �115 �84 8 0.81 0.3
m/p 136 44 213 �37 16 �61 �51 9 5.21 6.19
p 176 41 248 �37 14 �59 �43 3 6 6
Left (BS) 25 a 162 24 199 �436 52 �570 87 4 0.37 0.05
a/m 187 27 228 �451 52 �587 90 4 0.42 0.05
m 199 29 242 �456 51 �591 91 4 0.44 0.06
m/p 204 29 248 �458 51 �592 91 4 0.45 0.06
p 203 29 246 �444 47 �569 92 4 0.46 0.06
2 Ventral
posterior
dentary
Right (WS) 21 a 50 9 68 �305 37 �357 71 2 0.16 0.02
a/m 54 8 74 �380 31 �327 77 2 0.19 0.02
m 44 5 54 �160 13 �192 80 2 0.28 0.04
m/p 43 8 59 �74 11 �103 88 4 0.59 0.11
p 0 0 0 2 0 2 �5 7 0 0
Left (BS) 24 a 133 20 183 �505 57 �633 62 2 0.26 0.03
a/m 147 21 201 �512 56 �634 63 2 0.29 0.03
m 153 22 211 �509 56 �628 64 2 0.3 0.03
m/p 155 22 215 �506 55 �623 65 3 0.31 0.03
p 152 22 214 �481 54 �594 66 3 0.32 0.04
3 Ventral
angular
Right (WS) 18 a 83 20 126 �473 76 �561 61 5 0.18 0.05
a/m 74 12 98 �443 66 �525 57 6 0.17 0.04
m 32 10 54 �309 51 �374 56 6 0.1 0.04
m/p 11 7 23 �224 46 �279 57 4 0.05 0.03
p 126 82 289 �112 30 �177 �33 9 1.27 0.13
Left (BS) 21 a 117 29 169 �621 143 �853 53 4 0.2 0.04
a/m 116 32 177 �611 151 �859 52 4 0.19 0.05
m 106 36 174 �584 160 �846 52 4 0.18 0.05
m/p 99 37 170 �567 165 �836 53 5 0.18 0.05
p 84 36 154 �528 172 �795 55 5 0.16 0.05
4 Lateral
dentary
Right (WS) 21 a 116 55 203 �88 25 �154 79 14 1.55 0.92
a/m 130 33 188 �158 37 �229 90 8 0.9 0.39
m 58 7 74 �231 37 �288 �68 3 0.25 0.05
m/p 64 10 81 �327 52 �404 �57 5 0.2 0.03
p 128 27 188 �322 84 �459 �44 4 0.41 0.11
Left (BS) 23 a 289 96 426 �205 39 �293 38 8 1.47 0.51
a/m 349 74 490 �226 45 �330 37 7 1.61 0.52
m 387 77 532 �234 49 �347 36 7 1.73 0.54
m/p 403 79 550 �237 51 �354 35 7 1.78 0.55
p 414 78 560 �229 51 �348 34 6 1.9 0.58
5 Ventral
dentary
Right (WS) 22 a 65 10 84 �738 68 �900 64 3 0.09 0.01
a/m 53 12 78 �571 51 �709 74 3 0.09 0.02
m 98 34 167 �200 23 �263 �80 5 0.5 0.19
m/p 342 93 565 �102 23 �165 �50 3 3.39 0.74
p 674 92 938 �103 19 �142 �34 3 7 0.72
Left (BS) 21 a 253 19 288 �838 118 �1051 75 3 0.31 0.04
a/m 282 20 322 �847 121 �1067 74 3 0.34 0.05
m 295 21 337 �843 121 �1066 73 3 0.36 0.05
m/p 299 22 343 �839 121 �1062 73 3 0.36 0.05
p 291 22 335 �795 115 �1010 72 3 0.37 0.05
© 2013 Anatomical Society
Alligator mandibular bone strain, L. B. Porro et al. 207

Table 7. (continued)
Gage ID Gage side
No. of
bricks
Bite
position*
E1 E2
E1
orientation E1/E2 ratio
Mean SD Max Mean SD Max Mean SD Mean SD
6 Medial
splenial
Right (WS) 24 a 63 14 89 �277 32 �334 116 8 0.23 0.05
a/m 63 15 97 �179 20 �220 122 9 0.35 0.09
m 190 19 225 �140 12 �167 142 2 1.43 0.17
m/p 312 27 388 �135 33 �181 147 3 2.49 0.77
p 420 55 544 �30 18 �80 32 7 30.68 51.32
Left (BS) 23 a 255 37 322 �628 48 �700 124 2 0.41 0.08
a/m 295 41 370 �683 53 �765 125 2 0.44 0.08
m 321 43 401 �721 57 �808 125 2 0.45 0.08
m/p 333 45 416 �738 58 �828 125 2 0.46 0.08
p 351 46 438 �751 60 �844 125 2 0.47 0.09
7 DL
dentary
Right (WS) 25 a 490 64 626 �56 18 �93 1 3 9.38 2.37
a/m 396 47 496 �45 16 �81 �6 4 9.66 3.47
m 112 11 128 �44 10 �74 �28 8 2.64 0.62
m/p 40 17 70 �158 26 �214 �68 2 0.26 0.11
p 412 91 543 �707 122 �1000 �76 5 0.61 0.2
Left (BS) 18 a 472 109 556 �146 30 �192 1 4 3.25 0.93
a/m 503 111 581 �166 36 �221 0 3 3.06 0.84
m 527 117 610 �183 37 �241 0 3 2.93 0.84
m/p 539 119 625 �191 38 �251 0 3 2.87 0.82
p 547 121 634 �201 36 �262 �1 4 2.77 0.82
8 DL
dentary
Right (WS) 23 a 401 53 492 �34 11 �56 0 2 12.96 4.4
a/m 357 47 434 �16 10 �40 �6 3 47 64
m 149 20 181 �6 3 �12 �18 8 41 31
m/p 57 13 80 �32 13 �56 �57 7 2.12 1.12
p 615 66 720 �599 107 �786 �83 3 1.06 0.23
Left (BS) 22 a 426 50 508 �140 18 �180 �52 1 3.09 0.57
a/m 451 51 534 �165 21 �212 �54 1 2.78 0.51
m 477 51 559 �183 23 �233 �55 1 2.66 0.46
m/p 491 51 573 �192 24 �244 �55 1 2.6 0.45
p 508 50 586 �200 25 �253 �55 2 2.58 0.42
9 Lateral
dentary
Right (WS) 24 a 44 26 100 �63 14 �93 �46 11 0.74 0.43
a/m 89 27 144 �105 16 �140 �50 6 0.88 0.32
m 82 14 108 �118 15 �146 �62 3 0.72 0.19
m/p 89 11 108 �137 11 �154 �70 1 0.66 0.12
p 307 61 414 �47 29 �105 �92 3 22 55
Left (BS) 20 a 156 25 192 �180 15 �211 38 5 0.87 0.14
a/m 187 27 225 �206 17 �244 37 4 0.91 0.13
m 212 28 255 �217 19 �261 35 4 0.98 0.13
m/p 226 29 270 �222 20 �268 34 3 1.02 0.13
p 245 31 292 �220 21 �268 33 3 1.12 0.14
10 Ventral
dentary
Right (WS) 21 a 69 9 86 �464 43 �566 58 2 0.15 0.02
a/m 55 6 65 �409 35 �495 62 2 0.13 0.02
m 27 4 34 �214 18 �249 67 2 0.13 0.02
m/p 21 9 46 �84 15 �113 86 9 0.26 0.12
p 350 38 439 �40 11 �58 �32 2 9.54 4.06
Left (BS) 23 a 142 10 158 �613 64 �711 45 1 0.23 0.02
a/m 149 10 165 �612 65 �716 43 1 0.25 0.02
m 152 10 169 �606 67 �714 42 1 0.25 0.03
m/p 153 10 171 �601 67 �712 42 1 0.26 0.03
p 149 10 167 �572 66 �680 41 2 0.26 0.03
© 2013 Anatomical Society
Alligator mandibular bone strain, L. B. Porro et al.208

Strain fields of the medial aspect of the mandible (Fig. 4)
reveal strong local variations in principal strain on the work-
ing side during posterior biting.
Despite (or because of) the high variability of e1 orienta-
tions recorded at medial gages in vivo (especially during ipsi-
lateral biting), strain orientations predicted by the FEM
overlapped the range of in vivo e1 orientations during ipsilat-
eral biting (Experiments 75, 102, 103) and contralateral biting
(Experiment 99), and were similar to e1 orientations recorded
during contralateral biting in Experiments 75, 102 and 103.
FEM strain orientations did not fall within the range of data
recorded at the medial gage site in Experiment 99 during
ipsilateral biting, despite the fact that in vivo e1 orientations
at this site were highly variable (spanning over 115°).
Principal strain (e1) orientations: ventral mandible
In vivo strain orientations
On the ventral aspect of the working side, e1 strain orienta-
tion is highly variable between experiments and gage sites
Table 7. (continued)
Gage ID Gage side
No. of
bricks
Bite
position*
E1 E2
E1
orientation E1/E2 ratio
Mean SD Max Mean SD Max Mean SD Mean SD
11 Ventral
splenial
Right (WS) 22 a 133 12 156 �593 33 �637 55 2 0.22 0.02
a/m 111 14 138 �474 28 �512 57 3 0.23 0.03
m 49 9 67 �187 20 �216 59 3 0.27 0.07
m/p 26 13 60 �8 5 �16 �60 20 6.13 6.96
p 524 29 569 �127 15 �158 �37 2 4.16 0.46
Left (BS) 22 a 169 17 201 �789 82 �922 �46 2 0.21 0.02
a/m 175 19 210 �806 82 �942 �45 2 0.22 0.02
m 179 20 217 �822 81 �956 �44 2 0.22 0.02
m/p 181 20 219 �829 80 �962 �44 2 0.22 0.02
p 179 19 217 �822 77 �948 �45 2 0.22 0.02
12 Medial
splenial
Right (WS) 22 a 37 24 87 �77 28 �132 �50 14 0.59 0.5
a/m 62 32 127 �46 16 �77 �32 12 1.58 1.03
m 174 15 202 �86 9 �102 �36 3 2.08 0.27
m/p 257 20 295 �116 8 �130 �38 1 2.21 0.13
p 157 NA 157 �6 NA �6 55 NA 24.31 NA
Left (BS) 20 a 212 25 259 �298 64 �445 �54 3 0.75 0.22
a/m 246 25 293 �340 68 �493 �55 3 0.76 0.2
m 269 26 315 �369 72 �527 �55 2 0.76 0.19
m/p 281 26 327 �383 73 �542 �56 2 0.76 0.18
p 299 26 344 �398 74 �555 �56 2 0.78 0.18
13 Lateral
dentary
Right (WS) 25 a 105 33 184 �56 9 �83 �30 6 1.89 0.6
a/m 129 25 196 �82 10 �112 �40 4 1.62 0.43
m 78 9 98 �86 8 �98 �62 2 0.93 0.15
m/p 79 6 94 �122 14 �159 �78 2 0.66 0.08
p 300 54 410 �178 44 �281 86 2 1.74 0.32
Left (BS) 24 a 192 24 237 �167 24 �227 29 6 1.18 0.27
a/m 226 24 267 �197 25 �262 29 5 1.17 0.23
m 252 25 296 �211 24 �278 28 5 1.21 0.21
m/p 265 26 308 �218 24 �285 28 5 1.23 0.21
p 279 26 324 �217 23 �281 27 4 1.3 0.21
14 Medial
splenial
Right (WS) 22 a 96 35 173 �127 35 �202 �21 5 0.75 0.16
a/m 97 35 177 �89 27 �149 �16 7 1.1 0.27
m 80 13 106 �17 5 �24 �67 12 5.27 3.31
m/p 166 14 190 �63 20 �92 96 2 3.02 1.43
p 378 47 463 �58 26 �115 94 4 8.46 5.09
Left (BS) 25 a 153 25 207 �244 38 �314 121 2 0.63 0.07
a/m 169 23 218 �277 39 �349 118 2 0.62 0.07
m 186 23 236 �310 40 �387 118 2 0.6 0.07
m/p 196 23 247 �328 41 �406 117 2 0.6 0.07
p 216 26 271 �358 42 �439 118 2 0.61 0.06
a, anterior; a/m, anterior/middle; m, middle; m/p, middle/posterior; posterior.
© 2013 Anatomical Society
Alligator mandibular bone strain, L. B. Porro et al. 209

Table
8Circularstatistics
forbonestrainsfrom
thelateralaspectoftheAlligatorman
dible.
Exp
eriment
andsite
75La
teral
99Dorsolateral
99La
teral
102Dorsolateral
102La
teral
103Dorsolateral
103La
teral
Side
WS
BS
WS
BS
WS
BS
WS
BS
WS
BS
WS
BS
WS
BS
Numberof
observations
30
48
20
320
10
22
14
47
36
11
19
24
30
Meanve
ctor(l)
144.069°
33.141°
155.701°
6.261°
132.284°
29.262°
149.608°
24.43°
139.897°
36.422°
131.333°
37.258°
31.668°
112.724°
Length
ofmean
vector(r)
0.951
0.998
0.741
0.735
0.987
0.998
0.701
0.997
0.939
0.998
0.519
0.996
0.992
0.991
Median
142.955°
33.27°
160.485°
19.41°
133.62°
29.78°
155.08°
24.715°
140.54°
36.61°
116.3°
37.07°
31.765°
114.12°
Concentration
10.447
232.382
2.29
0.599
39.876
238.592
2.014
137.099
8.411
228.833
1.058
138.932
61.425
56.314
Circu
larva
riance
0.025
0.001
0.13
0.132
0.006
7.57E-04
0.149
0.001
0.031
0.001
0.241
0.002
0.004
0.004
Circu
larstandard
deviation
9.093°
1.881°
22.183°
22.475°
4.566°
1.577°
24.14°
2.187°
10.203°
1.896°
32.815°
2.435°
3.67°
3.835°
Standard
error
ofmean
1.659°
0.272°
4.918°
24.932°
1.021°
0.587°
5.14°
0.655°
1.487°
0.316°
11.655°
0.559°
0.749°
0.7°
95%
Confidence
interval
140.816°
32.608°
146.06°
317.384°
130.282°
28.112°
139.531°
23.146°
136.982°
35.802°
108.484°
36.163°
30.199°
111.351°
(�/+)forl
147.322°
33.673°
165.341°
55.138°
134.285°
30.413°
159.685°
25.714°
142.813°
37.041°
154.181°
38.353°
33.137°
114.096°
99%
Confidence
interval
139.794°
32.441°
143.032°
302.031°
129.654°
27.75°
136.365°
22.743°
136.066°
35.608°
101.307°
35.819°
29.738°
110.92°
(�/+)forl
148.344°
33.84°
168.37°
70.491°
134.914°
30.774°
162.851°
26.117°
143.729°
37.236°
161.358°
38.697°
33.598°
114.527°
Rayleightest
(Z)
27.125
47.793
10.981
1.621
19.498
9.97
10.816
13.919
41.401
35.843
2.962
18.863
23.609
29.467
Rayleightest
(P)
1.43E-11
<1E-12
2.82E-06
0.211
1.21E-08
<1E-12
4.40E-06
7.56E-07
<1E-12
<1E-12
0.048
2.13E-08
3.88E-10
2.13E-12
Watson’s
U²test
(U²)
0.071
0.064
0.133
*0.066
0.095
0.441
0.065
0.657
0.12
0.143
0.061
0.05
0.409
Watson’s
U²test
(P)
0.25>
P>0.15
0.5
>
P>0.25
<0.025
*0.5
>
P>0.25
0.15>
P>0.1
<0.005
0.5
>
P>0.25
<0.005
<0.05
<0.005
0.5
>
P>0.25
0.5
>
P>0.25
<0.005
Test
forWS/BS
differences
W58.415
*20.593
27.174
65.586
21.928
43.03
P<1E-12
*3.38E-05
1.26E-06
<1E-12
1.73E-05
4.53E-10
Circu
lar-linearco
rrelation
r0.753
0.789
0.628
*0.626
0.887
0.865
0.769
0.673
0.568
0.779
0.548
0.414
0.633
P0.096
0.334
0.251
*0.149
0.751
0.371
0.329
0.143
0.185
0.004
0.007
0.026
1.06E-05
*Indicatesaresult
could
notbecalculated.
© 2013 Anatomical Society
Alligator mandibular bone strain, L. B. Porro et al.210
(Fig. 2, Tables 2–6), directed anteromedially [Experiments
56 (anterior and posterior dentary gages), 75, 99, and 102
(ventral splenial gage)] or anterolaterally [Experiments 56
(angular gage), 102 (ventral dentary gage), and 103]. Dur-
ing ipsilateral biting, e1 orientations at ventral gage sites
tend to rotate in a counterclockwise direction (relative to
the reference axis) as bite point moves posteriorly.
With the exception of Experiment 56, e1 on the ventral
aspect of the mandible during contralateral biting is nearly
perpendicular to the reference axis (Fig. 3, Tables 2–6). In
Experiment 56, principal strains are parallel to the reference
axis. Contralateral biting does not produce any obvious
trend of change in e1 orientation with change in bite point.
At most ventral gage sites, e1 strains are more concentrated
during contralateral than ipsilateral biting (Table 10). The
exceptions are the posterior dentary and angular gages of
Experiment 56, in which the reverse is true.
In all experiments, ventral e1 orientations during ipsilat-
eral bites are significantly different from those recorded
during contralateral biting (Table 10). Two-way ANOVA
(Table 11) suggests that differences in bite point and gage
sites/experimental animals have a significant impact on e1orientations. There appears to be some correlation between
strain orientation and magnitude at ventral gage sites but
these are rarely significant (Table 10).
FEM strain orientations
Working side strain orientations at all ventral gage sites are
directed anterolaterally during anterior bites to anterome-
dially during posterior bites (Fig. 2, Table 7). On the balanc-
ing side (Fig. 3, Table 7) e1 orientations are directed
perpendicular to the reference axis at more anterior gage
sites [Experiments 56 (anterior dentary), 75, 99 and 103] but
anterolaterally or anteromedially at more posterior
gage sites [Experiments 56 (posterior dentary and angular
sites) and 102]. Within balancing side gage sites, e1 orienta-
tions varied by no more than 5° with changes in bite point.
As with lateral and medial gage sites, ventral strain
orientations in the FEM vary less with changes in bite point
on the balancing side (Fig. 3) than on the working side
(Figs 2 and 4). Unlike the lateral and medial aspects of
the mandible, strain orientations are more variable
between ventral gage sites during middle biting than
during posterior biting (Fig. 4). This may be due to the more
anterior location of ventral gages (thus, orientations reflect
the proximity of bite point). Alternatively, high variability in
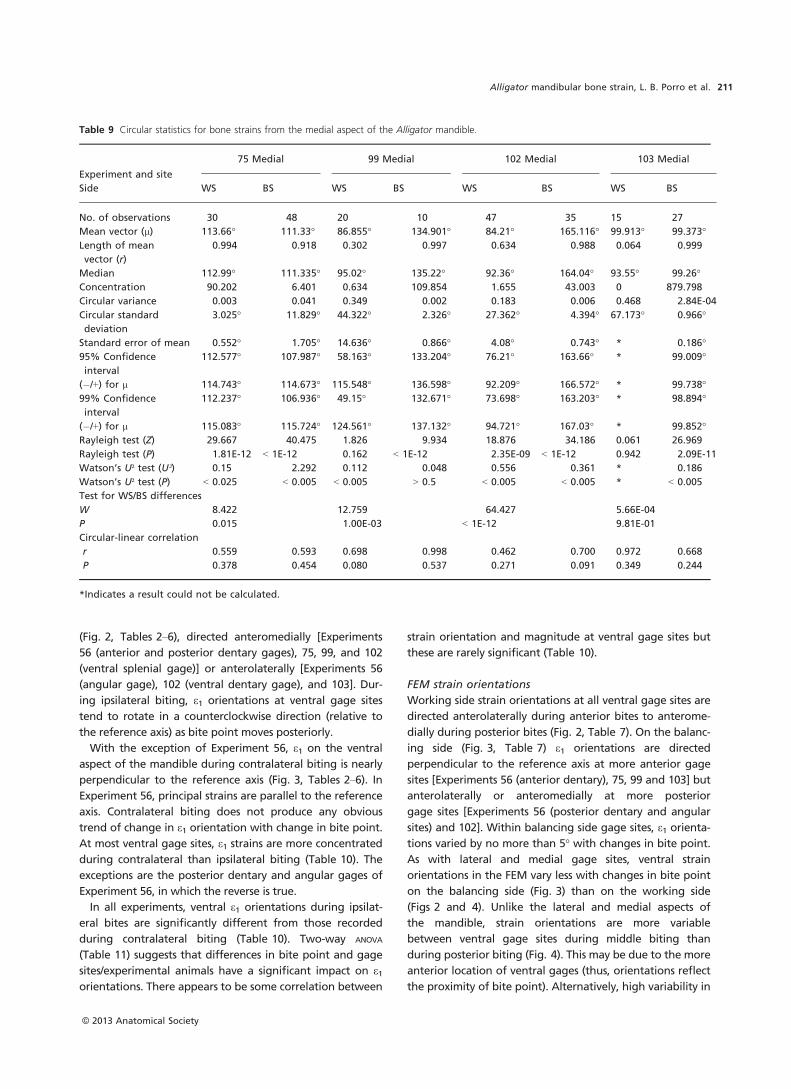
Table 9 Circular statistics for bone strains from the medial aspect of the Alligator mandible.
Experiment and site
75 Medial 99 Medial 102 Medial 103 Medial
Side WS BS WS BS WS BS WS BS
No. of observations 30 48 20 10 47 35 15 27
Mean vector (l) 113.66° 111.33° 86.855° 134.901° 84.21° 165.116° 99.913° 99.373°
Length of mean
vector (r)
0.994 0.918 0.302 0.997 0.634 0.988 0.064 0.999
Median 112.99° 111.335° 95.02° 135.22° 92.36° 164.04° 93.55° 99.26°
Concentration 90.202 6.401 0.634 109.854 1.655 43.003 0 879.798
Circular variance 0.003 0.041 0.349 0.002 0.183 0.006 0.468 2.84E-04
Circular standard
deviation
3.025° 11.829° 44.322° 2.326° 27.362° 4.394° 67.173° 0.966°
Standard error of mean 0.552° 1.705° 14.636° 0.866° 4.08° 0.743° * 0.186°
95% Confidence
interval
112.577° 107.987° 58.163° 133.204° 76.21° 163.66° * 99.009°
(�/+) for l 114.743° 114.673° 115.548° 136.598° 92.209° 166.572° * 99.738°
99% Confidence
interval
112.237° 106.936° 49.15° 132.671° 73.698° 163.203° * 98.894°
(�/+) for l 115.083° 115.724° 124.561° 137.132° 94.721° 167.03° * 99.852°
Rayleigh test (Z) 29.667 40.475 1.826 9.934 18.876 34.186 0.061 26.969
Rayleigh test (P) 1.81E-12 < 1E-12 0.162 < 1E-12 2.35E-09 < 1E-12 0.942 2.09E-11
Watson’s U² test (U²) 0.15 2.292 0.112 0.048 0.556 0.361 * 0.186
Watson’s U² test (P) < 0.025 < 0.005 < 0.005 > 0.5 < 0.005 < 0.005 * < 0.005
Test for WS/BS differences
W 8.422 12.759 64.427 5.66E-04
P 0.015 1.00E-03 < 1E-12 9.81E-01
Circular-linear correlation
r 0.559 0.593 0.698 0.998 0.462 0.700 0.972 0.668
P 0.378 0.454 0.080 0.537 0.271 0.091 0.349 0.244
*Indicates a result could not be calculated.
© 2013 Anatomical Society
Alligator mandibular bone strain, L. B. Porro et al. 211

Table
10
Circularstatistics
forbonestrainsfrom
theventral
aspectoftheAlligatorman
dible.
Exp
eriment
andSite
56Ant.
ventral
dentary
56Post.ve
ntraldentary
56Angular
75Ventraldentary
99Ventraldentary
102Ventraldentary
102Ventralsplenial
103Ventraldentary
Side
WS
BS
WS
BS
WS
BS
WS
BS
WS
BS
WS
BS
WS
BS
WS
BS
No.of
observations
13
10
13
10
13
10
28
45
20
10
47
35
23
22
24
30
Meanve
ctor(l)
152.212°
3.288°
153.434°
14.397°
68.367°
98.823°
148.328°
61.583°
167.231°
90.704°
137.439°
114.282°
107.664°
86.915°
10.716°
102.267°
Length
ofmean
vector(r)
0.941
0.99
0.966
0.855
0.96
0.649
0.928
10.731
0.998
0.682
0.994
0.445
0.906
0.573
0.987
Median
154.4°
2.685°
150.87°
10.72°
66.91°
89.9°
152.915°
61.51°
177.675°
90.2°
141.32°
115.73°
103.02°
87.35°
21.105°
103.31°
Concentration
6.896
34.623
11.556
2.719
9.983
1.614
7.234
1273.631
2.215
221.44
1.901
77.888
0.994
5.61
1.402
39.842
Circu
larva
riance
0.029
0.005
0.017
0.072
0.02
0.175
0.036
1.96E-04
0.134
8.16E-04
0.159
0.003
0.277
0.047
0.214
0.006
Circu
larStandard
deviation
9.948°
4.158°
7.585°
16.018°
8.185°
26.615°
11.066°
0.803°
22.676°
1.637°
25.057°
3.257°
36.437°
12.726°
30.247°
4.568°
Standard
errorof
mean
3.118°
1.548°
2.379°
5.941°
2.567°
8.848°
2.089°
0.12°
5.034°
0.609°
3.67°
0.55°
8.98°
2.709°
6.525°
0.834°
95%
Confidence
interval
146.098°
0.254°
148.77°
2.751°
63.336°
81.477°
144.232°
61.348°
157.363°
89.51°
130.245°
113.203°
90.06°
81.604°
357.924°
100.632°
(�/+)forl
158.325°
6.323°
158.097°
26.043°
73.399°
116.169°
152.424°
61.818°
177.1°
91.898°
144.632°
115.361°
125.267°
92.226°
23.508°
103.901°
99%
Confidence
interval
144.178°
359.301°
147.306°
359.093°
61.755°
76.028°
142.945°
61.275°
154.263°
89.134°
127.985°
112.864°
84.531°
79.936°
353.906°
100.118°
(�/+)forl
160.245°
7.276°
159.561°
29.701°
74.98°
121.618°
153.711°
61.891°
180.2°
92.274°
146.892°
115.7°
130.797°
93.895°
27.526°
104.415°
Rayleightest
(Z)
11.523
9.792
12.12
7.315
11.981
4.218
24.119
44.965
10.689
9.967
21.87
34.551
4.562
18.06
7.872
29.247
Rayleightest
(P)
1.14E-06
<1E-12
1.33E-06
8.58E-05
1.30E-06
0.011
1.79E-10
<1E-12
4.15E-06
<1E-12
2.46E-10
<1E-12
0.009
2.39E-08
2.10E-04
2.56E-12
Watson’sU²test
(U²)
0.138
0.056
0.23
0.336
0.138
0.167
0.196
0.137
0.223
0.284
0.186
0.381
0.374
0.978
0.29
0.51
Watson’sU²test
(P)
<0.025
0.5
>
P>0.25
<0.005
<0.005
<0.025
<0.005
<0.005
<0.05
<0.005
<0.005
<0.005
<0.005
<0.005
<0.005
<0.005
<0.005
Test
forWS/BSdifferences
W18.294
18.294
14.356
54.593
20.593
54.495
32.683
43.03
P1.07E-04
1.07E-04
7.63E-04
1.40E-12
3.38E-05
1.47E-12
8.00E-08
4.53E-10
Circu
lar-linearco
rrelation
r0.850
0.977
0.864
0.675
0.770
0.747
0.575
0.740
0.619
0.795
0.669
0.735
0.755
0.943
0.838
0.712
P0.196
0.018
0.088
0.419
0.308
0.344
0.443
0.292
0.155
0.848
0.056
0.027
0.267
0.341
0.168
0.161
*Indicatesaresult
could
notbecalculated.
© 2013 Anatomical Society
Alligator mandibular bone strain, L. B. Porro et al.212

strain orientations on the ventral aspect of the FEM may be
a result of numerous sutural contacts – note that during
middle biting, there is a distinct line of reversal in strain ori-
entation between the splenial and dentary bones.
Because of high variability in in vivo principal strain orien-
tations on the ventral surface of the mandible during ipsi-
lateral biting, strain orientations in the working side FEM
broadly overlap in vivo strain orientations at all gage sites
except the posterior dentary gage of Experiment 56. The
range of strain orientations predicted by the balancing side
FEM resembled in vivo e1 orientations recorded in Experi-
ments 75, 99 and 103 during contralateral biting but did
not match strain orientations from Experiments 56 or 102.
Principal strain magnitudes and ratios
Within-gage in vivo e1 means (Tables 2–6) ranged from 34
to 1679 le and the grand mean for all gage sites was
924 le. Within-gage in vivo e2 means ranged from �145 to
�1849 le with a grand mean of �955 le for all gage sites.
There was no difference in mean e1 strain magnitudes on
the working and balancing sides (Table 12); in contrast,
mean e2 strain magnitudes were greater on the balancing
side. During both ipsilateral and contralateral biting, in vivo
principal strain magnitudes were higher in the dentary than
in the splenial.
The grand e1/e2 mean for all in vivo experiments was 1.18.
The e1/e2 ratio was usually > 1 on the working side mandible
as a whole as well as in the working side dentary, but < 1
on the balancing side mandible and dentary. These results
indicate that the working side mandible (all bones) and the
dentary experience predominantly tension, whereas these
structures on the balancing side experience predominantly
compression. The e1/e2 ratio was < 1 in the splenial during
both ipsilateral and contralateral biting, suggesting that
the splenial is primarily under compression.
e1 and e2 strains were between two and five times higher
during in vivo experiments than those exhibited by the
FEM (Table 12). Like the in vivo results, the FEM exhibited
higher e2 strains (as well as higher e1 strains) on the balanc-
ing side than on the working side. Unlike the in vivo
results, strains were not consistently higher in the dentary
of the FEM than in the splenial. e1/e2 ratios in the FEM were
always higher on the working side than on the balancing
side. Unlike the in vivo experiments, in which the splenial
was always in compression, only the balancing side splenial
of the FEM exhibited an e1/e2 ratio < 1.
Shear strain
Within-gage means of in vivo maximum shear strain ranged
from 197 to 3528 le, the grand mean for all gage sites being
Table 11 Two-way ANOVA comparing variation within individual gage sites or between research subjects (‘Individual’) and with changes in bite
location (‘Bite Point’) in four regions of the Alligator mandible.
Dorsolateral WS Dorsolateral BS
Source df CHI2 P-value Source df F P-value
‘Individual’ 4 7.96897 0.092721 ‘Individual’ 2 17.46796 0.003149
‘Bite Point’ 6 41.2755 2.56E-07 ‘Bite Point’ 3 3.814009 0.076628
Lateral WS Lateral BS
Source df CHI2 P-value Source df CHI2 P-value
‘Individual’ 6 211.6827 0 ‘Individual’ 6 244.7956 0
‘Bite Point’ 8 16.09427 0.04105 ‘Bite Point’ 8 16.38079 0.037243
Medial WS Medial BS
Source ‘df’ ‘CHI2’ ‘P-value’ Source ‘df’ ‘CHI2’ ‘P-value’
‘Individual’ 6 54.52522 5.78E-10 ‘Individual’ 6 213.2399 0
‘Bite Point’ 8 71.97532 1.98E-12 ‘Bite Point’ 8 7.993922 0.434064
Ventral WS Ventral BS
‘Source’ ‘df’ ‘CHI2′ ‘P-value’ ‘Source’ ‘df’ ‘CHI2′ ‘P-value’
‘Individual’ 14 168.7355 0 ‘Individual’ 14 303.9026 0
‘Bite Point’ 8 48.30766 8.63E-08 ‘Bite Point’ 8 33.75298 4.50E-05
© 2013 Anatomical Society
Alligator mandibular bone strain, L. B. Porro et al. 213
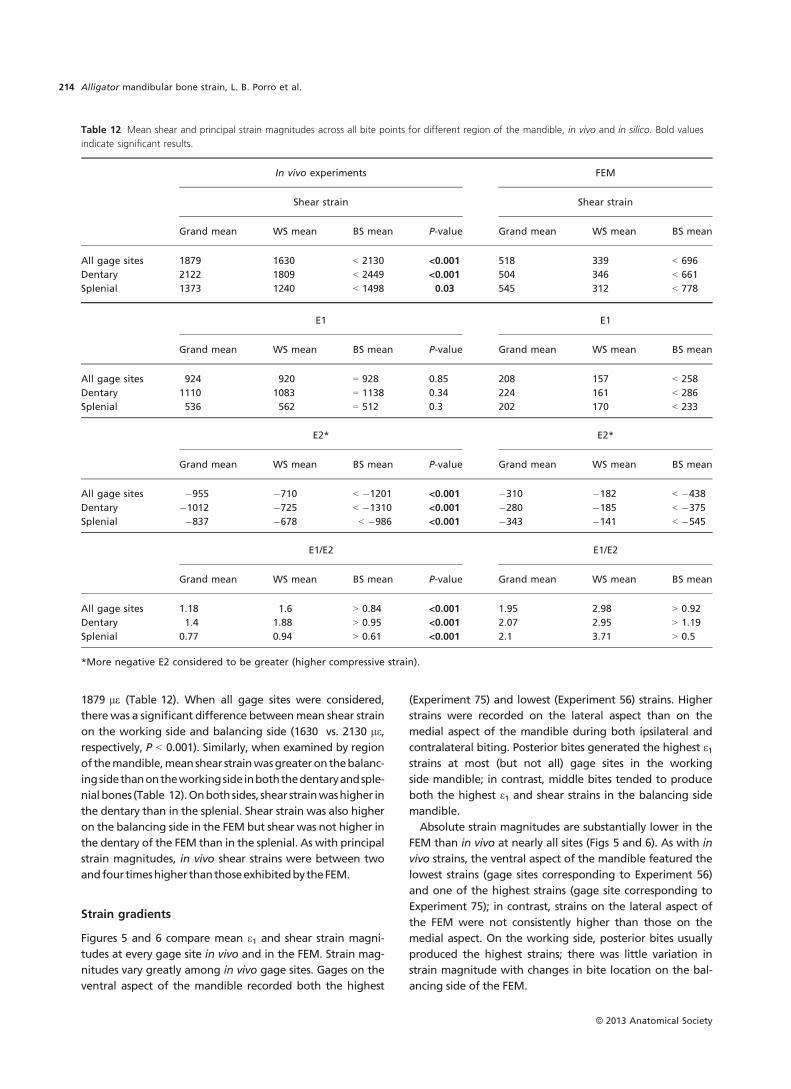
1879 le (Table 12). When all gage sites were considered,
therewas a significant difference betweenmean shear strain
on the working side and balancing side (1630 vs. 2130 le,
respectively, P < 0.001). Similarly, when examined by region
of themandible,meanshear strainwasgreateronthebalanc-
ingsidethanontheworkingsideinboththedentaryandsple-
nialbones (Table 12).Onbothsides, shear strainwashigher in
the dentary than in the splenial. Shear strain was also higher
on the balancing side in the FEM but shear was not higher in
the dentary of the FEM than in the splenial. As with principal
strain magnitudes, in vivo shear strains were between two
andfour timeshigher thanthoseexhibitedbytheFEM.
Strain gradients
Figures 5 and 6 compare mean e1 and shear strain magni-
tudes at every gage site in vivo and in the FEM. Strain mag-
nitudes vary greatly among in vivo gage sites. Gages on the
ventral aspect of the mandible recorded both the highest
(Experiment 75) and lowest (Experiment 56) strains. Higher
strains were recorded on the lateral aspect than on the
medial aspect of the mandible during both ipsilateral and
contralateral biting. Posterior bites generated the highest e1strains at most (but not all) gage sites in the working
side mandible; in contrast, middle bites tended to produce
both the highest e1 and shear strains in the balancing side
mandible.
Absolute strain magnitudes are substantially lower in the
FEM than in vivo at nearly all sites (Figs 5 and 6). As with in
vivo strains, the ventral aspect of the mandible featured the
lowest strains (gage sites corresponding to Experiment 56)
and one of the highest strains (gage site corresponding to
Experiment 75); in contrast, strains on the lateral aspect of
the FEM were not consistently higher than those on the
medial aspect. On the working side, posterior bites usually
produced the highest strains; there was little variation in
strain magnitude with changes in bite location on the bal-
ancing side of the FEM.
Table 12 Mean shear and principal strain magnitudes across all bite points for different region of the mandible, in vivo and in silico. Bold values
indicate significant results.
In vivo experiments FEM
Shear strain Shear strain
Grand mean WS mean BS mean P-value Grand mean WS mean BS mean
All gage sites 1879 1630 < 2130 <0.001 518 339 < 696
Dentary 2122 1809 < 2449 <0.001 504 346 < 661
Splenial 1373 1240 < 1498 0.03 545 312 < 778
E1 E1
Grand mean WS mean BS mean P-value Grand mean WS mean BS mean
All gage sites 924 920 = 928 0.85 208 157 < 258
Dentary 1110 1083 = 1138 0.34 224 161 < 286
Splenial 536 562 = 512 0.3 202 170 < 233
E2* E2*
Grand mean WS mean BS mean P-value Grand mean WS mean BS mean
All gage sites �955 �710 < �1201 <0.001 �310 �182 < �438
Dentary �1012 �725 < �1310 <0.001 �280 �185 < �375
Splenial �837 �678 < �986 <0.001 �343 �141 < �545
E1/E2 E1/E2
Grand mean WS mean BS mean P-value Grand mean WS mean BS mean
All gage sites 1.18 1.6 > 0.84 <0.001 1.95 2.98 > 0.92
Dentary 1.4 1.88 > 0.95 <0.001 2.07 2.95 > 1.19
Splenial 0.77 0.94 > 0.61 <0.001 2.1 3.71 > 0.5
*More negative E2 considered to be greater (higher compressive strain).
© 2013 Anatomical Society
Alligator mandibular bone strain, L. B. Porro et al.214

Contour plots of von Mises strain in the FEM reveal strain
gradients throughout the mandible during biting (Fig. 7).
On both sides of the lower jaw, the articulars, surangulars,
ventral angulars, and bone around the external mandibular
fenestrae exhibit high strains. Additionally, the ventral
aspect of the balancing side ramus (dentary and splenial)
experiences high strains. The working side ramus is less
strained overall than the balancing side but exhibits high
strain immediately below the bite point.
In vivo neutral axis
Neutral axis orientation in the working and balancing sides
is presented for different bite points and experiments
(Figs 8 and 9, Table 14). The orientation of the neutral axis
is measured relative to the horizontal, with positive and
negative angles indicating clockwise and counterclockwise
rotations, respectively. Note that while the neutral axis ori-
entation is a calculated value based on strain at individual
gages, its location relative to the cortex was arbitrarily
placed through the center of the cross-section.
On the working side, neutral axis orientations exhibit
increased variability as bite point moves from anterior to
posterior; the range of neutral axis orientations across all
experiments is 68.9, 98.0, 118.3 and 104.6° for anterior/mid-
dle, middle, middle/posterior and posterior bite points,
respectively. Although mean neutral axis orientations across
bite points and experiments show some degree of consis-
tency, they provide conflicting results in terms of bending
regime. In two experiments (102 and 103), mean neutral
axis orientations indicate negative dorsoventral bending
(i.e. the dorsal border of the mandible under tension). How-
ever, in Experiment 75 the dorsal border is under compres-
sion. Finally, in Experiment 99 the mean neutral axis
orientation indicates mediolateral bending. Maximum and
minimum normal strains on the working side are similarly
variable (Fig. 8, Table 14). Absolute normal strains range
from 5780 le (anterior/middle biting, Experiment 103) to
�6130 le (posterior biting, Experiment 75). In two experi-
ments (Experiment 75 and 102), maximum and minimum
normal strains increase with more posterior bites, but no
obvious trend exists in Experiments 99 and 103. In summary,
neutral axis orientations for the working side are variable,
with little consistency across experiments and large stan-
dard deviations within experiments.
In contrast, average neutral axis orientations on the bal-
ancing side show little variation, either across different bite
point locations or across experiments (Fig. 9, Table 14). The
exception is Experiment 99, which exhibits high variability,
both within and across bite points. For Experiments 75, 102,
and 103, mean neutral axis orientation for all contralateral
bite point locations ranges from 1.8 to 26.8°. This suggests
that the balancing side consistently experiences negative
dorsoventral bending (the dorsal border under tension).
Additionally, there may be some lateral bending (with the
lateral aspect of the mandible under tension), as indicated
by the consistent counterclockwise rotation of the neutral
axis. Maximum normal strains on the balancing side are
similar to those on the working side but minimum nor-
mal strains are not as extreme as those recorded on the
Table 13 ANOVA testing for differences in e1 principal strain orientation during biting at different locations along the toothrow.
Gauge location
Experiment
number
Working side bite
points represented*
P-value for working
side differences**
Balancing side bite
points represented*
P-value for balancing
side differences**
Dorsolateral dentary 99 2–5 n.s. 3, 5 0.008
102 2–5 <0.0001 3–5 0.007
103 2–5 0.003 2–5 n.s.
Lateral dentary 75 2–5 n.s. 1–5 0.003
99 2–5 n.s. 1, 3–5 n.s.
102 1–5 n.s. 1–5 <0.0001
103 2–5 n.s. 2–5 0.007
Ventral dentary 56 2–5 0.016 1, 5 0.007
56 2–5 0.007 1,5 n.s.
75 2–5 <0.0001 1–5 <0.0001
99 2–5 <0.0001 1, 3–5 n.s.
102 1–5 <0.0001 1–5 n.s.
103 2–5 <0.0001 2–5 n.s.
Ventral angular 56 2–5 n.s. 1,5 n.s.
Ventral splenial 102 1–5 <0.0001 1–5 n.s.
Medial splenial 75 2–5 0.006 1–5 n.s.
99 2–5 <0.0001 1, 3–5 0.047
102 1–5 <0.0001 1–5 n.s.
103 2–5 <0.0001 2–5 n.s.
*Bite points 1–5 represent bite regions from anterior to posterior.
**P-values represent existence of significant differences among all e1 principal strain orientations at bite points represented.
© 2013 Anatomical Society
Alligator mandibular bone strain, L. B. Porro et al. 215

working side. There is no clear trend of increasing or
decreasing normal strains for different bite points. In
summary, neutral axis orientations on the balancing side,
with the exception of one experiment, show low vari-
ability across contralateral bite points or experiments.
FEM neutral axis
Strain normal to the middle posterior section of the Alliga-
tor FEM during biting at different locations is illustrated for
the working (Fig. 8) and balancing (Fig. 9) sides, and neu-
tral axis orientation and strain magnitudes are listed in
Table 14. Unlike the in vivo neutral axis, which is assumed
to be straight, the FEM indicates that the neutral axis is
more sinuous and its course is influenced by internal struc-
tures such as sutures, cavities and tooth roots. Nonetheless,
the neutral axis in the FEM passes near the section geomet-
ric centroid in nearly all cases.
On the working side, the neutral axis of the Alligator
FEM rotates counterclockwise as bite point moves from
anterior/middle to posterior (Fig. 8). During anterior bit-
ing, the dorsal margin of the mandible is under tension,
whereas the ventral border experiences compression, indi-
cating negative bending. During middle bites, compressive
strain shifts to the lateral aspect of the mandible and ten-
sion occurs on the medial aspect, suggesting the mandible
is being bent medially. During middle posterior and pos-
terior bites, the neutral axis is obliquely oriented, with
compression occurring dorsally and laterally, and tension
located ventrally and medially, indicating positive bending
of the mandible with some medial bending.
On the balancing side, the orientation of the neutral
axis does not change with changes in contralateral bite
point, being obliquely oriented through the corpus. The
dorsal margin of the mandible is always in tension,
whereas its ventral border is in compression, indicating
negative bending. Because compression is shifted slightly
to the medial surface (and tension is shifted laterally),
there also appears to be some lateral bending of the
balancing side.
Fig. 4 Strain fields in the FEM (finite element
model). Vectors indicate maximum principal
strain orientations at the centroid of each
element in the FEM in lateral (top) medial
(middle) and ventral (bottom) views of the
working and balancing sides of the model.
Note that the working side in the FEM is the
right mandible and the balancing side is the
left mandible. Black circles indicate the
location of in vivo gage sites from which data
was extracted. Strain fields generated in the
working side during middle and posterior
bites are shown to illustrate the impact of
bite point on strain orientations; strain fields
showed little variability with change in bite
point on the balancing side, thus only middle
bites are illustrated.
© 2013 Anatomical Society
Alligator mandibular bone strain, L. B. Porro et al.216
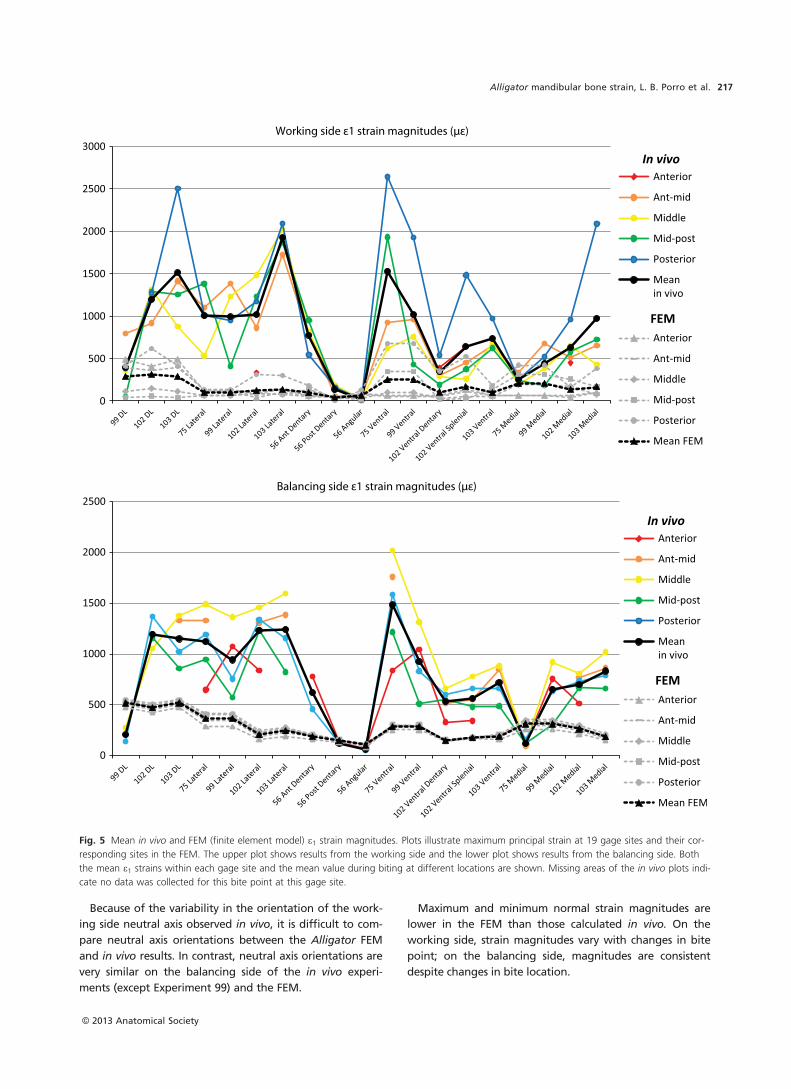
Because of the variability in the orientation of the work-
ing side neutral axis observed in vivo, it is difficult to com-
pare neutral axis orientations between the Alligator FEM
and in vivo results. In contrast, neutral axis orientations are
very similar on the balancing side of the in vivo experi-
ments (except Experiment 99) and the FEM.
Maximum and minimum normal strain magnitudes are
lower in the FEM than those calculated in vivo. On the
working side, strain magnitudes vary with changes in bite
point; on the balancing side, magnitudes are consistent
despite changes in bite location.
Fig. 5 Mean in vivo and FEM (finite element model) e1 strain magnitudes. Plots illustrate maximum principal strain at 19 gage sites and their cor-
responding sites in the FEM. The upper plot shows results from the working side and the lower plot shows results from the balancing side. Both
the mean e1 strains within each gage site and the mean value during biting at different locations are shown. Missing areas of the in vivo plots indi-
cate no data was collected for this bite point at this gage site.
© 2013 Anatomical Society
Alligator mandibular bone strain, L. B. Porro et al. 217
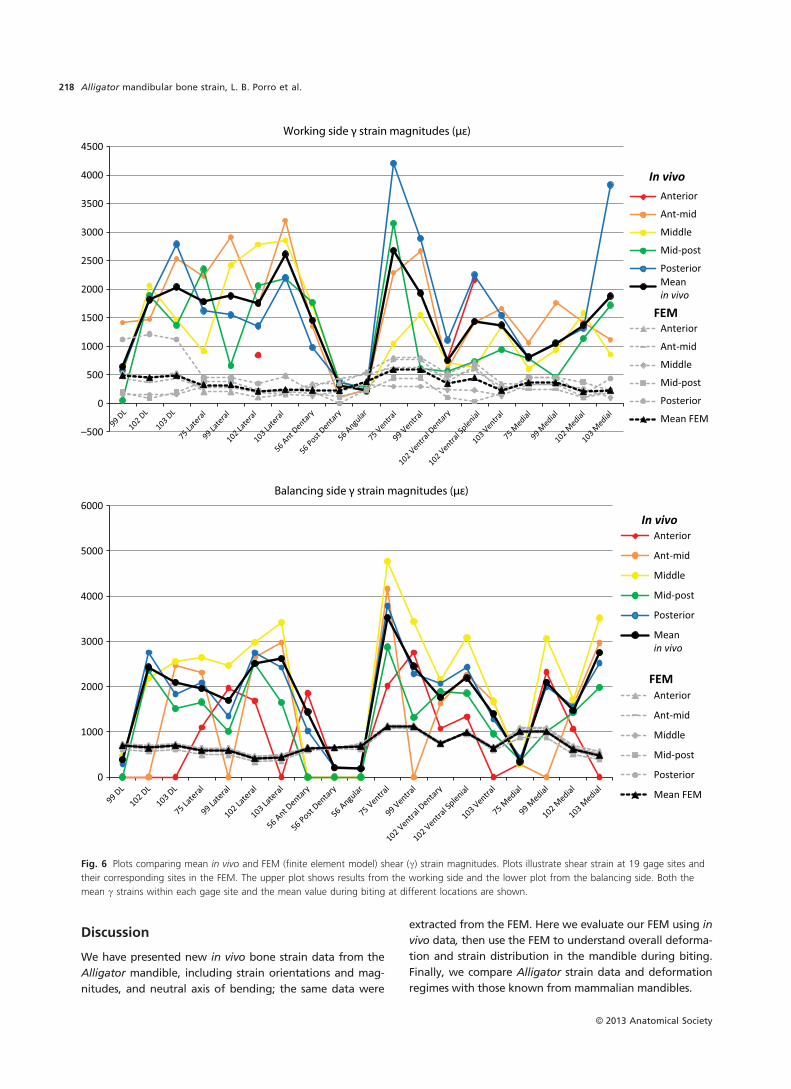
Discussion
We have presented new in vivo bone strain data from the
Alligator mandible, including strain orientations and mag-
nitudes, and neutral axis of bending; the same data were
extracted from the FEM. Here we evaluate our FEM using in
vivo data, then use the FEM to understand overall deforma-
tion and strain distribution in the mandible during biting.
Finally, we compare Alligator strain data and deformation
regimes with those known from mammalian mandibles.
Fig. 6 Plots comparing mean in vivo and FEM (finite element model) shear (c) strain magnitudes. Plots illustrate shear strain at 19 gage sites and
their corresponding sites in the FEM. The upper plot shows results from the working side and the lower plot from the balancing side. Both the
mean c strains within each gage site and the mean value during biting at different locations are shown.
© 2013 Anatomical Society
Alligator mandibular bone strain, L. B. Porro et al.218
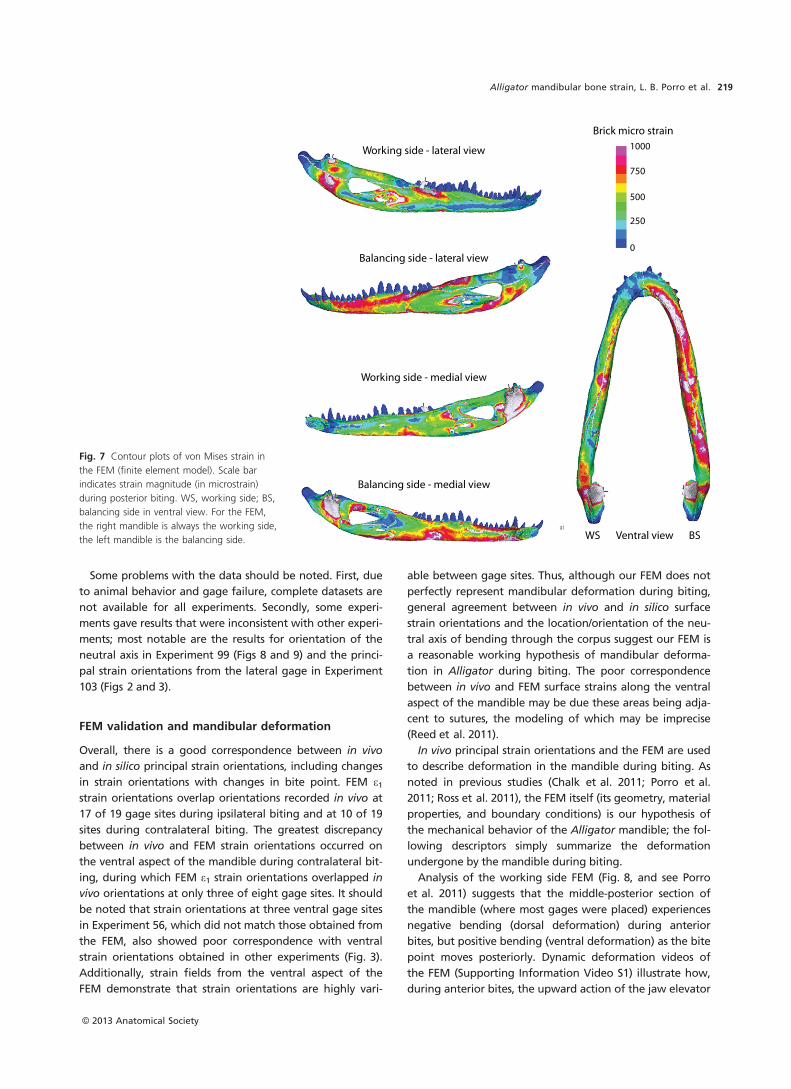
Some problems with the data should be noted. First, due
to animal behavior and gage failure, complete datasets are
not available for all experiments. Secondly, some experi-
ments gave results that were inconsistent with other experi-
ments; most notable are the results for orientation of the
neutral axis in Experiment 99 (Figs 8 and 9) and the princi-
pal strain orientations from the lateral gage in Experiment
103 (Figs 2 and 3).
FEM validation and mandibular deformation
Overall, there is a good correspondence between in vivo
and in silico principal strain orientations, including changes
in strain orientations with changes in bite point. FEM e1strain orientations overlap orientations recorded in vivo at
17 of 19 gage sites during ipsilateral biting and at 10 of 19
sites during contralateral biting. The greatest discrepancy
between in vivo and FEM strain orientations occurred on
the ventral aspect of the mandible during contralateral bit-
ing, during which FEM e1 strain orientations overlapped in
vivo orientations at only three of eight gage sites. It should
be noted that strain orientations at three ventral gage sites
in Experiment 56, which did not match those obtained from
the FEM, also showed poor correspondence with ventral
strain orientations obtained in other experiments (Fig. 3).
Additionally, strain fields from the ventral aspect of the
FEM demonstrate that strain orientations are highly vari-
able between gage sites. Thus, although our FEM does not
perfectly represent mandibular deformation during biting,
general agreement between in vivo and in silico surface
strain orientations and the location/orientation of the neu-
tral axis of bending through the corpus suggest our FEM is
a reasonable working hypothesis of mandibular deforma-
tion in Alligator during biting. The poor correspondence
between in vivo and FEM surface strains along the ventral
aspect of the mandible may be due these areas being adja-
cent to sutures, the modeling of which may be imprecise
(Reed et al. 2011).
In vivo principal strain orientations and the FEM are used
to describe deformation in the mandible during biting. As
noted in previous studies (Chalk et al. 2011; Porro et al.
2011; Ross et al. 2011), the FEM itself (its geometry, material
properties, and boundary conditions) is our hypothesis of
the mechanical behavior of the Alligator mandible; the fol-
lowing descriptors simply summarize the deformation
undergone by the mandible during biting.
Analysis of the working side FEM (Fig. 8, and see Porro
et al. 2011) suggests that the middle-posterior section of
the mandible (where most gages were placed) experiences
negative bending (dorsal deformation) during anterior
bites, but positive bending (ventral deformation) as the bite
point moves posteriorly. Dynamic deformation videos of
the FEM (Supporting Information Video S1) illustrate how,
during anterior bites, the upward action of the jaw elevator
Fig. 7 Contour plots of von Mises strain in
the FEM (finite element model). Scale bar
indicates strain magnitude (in microstrain)
during posterior biting. WS, working side; BS,
balancing side in ventral view. For the FEM,
the right mandible is always the working side,
the left mandible is the balancing side.
© 2013 Anatomical Society
Alligator mandibular bone strain, L. B. Porro et al. 219

muscles results in the mandible being bent dorsally. During
posterior bites, the posterior portion of the mandible expe-
riences dorsal deformation, whereas the portion anterior to
the bite point experiences ventral deformation due to
forces. At all bite points, the working side mandible is
deformed medially, and the ventral margin of the mandible
is inverted while the tooth row is everted, indicative of tor-
sion (sensu Figs 9 and 14 in Porro et al. 2011). As in the
FEM, during anterior biting in most in vivo experiments e1 is
directed anteroinferiorly on the upper lateral aspect of the
working side, rotating clockwise as bite point shifts poste-
riorly. Strains on the ventral surface of the mandible were
directed along the long-axis of the mandible and rotated
counterclockwise with a posterior shift in bite point.
These strain orientations suggest a combination of nega-
tive dorsoventral bending and positive torsion of the
working side mandible (eversion of anterior toothrow rel-
ative to gaged sections) during anterior biting. As the
bite point moves posteriorly, positive bending becomes
more important.
Examination of the balancing side FEM (Fig. 9, and see
Porro et al. 2011) reveals that, regardless of bite point on
the working side mandible, the most important deforma-
tion regime on the balancing side is (negative) dorsoventral
bending, i.e. the mandible is bent upwards in the middle so
that the dorsal edge is in longitudinal tension and the ven-
tral edge is in longitudinal compression. This loading
regime is due to the upwardly directed action of the jaw
elevators being opposed at the symphysis and jaw joint.
The second most important deformation regime in the bal-
ancing side mandible is torsion due to inversion of the ante-
rior toothrow relative to the section of the mandible where
strain was recorded. Dynamic views of the FEM show inver-
sion of the balancing side tooth row (Supporting Informa-
tion Videos S1 and S2). In vivo, the lateral orientation of e1on the ventral surface of the balancing side mandible is
Fig. 8 Orientation of the neutral axis through
the working side. Neutral axis is shown within
corpus cross-sections from in vivo
experiments and the FEM during biting at five
points. All images represent a section of the
right mandible (middle-posterior region)
viewed from the rear. For all sections,
maximum and minimum normal strains in
these sections are shown above and below
the section. In vivo sections are CT scans
taken from individual research subjects at the
section of the gages. For in vivo sections, the
red line indicates the neutral axis (assumed to
be straight and to pass through the section
centroid); the gray areas on either side of the
neutral axis indicate one standard deviation.
Green circles indicate the location of the
gages in each experiment. N.d., no data for a
bite point. For the FEM sections, colors
indicate the magnitude and type of normal
strain (tension as positive values and ‘hot’
colors, compression as negative values and
‘cool’ colors). The neutral axis passes through
the center of the light green contour and is
shown as a black dotted line. Very high
tensile strains (especially in sutures) are
shown in white and very high compressive
strains in gray.
© 2013 Anatomical Society
Alligator mandibular bone strain, L. B. Porro et al.220

indicative of negative dorsoventral bending regime. More-
over, the anterosuperiorly directed components of e1 on
the lateral aspect of the mandible in vivo and the anteroin-
feriorly directed components on the medial aspect are sug-
gestive of the torsional regime described above. As in the
FEM, in vivo balancing side strain orientations change little
with changes in bite location. Cross-sections through both
the in vivo mandible and FEM (Fig. 9) corroborate predic-
tions from strain orientations, demonstrating that the man-
dible is being bent dorsally (negative bending) at all bite
points, although slight counterclockwise rotation of the
neutral axis suggests some lateral bending.
For all gage sites in all experiments, e1 orientation during
ipsilateral biting is both different from and more variable
(with changes in bite point) than during contralateral bites –
13 of the 19 gages exhibited statistically significant differ-
ences in e1 orientations (P < 0.05) for different bite points
during ipsilateral bites; only eight of 19 gage sites exhibited
significant differences in e1 orientations with changes in bite
point during contralateral bites (Table 13). The orientation
of the neutral axis is also more variable on the working side
than on the balancing side. Thus, both in vivo and in silico
results clearly demonstrate the impact of bite force and bite
location on the mechanical behavior of the working side.
Furthermore, inter-experimental variation in e1 orientation
is greater on the working side than on the balancing side.
Lastly, on the working side, variation in e1 orientation is low-
est on the lateral aspect of the mandible (mean r = 0.83),
and highest on the medial aspect (mean r = 0.49); whereas
on the balancing side, variation in e1 orientation was lowest
on the medial aspect of the mandible (mean r = 0.97).
Circular-linear analyses reveal correlations between strain
orientation and magnitude at some gage sites. These corre-
lations are not unexpected as there can only be one load-
Fig. 9 Orientation of the neutral axis through
the balancing side. Neutral axis is shown
within corpus cross-sections from in vivo
experiments and the FEM during biting at five
contralateral points. All images represent a
section of the right mandible (middle-
posterior region) viewed from the rear. For all
sections, maximum and minimum normal
strains in these sections are shown above and
below the section. In vivo sections are CT
scans taken from individual research subjects
at the section of the gages. For in vivo
sections, the red line indicates the neutral axis
(assumed to be straight and pass through the
section centroid); the gray areas on either
side of the neutral axis indicate one standard
deviation. Green circles indicate the location
of the gages in each experiment. N.d., no
data for a bite point. For the FEM sections,
colors indicate the magnitude and type of
normal strains (tension as positive values and
‘hot’ colors, compression as negative values
and ‘cool’ colors). The neutral axis passes
through the center of the light green contour
and is shown as a dotted line. Very high
tensile strains are shown in white and very
high compressive strains in gray.
© 2013 Anatomical Society
Alligator mandibular bone strain, L. B. Porro et al. 221

Table 14 Descriptive statistics for orientation of neutral axis of bending (a) and calculated maximum and minimum normal strains for all experi-
ments and the FEM.
Experiment Bite side
Bite
position* n
Neutral axis
orientation (a)
Maximum
calculated normal
strain (le)
Minimum
calculated normal
strain (le)
Mean SD Mean SD Mean SD
75 Left (WS) a/m 4 11.6 32.4 722 580 �675 381
m 6 �24.1 23 400 246 �725 822
m/p 12 �11.8 15.1 1407 888 �3179 2729
p 8 �2.8 2.7 2172 844 �6130 2463
All left 30 �8.8 20.2 1318 972 �3142 2989
Right (BS) a 4 4.3 8.5 2878 659 �986 198
a/m 3 7.4 0.9 5680 931 �1855 271
m 19 6.5 1.2 6493 1518 �2082 470
m/p 8 1.8 9.7 2373 2018 �1709 1414
p 5 6.2 4.6 5122 2375 �1793 670
All right 39 5.5 5.3 5056 2367 �1829 774
All bites 69 0.1 14.8 3637 2671 �2328 2025
99 Right (WS) a/m 2 30 30.3 585 186 �1140 676
m 9 48.8 26.1 290 188 �471 312
m/p 1 86.3 53 �96
p 9 100.5 50.9 388 193 �456 475
All right 21 69.6 46 346 206 �508 444
Left (BS) a 2 22.6 1.7 1850 431 �513 126
m 3 �37.6 52.3 1164 337 �939 535
m/p 7 33.5 3.4 745 310 �288 71
p 3 �2.4 51.5 1082 725 �575 219
All left 15 10.6 39.9 1044 535 �506 340
All bites 36 45.9 52.1 629 507 �507 400
102 Left (WS) a 2 �49.1 1.8 163 8 �433 149
a/m 9 0.1 38.3 429 402 �121 183
m 19 �5 14.4 1096 561 �139 167
m/p 6 �6.9 4.3 1756 1232 �343 319
p 9 �16.6 19.1 1931 803 �298 384
All left 45 �8.5 23 189 880 �212 258
Right (BS) a 2 26.5 2.4 757 36 �671 46
a/m 2 26.8 4.7 1172 439 �1055 281
m 9 18.1 6.9 2001 695 �1312 440
m/p 11 17.1 2.6 2012 927 �1242 547
p 12 15.3 3.4 2267 1146 �1359 654
All right 36 17.8 5.4 1978 962 �1256 541
All bites 81 3.2 22 1532 986 �674 653
103 Right (WS) a/m 9 14.5 3 5780 1010 �1101 436
m 3 5.6 19.7 5332 2985 �563 47
m/p 4 28.3 11.2 3009 1425 �270
p 8 �4.1 14.2 5135 1501
All right 24 9.5 15.9 5047 1739 �645 241
Left (BS) a/m 6 13.3 3.1 4664 1063 �1702 355
m 3 13.6 0.4 4948 945 �1751 282
m/p 6 12.1 4.4 2869 1295 �984 498
p 4 14.9 5 3260 1193 �1077 438
All left 19 13.6 3.7 3846 1392 �1351 524
All bites 43 �43.5 45.7 3137 1486 �2191 1447
© 2013 Anatomical Society
Alligator mandibular bone strain, L. B. Porro et al.222

ing/stress/strain regime during maximal contraction of the
jaw elevator muscles. As muscle recruitment approaches this
value, there are likely to be fewer ways of generating bite
force.
Strain magnitudes and gradients
Absolute principal and shear strain magnitudes were sub-
stantially lower in our FEM than data recorded at nearly
all corresponding gage sites in vivo. Good correspondence
in principal strain orientation with large discrepancies in
principal strain magnitude is common in validation stud-
ies of vertebrate skulls, being noted when comparing in
vivo and FEM results in the crania of primates (Ross et al.
2005, 2011; Kupczik et al. 2009) and crocodilians (Metzger
et al. 2005). Better correspondence has been found
between FEM and in vitro strain magnitudes in validation
studies of the macaque mandible (Kupczik et al. 2007;
Panagiotopoulou et al. 2010, 2011), ostrich mandible
(Rayfield, 2011) and pig cranium (Bright & Rayfield,
2011). However, it should be noted that in some of these
studies material properties were changed and models
made less stiff before comparable strain magnitudes were
obtained in post hoc analyses.
Various factors may be responsible for the discrepancy in
strain magnitudes between the in vivo data and the FEM.
We used a value of 300 kN m�2 for the specific tension of
muscle, a value commonly found in the literature (Sinclair
& Alexander, 1987); nonetheless, it is possible that Alligator
jaw muscle contracts with greater force. Recent multi-body
dynamics analyses of the diapsid Sphenodon have sug-
gested that the specific tension of jaw muscles in this taxon
must be significantly higher (890 kN m�2) to generate bite
forces recorded in vivo (Curtis et al. 2010); furthermore,
FEA of the skulls of multiple crocodilian species using a spe-
cific muscle tension of 300 kN m�2 resulted in bite forces
consistently and significantly lower than those reported in
vivo (Erickson et al. 2012; Walmsley et al. 2013). Our model
incorporated recently reported material properties for Alli-
gator mandibular cortical bone (Zapata et al. 2010); how-
ever, there are no data on the material properties of
reptilian cranial sutures. It is possible that the Young’s
modulus assigned to the sutures within our model is too
elastic, allowing the sutures to act as ‘strain sinks’ that
decrease strain in surrounding bone (Buckland-Wright,
1978; Rafferty et al. 2003). Moreover, our model does not
incorporate less stiff trabecular bone in the articular of the
Alligator mandible, possibly rendering the model too stiff.
Lastly, constraints have a tremendous impact on strain
magnitudes within FEMs (Marinescu et al. 2005). We con-
strained the mandible at three nodes aligned mediolateral-
ly across each articular, as well as a single node on the
medial aspect of each mandible. This combination of con-
straints was found to produce the closest correspondence
to in vivo data in terms of strain orientations. However, it
is possible that our model is over-constrained, resulting in
low strain magnitudes. Ongoing sensitivity analyses will
shed further light on the input parameters impacting
model behavior.
Strain gradients as visualized in FEA contour plots
reveal very high strains at the articular and surrounding
the external mandibular fenestra, suggesting that mor-
phology in these regions may be better optimized for
resisting forces exerted by the jaw adductors and joint
reaction forces than those related to bite force. Interest-
ingly, the working side mandibular corpus exhibits low
Table 14. (continued)
Experiment Bite side
Bite
position* n
Neutral axis
orientation (a)
Maximum
calculated normal
strain (le)
Minimum
calculated normal
strain (le)
Mean SD Mean SD Mean SD
FEM Right (WS) a 7 672 �423
a/m 21 441 �276
m �62 230 �249
m/p �43 524 �901
p �23 412 �381
All left �20 456 �446
Left (BS) a 28 492 �528
a/m 31 512 �520
m 31 501 �524
m/p 31 417 �524
p 30 479 �502
All right 30 480 �520
All bites 5 468 �483
a, anterior; a/m, anterior/middle; m, middle; m/p, middle/posterior; p. posterior.
© 2013 Anatomical Society
Alligator mandibular bone strain, L. B. Porro et al. 223

strains (except immediately below the bite point) while
the ventral aspect of the balancing side and the symphy-
sis are highly strained. This concurs with in vivo and FEM
strain data that demonstrate that the balancing side man-
dible experiences higher principal and shear strains than
the working side.
Form–function relationships in the Alligator mandible
Our in vivo experiments and FE modeling only addressed
the mechanical behavior of the mandible during biting; we
did not elicit or attempt to model other feeding behaviors
such as prey shaking and body rolling. Nevertheless, some
comments regarding form–function relationships in the Alli-
gator mandible are possible.
Van Drongelen & Dullemeijer’s (1982) analysis of mandi-
ble morphology in Caiman assumed that resistance to bend-
ing stress played a significant role in crocodilian mandible
design. Although the in vivo and FEM results presented
here and in Porro et al. (2011) confirm this assumption, they
also suggest that other loading regimes are important, such
as torsion and mediolateral bending. Moreover, (Porro
et al. 2011) demonstrated that mandibular geometry inter-
acts with bone and suture material properties to improve
resistance of the mandible to external forces. A complete
optimization analysis of Alligator mandible form should
take these into account.
How does the Alligator mandible withstand the high
strains recorded in vivo and estimated within cross-sections
(Figs 8 and 9)? The strains recorded here are the largest
reported from any vertebrate mandible: > 4000 le in ten-
sion in the biting side ventral dentary in Experiment 75
(Table 3), and < �3400 le in compression from the same
gage on the working side. These values exceed those
reported from the limb bones of galloping mammals (Biew-
ener & Taylor, 1986), which are generated when the body
mass is supported on one limb, whereas the mandibular
strains recorded in our experiments were generated by the
jaw elevator muscles alone. Moreover, if our calculations of
normal strains in mandibular cross-sections are correct, max-
imum normal strains in the mandible exceed 5000 or even
6000 le in tension (Figs 8 and 9). Given that vertebrate
bone yields at around 4500–9400 le under static loading
(Currey, 1990), and at even lower magnitudes under repeti-
tive loading conditions, it seems unlikely that Alligator
mandibles experience these strains regularly. Nevertheless,
we conjecture that the defensive bites elicited in experi-
mental settings may have resulted in close to the maximum
stress and strains experienced by the Alligatormandible.
Comparison of mandible deformation in Alligator
and mammals
The only other vertebrates for which extensive in vivo man-
dibular bone strain data are available are primate and
ungulate mammals. The alligator feeding system differs
from that of mammals both structurally (previously dis-
cussed) and in various functional aspects, including lack of
translation at the craniomandibular joint, the magnitude of
the bite forces experienced by the mandible, and the much
lower number of daily loading events. These differences
make it difficult to isolate reasons for differences in defor-
mation and strain regimes. Nevertheless, some interesting
observations are possible.
Free body analysis and in vivo bone strains suggest that
during mastication and biting, the working side mandible
of primates is twisted about its long axis, with the tooth
row and mandibular angle being everted. Additionally, the
corpus is sheared perpendicular to its long axis and bent in
sagittal planes; however, these shear and bending stresses
are less important than torsion on the working side. The
balancing side primate mandible is bent during mastica-
tion, but both bent and twisted during isometric biting
(Hylander, 1977, 1979a,b, 1981, 1984).
In Alligator, the deformation regime of the balancing
side mandible closely resembles that of anthropoid pri-
mates, i.e. strong negative bending. In contrast, torsion is
much less important than dorsoventral bending in the
working side Alligatormandible (Porro et al. 2011), a differ-
ence attributable to the relatively longer mandible of Alli-
gator. The most significant differences between primate
and alligator mandible deformation regimes are in the
region of the jaw muscle attachments. In primates the later-
ally directed masseter muscle everts the angle of the mandi-
ble (Hylander, 1979b). In contrast, the angle of the Alligator
mandible is inverted; furthermore, the Alligator mandible
experiences relatively large mediolateral bending stresses
due to the orientation of the jaw elevator muscles, which
generate large reaction forces at the jaw joint and ptery-
goid flange (Porro et al. 2011). The significance of this dif-
ference in loading regime for mandibular design in
mammalian and non-mammalian vertebrates has yet to be
evaluated.
Primates (Hylander et al. 1987), rabbits (Weijs & De
Jongh, 1977) and hyraxes (Lieberman et al. 2004) experi-
ence different loading regimes on the working and bal-
ancing side mandibles; pigs are the only mammal studied
to date that show similar loading regimes on the work-
ing and balancing sides, which may be related to their
isognathous chewing and bilateral mastication (Herring &
Scapino, 1973; Herring et al. 2001). Although mammals
for which electromyographic data are available show dif-
ferences in the magnitude and timing of activation
between working and balancing jaw elevator muscles,
crocodilians are thought to use their jaw elevators syn-
chronously and symmetrically (Van Drongelen & Dullemei-
jer, 1982; Busbey, 1989; Cleuren & De Vree, 1995). This
suggests that differences in stress and strain regimes on
working and balancing side in Alligator are due to differ-
ences in reaction forces.
© 2013 Anatomical Society
Alligator mandibular bone strain, L. B. Porro et al.224

Concluding remarks
The results presented here document for the first time in
vivo bone strain in a sauropsid mandible during feeding.
The deformation regime (inferred from principal strain ori-
entations and neutral axis orientations) and strain magni-
tudes described here will serve as a baseline with which the
mandibles of other sauropsids can be compared. Such
future comparative studies, encompassing crocodilians,
extinct archosaurs, squamates and turtles, may highlight
similarities or differences in the mechanical response of the
mandibles due to diet, feeding behavior and musculature,
reflected in either convergent or disparate mandibular
morphology.
As part of this study, we compared strain magnitudes and
orientations (as well as neutral axes of bending) collected in
vivo to data produced by a high-resolution FEM. Although
this model has been the basis of previous studies, the accu-
racy of its predictions awaited validation against in vivo
data. The results presented here suggest that our FEM of
the Alligator mandible accurately predicts principal strain
and neutral axis orientations (and, by extension, deforma-
tion regime) during biting at different points along the
tooth row. Although FEA results should be validated
against in vivo/in vitro data when feasible, this is not possi-
ble for extinct forms. Our results suggest that given accu-
rate geometry, material properties and boundary
conditions, FEMs of sauropsid mandibles can be used to
model deformation regimes realistically, highlighting the
power of FEA in a comparative context.
In contrast, principal and shear strain magnitudes exhib-
ited by the FEM are substantially lower than those recorded
in vivo. Potential reasons for this discrepancy have previ-
ously been discussed; however, until the underlying cause is
identified, we would caution researchers about using
absolute values obtained from skull FEMs – for example, to
predict maximum bite forces or skull safety factors. Further-
more, our FEM/in vivo comparison suggests that areas
immediately adjacent to the application of loads (jaw joint
and bite point) and areas immediately adjacent to sutures
experience highly variable strain orientations; results from
these areas should be thus be interpreted cautiously.
Both in vivo experimental data and the FEM highlight
differences in the mechanical behavior of the Alligator
mandible compared with that of primate mandibles.
Although the primary deformation regime of the primate
mandible, particularly the working side, is torsion about its
long axis, the mandible of Alligator experiences a greater
degree of dorsoventral bending, due to its relatively greater
length. Furthermore, the medial placement of the jaw ele-
vator muscles in diapsids (compared with their medial and
lateral placement in mammals) reverses the direction of tor-
sion experienced by the posterior portion of the Alligator
mandible compared with that of primates. Strain magni-
tudes recorded in the Alligator mandible are much larger
than those reported in mammals, and higher even than
peak principal strains recorded in the crania of the lizards
Uromastyx and Tupinambis (C. F. Ross, A. Herrel, L. B. Porro,
K. Murray, S. Evans and M. Fagan, in review; L.B. Porro, C.F.
Ross., J. Iriarte-Diaz, J. O’Reilly, S.E. Evans and M.J. Fagan,
unpublished data). Strong strain gradients within the man-
dible, as illustrated by the FEM, suggest that certain regions
of the mandible may be more strongly adapted to resist
feeding forces (either reaction forces at the jaw joint or bite
point or forces exerted by muscles) than other areas.
Both the in vivo and FEM data highlight the impact of
bite point on the mechanical response of the mandible.
Ongoing sensitivity analyses are evaluating the effect of
other input variables, including material properties, con-
straints and muscle force, on model behavior. The avail-
ability of in vivo data will allow us to determine not only
how these input parameters impact behavior, but also
which specific combination produce the most accurate
results.
Acknowledgements
The animal care and veterinary staff at Stony Brook University pro-
vided expert care of our animals. B. Demes kindly provided code in
IGOR Pro 4.0. Justin Lemberg (University of Chicago) segmented CT
scan data of Alligator. Christian Wietholt (Visage Imaging, Inc.) pro-
vided assistance with AMIRA and Anne Delvaux (Beauort Analysis)
provided technical support for STRAND7. Casey Holliday (University of
Missouri) provided his expertise during muscle mapping of the FEM.
Analysis of Alligator jaw muscle architecture was carried out by Fred
Anapol (University of Wisconsin).
Author contributions
All authors conceived of and designed the research. K.A.M.
and C.F.R. collected in vivo data. K.A.M., C.F.R. and L.B.P.
processed and interpreted in vivo data. L.B.P. built, loaded
and interpreted the FEM. J.I.D. and C.F.R. wrote the MATLAB
code for extracting FEM data. J.I.D. extracted and processed
surface strain data from the FEM. L.B.P., K.A.M. and C.F.R.
drafted the manuscript. All authors read and commented
on the manuscript.
References
Bell PR, Snively E, Shychoski L (2009) A comparison of the jaw
mechanics in hadrosaurid and ceratopsid dinosaurs using
finite element analysis. Anat Rec (Hoboken) 292, 1338–1351.
Berens P (2009) CircStat: a MATLAB toolbox for circular statistics.
J Stat Softw 31, p. 21. Available at http://www.jstatsoft.org/
v31/i10.
Biewener AA, Taylor CR (1986) Bone strain: a determinant of
gait and speed? J Exp Biol 123, 383–400.
Bock WJ (1966) An approach to the functional analysis of bill
shape. Auk 83, 10–51.
Bock WJ, Kummer B (1968) The avian mandible as a structural
girder. J Biomech 1, 89–96.
© 2013 Anatomical Society
Alligator mandibular bone strain, L. B. Porro et al. 225

Bock WJ, Von Wahlert G (1965) Adaptation and the form-
function complex. Evolution 19, 269–299.
Bright JA, Rayfield EJ (2011) Sensitivity and ex vivo validation of
finite element models of the domestic pig cranium. J Anat
219, 456–471.
Buckland-Wright JC (1978) Bone structure and the patterns of
force transmission in the in the cat skull (Felis cattus). J Mor-
phol 155, 35–62.
Busbey AB (1989) Form and function of the feedng apparatus
of Alligator mississippiensis. J Morphol 202, 99–127.
Busbey AB (1995) The structural consequences of skull flatten-
ing in crocodilians. In: Functional Morphology in Vertebrate
Paleontology. (ed. Thomason JJ), pp. 173–192, Cambridge:
Cambridge University Press.
Carter DR, Harris WH, Vasu R, et al. (1981) The mechanical and
biological response of cortical bone to in vivo strain histories.
In: Mechanical Properties of Bone (AMD vol. 45). (ed. Cowin
SC), pp. 81–92, New York: American Society of Mechanical
Engineers.
Chalk J, Richmond BG, Ross CF, et al. (2011) A finite element
analysis of masticatory stress hypotheses. Am J Phys Anthropol
145, 1–10.
Cleuren J, Aerts P, De Vree F (1995) Bite and joint force analysis
in Caiman crocodilus. Belg J Zool 125, 79–94.
Currey JD (1990) Physical characteristics affecting the tensile fail-
ure properties of compact bone. J Biomech 23, 837–844.
Currey JD (2002) Bone: Structure and Mechanics. Princeton:
Princeton University Press.
Curtis N, Jones MEH, Lappin AK, et al. (2010) Comparison
between in vivo and theoretical bite performance: using
multi-body modelling to predict muscle and bite forces in a
reptile skull. J Biomech 43, 2804–2809.
Daniel WJT, McHenry C (2001) Bite force to skull stress correla-
tion – modelling the skull of Alligator mississippiensis. In:
Crocodilian Biology and Evolution. (eds Grigg GC, Seebacher
F, Franklin CE), pp. 135–143, Surrey Beatty and Sons: Chipping
Norton.
Demes B (2007) In vivo bone strain and bone functional adapta-
tion. Am J Phys Anthropol 133, 717–722.
Demes B, Qin YX, Stern JT, et al. (2001) Patterns of strain in the
macaque tibia during functional activity. Am J Phys Anthropol
116, 257–265.
Erickson GM, Lappin AK, Vliet KA (2003) The ontogeny of bite-
force performance in American alligator (Alligator mississippi-
ensis). J Zool 260, 317–327.
Erickson GM, Gignac PM, Steppan SJ, et al. (2012) Insights into
the ecology and evolutionary success of crocodilians revealed
through bite-force and tooth-pressure experimentation. PLoS
ONE 7, e31781.
Grosse IR, Dumont ER, Coletta C, et al. (2007) Techniques for
modeling muscle-induced forces in finite element models of
skeletal structures. Anat Rec (Hoboken) 290, 1069–1088.
Herring SW, Scapino R (1973) Physiology of feeding in miniature
pigs. J Morphol 141, 427–460.
Herring SW, Rafferty KL, Liu ZJ, et al. (2001) Jaw muscles and
the skull in mammals: the biomechanics of mastication. Comp
Biochem Physiol Part A 131, 207–219.
Hibbeler RC (2000) Mechanics of Materials. Upper Saddle River,
NJ: Prentice Hall.
Holliday CM, Witmer LM (2007) Archosaur adductor chamber
evolution: integration of musculoskeletal and topological cri-
teria in jaw muscle homology. J Morphol 268, 457–484.
Hylander WL (1977) In vivo bone strain in the mandible of
Galago crassicaudatus. Am J Phys Anthropol 160, 223–240.
Hylander WL (1979a) The functional significance of primate
mandibular form. J Morphol 160, 223–240.
Hylander WL (1979b) Mandibular function in Galago crassicaud-
atus and Macaca fascicularis: an in vivo approach to stress
analysis of the mandible. J Morphol 159, 253–296.
Hylander WL (1981) Patterns of stress and strain in the macaque
mandible. In: Craniofacial Biology. Monograph No. 10, Cranio-
facial Growth Series. (ed. Carlson DS), pp. 1–35, Ann Arbor,
MI: Center for Human Growth and Development.
Hylander WL (1984) Stress and strain in the mandibular symphy-
sis of primates: a test of competing hypotheses. Am J Phys
Anthropol 64, 1–46.
Hylander WL, Crompton AW (1986) Jaw movements and pat-
terns of mandibular bone strain during mastication in the
monkey Macaca fasicularis. Arch Oral Biol 31, 841–848.
Hylander WL, Johnson KR, Crompton AW (1987) Loading pat-
terns and jaw movements during mastication in Macaca fascic-
ularis: a bone-strain, electromyographic, and cineradiographic
analysis. Am J Phys Anthropol 72, 287–314.
Hylander WL, Ravosa MR, Ross CF, et al. (1998) Mandibular cor-
pus strain in primates: further evidence for a functional link
between symphyseal fusion and jaw-adductor muscle force.
Am J Phys Anthropol 107, 257–271.
Kupczik K, Dobson CA, Fagan MJ, et al. (2007) Assessing
mechanical function of the zygomatic region in macaques:
validation and sensitivity testing of finite element models.
J Anat 210, 41–53.
Kupczik K, Dobson CA, Crompton RH, et al. (2009) Masticatory
loading and bone adaptation in the supraorbital torus of
developing macaques. Am J Phys Anthropol 139, 193–203.
Lieberman DE, Krovitz GE, Yates FW, et al. (2004) Effects of
food processing on masticatory strain and craniofacial growth
in a retrognathic face. J Hum Evol 46, 655–677.
Liu ZJ, Herring SW (2000) Bone surface strains and internal bony
pressures at the jaw joint of the miniature pig during mastica-
tory muscle contraction. Arch Oral Biol 45, 95–112.
Marinescu R, Daegling DJ, Rapoff AJ (2005) Finite-element mod-
eling of the anthropoid mandible: the effects of altered
boundary conditions. Anat Rec A 283, 3000–3309.
Mazzetta GV, Cisilino AP, Blanco RE (2004) Distribuci�on de ensi-
ones durante la mordida en la mand�ıbula de Carnotaurus sas-
trei Bonaparte, 1985 (Theropoda: Abelisauridae). Ameghiniana
41, 605–617.
Mazzetta GV, Cisilino AP, Blanco RE, et al. (2009) Cranial
mechanics and functional interpretation of the horned carniv-
orous dinosaur Carnotaurus sastrei. J Vertebr Paleontol 29,
822–830.
McHenry C, Clausen P, Daniel WJT, et al. (2006) Biomechanics
of the rostrum in crocodilians: a comparative analysis
using finite-element modeling. Anat Rec A 288, 827–849.
Metzger KA, Daniel WJT, Ross CF (2005) Comparison of
beam theory and finite-element analysis with in vivo bone
strain data from the Alligator cranium. Anat Rec A 283,
331–348.
Moazen M, Curtis N, O’Higgins P, et al. (2009) Biomechanical
assessment of evolutionary changes in the lepidosaurian skull.
Proc Natl Acad Sci U S A 20, 8273–8277.
Molnar RE (1998) Mechanical factors in the design of the skull
of Tyrannosaurus rex (Osborn, 1905). Gaia 15, 198–218.
© 2013 Anatomical Society
Alligator mandibular bone strain, L. B. Porro et al.226

Moreno K, Wroe S, Clausen P, et al. (2008) Cranial performance in
the Komodo dragon (Varanus komodoensis) as revealed by
high-resolution 3-D finite element analysis. J Anat 212, 736–746.
Panagiotopoulou O, Curtis N, O’Higgins P, et al. (2010) Model-
ling subcortical bone in finite element analyses: a validation
and sensitivity study in the macaque mandible. J Biomech 43,
1603–1611.
Panagiotopoulou O, Kupczik K, Cobb SN (2011) The mechanical
function of the periodontal ligament in the macaque mandi-
ble: a validation and sensitivity study using finite element
analysis. J Anat 218, 75–86.
Pierce SE, Angielczyk KD, Rayfield EJ (2008) Patterns of morpho-
space occupation and mechanical performance in exant croco-
dilian skulls: a combined geometric morphometric and finite
element modeling approach. J Morphol 269, 840–864.
Plotnick RE, Baumiller TZ (2000) Invention by evolution: func-
tional analysis in paleobiology. In: Deep Time: Paleobiology’s
Perspective. (eds Erwin DH, Wing SL), pp. 305–323, Lawrence:
The Paleontological Society.
Porro LB, Holliday CM, Anapol F, et al. (2011) Free body analy-
sis, beam mechanics, and finite element modeling of the man-
dible of Alligator mississippiensis. J Morphol 272, 910–937.
Rafferty KL, Herring SW, Marshall CD (2003) Biomechanics
of the rostrum and the role of facial sutures. J Morphol 257,
33–44.
Rayfield EJ (2011) Strain in the ostrich mandible during simu-
lated pecking and validation of specimen-specific finite ele-
ment models. J Anat 218, 47–58.
Rayfield EJ, Milner AC (2008) Establishing a framework for
archosaur cranial mechanics. Paleobiology 34, 494–515.
Rayfield EJ, Norman DB, Horner CC, et al. (2001) Cranial
design and function in a large theropod dinosaur. Nature 409,
1033–1037.
Rayfield EJ, Milner AC, Xuan VB, et al. (2007) Functional mor-
phology of spinosaur ‘crocodile-mimic’ dinosaurs. J Vertebr
Paleontol 27, 892–901.
Reed DA, Porro LB, Iriarte-Diaz J, et al. (2011) The impact of
bone and suture material properties on mandibular function
in Alligator mississippiensis: testing theoretical phenotypes
with finite element analysis. J Anat 218, 59–74.
Ross CF (2001) In vivo function of the craniofacial haft: the
interorbital ‘pillar’. Am J Phys Anthropol 116, 108–139.
Ross CF, Dechow PC, Iriarte-Diaz J, et al. (2011) In vivo bone
strain and finite-element modeling of the craniofacial haft in
catarrhine primates. J Anat 218, 112–141.
Ross CF, Metzger KA (2004) Bone strain gradients and optimiza-
tion in vertebrate skulls. Ann Anat 186, 387–396.
Ross CF, Patel BA, Slice DE, et al. (2005) Modeling masticatory
muscle force in finite element analysis: sensitivity analysis
using principal coordinate analysis. Anat Rec A 283, 288–299.
Ross CF, Berthaume MA, Dechow PC, et al. (2011) In vivo bone
strain and finite-element modeling of the craniofacial haft in
catarrhine primates. J Anat 218, 112–141.
Rybicki EF, Mills EJ, Turner AS, et al. (1977) In vivo and
analytical studies of forces and moments in equine long
bones. J Biomech 10, 701–705.
Schwenk K (2000) Tetrapod feeding in the context of vertebrate
morphology. In: Feeding: Form, Function, and Evolution in
Terrestrial Vertebrates. (ed. Schwenk K), pp. 3–20, San Diego:
Academic Press.
Sinclair AG, Alexander RM (1987) Estimates of forces exerted by
the jaw muscles of some reptiles. J Zool London 213, 107–115.
Soons J, Herrel A, Genbrugge A, et al. (2010) Mechanical stress,
fracture risk and beak evolution in Darwin’s ground finches
(Geospiza). Philos Trans R Soc Lond B Biol Sci 365, 1093–1098.
Strait DS, Wang Q, Dechow PC, et al. (2005) Modeling elastic
properties in finite-element analysis: how much precision
is needed to produce an accurate model? Anat Rec A 283,
275–287.
Strait DS, Richmond BG, Spencer MA, et al. (2007) Masticatory
biomechanics and its relevance to early hominid phylogeny:
an examination of palatal thickness using finite-element anal-
ysis. J Hum Evol 52, 585–599.
Taylor MA (1992) Functional anatomy of the head of the large
aquatic predator Rhomaleosaurus zetlandicus (Plesiosauria,
Reptilia) from the Toarcian (Lower Jurassic) of Yorkshire, Eng-
land. Philos Trans R Soc Lond B Biol Sci 335, 247–280.
Therrien F, Henderson DM, Ruff CB (2005) Bite me: biomechani-
cal models of theropod mandibles and implications for feed-
ing behaviour. In: The Carnivorous Dinosaurs. (ed. Carpenter
K), pp. 179–237, Bloomington: Indiana University Press.
Van Drongelen W, Dullemeijer P (1982) The feeding apparatus
of Caiman crocodilus; a functional-morphological study. Anat
Anz 151, 337–366.
Verrue VL, Dermaut L, Verhegghe B (2001) Three-dimensional
finite element modeling of a dog skull for the simulation of
initial orthopaedic displacements. Eur J Orthod 232, 517–527.
Walmsley CW, Smits PD, Quayle MR, et al. (2013) Why the long
face? The mechanics of mandibular symphysis proportions in
crocodiles. PLoS ONE 8, e53878.
Weijs WA, De Jongh HJ (1977) Strain in mandibular alveolar bone
during mastication in the rabbit. Arch Oral Biol 22, 667–675.
Weishampel DB (1995) Fossils, function and phylogeny. In: Func-
tional Morphology in Vertebrate Paleontology. (ed. Thomason
JJ), pp. 34–54, Cambridge: Cambridge University Press.
Williams SH, Wall CE, Vinyard CJ, et al. (2008) Symphyseal
fusion in selenodont artiodactyls: new insights from in vivo
and comparative data. In: Primate Craniofacial Function and
Biology. (eds Vinyard CJ, Ravosa MR, Wall CE), pp. 39–61, New
York: Springer.
Williams SH, Vinyard CJ, Wall CE, et al. (2009) Mandibular cor-
pus bone strain in goats and alpacas: implications for under-
standing the biomechanics of mandibular form in selenodont
artiodactyls. J Anat 214, 65–78.
Zapata U, Metzger K, Wang Q, et al. (2010) Material properties
of mandibular cortical bone in the American alligator, Alliga-
tor mississippiensis. Bone 46, 860–867.
Zar JH (1999) Biostatistical Analysis. Upper Saddle River, NJ:
Prentice Hall.
Supporting Information
Additional Supporting Information may be found in the online
version of this article:
Video S1. Anterior view of deformation of the FEM amplified
10 9 during anterior biting.
Video S2. Anterior view of deformation of the FEM amplified
109 during posterior biting.
© 2013 Anatomical Society
Alligator mandibular bone strain, L. B. Porro et al. 227


![Contro - Salute Emilia-Romagnasalute.regione.emilia-romagna.it/.../at_download/file/stranieri[1].pdf · 4 regras fundamentais. 4 5 partecipiamo alla lotta contro la zanzara tigre](https://img.pdfslide.us/doc/110x75/5c63322d09d3f268208c227c/contro-salute-emilia-1pdf-4-regras-fundamentais-4-5-partecipiamo-alla.jpg)