Embed Size (px)
Citation preview
1
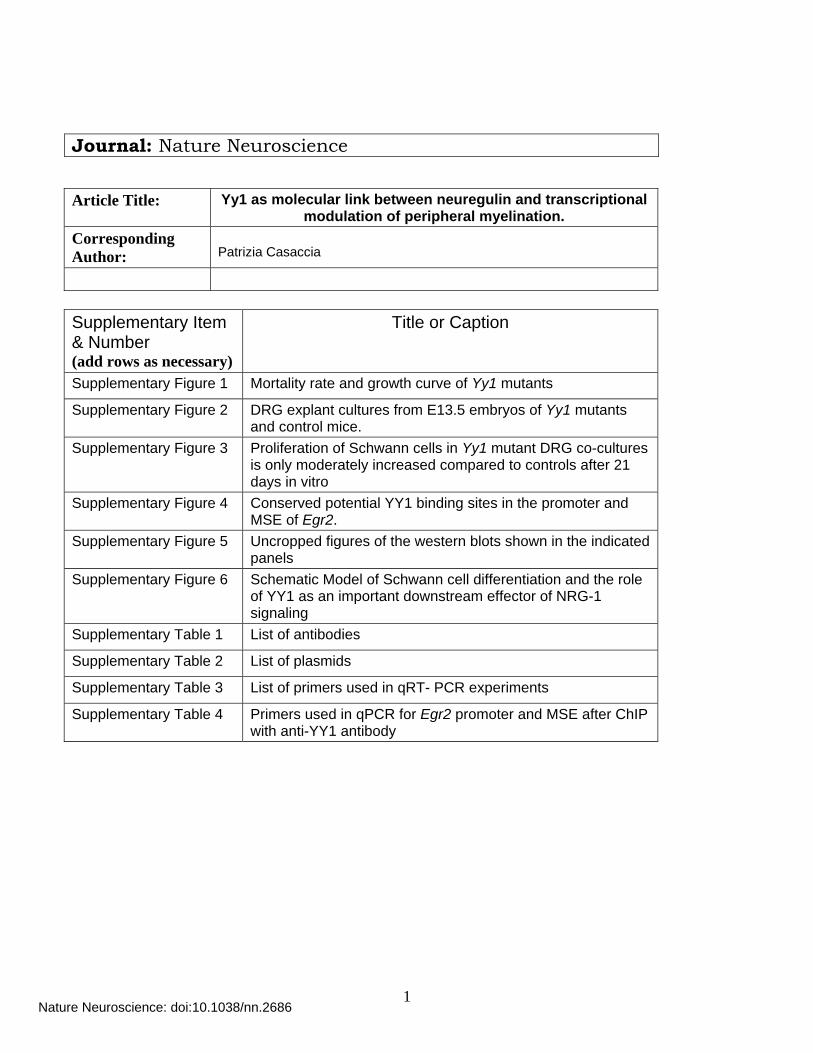
Journal: Nature Neuroscience
Article Title: Yy1 as molecular link between neuregulin and transcriptional modulation of peripheral myelination.
Corresponding Author:
Patrizia Casaccia
Supplementary Item & Number (add rows as necessary)
Title or Caption
Supplementary Figure 1 Mortality rate and growth curve of Yy1 mutants
Supplementary Figure 2 DRG explant cultures from E13.5 embryos of Yy1 mutants and control mice.
Supplementary Figure 3 Proliferation of Schwann cells in Yy1 mutant DRG co-cultures is only moderately increased compared to controls after 21 days in vitro
Supplementary Figure 4 Conserved potential YY1 binding sites in the promoter and MSE of Egr2.
Supplementary Figure 5 Uncropped figures of the western blots shown in the indicated panels
Supplementary Figure 6 Schematic Model of Schwann cell differentiation and the role of YY1 as an important downstream effector of NRG-1 signaling
Supplementary Table 1 List of antibodies
Supplementary Table 2 List of plasmids
Supplementary Table 3 List of primers used in qRT- PCR experiments
Supplementary Table 4 Primers used in qPCR for Egr2 promoter and MSE after ChIP with anti-YY1 antibody
Nature Neuroscience: doi:10.1038/nn.2686
2
Yy1 as molecular link between neuregulin and transcriptional modulation of peripheral
myelination.
Ye He1, Jin Young Kim1, Jeffrey Dupree2, Ambika Tewari3, Carmen Melendez-Vasquez3, John Svaren4,
Patrizia Casaccia1*
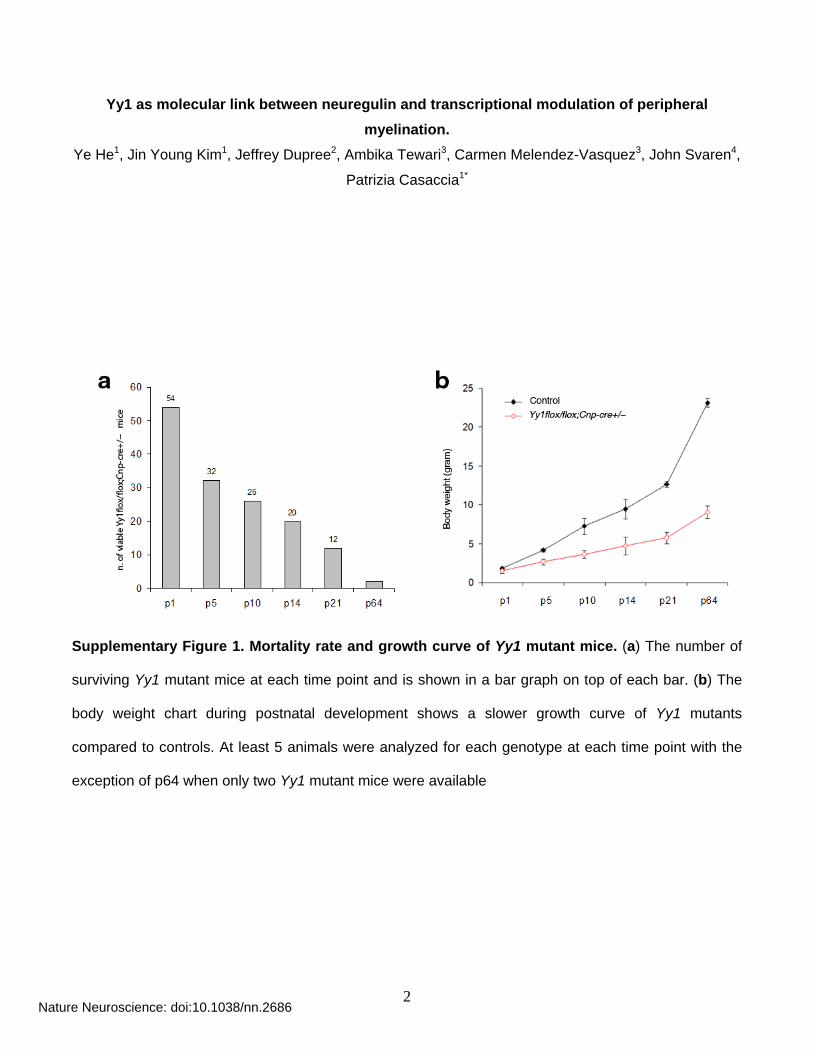
Supplementary Figure 1. Mortality rate and growth curve of Yy1 mutant mice. (a) The number of
surviving Yy1 mutant mice at each time point and is shown in a bar graph on top of each bar. (b) The
body weight chart during postnatal development shows a slower growth curve of Yy1 mutants
compared to controls. At least 5 animals were analyzed for each genotype at each time point with the
exception of p64 when only two Yy1 mutant mice were available
Nature Neuroscience: doi:10.1038/nn.2686
3
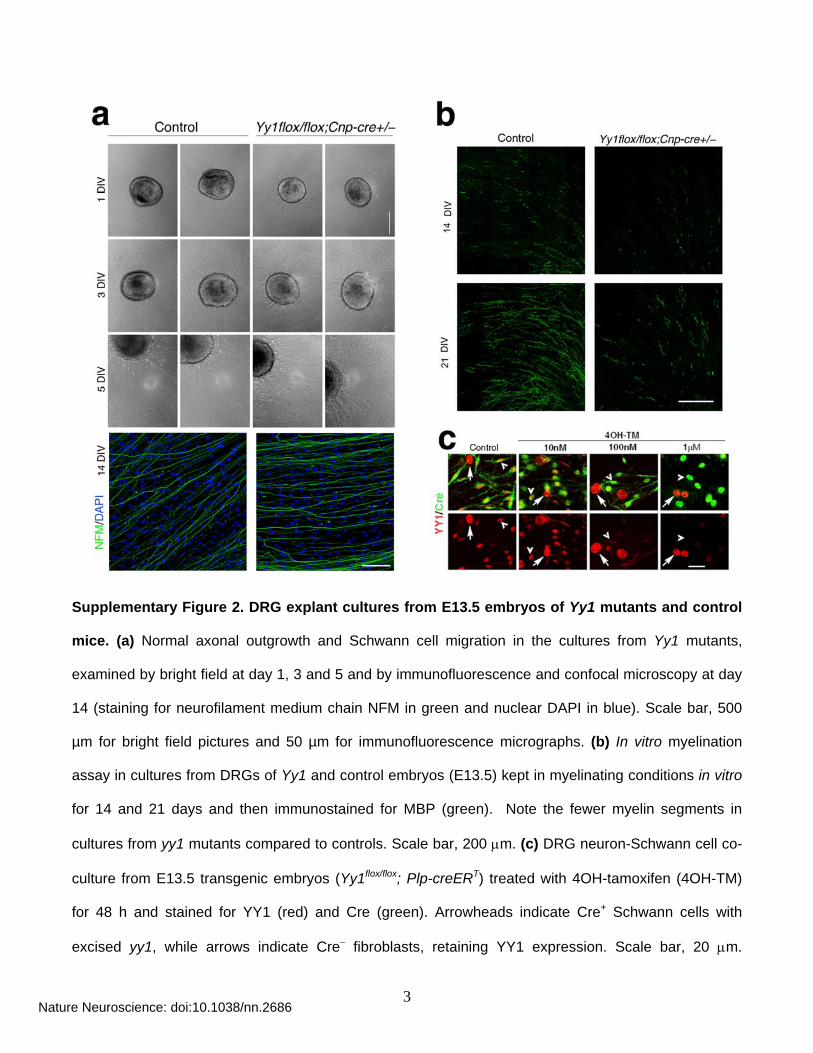
Supplementary Figure 2. DRG explant cultures from E13.5 embryos of Yy1 mutants and control
mice. (a) Normal axonal outgrowth and Schwann cell migration in the cultures from Yy1 mutants,
examined by bright field at day 1, 3 and 5 and by immunofluorescence and confocal microscopy at day
14 (staining for neurofilament medium chain NFM in green and nuclear DAPI in blue). Scale bar, 500
µm for bright field pictures and 50 µm for immunofluorescence micrographs. (b) In vitro myelination
assay in cultures from DRGs of Yy1 and control embryos (E13.5) kept in myelinating conditions in vitro
for 14 and 21 days and then immunostained for MBP (green). Note the fewer myelin segments in
cultures from yy1 mutants compared to controls. Scale bar, 200 m. (c) DRG neuron-Schwann cell co-
culture from E13.5 transgenic embryos (Yy1flox/flox; Plp-creERT) treated with 4OH-tamoxifen (4OH-TM)
for 48 h and stained for YY1 (red) and Cre (green). Arrowheads indicate Cre+ Schwann cells with
excised yy1, while arrows indicate Cre fibroblasts, retaining YY1 expression. Scale bar, 20 m.
Nature Neuroscience: doi:10.1038/nn.2686
4
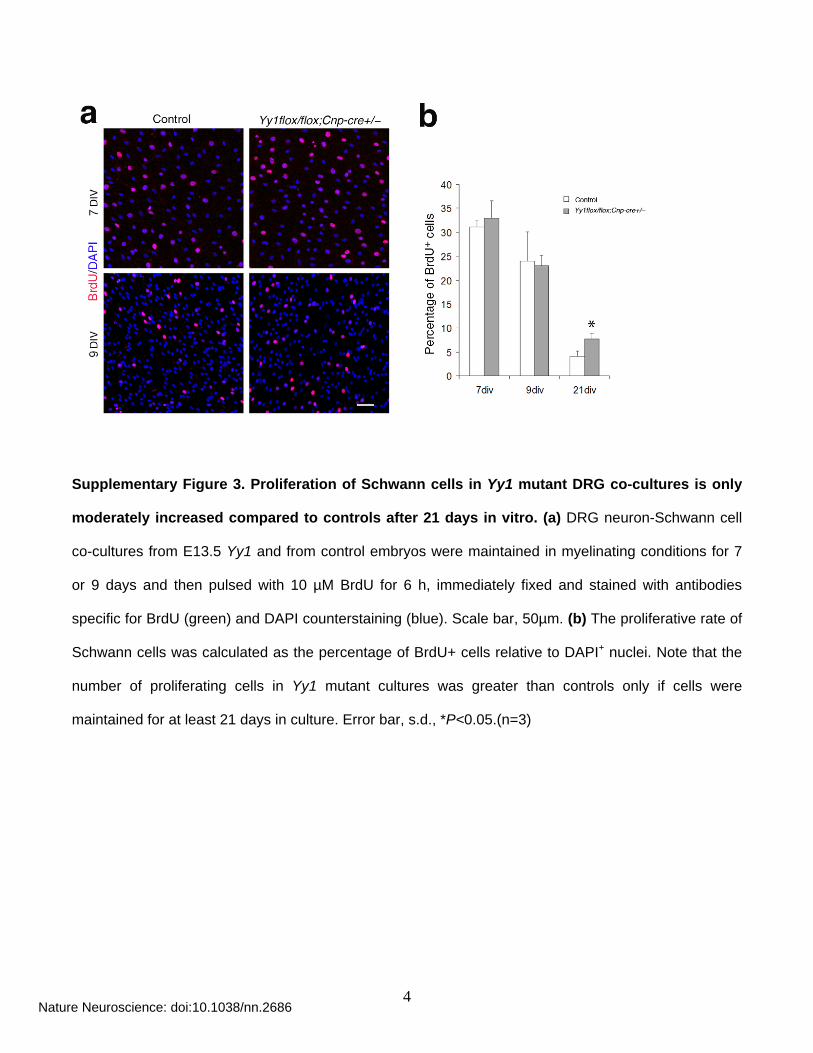
Supplementary Figure 3. Proliferation of Schwann cells in Yy1 mutant DRG co-cultures is only
moderately increased compared to controls after 21 days in vitro. (a) DRG neuron-Schwann cell
co-cultures from E13.5 Yy1 and from control embryos were maintained in myelinating conditions for 7
or 9 days and then pulsed with 10 µM BrdU for 6 h, immediately fixed and stained with antibodies
specific for BrdU (green) and DAPI counterstaining (blue). Scale bar, 50µm. (b) The proliferative rate of
Schwann cells was calculated as the percentage of BrdU+ cells relative to DAPI+ nuclei. Note that the
number of proliferating cells in Yy1 mutant cultures was greater than controls only if cells were
maintained for at least 21 days in culture. Error bar, s.d., *P<0.05.(n=3)
Nature Neuroscience: doi:10.1038/nn.2686
5
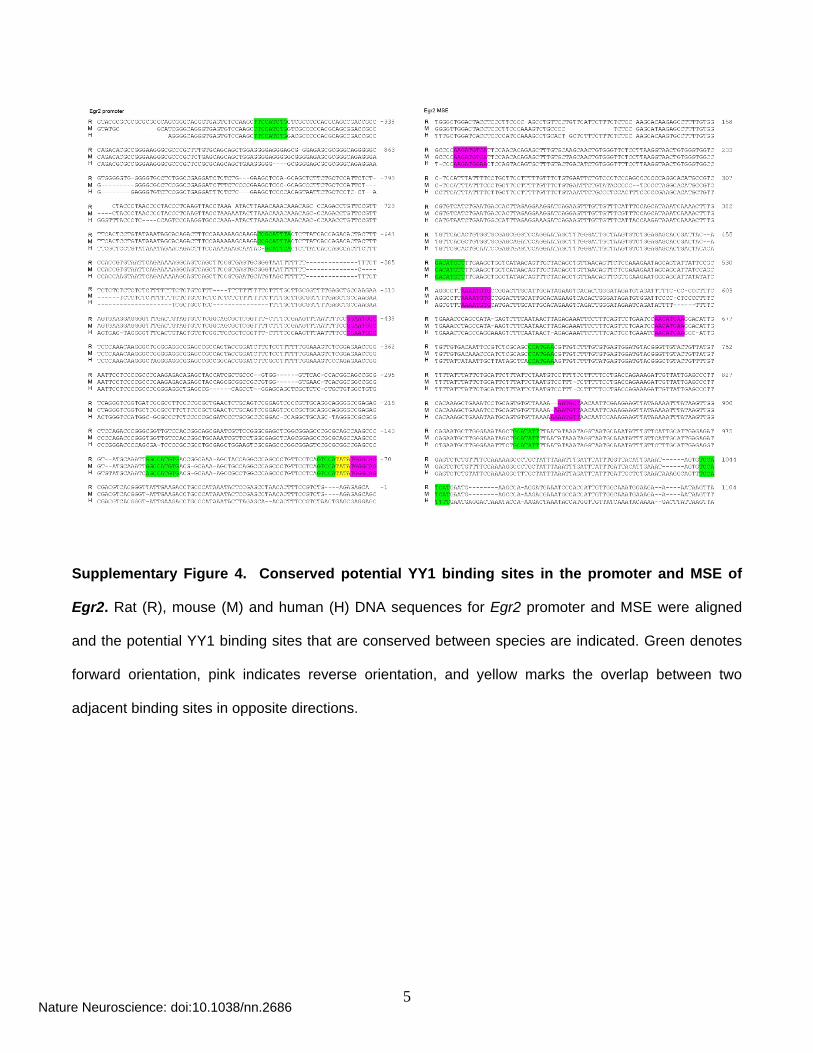
Supplementary Figure 4. Conserved potential YY1 binding sites in the promoter and MSE of
Egr2. Rat (R), mouse (M) and human (H) DNA sequences for Egr2 promoter and MSE were aligned
and the potential YY1 binding sites that are conserved between species are indicated. Green denotes
forward orientation, pink indicates reverse orientation, and yellow marks the overlap between two
adjacent binding sites in opposite directions.
Nature Neuroscience: doi:10.1038/nn.2686
6
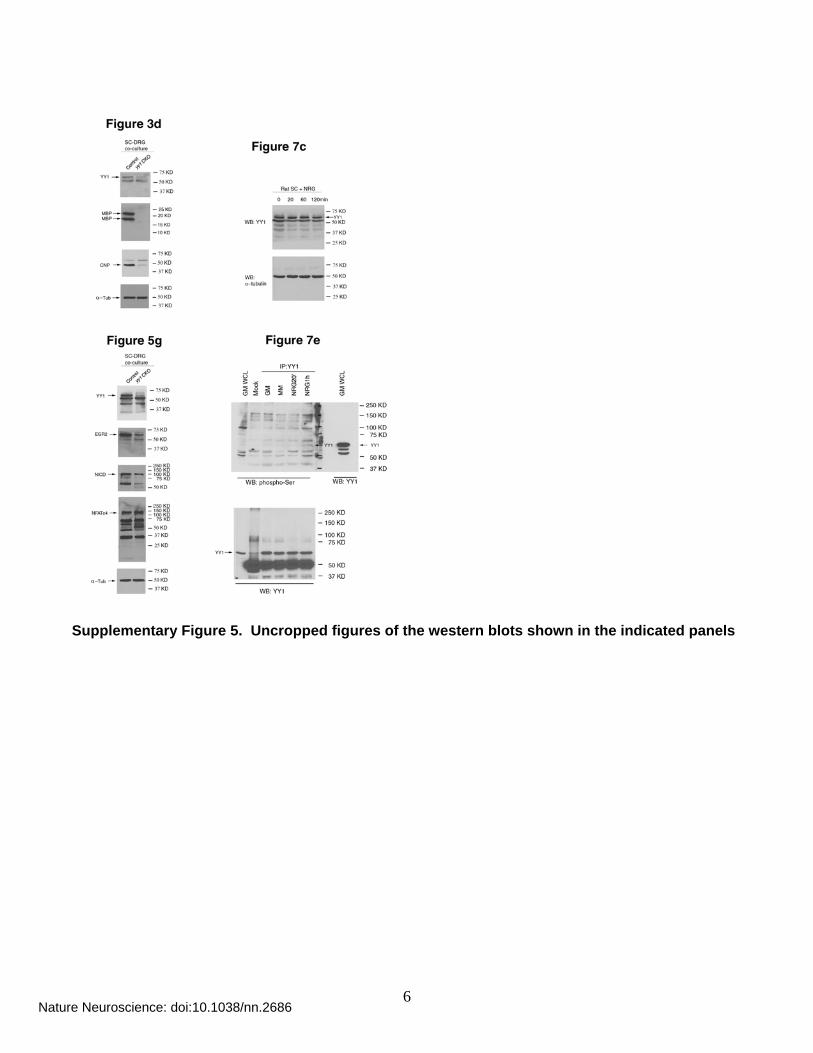
Supplementary Figure 5. Uncropped figures of the western blots shown in the indicated panels
Nature Neuroscience: doi:10.1038/nn.2686
7
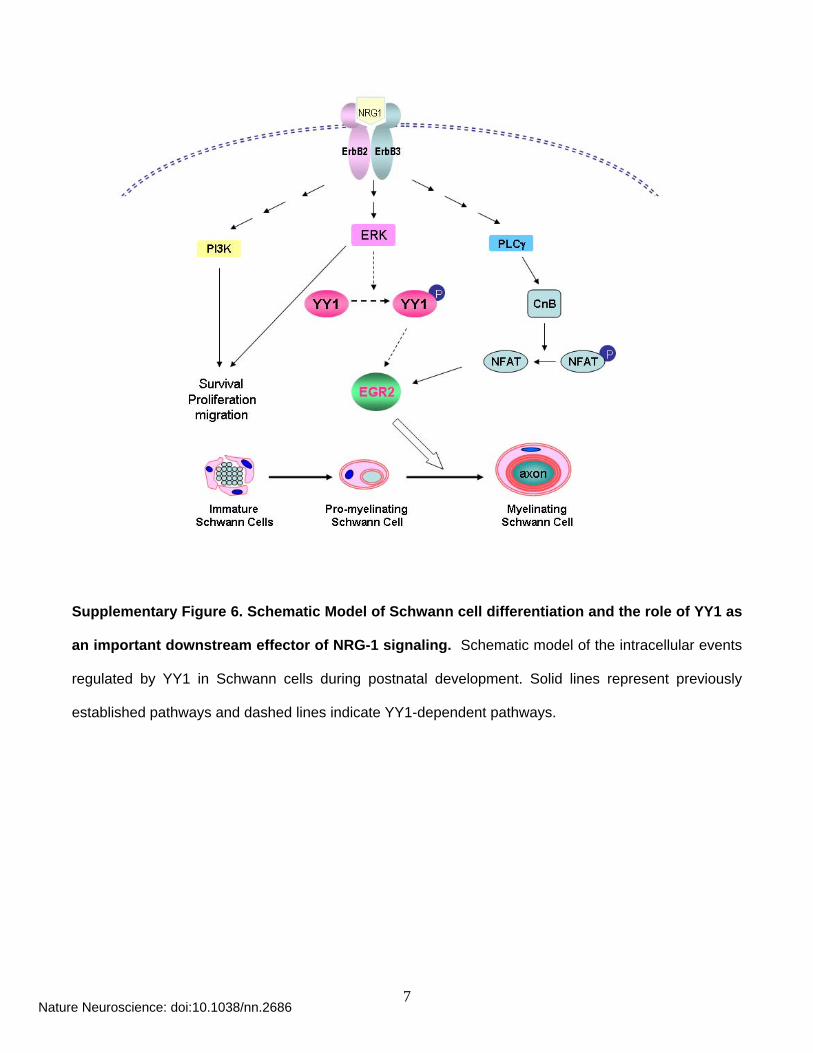
Supplementary Figure 6. Schematic Model of Schwann cell differentiation and the role of YY1 as
an important downstream effector of NRG-1 signaling. Schematic model of the intracellular events
regulated by YY1 in Schwann cells during postnatal development. Solid lines represent previously
established pathways and dashed lines indicate YY1-dependent pathways.
Nature Neuroscience: doi:10.1038/nn.2686
8
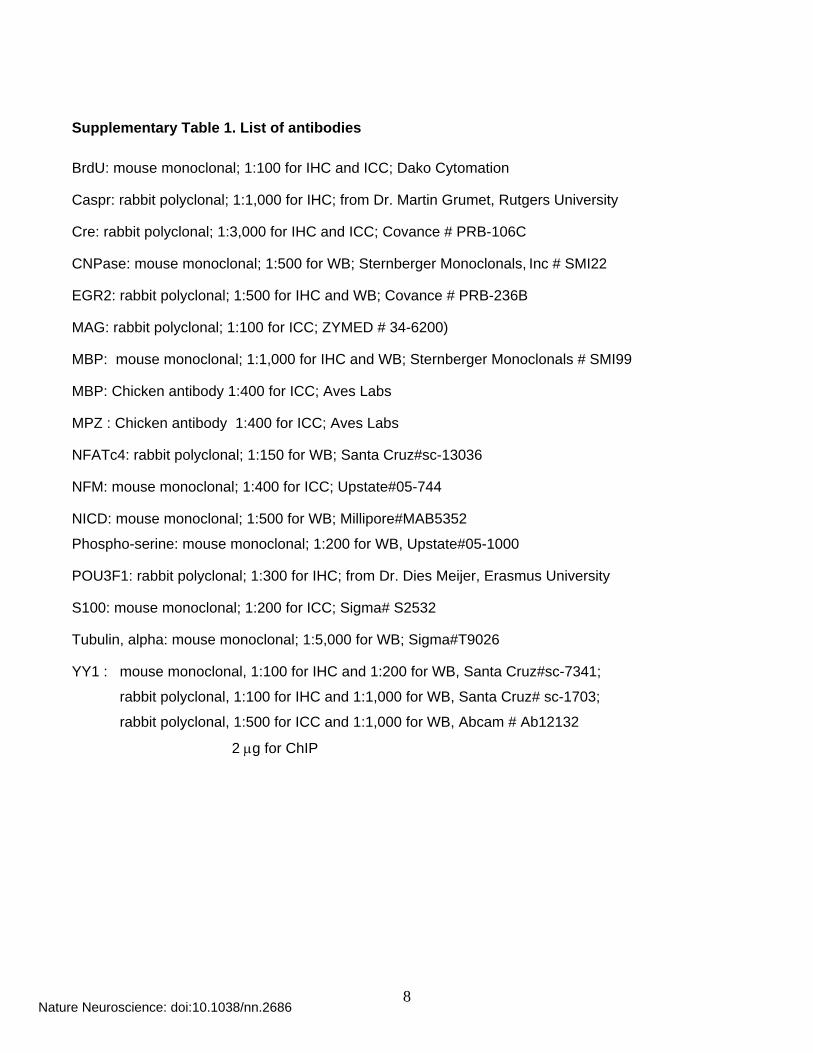
Supplementary Table 1. List of antibodies
BrdU: mouse monoclonal; 1:100 for IHC and ICC; Dako Cytomation
Caspr: rabbit polyclonal; 1:1,000 for IHC; from Dr. Martin Grumet, Rutgers University
Cre: rabbit polyclonal; 1:3,000 for IHC and ICC; Covance # PRB-106C
CNPase: mouse monoclonal; 1:500 for WB; Sternberger Monoclonals, Inc # SMI22
EGR2: rabbit polyclonal; 1:500 for IHC and WB; Covance # PRB-236B
MAG: rabbit polyclonal; 1:100 for ICC; ZYMED # 34-6200)
MBP: mouse monoclonal; 1:1,000 for IHC and WB; Sternberger Monoclonals # SMI99
MBP: Chicken antibody 1:400 for ICC; Aves Labs
MPZ : Chicken antibody 1:400 for ICC; Aves Labs
NFATc4: rabbit polyclonal; 1:150 for WB; Santa Cruz#sc-13036
NFM: mouse monoclonal; 1:400 for ICC; Upstate#05-744
NICD: mouse monoclonal; 1:500 for WB; Millipore#MAB5352
Phospho-serine: mouse monoclonal; 1:200 for WB, Upstate#05-1000
POU3F1: rabbit polyclonal; 1:300 for IHC; from Dr. Dies Meijer, Erasmus University
S100: mouse monoclonal; 1:200 for ICC; Sigma# S2532
Tubulin, alpha: mouse monoclonal; 1:5,000 for WB; Sigma#T9026
YY1 : mouse monoclonal, 1:100 for IHC and 1:200 for WB, Santa Cruz#sc-7341;
rabbit polyclonal, 1:100 for IHC and 1:1,000 for WB, Santa Cruz# sc-1703;
rabbit polyclonal, 1:500 for ICC and 1:1,000 for WB, Abcam # Ab12132
2 g for ChIP
Nature Neuroscience: doi:10.1038/nn.2686
9
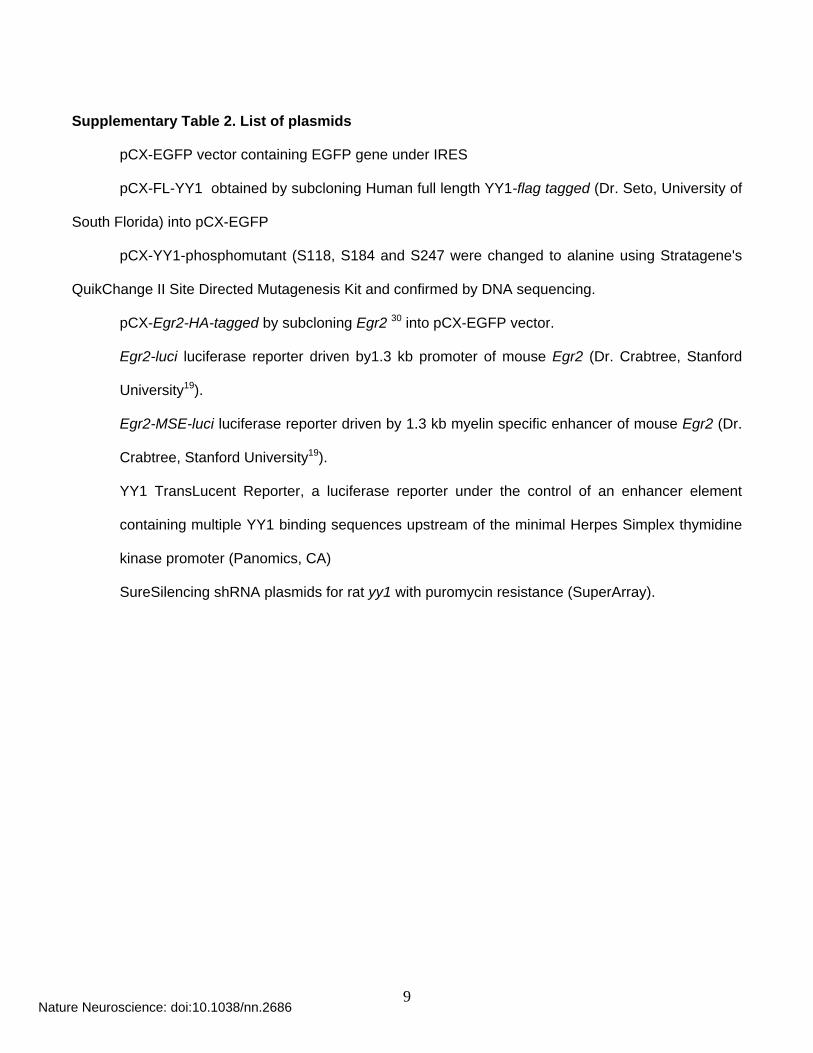
Supplementary Table 2. List of plasmids
pCX-EGFP vector containing EGFP gene under IRES
pCX-FL-YY1 obtained by subcloning Human full length YY1-flag tagged (Dr. Seto, University of
South Florida) into pCX-EGFP
pCX-YY1-phosphomutant (S118, S184 and S247 were changed to alanine using Stratagene's
QuikChange II Site Directed Mutagenesis Kit and confirmed by DNA sequencing.
pCX-Egr2-HA-tagged by subcloning Egr2 30 into pCX-EGFP vector.
Egr2-luci luciferase reporter driven by1.3 kb promoter of mouse Egr2 (Dr. Crabtree, Stanford
University19).
Egr2-MSE-luci luciferase reporter driven by 1.3 kb myelin specific enhancer of mouse Egr2 (Dr.
Crabtree, Stanford University19).
YY1 TransLucent Reporter, a luciferase reporter under the control of an enhancer element
containing multiple YY1 binding sequences upstream of the minimal Herpes Simplex thymidine
kinase promoter (Panomics, CA)
SureSilencing shRNA plasmids for rat yy1 with puromycin resistance (SuperArray).
Nature Neuroscience: doi:10.1038/nn.2686
10
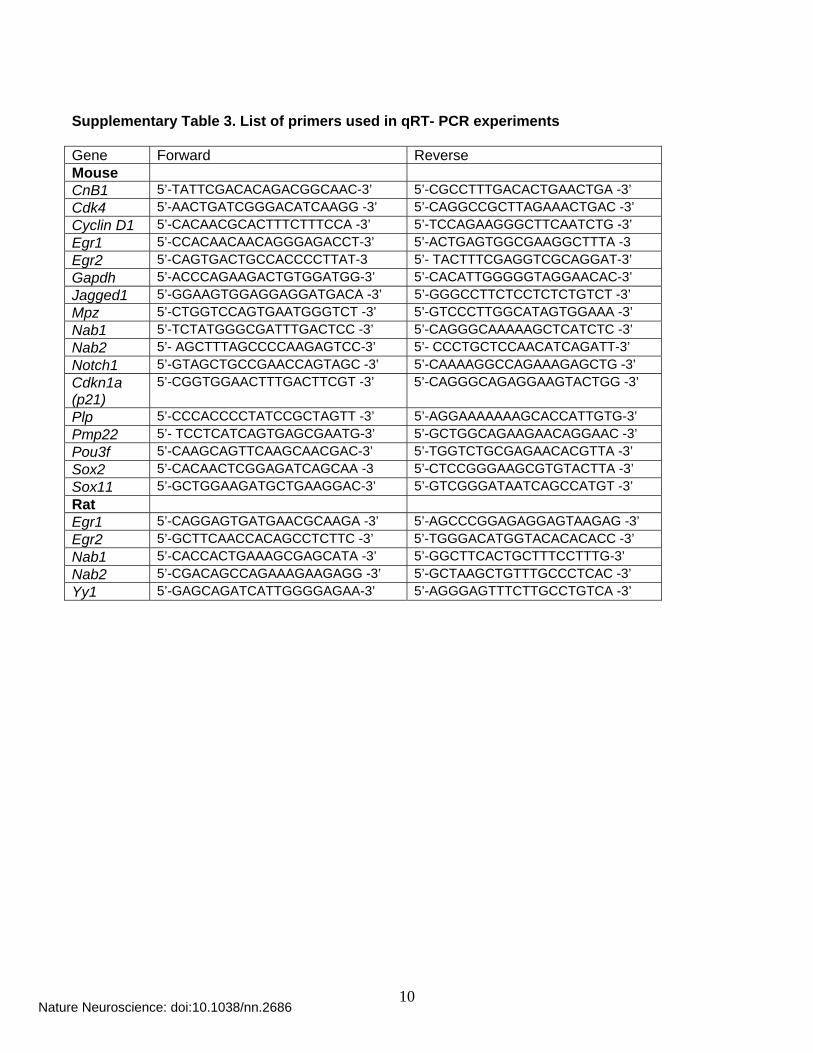
Supplementary Table 3. List of primers used in qRT- PCR experiments
Gene Forward ReverseMouse
CnB1 5’-TATTCGACACAGACGGCAAC-3’ 5’-CGCCTTTGACACTGAACTGA -3’
Cdk4 5’-AACTGATCGGGACATCAAGG -3’ 5’-CAGGCCGCTTAGAAACTGAC -3’
Cyclin D1 5’-CACAACGCACTTTCTTTCCA -3’ 5’-TCCAGAAGGGCTTCAATCTG -3’
Egr1 5’-CCACAACAACAGGGAGACCT-3’ 5’-ACTGAGTGGCGAAGGCTTTA -3
Egr2 5’-CAGTGACTGCCACCCCTTAT-3 5’- TACTTTCGAGGTCGCAGGAT-3’
Gapdh 5’-ACCCAGAAGACTGTGGATGG-3’ 5’-CACATTGGGGGTAGGAACAC-3’
Jagged1 5’-GGAAGTGGAGGAGGATGACA -3’ 5’-GGGCCTTCTCCTCTCTGTCT -3’
Mpz 5’-CTGGTCCAGTGAATGGGTCT -3’ 5’-GTCCCTTGGCATAGTGGAAA -3’
Nab1 5’-TCTATGGGCGATTTGACTCC -3’ 5’-CAGGGCAAAAAGCTCATCTC -3’
Nab2 5’- AGCTTTAGCCCCAAGAGTCC-3’ 5’- CCCTGCTCCAACATCAGATT-3’
Notch1 5’-GTAGCTGCCGAACCAGTAGC -3’ 5’-CAAAAGGCCAGAAAGAGCTG -3’
Cdkn1a (p21)
5’-CGGTGGAACTTTGACTTCGT -3’ 5’-CAGGGCAGAGGAAGTACTGG -3’
Plp 5’-CCCACCCCTATCCGCTAGTT -3’ 5’-AGGAAAAAAAGCACCATTGTG-3’
Pmp22 5’- TCCTCATCAGTGAGCGAATG-3’ 5’-GCTGGCAGAAGAACAGGAAC -3’
Pou3f 5’-CAAGCAGTTCAAGCAACGAC-3’ 5’-TGGTCTGCGAGAACACGTTA -3’
Sox2 5’-CACAACTCGGAGATCAGCAA -3 5’-CTCCGGGAAGCGTGTACTTA -3’
Sox11 5’-GCTGGAAGATGCTGAAGGAC-3’ 5’-GTCGGGATAATCAGCCATGT -3’
Rat
Egr1 5’-CAGGAGTGATGAACGCAAGA -3’ 5’-AGCCCGGAGAGGAGTAAGAG -3’
Egr2 5’-GCTTCAACCACAGCCTCTTC -3’ 5’-TGGGACATGGTACACACACC -3’
Nab1 5’-CACCACTGAAAGCGAGCATA -3’ 5’-GGCTTCACTGCTTTCCTTTG-3’
Nab2 5’-CGACAGCCAGAAAGAAGAGG -3’ 5’-GCTAAGCTGTTTGCCCTCAC -3’
Yy1 5’-GAGCAGATCATTGGGGAGAA-3’ 5’-AGGGAGTTTCTTGCCTGTCA -3’
Nature Neuroscience: doi:10.1038/nn.2686
11
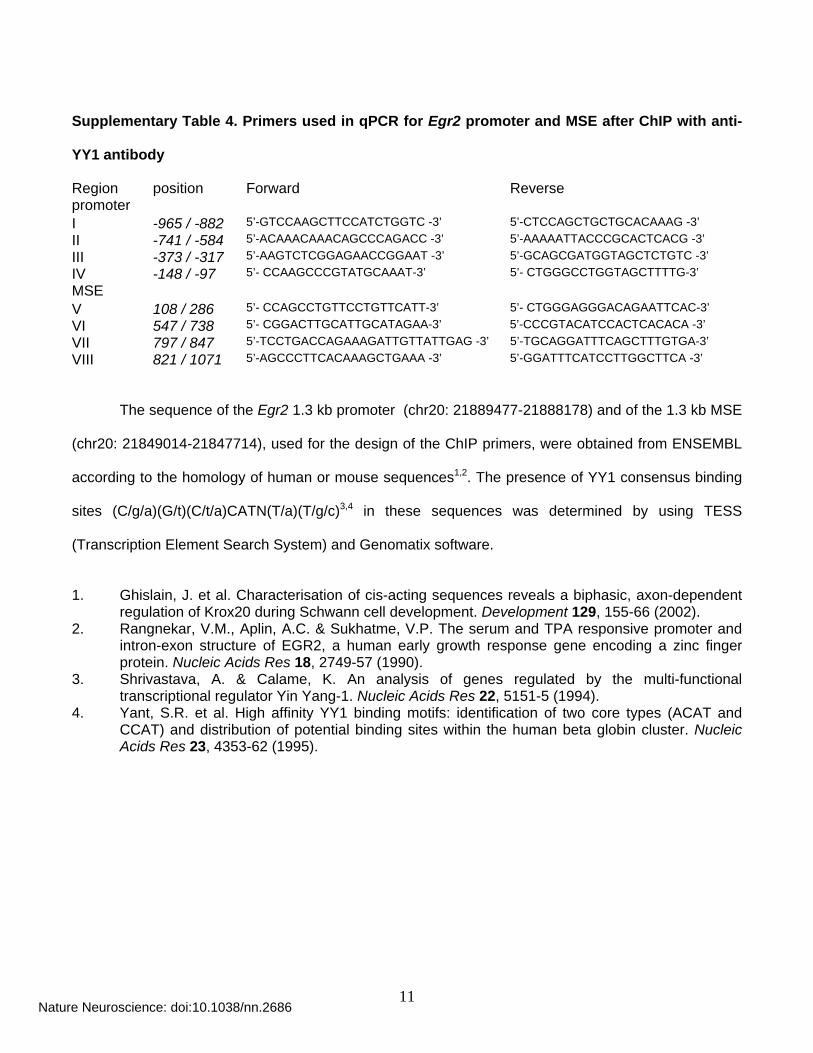
Supplementary Table 4. Primers used in qPCR for Egr2 promoter and MSE after ChIP with anti-
YY1 antibody
Region position Forward Reversepromoter I -965 / -882 5’-GTCCAAGCTTCCATCTGGTC -3’ 5’-CTCCAGCTGCTGCACAAAG -3’
II -741 / -584 5’-ACAAACAAACAGCCCAGACC -3’ 5’-AAAAATTACCCGCACTCACG -3’
III -373 / -317 5’-AAGTCTCGGAGAACCGGAAT -3’ 5’-GCAGCGATGGTAGCTCTGTC -3’
IV -148 / -97 5’- CCAAGCCCGTATGCAAAT-3’ 5’- CTGGGCCTGGTAGCTTTTG-3’
MSE
V 108 / 286 5’- CCAGCCTGTTCCTGTTCATT-3’ 5’- CTGGGAGGGACAGAATTCAC-3’
VI 547 / 738 5’- CGGACTTGCATTGCATAGAA-3’ 5’-CCCGTACATCCACTCACACA -3’
VII 797 / 847 5’-TCCTGACCAGAAAGATTGTTATTGAG -3’ 5’-TGCAGGATTTCAGCTTTGTGA-3’
VIII 821 / 1071 5’-AGCCCTTCACAAAGCTGAAA -3’ 5’-GGATTTCATCCTTGGCTTCA -3’
The sequence of the Egr2 1.3 kb promoter (chr20: 21889477-21888178) and of the 1.3 kb MSE
(chr20: 21849014-21847714), used for the design of the ChIP primers, were obtained from ENSEMBL
according to the homology of human or mouse sequences1,2. The presence of YY1 consensus binding
sites (C/g/a)(G/t)(C/t/a)CATN(T/a)(T/g/c)3,4 in these sequences was determined by using TESS
(Transcription Element Search System) and Genomatix software.
1. Ghislain, J. et al. Characterisation of cis-acting sequences reveals a biphasic, axon-dependent
regulation of Krox20 during Schwann cell development. Development 129, 155-66 (2002). 2. Rangnekar, V.M., Aplin, A.C. & Sukhatme, V.P. The serum and TPA responsive promoter and
intron-exon structure of EGR2, a human early growth response gene encoding a zinc finger protein. Nucleic Acids Res 18, 2749-57 (1990).
3. Shrivastava, A. & Calame, K. An analysis of genes regulated by the multi-functional transcriptional regulator Yin Yang-1. Nucleic Acids Res 22, 5151-5 (1994).
4. Yant, S.R. et al. High affinity YY1 binding motifs: identification of two core types (ACAT and CCAT) and distribution of potential binding sites within the human beta globin cluster. Nucleic Acids Res 23, 4353-62 (1995).
Nature Neuroscience: doi:10.1038/nn.2686