Embed Size (px)
Citation preview
at SciVerse ScienceDirect
Journal of Cleaner Production xxx (2013) 1e8
Contents lists available
Journal of Cleaner Production
journal homepage: www.elsevier .com/locate/ jc lepro
Life Cycle Assessment for environmentally sustainable aquaculturemanagement: a case study of combined aquaculture systems for carpand tilapia
Rattanawan Mungkung a,b,c,*, Joël Aubin a,b, Tri Heru Prihadi d, Jacques Slembrouck e,Hayo M.G. van der Werf a,b, Marc Legendre e
a Institut National de la Recherche Agronomique (INRA), UMR 1069, Sol Agro et hydrosystème Spatialisation, 65 rue de Saint Brieuc, CS 84215,35042 Rennes Cedex, FrancebAgrocampus Rennes, UMR 1069, Sol Agro et hydrosystème Spatialisation, 35000 Rennes, FrancecCentre of Excellence on Environmental Strategy for GREEN Business (VGREEN), Department of Environmental Technology and Management, Faculty ofEnvironment, Kasetsart University, 50 Ngamwongwan Road, Chatuchak, Bangkok 10903, ThailanddResearch Centre for Aquaculture, Department of Marine Affairs and Fisheries, Bogor, Indonesiae Institut de Recherche pour le Développement (IRD), UMR 226 e ISEM, BP 5095, 34196 Montpellier cedex 05, France
a r t i c l e i n f o
Article history:Received 5 November 2012Received in revised form13 May 2013Accepted 17 May 2013Available online xxx
Keywords:Cage aquacultureCyprinus carpioEnvironmental sustainabilityIndonesiaLife Cycle AssessmentOreochromis niloticus
* Correspondingauthor. Centreof Excellence onEnviBusiness (VGREEN), Department of Environmental TFaculty of Environment, Kasetsart University, 50 NgamBangkok 10903, Thailand. Tel.: þ66 2 562 4555x1508,
E-mail address: [email protected] (R. Mungkung).
0959-6526/$ e see front matter � 2013 Elsevier Ltd.http://dx.doi.org/10.1016/j.jclepro.2013.05.029
Please cite this article in press as: Mungkungstudy of combined aquaculture systemj.jclepro.2013.05.029
a b s t r a c t
Life Cycle Assessment (LCA) was applied to evaluate the potential environmental impacts associated withtwo-net cage aquaculture systems of common carp (Cyprinus carpio carpio) and tilapia (Oreochromisniloticus) in the Cirata reservoir, Indonesia. The studied system included fingerling production inhatcheries, fish rearing in cages, and transport of fry and feed as well as that of harvested fish to markets.The environmental impact indicators were calculated based on the annual production in 2006e2007using the CML2 Baseline 2000 method, and expressed per tonne of fresh fish delivered to the market. Therearing performances and the environmental efficiency of the system were highly dependent on the lakewater quality. Therefore the location of the cages and associated practices influenced the environmentalimpacts. Feed was identified as the major contributor to land occupation, primary production use,acidification, climate change, energy use and water dependence. Those impacts were mainly linked tothe production of fishmeal followed by the production of crop-based feed materials and the productionof electricity for feed processing. Eutrophication was mainly the consequence of the fish growing stageand linked closely to nutrient loading from cages. Better feeding practices to reduce feed conversion ratio(FCR), as well as improvement of feed composition by using less fishmeal and more local plant-basedmaterials along with improving energy efficiency of feed production processing should be imple-mented to improve the environmental profiles of carp and tilapia production. The reduction of FCR from2.1 to 1.7 could decrease eutrophication by about 22%. However, it is of first priority to reduce the numberof cages in order to improve the water quality of the reservoir. The comparison of Cirata reservoir fishculture to other sources of animal protein revealed that it generated average energy use but higheutrophication level. LCA was demonstrated to be a useful tool for decision-making when targetingimproved environmental sustainability of cage aquaculture.
� 2013 Elsevier Ltd. All rights reserved.
1. Introduction
Indonesia is the 4th aquaculture producer in the world, with1.7 M tonnes in 2008, and the production increase reaches 10% peryear (FAO, 2010). Fish is a major source of animal protein for the
ronmental Strategy forGREENechnology and Management,wongwan Road, Chatuchak,
fax: þ66 2 942 8715.
All rights reserved.
, R., et al., Life Cycle Assessms for carp and tilapia, J
population and cultivated fish (mostly carps, tilapias, pangas andgouramis) are highly appreciated because of their freshness, as theyare generally sold alive on local markets.
Floating net cage aquaculture of common carp (Cyprinus carpiocarpio) was implemented on the 6200 ha Cirata reservoir (CitarumRiver, West Java, Indonesia) in 1988, following the construction of adam for hydroelectricity production. The cultured species wereselected due to a high market demand for carp and its considerableeconomic value, using technology from previous experiences inother areas in Indonesia. Over the years, a two-net cage aquaculture
ent for environmentally sustainable aquaculture management: a caseournal of Cleaner Production (2013), http://dx.doi.org/10.1016/
R. Mungkung et al. / Journal of Cleaner Production xxx (2013) 1e82
system in which carps are stocked in the upper net and tilapias(Oreochromis niloticus) in the lower net, was adopted in an attempttomaximize feed utilization and reduce nutrient loading from cagesinto the reservoir. The rationale of this carp-tilapia polyculturesystem is to use thewaste output (uneaten feed andfish faeces) fromcarp and fouling induced by nutrient emissions as feed for tilapia,which also provides supplementary income. Tilapias also help tofacilitate water circulation in the cages by grazing on biofoulingdeveloping on the nets. Nevertheless, due to their lower marketprice tilapia are considered as a co-product in this system.
The two-net cage aquaculture system has become a commonaquaculture practice since 1995, supplying a local livelihood andgood investment for income. However, the rapid adoption of theCirata reservoir as a new aquatic resource for fish production hasresulted in the establishment of a massive number of cages. Due tothe higher profit gained from cage aquaculture as well as a lowerinvestment requirement compared to pond production, the num-ber of cages has strongly increased from 25,558 cages in 1996(Costa-Pierce, 1998) to 39,300 cages in 2005 (Abery et al., 2005).Previous studies reported the carrying capacity of the lake based onits capacity for self-purification to be around 10,600 cages (Costa-Pierce, 1998) and 18,500 cages (Murniyati et al., 2006), whereas itwas estimated around 20,300 cages based on empirical results ofmaximum productivity per cage (Abery et al., 2005). However, after2003, the number of cages in activity (>38,000) was about twicethe estimated carrying capacity of the reservoir. This high cagedensity has led to a declining productivity per cage, from 3.5 to 7.0to less than 1.2e1.5 tons per cage per year (Prihadi, 2003). Theaverage weight of harvested carps also decreased from 1000 to350e500 g, as reported by cage operators surveyed. Water qualityanalyses from twelve sampling stations across the reservoir foundthe concentrations of sulphate, hydrogen sulphide, ammonia, ni-trite, phosphate and organic matter exceeding water quality stan-dards for aquaculture (Murniyati et al., 2006). In addition, anincreased susceptibility to disease and rate of mortality wasobserved in the reservoir (Bondad-Reantaso, 2004).
In this context, this paper explores the environmental implica-tions of cage aquaculture in the Cirata reservoir, through a systemanalysis of input production (supporting production systems), fishproduction (main production system), and transport activities(transport of inputs and intermediate products in all stages) asso-ciated with the whole supply chain in order to identify areas forenvironmental sustainability improvement.
2. Methodology
Life Cycle Assessment (LCA) was applied to evaluate the envi-ronmental consequences of the two-net cage aquaculture produc-tion system developed in the reservoirs of West Java. Previousstudies have demonstrated the potential uses of LCA in aquaculturemanagement (Papatryphon et al., 2004; Mungkung et al., 2005;Mungkung, 2005; Aubin et al., 2006; Ellingsen and Aanondsen,2006; Mungkung and Gheewala, 2007; Aubin et al., 2009; Ayeret al., 2007; Pelletier and Tyedmers, 2007; Pelletier et al., 2009;Pelletier and Tyedmers, 2010). LCA standardized methodology isdescribed in the International Organization for Standardization(ISO) standards (ISO, 2006a; ISO, 2006b) and each phase of meth-odology adopted in this LCA study is explained hereafter.
2.1. System boundary
The system evaluated in this study covers the supply chain fromhatchery (fingerling production) to farm (fish rearing in cages) andtransport of fry and feed as well as that of harvested fish to localmarkets. The functional unit was one tonne of fresh fish delivered
Please cite this article in press as: Mungkung, R., et al., Life Cycle Assessmstudy of combined aquaculture systems for carp and tilapia, Jj.jclepro.2013.05.029
to the market. Downstream life cycle stages (i.e. consumption andpost-consumption, waste management) were not considered, asthey are not relevant for aquaculture management decisions. Basedon the defined system boundary, the required inventory dataincluded the main inputs (energy and resources) and outputs(wastes and pollutants) in hatchery, cage and transport of live fishto local market by using boats and small trucks. The inventory datarequirement also extended to the supporting production systems ofthe following inputs and outputs: energy resource extraction, en-ergy production, feed ingredients’ production, chemicals’ produc-tion and infrastructure materials’ production (Fig. 1). Transport inall stages was also covered.
2.2. Inventory data collection
The inventory data for this study were conducted on an annualproduction basis from 2005 to 2007 by interviewing cage fish-farmers representative of typical production practices of differentfarm sizes. The data collection has been conducted in two stages.The first stage was a general survey on thirty farms, based on arandom sampling within farms of varying technical, social andeconomic performances. The second stage consisted in a detailedsurvey on five farms, to validate the previous data and completeinventories especially on facilities and feed origins. All the collecteddata were validated by local experts from the Indonesian Depart-ment of Marine Affairs and Fisheries. Inventory data for carpfingerling production were gathered by collecting the data fromthree hatcheries located between 150 and 200 km from the reser-voir. All hatcheries used broodstock from the same district; theassociated inventory data of broodstock production were obtainedthrough an interview with a representative fish farmer specialisedin carp broodstock production. For tilapia fingerlings production,the inventory datawere collected by interviewing a tilapia hatcheryowner at 80 km from the reservoir. The production of tilapia fry andjuveniles was conducted in ponds using natural productivityenhanced by chicken manure fertilisation, and the addition of ricebran or rice meal (homemade enrichment, Table 1). The inventorydata for chicken manure production was provided by a study onchicken production in France and Brazil (Da Silva et al. 2010), andadapted to local context by specific data (density, growth, feedconversion) from a chicken grower who sells chicken manure.Environmental impacts associated with products from chickenproduction (chicken meat and chicken manure) were allocatedaccording to their economic values, estimated by their annualaverage prices. Commercial pelleted feeds are used for rearing carpbroodstock (Feed 1), and for grow-out of both carp fingerlings inthe hatcheries and fish in the cages (Feeds 2e4). Their chemical andingredients compositions (Table 1) were determined on the com-mercial labels completed by interviews of a feed company nutri-tionist and the manager of a feed mill. The feed formulations werethen validated by nutritional value according to Guillaume et al.(1999). This data was complemented by detailed informationfrom a local feed producer, including the energy use for feed pro-duction. The inventory data for local fishmeal production wascollected from a local fishery processing plant dedicated to frozenfish (for export), surimi and fishmeal (Palembang, Sumatra Island).Fishmeal was produced from discarded fish from the freezing andsurimi activities. Heat energy from wood wastes was used forfishmeal processing. Environmental impacts associated withproducts from trawling fisheries (exported fish, surimi rawmaterialfish, and trash fish) were allocated according to their economicvalues. Data for world market crop-based ingredients wereconsidered according to Boissy et al. (2011). The inventory data forIndonesian electricity production were obtained from Widiyantoet al. (2003).
ent for environmentally sustainable aquaculture management: a caseournal of Cleaner Production (2013), http://dx.doi.org/10.1016/
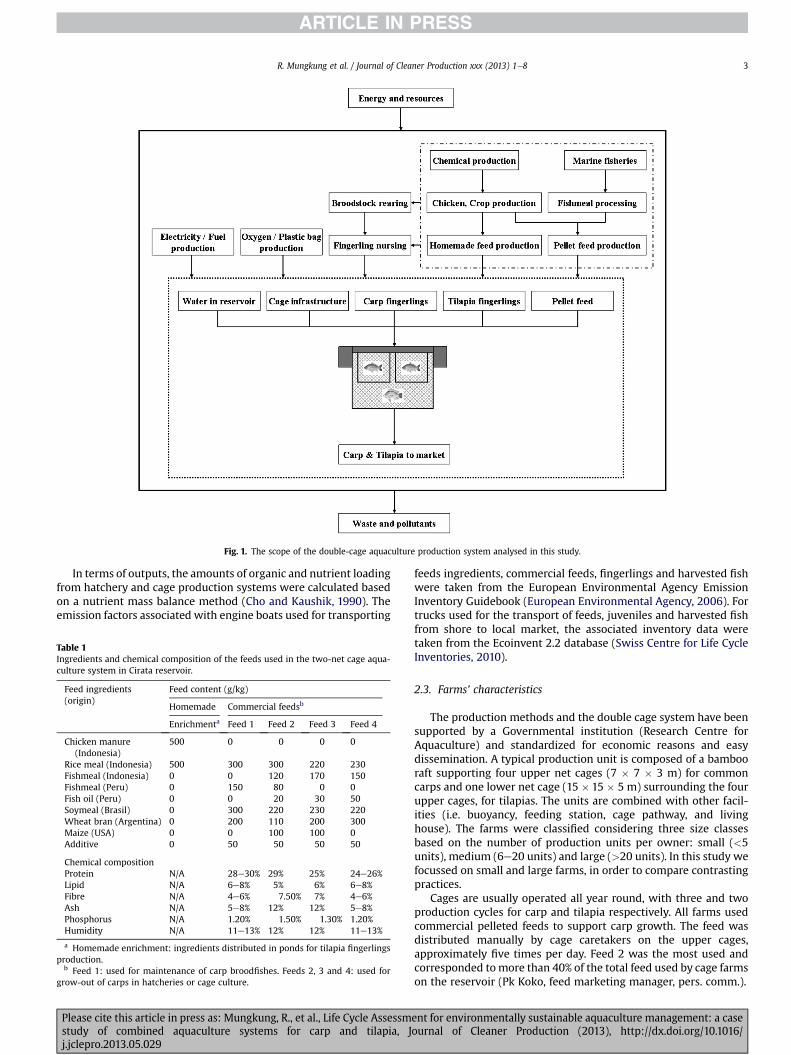
Fig. 1. The scope of the double-cage aquaculture production system analysed in this study.
R. Mungkung et al. / Journal of Cleaner Production xxx (2013) 1e8 3
In terms of outputs, the amounts of organic and nutrient loadingfrom hatchery and cage production systems were calculated basedon a nutrient mass balance method (Cho and Kaushik, 1990). Theemission factors associated with engine boats used for transporting
Table 1Ingredients and chemical composition of the feeds used in the two-net cage aqua-culture system in Cirata reservoir.
Feed ingredients(origin)
Feed content (g/kg)
Homemade Commercial feedsb
Enrichmenta Feed 1 Feed 2 Feed 3 Feed 4
Chicken manure(Indonesia)
500 0 0 0 0
Rice meal (Indonesia) 500 300 300 220 230Fishmeal (Indonesia) 0 0 120 170 150Fishmeal (Peru) 0 150 80 0 0Fish oil (Peru) 0 0 20 30 50Soymeal (Brasil) 0 300 220 230 220Wheat bran (Argentina) 0 200 110 200 300Maize (USA) 0 0 100 100 0Additive 0 50 50 50 50
Chemical compositionProtein N/A 28e30% 29% 25% 24e26%Lipid N/A 6e8% 5% 6% 6e8%Fibre N/A 4e6% 7.50% 7% 4e6%Ash N/A 5e8% 12% 12% 5e8%Phosphorus N/A 1.20% 1.50% 1.30% 1.20%Humidity N/A 11e13% 12% 12% 11e13%
a Homemade enrichment: ingredients distributed in ponds for tilapia fingerlingsproduction.
b Feed 1: used for maintenance of carp broodfishes. Feeds 2, 3 and 4: used forgrow-out of carps in hatcheries or cage culture.
Please cite this article in press as: Mungkung, R., et al., Life Cycle Assessmstudy of combined aquaculture systems for carp and tilapia, Jj.jclepro.2013.05.029
feeds ingredients, commercial feeds, fingerlings and harvested fishwere taken from the European Environmental Agency EmissionInventory Guidebook (European Environmental Agency, 2006). Fortrucks used for the transport of feeds, juveniles and harvested fishfrom shore to local market, the associated inventory data weretaken from the Ecoinvent 2.2 database (Swiss Centre for Life CycleInventories, 2010).
2.3. Farms’ characteristics
The production methods and the double cage system have beensupported by a Governmental institution (Research Centre forAquaculture) and standardized for economic reasons and easydissemination. A typical production unit is composed of a bambooraft supporting four upper net cages (7 � 7 � 3 m) for commoncarps and one lower net cage (15 � 15 � 5 m) surrounding the fourupper cages, for tilapias. The units are combined with other facil-ities (i.e. buoyancy, feeding station, cage pathway, and livinghouse). The farms were classified considering three size classesbased on the number of production units per owner: small (<5units), medium (6e20 units) and large (>20 units). In this study wefocussed on small and large farms, in order to compare contrastingpractices.
Cages are usually operated all year round, with three and twoproduction cycles for carp and tilapia respectively. All farms usedcommercial pelleted feeds to support carp growth. The feed wasdistributed manually by cage caretakers on the upper cages,approximately five times per day. Feed 2 was the most used andcorresponded tomore than 40% of the total feed used by cage farmson the reservoir (Pk Koko, feed marketing manager, pers. comm.).
ent for environmentally sustainable aquaculture management: a caseournal of Cleaner Production (2013), http://dx.doi.org/10.1016/
R. Mungkung et al. / Journal of Cleaner Production xxx (2013) 1e84
Small farms are usually located near to the shore for easy access,whereas large farms tended to position far from the shore for betterwater quality. Moreover, large farms were likely to give more feedthan small farms due to higher stocking density as well as betterfinancial capacity for buying commercial pelleted feeds. However,feeding management was highly dependent on the farm owners’experience and in many cases depended on caretakers’ skills. Thesefactors have resulted in varied Feed Conversion Ratio (FCR). FCR isdefined here as the ratio of the total feed input into cage systemover the net gain of cumulated carp and tilapiawet biomass (i.e. theweight of harvested carp and tilapia minus the initial weight of carpand tilapia fingerlings). The FCR from our field observations rangedbetween 1.7 and 2.1 and it was noticed that large farms tended tohave lower FCRs than small farms. These FCRs were in accordanceto those (1.7) reported by Pelletier and Tyedmers (2010) for tilapialake culture in Indonesia. Consequently, two contrasted practiceswere defined (Table 2): Practice 1 (large farms) was associated to ahigh stocking level of carp fingerlings and a moderate FCR level dueto good feeding practice or relatively good water quality; Practice 2(small farms) was associated to lower carp stocking density andhigher FCR due to poor feeding management or relatively worstwater quality.
Three main different types of feed (Feeds 2e4) were used at thecage growing stage. Their compositions are given in Table 1. Thefishmeal (both local and non-local) contents were 15e20% and thefish oil contents were 2e5%. Fishmeal was produced locally andsourced partially from overseas, whereas fish oil was exclusivelyimported. Rice meal (22e30%), soy meal (22e23%), and wheat bran(11e30%) were the crop-derived feed materials mainly used in allfeeds. Maize was only applied in Feeds 2 and 3 (10%) but not in Feed4. Rice meal was produced locally whilst the others ingredients(maize, wheat bran) were sourced from abroad and transported toIndonesia by truck and boat.
In terms of nutritional composition, Feed 2 had slightly higherprotein content compared to Feeds 3 and 4 due to a higher pro-portion of fishmeal which was the main protein source. Associatedwith a high content of rice meal, Feed 2 had slightly higher fibreand ash contents than Feeds 3 and 4. The lipid level in all feedswas in a similar range. The nutritional levels of the three feeds fellinto the acceptable range recommended for carp and tilapia(Lovell, 1991). No difference on fish growth was observed by usingthese different feeds, thus it could be assumed that the quality ofthese three feeds was relatively equivalent and did not lead tosignificant differences of FCR; above all, it is the deterioratingwater quality in the reservoir which dominantly influenced thecage productivity.
In a first step, the two farm practices using the same Feed (n�2)were assessed. In a second step the influence of feed compositionswas analysed.
Table 2Main characteristics of the two-net cage aquaculture system according to contrastedpractices. Practice 1: large farms, high fish stocking density, generally appropriatefeeding practice or water quality; Practice 2: small farms, relatively lower fishstocking density, feeding practice efficiency or water quality than for practice 1 (seetext for details).
Level of inputs and outputs Average values
Practice 1 Practice 2
Carp fingerlings (no./unit/year) 90,000 72,000Tilapia fingerlings (no./unit/year) 10,000 6500Pellet feed (kg/unit/year) 33,170 21,226Harvested carp (kg/unit/year) 18,450 10,368Harvested tilapia (kg/unit/year) 1640 728Feed Conversion Ratio 1.7 2.1
Please cite this article in press as: Mungkung, R., et al., Life Cycle Assessmstudy of combined aquaculture systems for carp and tilapia, Jj.jclepro.2013.05.029
2.4. Impact indicators and assessment method
The associated inventory data were transformed into impactindicator values and expressed per tonne of harvested fish (carpand tilapia) delivered to the market. The impact indicatorsconsidered in this study were: water dependence (m3), energy use(MJ), land occupation (m2 year), climate change potential (CCP, kgCO2-equivalent), acidification potential (AP, kg SO2-equivalent),eutrophication potential (EP, kg PO4-equivalent) and net primaryproduction use (NPP, kg of carbon content). Water dependenceincluded the volume of water flowing into cages as proposed foraquaculture production systems by Aubin et al. (2009), as well asthe amount of water used in ponds at the hatchery productionsystem. It also includes the water use for irrigation of crops, espe-cially in rice fields. The land areas occupied for crop-based feedmaterial production, ponds, hatchery (but not the floating farmfacilities as the lake surface is not is not in competition with otherterrestrial activities) were taken into account for the land occupa-tion. NPP refers to the biotic resource use both from plant or animalmaterials in terms of carbon contents as a result of net carbon fluxin trophic levels (i.e. the position it occupies in a food chain toindicate the biomass transfer efficiency and net primary produc-tion), which was calculated based on the method described inPapatryphon et al. (2004). The characterisation factors for CCP, APand EPwere based on the CML2 Baseline 2000 version 2.03 (Guinéeet al., 2002). Energy usewas calculated according to the CumulativeEnergy Demand method, version 1.03 (Frischknecht et al., 2004).
3. Results and discussion
The impact analysis of the two rearing practices using Feed 2 ispresented in Table 3. The difference between the impacts of carpsand tilapias, relatively to the whole fish production, was 30% whenconsidering the economic allocation which associates the produc-tion level and themarket value of species. This difference illustratesthe role of the two species: carp being the target species with thehigher market price (10,000 Rp1/kg) and the higher productionlevel (around 94% of total production), tilapia playing the role ofsecondary species devoted to cleaning, with a lower value(7000 Rp/kg).
The lower level for all impact categories for one tonne of fish,was obtained for Practice 1, characterised by higher rearing den-sities in large farms, better fish feeding practices (indicated bylower FCR) and better water quality environment. The difference inimpact values between the two rearing practices was variable. Itranged from 12% for energy use to 40% for eutrophication, with amain group of impact variation around 14% for land occupation,climate change, NPP use and acidification. This result suggests thatthe difference between impacts of the two practices is less relatedto variations in input consumption than to the efficiency of inputuse, especially of feed which leads to a high level of eutrophication.The higher FCR observed in practice 2 farms was associated with anincreased quantity of feed required for the production of fish andconsequently increased quantities of inputs (energy, fishery andcrop-based sources).
On average, one tonne of total fish production (carp and tilapia)required 1000 m3 of water, 71% due to irrigation of crop production(especially for rice), 19% due to water inflow into cages during therearing period, and 10% for fingerlings production. A land area of1700 m2 year�1 was needed, mostly for crop-based feed materialsproduction. As a result of fuel and electricity use, 31,000 MJ ofenergy (Cumulative Energy Demand) was used. Emissions to aircontributed to climate change of 1900 kg CO2 eq. and acidificationof 15 kg SO2 eq. per tonne of fish. Eutrophication reached122 kg PO4 eq. on average, mainly due to the nutrient discharge
ent for environmentally sustainable aquaculture management: a caseournal of Cleaner Production (2013), http://dx.doi.org/10.1016/
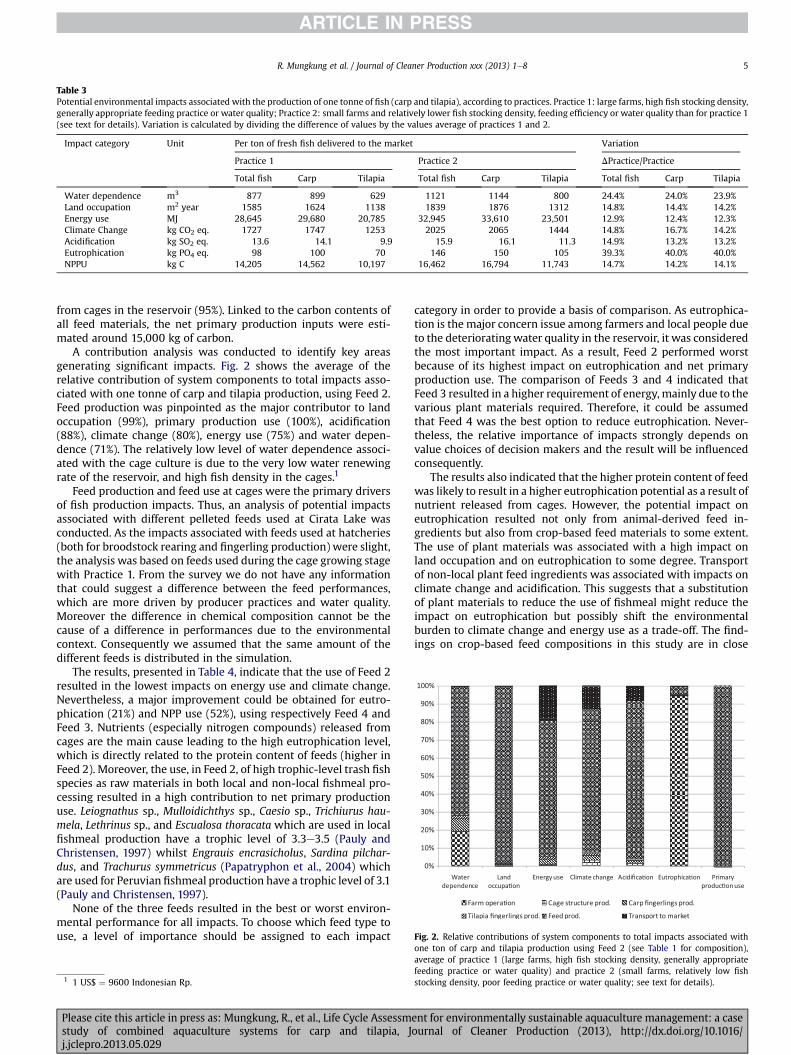
Table 3Potential environmental impacts associated with the production of one tonne of fish (carp and tilapia), according to practices. Practice 1: large farms, high fish stocking density,generally appropriate feeding practice or water quality; Practice 2: small farms and relatively lower fish stocking density, feeding efficiency or water quality than for practice 1(see text for details). Variation is calculated by dividing the difference of values by the values average of practices 1 and 2.
Impact category Unit Per ton of fresh fish delivered to the market Variation
Practice 1 Practice 2 DPractice/Practice
Total fish Carp Tilapia Total fish Carp Tilapia Total fish Carp Tilapia
Water dependence m3 877 899 629 1121 1144 800 24.4% 24.0% 23.9%Land occupation m2 year 1585 1624 1138 1839 1876 1312 14.8% 14.4% 14.2%Energy use MJ 28,645 29,680 20,785 32,945 33,610 23,501 12.9% 12.4% 12.3%Climate Change kg CO2 eq. 1727 1747 1253 2025 2065 1444 14.8% 16.7% 14.2%Acidification kg SO2 eq. 13.6 14.1 9.9 15.9 16.1 11.3 14.9% 13.2% 13.2%Eutrophication kg PO4 eq. 98 100 70 146 150 105 39.3% 40.0% 40.0%NPPU kg C 14,205 14,562 10,197 16,462 16,794 11,743 14.7% 14.2% 14.1%
Fig. 2. Relative contributions of system components to total impacts associated with
R. Mungkung et al. / Journal of Cleaner Production xxx (2013) 1e8 5
from cages in the reservoir (95%). Linked to the carbon contents ofall feed materials, the net primary production inputs were esti-mated around 15,000 kg of carbon.
A contribution analysis was conducted to identify key areasgenerating significant impacts. Fig. 2 shows the average of therelative contribution of system components to total impacts asso-ciated with one tonne of carp and tilapia production, using Feed 2.Feed production was pinpointed as the major contributor to landoccupation (99%), primary production use (100%), acidification(88%), climate change (80%), energy use (75%) and water depen-dence (71%). The relatively low level of water dependence associ-ated with the cage culture is due to the very low water renewingrate of the reservoir, and high fish density in the cages.1
Feed production and feed use at cages were the primary driversof fish production impacts. Thus, an analysis of potential impactsassociated with different pelleted feeds used at Cirata Lake wasconducted. As the impacts associated with feeds used at hatcheries(both for broodstock rearing and fingerling production) were slight,the analysis was based on feeds used during the cage growing stagewith Practice 1. From the survey we do not have any informationthat could suggest a difference between the feed performances,which are more driven by producer practices and water quality.Moreover the difference in chemical composition cannot be thecause of a difference in performances due to the environmentalcontext. Consequently we assumed that the same amount of thedifferent feeds is distributed in the simulation.
The results, presented in Table 4, indicate that the use of Feed 2resulted in the lowest impacts on energy use and climate change.Nevertheless, a major improvement could be obtained for eutro-phication (21%) and NPP use (52%), using respectively Feed 4 andFeed 3. Nutrients (especially nitrogen compounds) released fromcages are the main cause leading to the high eutrophication level,which is directly related to the protein content of feeds (higher inFeed 2). Moreover, the use, in Feed 2, of high trophic-level trash fishspecies as raw materials in both local and non-local fishmeal pro-cessing resulted in a high contribution to net primary productionuse. Leiognathus sp., Mulloidichthys sp., Caesio sp., Trichiurus hau-mela, Lethrinus sp., and Escualosa thoracata which are used in localfishmeal production have a trophic level of 3.3e3.5 (Pauly andChristensen, 1997) whilst Engrauis encrasicholus, Sardina pilchar-dus, and Trachurus symmetricus (Papatryphon et al., 2004) whichare used for Peruvian fishmeal production have a trophic level of 3.1(Pauly and Christensen, 1997).
None of the three feeds resulted in the best or worst environ-mental performance for all impacts. To choose which feed type touse, a level of importance should be assigned to each impact
1 1 US$ ¼ 9600 Indonesian Rp.
Please cite this article in press as: Mungkung, R., et al., Life Cycle Assessmstudy of combined aquaculture systems for carp and tilapia, Jj.jclepro.2013.05.029
category in order to provide a basis of comparison. As eutrophica-tion is the major concern issue among farmers and local people dueto the deterioratingwater quality in the reservoir, it was consideredthe most important impact. As a result, Feed 2 performed worstbecause of its highest impact on eutrophication and net primaryproduction use. The comparison of Feeds 3 and 4 indicated thatFeed 3 resulted in a higher requirement of energy, mainly due to thevarious plant materials required. Therefore, it could be assumedthat Feed 4 was the best option to reduce eutrophication. Never-theless, the relative importance of impacts strongly depends onvalue choices of decision makers and the result will be influencedconsequently.
The results also indicated that the higher protein content of feedwas likely to result in a higher eutrophication potential as a result ofnutrient released from cages. However, the potential impact oneutrophication resulted not only from animal-derived feed in-gredients but also from crop-based feed materials to some extent.The use of plant materials was associated with a high impact onland occupation and on eutrophication to some degree. Transportof non-local plant feed ingredients was associated with impacts onclimate change and acidification. This suggests that a substitutionof plant materials to reduce the use of fishmeal might reduce theimpact on eutrophication but possibly shift the environmentalburden to climate change and energy use as a trade-off. The find-ings on crop-based feed compositions in this study are in close
one ton of carp and tilapia production using Feed 2 (see Table 1 for composition),average of practice 1 (large farms, high fish stocking density, generally appropriatefeeding practice or water quality) and practice 2 (small farms, relatively low fishstocking density, poor feeding practice or water quality; see text for details).
ent for environmentally sustainable aquaculture management: a caseournal of Cleaner Production (2013), http://dx.doi.org/10.1016/
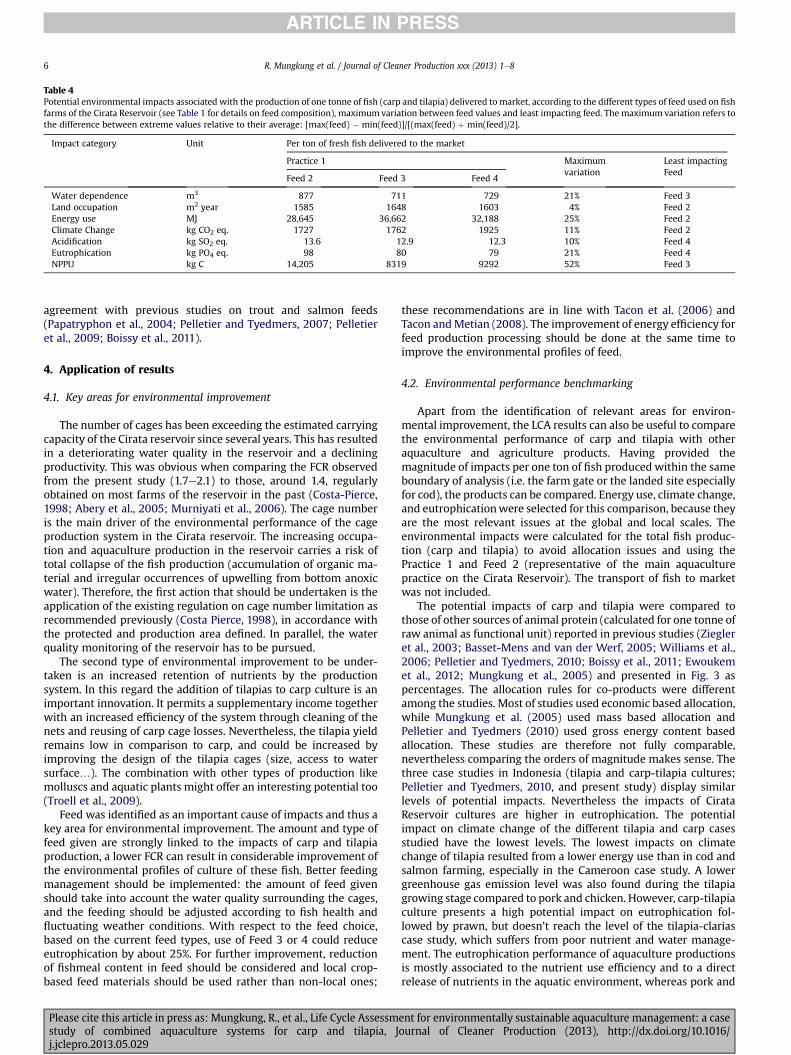
Table 4Potential environmental impacts associated with the production of one tonne of fish (carp and tilapia) delivered to market, according to the different types of feed used on fishfarms of the Cirata Reservoir (see Table 1 for details on feed composition), maximumvariation between feed values and least impacting feed. The maximumvariation refers tothe difference between extreme values relative to their average: [max(feed) � min(feed)]/[(max(feed) þ min(feed)/2].
Impact category Unit Per ton of fresh fish delivered to the market
Practice 1 Maximumvariation
Least impactingFeed
Feed 2 Feed 3 Feed 4
Water dependence m3 877 711 729 21% Feed 3Land occupation m2 year 1585 1648 1603 4% Feed 2Energy use MJ 28,645 36,662 32,188 25% Feed 2Climate Change kg CO2 eq. 1727 1762 1925 11% Feed 2Acidification kg SO2 eq. 13.6 12.9 12.3 10% Feed 4Eutrophication kg PO4 eq. 98 80 79 21% Feed 4NPPU kg C 14,205 8319 9292 52% Feed 3
R. Mungkung et al. / Journal of Cleaner Production xxx (2013) 1e86
agreement with previous studies on trout and salmon feeds(Papatryphon et al., 2004; Pelletier and Tyedmers, 2007; Pelletieret al., 2009; Boissy et al., 2011).
4. Application of results
4.1. Key areas for environmental improvement
The number of cages has been exceeding the estimated carryingcapacity of the Cirata reservoir since several years. This has resultedin a deteriorating water quality in the reservoir and a decliningproductivity. This was obvious when comparing the FCR observedfrom the present study (1.7e2.1) to those, around 1.4, regularlyobtained on most farms of the reservoir in the past (Costa-Pierce,1998; Abery et al., 2005; Murniyati et al., 2006). The cage numberis the main driver of the environmental performance of the cageproduction system in the Cirata reservoir. The increasing occupa-tion and aquaculture production in the reservoir carries a risk oftotal collapse of the fish production (accumulation of organic ma-terial and irregular occurrences of upwelling from bottom anoxicwater). Therefore, the first action that should be undertaken is theapplication of the existing regulation on cage number limitation asrecommended previously (Costa Pierce, 1998), in accordance withthe protected and production area defined. In parallel, the waterquality monitoring of the reservoir has to be pursued.
The second type of environmental improvement to be under-taken is an increased retention of nutrients by the productionsystem. In this regard the addition of tilapias to carp culture is animportant innovation. It permits a supplementary income togetherwith an increased efficiency of the system through cleaning of thenets and reusing of carp cage losses. Nevertheless, the tilapia yieldremains low in comparison to carp, and could be increased byimproving the design of the tilapia cages (size, access to watersurface.). The combination with other types of production likemolluscs and aquatic plants might offer an interesting potential too(Troell et al., 2009).
Feed was identified as an important cause of impacts and thus akey area for environmental improvement. The amount and type offeed given are strongly linked to the impacts of carp and tilapiaproduction, a lower FCR can result in considerable improvement ofthe environmental profiles of culture of these fish. Better feedingmanagement should be implemented: the amount of feed givenshould take into account the water quality surrounding the cages,and the feeding should be adjusted according to fish health andfluctuating weather conditions. With respect to the feed choice,based on the current feed types, use of Feed 3 or 4 could reduceeutrophication by about 25%. For further improvement, reductionof fishmeal content in feed should be considered and local crop-based feed materials should be used rather than non-local ones;
Please cite this article in press as: Mungkung, R., et al., Life Cycle Assessmstudy of combined aquaculture systems for carp and tilapia, Jj.jclepro.2013.05.029
these recommendations are in line with Tacon et al. (2006) andTacon andMetian (2008). The improvement of energy efficiency forfeed production processing should be done at the same time toimprove the environmental profiles of feed.
4.2. Environmental performance benchmarking
Apart from the identification of relevant areas for environ-mental improvement, the LCA results can also be useful to comparethe environmental performance of carp and tilapia with otheraquaculture and agriculture products. Having provided themagnitude of impacts per one ton of fish produced within the sameboundary of analysis (i.e. the farm gate or the landed site especiallyfor cod), the products can be compared. Energy use, climate change,and eutrophicationwere selected for this comparison, because theyare the most relevant issues at the global and local scales. Theenvironmental impacts were calculated for the total fish produc-tion (carp and tilapia) to avoid allocation issues and using thePractice 1 and Feed 2 (representative of the main aquaculturepractice on the Cirata Reservoir). The transport of fish to marketwas not included.
The potential impacts of carp and tilapia were compared tothose of other sources of animal protein (calculated for one tonne ofraw animal as functional unit) reported in previous studies (Ziegleret al., 2003; Basset-Mens and van der Werf, 2005; Williams et al.,2006; Pelletier and Tyedmers, 2010; Boissy et al., 2011; Ewoukemet al., 2012; Mungkung et al., 2005) and presented in Fig. 3 aspercentages. The allocation rules for co-products were differentamong the studies. Most of studies used economic based allocation,while Mungkung et al. (2005) used mass based allocation andPelletier and Tyedmers (2010) used gross energy content basedallocation. These studies are therefore not fully comparable,nevertheless comparing the orders of magnitude makes sense. Thethree case studies in Indonesia (tilapia and carp-tilapia cultures;Pelletier and Tyedmers, 2010, and present study) display similarlevels of potential impacts. Nevertheless the impacts of CirataReservoir cultures are higher in eutrophication. The potentialimpact on climate change of the different tilapia and carp casesstudied have the lowest levels. The lowest impacts on climatechange of tilapia resulted from a lower energy use than in cod andsalmon farming, especially in the Cameroon case study. A lowergreenhouse gas emission level was also found during the tilapiagrowing stage compared to pork and chicken. However, carp-tilapiaculture presents a high potential impact on eutrophication fol-lowed by prawn, but doesn’t reach the level of the tilapia-clariascase study, which suffers from poor nutrient and water manage-ment. The eutrophication performance of aquaculture productionsis mostly associated to the nutrient use efficiency and to a directrelease of nutrients in the aquatic environment, whereas pork and
ent for environmentally sustainable aquaculture management: a caseournal of Cleaner Production (2013), http://dx.doi.org/10.1016/
Fig. 3. Relative potential impacts of the production of one ton of carp and tilapia in the Cirata cage-aquaculture system compared to one tonne of other animal products. Allocationmethods: Economic allocation: Basset-Mens and van der Werf, 2005; Williams et al., 2006; Boissy et al., 2011; Ewoukem et al., 2012; Mass based allocation: Mungkung et al., 2005;Gross energy based allocation: Pelletier and Tyedmers, 2010.
R. Mungkung et al. / Journal of Cleaner Production xxx (2013) 1e8 7
chicken manure are spread on land. Chicken and pork performbetter than aquatic products, especially than cod, in terms of energyuse (tilapia e Clarias case excepted). The highest energy use in codwas linked to the diesel use for the trawling operation. This com-parison between production systems should be interpreted withcaution, because of differences in LCA methodologies: allocationrules and characterisation methods. Nevertheless, the orders ofmagnitude are robust.
It should be noted here that a different basis could be used tocompare the environmental performance of different sources ofanimal protein, for instance, the normalisation of environmentalindicator values with the essential nutrient levels given by differentmeats (Mungkung and Gheewala, 2007) or the edible protein en-ergy output per energy input, the so called edible-protein energyreturn on investment ratio (Tyedmers, 2004; Tyedmers et al. 2005).However, different functional units may lead to different results.
5. Conclusions
This study provided a comprehensive evaluation of potentialenvironmental impacts associated with the two-net cage aqua-culture systems of carp and tilapia operated in the Cirata reservoir.LCA results have identified the practices linked to water quality(distance to lake shore) and feeding management as the maincauses of impact. The ability of this production system to valorisethe feed and to retain nutrients should be improved. The carp-tilapia complementarity should be enhanced and completed byother practices (i.e. mollusc culture). Production of feed ingredientsand their origins, energy use in feed manufacture, and nutrientsreleased from feeding fish in the cages, were identified as the mainfactors contributing to impacts. To improve the environmentalprofiles of carp and tilapia production, these factors should besystematically taken into account for improving the feed qualityalong with better feeding management in order to lower the FCR.
Nevertheless, these improvements will not be sufficient to up-grade the water quality of the reservoir, and to establish a virtuouscircle, giving good conditions to improve the fish production effi-ciency and diminish the effluent level. We therefore recommend areduction of the number of cages in accordance with the lake’scarrying capacity and to survey the water quality of the whole lake.
Please cite this article in press as: Mungkung, R., et al., Life Cycle Assessmstudy of combined aquaculture systems for carp and tilapia, Jj.jclepro.2013.05.029
The analysis on feed type influence was useful to determine aquantitative potential improvement by means of feed composition.Nevertheless, this result is not univocal, and shows a trade-off be-tween energy use and eutrophication. The environmental perfor-mance comparison facilitated the benchmarking of carp and tilapiawith other cultivated species. For instance, the Cirata reservoirproduction systems have a better efficiency for energy use and alower emission of greenhouse gas than salmon farming. Never-theless, their hot spot remains eutrophication.
This study thus showed the usefulness of LCA for better un-derstanding the potential environmental impacts associated withaquaculture product/production systems and providing supportinginformation to make decisions for more sustainable aquaculturemanagement. The data produced by the study should be used inparticipatory approaches in order to build a common vision be-tween farmers and civil service of the problems of Cirata Reservoirto find shared solutions, as proposed from the “Evad” Project (Rey-Valette et al., 2008; Lazard et al., 2010).
Acknowledgement
This paper forms part of the Agriculture and SustainableDevelopment (“Agriculture et Développement Durable”) project“EVAD” financed by the French National Research Agency (“ANR -Agence Nationale de la Recherche”) e Contract ANR-05-PADD-008.
References
Abery, N.W., Sukadi, F., Kartamihardja, E.S., Koeshendrajana, S., Buddhiman, S., deSilva, S.S., 2005. Fisheries and cage culture of three reservoirs in west Java,Indonesia: a case study of ambitious development and resulting interactions.Fish. Manage. Ecol. 12, 315e330.
Aubin, J., Papatryphon, E., Van der Werf, H.M.G., Petit, J., Morvan, Y.M., 2006.Characterisation of the environmental impact of a turbot (Scophthalmus max-imus) re-circulating production system using Life Cycle Assessment. Aquacul-ture 261, 1259e1268.
Aubin, J., Papatryphon, E., Van der Werf, H.M.G., Chatzifotis, S., 2009. Assessment ofthe environmental impact of carnivorous finfish production systems using lifecycle assessment. J. Clean Prod. 17 (3), 354e361.
Ayer, N.W., Tyedmers, P.H., Pelletier, N.L., Sonesson, U., Scholz, A., 2007. Co-productallocation in life cycle assessments of seafood production systems: review ofproblems and strategies. Int. J. Life Cycle Assess. 12, 480e487.
ent for environmentally sustainable aquaculture management: a caseournal of Cleaner Production (2013), http://dx.doi.org/10.1016/
R. Mungkung et al. / Journal of Cleaner Production xxx (2013) 1e88
Basset-Mens, C., van der Werf, H.M.G., 2005. Scenario-based environmentalassessment of farming systems: the case of pig production in France. Agr.Ecosyst. Environ. 105, 127e144.
Boissy, J., Aubin, J., Drissi, A., van der Werf, H.M.G., Bell, G.J., Kaushik, S.J., 2011.Environmental impacts of plant-based salmonid diets at feed and farm scales.Aquaculture 321, 61e70.
Bondad-Reantaso, M.G., 2004. Trans-boundary aquatic animal diseases focus on KoiHerpes Virus (KHV). Aquacult. Asia 9, 24e28.
Cho, C.Y., Kaushik, S.J., 1990. Nutritional energetics in fish: protein and energyutilization in rainbow trout. In: Bourne, G.H. (Ed.), Aspects of Food Production,Consumption and Energy Values. World Rev. Nut. Diet 61, 132e172.
Costa-Pierce, B.A., 1998. Constraints to the sustainability of cage aquaculture forresettlement from hydropower dams in Asia: an Indonesian case study.J. Environ. Devel 7, 333e336.
Da Silva, V.P., Van der Werf, H.M.G., Soares, S.R., 2010. LCA of French and Brazilianpoultry broiler production systems. Working towards a more sustainable agri-food industry. In: Proceedings of the 7th International Conference on Life CycleAssessment in the Agri-food Sector, Bari, Italy, 22e24 September 2010.
Ellingsen, S., Aanondsen, S.A., 2006. Environmental impacts of wild caught codand farmed salmon e a comparison with chicken. Int. J. Life Cycle Assess. 1(1), 60e65.
European Environmental Agency (EEA), December, 2006. EMEP/CORINAIR EmissionInventory Guidebook. Available online at: http://reports.eea.europa.eu/EMEPCORINAIR3/en/page002.html (last accessed March, 2008).
Ewoukem, T.E., Aubin, J., Mikolasek, O., Corson, M.S., Eyango, M.T.,Tchoumboue, J., van der Werf, H.M.G., Ombredane, D., 2012. Environmentalimpacts of farms integrating aquaculture and agriculture in Cameroon.J. Clean. Prod. 28, 208e214.
Food and Agriculture Organization of the United Nations (FAO), 2010. State of WorldFisheries and Aquaculture 2010. FAO, Rome, p. 224.
Frischknecht, R., Jungbluth, N., Althaus, H.J., Doka, G., Dones, R., Hirschier, R.,Hellweg, S., Humbert, S., Margni, M., Nemecek, T., Speilmann, M., 2004.Implementation of Life Cycle Impact Assessment Methods (Version 1.1). Eco-Invent Report No. 3. Swiss Centre for Life Cycle Inventories, Dübendorf, p. 116.
Guillaume, J., Kaushik, S.J., Bergot, P., Métailler, R. (Eds.), 1999. Nutritionet alimentation des poissons et crustacés. INRA Editions, Paris, p. 489.
Guinée, J.B., Gorrée, M., Heijungs, R., Huppes, G., Kleijn, R., de Koning, A., vanOers, L., Wegener Sleeswijk, A., Suh, S., Udo de Haes, H.A., de Bruijn, H., vanDuin, R., Huijbregts, M.A.J., 2002. Handbook on Life Cycle Assessment. AnOperational Guide to the ISO Standards. Kluwer Academic Publishers, Dor-drecht, The Netherlands, p. 692.
ISO (The International Organization for Standardisation), 2006a. EnvironmentalManagement e Life Cycle Assessment e Principles and Framework. ISO 14040.ISO, Geneva, p. 32.
ISO (The International Organization for Standardisation), 2006b. EnvironmentalManagement e Life Cycle Assessment e Requirements and Guidelines. ISO14044. ISO, Geneva, p. 58.
Lazard, J., Baruthio, A., Mathé, S., Rey-Valette, H., Chia, E., Clément, O., Aubin, J.,Morissens, P., Mikolasek, O., Legendre, M., Levang, P., Blancheton, J.P., René, F.,2010. Aquaculture system diversity and sustainable development: fish farmsand their representation. Aquatic Living Resour. 23 (2), 187e198.
Lovell, R.T., 1991. Nutrition of aquaculture species. J. Anim. Sci. 69, 4193e4200.Mungkung, R., 2005. Shrimp Aquaculture in Thailand: Application of Life Cycle Assess-
ment to Support Sustainable Development (PhD Dissertation). Centre for Environ-mental Strategy (CES), School of Engineering, University of Surrey, UK, p. 360.
Mungkung, R., Udo de Haes, H.A., Clift, R., 2005. Potentials and limitations of LifeCycle Assessment in setting ecolabelling criteria: a case study of Thai shrimpaquaculture product. Int. J. Life Cycle Assess. 11 (1), 55e59.
Please cite this article in press as: Mungkung, R., et al., Life Cycle Assessmstudy of combined aquaculture systems for carp and tilapia, Jj.jclepro.2013.05.029
Mungkung, R., Gheewala, S., 2007. Use of life cycle assessment (LCA) to compare theenvironmental impacts of aquaculture and agri-food products. FAO/WFT ExpertWorkshop. 24e28 April, 206, Vancouver, Canada. In: Bartley, D.M., Brugère, C.,Soto, D., Gerber, P., Harvey, B. (Eds.), Comparative Assessment of the Environ-mental Costs of Aquaculture and Other Food Production Sectors: Methods forMeaningful Comparisons, FAO Fisheries Proceeding. No.10. FAO, Rome, pp. 87e96.
Murniyati, A.S., Tri Heru, P., Priyono, B., 2006. Management of sustainable floatingnet cage aquaculture on reservoir. The case study of Cirata reservoir, west JavaProvince, Indonesia. In: Paper Presentation at the Second International Sym-posium on Cage Aquaculture in Asia (CAA2), Zhejiang University, Hangzhou,Zhejiang Province, China, 3e8 July.
Papatryphon, E., Petit, J., Kaushik, S.J., van der Werf, H.M.G., 2004. Environmentalimpact assessment of salmonid feeds using Life Cycle Assessment (LCA). Ambio33 (6), 316e323.
Pauly, D., Christensen, V., 1997. Trophic levels of fishes. Box 16. In: Froese, R., Pauly, D.(Eds.), FishBase 97: Concepts, Design and Data Sources. ICLARM, Manila, p. 127.
Pelletier, N., Tyedmers, P., 2010. Life cycle assessment of frozen tilapia fillets fromIndonesian lake-based and pond-based intensive aquaculture systems. J. Ind.Ecol. 14, 467e481.
Pelletier, N., Tyedmers, P., 2007. Feeding farmed salmon: is organic better? Aqua-culture 272, 399e416.
Pelletier, N., Tyedmers, P., Sonesson, U., Scholz, A., Ziegler, F., Flysjo, A., Kruse, S.,Cancino, B., Silverman, H., 2009. Not all salmon are created equal: life cycleassessment (LCA) of global salmon farming systems. Environ. Sci. Technol. 43(23), 8730e8736.
Prihadi, Tri H., 2003. Upaya Perbaikan Lingkungan Untuk Menunjang Kesi-nambungan Budidaya Ikan Dalam keramba Jaring Apung (KJA). PengembanganBudidaya Perikanan di Waduk. In: Suatu Upaya Pemecahan Masalah BudidayaIkan dalam KJA. Pusat Riset Perikanan Budidaya. DKP, pp. 45e56.
Rey-Valette, H., Clément, O., Aubin, J., Mathé, S., Chia, E., Legendre, M., Caruso, D.,Mikolasek, O., Blancheton, J.-P., Slembrouck, J., Baruthio, A., René, F., Levang, P.,Morissens, P., Lazard, J., 2008. Guide to the Co-construction of SustainableDevelopment Indicators in Aquaculture e EVAD, p. 144.
Swiss Center for Life Cycle Inventories, 2010. Ecoinvent v2 Database. EcoinventCenter 2010.
Tacon, A.G.J.., Hasan, M.R., Subasinghe, R.P., 2006. Use of Fishery Resources as FeedInputs to Aquaculture Development: Trends and Policy Implications. In: FAOFisheries Circular No. 1018. Rome.
Tacon, A.G.J., Metian, M., 2008. Global overview on the use of fish meal and fish oilin industrially compounded aquafeeds: trends and future prospects. Aquacul-ture 285, 146e158.
Troell, M., Joyce, A., Chopin, T., Neori, A., Buschmann, A.H., Fang, J.G., 2009.Ecological engineering in aquaculture e potential for integrated multi-trophicaquaculture (IMTA) in marine offshore systems. Aquaculture 297, 1e9.
Tyedmers, P., 2004. Fisheries and Energy Use. In: Encyclopedia of Energy, vol. 2,pp. 683e693.
Tyedmers, P., Watson, R., Pauly, D., 2005. Fueling global fishing fleets. Ambio 34 (8),619e622.
Widiyanto, A., Kato, S., Maruyama, N., 2003. Environmental impact analysis ofIndonesian electric generation systems (Development of a life cycle inventoryof Indonesian electricity). JSME. Int. J. Ser. B 46 (4), 650e659.
Williams, A.G., Audsley, E., Sandars, D.L., 2006. Determining the EnvironmentalBurdens and Resource Use in the Production of Agricultural and HorticulturalCommodities. Main Report, DEFRA Research Project IS0205. Cranfield Univer-sity and DEFRA, Bedford.
Ziegler, F., Nilsson, P., Mattsson, B., Walther, Y., 2003. Life cycle assessment of frozencod fillets including fishery-specific environmental impacts. Int. J. Life CycleAssess. 8 (1), 39e47.
ent for environmentally sustainable aquaculture management: a caseournal of Cleaner Production (2013), http://dx.doi.org/10.1016/