Embed Size (px)
Citation preview

1
Determination of Shear Strength of Structural and Glued Laminated Timber
R BRANDNER 1) 2); W GATTERNIG 2); G SCHICKHOFER 1) 2)
Graz University of Technology, Institute of Timber Engineering and Wood Technology 1)
Competence Center holz.bau forschungs gmbh 2)
1 Abstract The shear strength of structural and glued laminated timber (GLT) is comprehensively discussed. This is done in respect to quantification of characteristic shear strengths, the influence of stressed volume, the crack coefficient kcr according EN 1995-1-1 [1] as well as the influence and specification of an adequate test method for the investigation of reliable and reproducible standardised properties relevant for standards (e.g. EN 338 [2], prEN 14080 [3] and EN 1995-1-1 [1]).
The shown research project involves a comprehensive literature survey and testing of structural timber in shear. State-of-the-art includes structural timber and GLT, the examination of various test methods as well as physical and mechanical influences on shear strength, in particular the influence of size. Furthermore, a test configuration was developed which enables coherent determination of shear strength of structural timber and GLT. The examination of shear strength performed on structural timber of Norway spruce involved series of various dimensions and grades. Therefore, I-beams were tested in three-point bending. The specimens of interest (webs) were chosen randomly from a specific nominal grading class. Preparation of flanges included stiffness grading and proof loading. Evaluation of shear strength was done by application of simple beam theory assuming composite action between web and flanges. Afterwards the values of more plate-like specimen were corrected based on comparative computations by means of FEM. By testing, the influence of stressed volume, the size effect, and the relationship between bending and shear strength as given in EN 384 [4] and EN 338 [2] were investigated. Additionally, shear deformation was measured in the largest test specimens by means of shear fields placed in zones of constant shear force.
The aim of the research work is to support a comprehensive study and a basis for decision finding regarding the standardisation of characteristic shear strengths of structural timber and GLT of softwoods, in particular Norway spruce, providing a coherent system of testing, material, evaluation and design standards. In conclusion, it can be noted that there is a significant dependency between the shear strength and the shear-stressed zones. According to this, an adjustment of current standards, in which the geometrical dimensions are taken into account by means of a correction factor, is proposed.
2 Introduction The main structural elements in timber engineering are beams or girders stressed in bending. Thus, bending characteristics normally govern the design process. Although all these elements are also stressed in shear, shear resistance seldom limits ULS design. Nevertheless, in some cases, in particular in (i) elements with a low span to depth ratio, (ii) tapered elements, or (iii) elements with notches, shear strength may also become a decisive characteristic, determining ultimate design.
Beside these facts, relevant for practical timber engineering, in general characteristics shall be regulated reliable, accurate and reproducible. Therefore agreement and balancing between the methods applied for determination (test method & configuration), the evaluation and analysis of test results (mechanics and stochastics), the regulation of material and product characteristics and the design procedure is required, regardless its importance.

2
To enable demanded consistency and the transfer of test data to reference conditions it is required to have quantitative information about the main influences on shear strength, at least accurate enough for engineering purposes. Thereby the main influences on shear strength can be categorised into (i) climatic conditions (moisture content & temperature), (ii) characteristics of test material including size & scale effects, (iii) test method & configuration, (iv) effects of duration of load & cyclic or dynamical loading, a.o. Aspects (i) to (iii) are treated further in this paper.
Concerning (i) literature data are presented in Tab. 1. It can be concluded that moisture content has a significant and practical relevant influence on shear strength of about 3% reduction of fv with each percentage increase in u. Nevertheless, with increasing moisture content also a change in failure behaviour can be expected, meaning that brittleness may be somehow reduced. Tab. 1 Shear strength: overview of influencing parameters moisture content and temperature
Literature source Moisture Content (u) Temperature (T) Kollmann [5] (Pine) ~2.4% / 1% Δ MC -- Kretschmann & Green [6] (Southern Pine) ~2.7% / 1% Δ MC -- Rammer & McLean [7] (Douglas Fir & Southern Pine) ~5.3% / 1% Δ MC -- Gerhards [8] ~2.6% / 1% Δ MC 0.4% / Δ 1°C
Correction proposed 3% / 1% Δ MC
for 8% ≤ u ≤ 20% uref = 12% acc. EN 384 [4]
none for 15°C ≤ T ≤ 25°C
Concerning category (ii) a controversy discussion of the relationships between shear strength and other physical properties like density and stiffness characteristics is given. For example, results of Müller et al. [9] and Dahl & Malo [10] reflect no significant correlation between fv and ρ for clear wood. Poussa et al. [11] found the same for GLT. Glos & Denzler [12] report a positive correlation between shear strength in RL-plane (fv,RL) and ρ12. This can be argued by increasing latewood and thus increasing quantity of annual growth rings that have to be sheared. In contrast, fv,TL (TL plane) and fv,45° (in-between RL & TL) are solely determined by the resistance of earlywood which density behaves nearly constant within a timber species. A certain correlation between fv and ρ was also reported by Riyanto [13] (torsion tests) and by Rammer et al. [14] (structural timber, bending). Concerning stiffness e.g. Lam et al. [15] found no correlation between fv and Em,0. Shear tests of Dahl & Malo [10] reflect some correlation between shear modulus and strength in all plane directions, but only significant in RT. Comparable results concerning RL and TL are reported in Müller et al. [9]. Some papers discuss also the relationship between shear and bending (tension) strength, in particular on the 5%-level as for example explicitly and implicitly anchored in EN 338 [16], EN 338 [2] or EN 1194 [17], respectively, see
{ }8.3;20.0min 8.0,, kmkv ff ⋅=
, { }0.4;1.06.1min ,, kmkv ff ⋅+= (1)
according EN 338 [16] for C14 ÷ C50 and according EN 338 [2] for C14 ÷ C50, respectively, and
80.0,,0,,, 32.0 kltkgv ff ⋅= (2)
according EN 1194 [17], for GL24c/h ÷ GL36c/h. Just for a general consideration: Solely theoretically, implementation of the relationship ft,0,k = 0.60 · fm,k as anchored in EN 338 [16], [2] in equ. (1) leads to a formulation comparable with that anchored for GLT, see equ. (2). Beside this, Rammer & Soltis [18], Glos & Denzler [12] and Denzler & Glos [19] found no significant relationship between fv and fm and overall no significant influence of timber quality on shear strength. Although the relationship fv and fm can be questioned generally, because of deviating failure zones and different influencing parameters, nevertheless and in view of current European regulations, this aspect was also analysed within the herein reported research project. In this context, it appears meaningful to discuss the failure behaviour of wood in shear in RL- and TL-plane. By means of microscopic fracture surface analysis Keenan [20], [21] and Müller et al. [9] (besides mixing of RL and TL) conclude that shear failure in RL-plane is a combination of transwall failure in early- and latewood without rays and intrawall failure in latewood with rays. In TL-plane, failure is reported to occur solely as interaction of

3
intra- and transwall fracture in earlywood cells. Thereby rays may act as reinforcement in TL but as drawback in RL, introducing some rolling shear. As consequence fv,RL is normally higher than fv,TL. E.g. Keenan et al. [22] found about 6%, Denzler & Glos [19] about 20% and Dahl & Malo [10] about 40% higher mean values of fv,RL in comparison to fv,TL, whereas no significant difference was reported in Müller et al. [9]. A significant difference between fv,RL and fv,TL is also stated by Quaile & Keenan [23] and Bendsten & Porter [24].
The orientation of shear planes is also of relevance if shear interacts with stresses perpendicular to grain. By testing clear wood Keenan [20], [21] observed a significant influence on fv,RL whereas fv,TL was widely not affected. In case of interaction of τ090 with σc,90 → fc,90 nearly a doubling of fv,RL,mean was considered whereas fv,TL,mean increased only about 20%. In case of σt,90 → ft,90 the mean shear strength fv,RL,mean dropped down to about 50% and less, fv,TL,mean to about 90% and less. It is argued that fv in RL is influenced by some kind of friction whereas fv in TL is not. Irrespective of shear plane orientation comparable results were found by Spengler [25] who observed an increase in fv,mean up to about 50% and a decrease of 60% and more. Tab. 2 Overview of crack coefficients kcr according National Annexes of EN 1995-1-1 [1]
EN 1995-1-1 (Annex) Country kcr,ST kcr,GLT Comments EN 1995-1-1:2009 [1] EU 0.67 0.67 [--]
ON B 1995-1-1/NA:2010 [26] Austria 0.67 0.83 fv,k independent of strength class: solid timber fv,k = 3.1 N/mm²; GLT fv,k = 3.0 N/mm²
DK EN 1995-1-1/NA:2010 [27] Denmark 1.0 1.0 [--]
DIN EN 1995-1-1/NA:2010 [28] Germany 2.0 / fv,k 2.5 / fv,k fv,k acc. EN 338 [2] & EN 1194 [17] kcr includes long-time effects; kcr ≠ f{accepted crack depth}
SFS-EN 1995-1-1/A1:2008 [29] Finland 0.67
1.0 0.67
1.0 in heated rooms or in corresponding moist. cond. (MC)
permanently high MC; service class 2 & 3
prNF EN 1995-1-1/NA:2008 [30] France 0.67
1.0
0.67
0.67
1.0
0.67
service class 1 & 2 with d > 150 mm,
service class 1 & 2 for all other cases
service class 3 – for all cases
DNA EN 1995-1-1/NA:2010 [31] Netherlands 1.0
0.8 1.0
0.8
for beams with I- or T-section and a web of ST or GLT: kcr = 1.0, if bweb / bflange ≥ 1.0, kcr = 0.8 if bweb / bflange ≤ 0.5, otherwise kcr acc. linear interpolation
UNI EN 1995-1-1/NA:2008 [32] Italy
0.67 0.67 [--]
NS-EN 1995-1-1/NA:2010 [33] Norway PN-EN 1995-1-1/NA:2010 [34] Poland SR EN 1995-1-1/NB:2008 [35] Romania SS-EN 1995-1-1/A1:2008 [36] Sweden STN EN 1995-1-1/NA:2008 [37] Slovakia SIST EN 1995-1-1/A1:2001 [38] Slovenia ČSN EN 1995-1-1/NA:2007 [39] Czech RepublicBS EN 1995-1-1/A1:2008 [40] Great Britain CYS EN 1995-1-1/A1:2011 [41] Cyprus
More related to structural timber and the aspect of knottiness Wilson & Cottingham [42] found no significant effect on fv in case of higher or lower share of knots (lower or higher timber quality). Schickhofer [43] arguments higher shear strengths in glulam of lower timber quality due to a higher share of knots and a higher curvature of annual rings together with a higher amount of latewood in shear plane as reinforcement in contrast to GLT built up of high-grade lamellas. Denzler & Glos [19] argue that the activation of knots as reinforcement depends on the stressed shear plane. Following them, this activation can be expected in TL but not in RL. Concerning checks Yeh & Williamson [44] noticed that these typically occur in RL-plane, weakening shear resistance by reduction of shear area. This circumstance is perhaps not relevant for GLT but for edgewise loaded structural timber, see also Rammer [45] and his comments to ASTM D 3737-93 [46]. Rammer & McLean [7] analysed the influence of splits and checks on structural timber of Douglas Fir, Southern Pine and Engelmann Spruce. Test results revealed a decrease in fv with increasing depth of checks. Predictions of fv by means of fracture mechanics (mode II) delivered too conservative values, which indicate an influence of counteracting effects, e.g. positive size effects. Current European design standard for timber structures, EC 5 [1], considers the influence of cracks by the crack coefficient kcr. Explicitly this

4
coefficient reduces the effective width of components stressed in shear and thus implicitly the characteristic shear strength, see
creff kww ⋅= (3)
Of course the quantification of this coefficient can be done individually by each member of the European Union. Tab. 2 lists current regulations in national annexes. Thereby diverse national regulations are found, e.g. linkage to national shear strengths (Germany), regulations in dependency to service classes (Finland & France) or in dependency of the geometry of cross sections (Netherlands). Following Tab. 2 most of European Union members agree with the regulations in the basic document EN 1995-1-1 [1], which assumes equal vulnerability of structural timber and GLT concerning cracking during exposure & life-time of structures. Austria accounts for expectable reduced cracking in GLT due to restricted dimensions of GLT-lamellas and balancing of stresses in the homogenised product GLT. France also considers the linkage between dimension and tendency to cracks. Nevertheless, in some nations timber and engineered timber products seem to behave differently, irrespective of their original provenience of raw material and production site. Germany regulates kcr explicitly as factor, which calibrates European shear strengths to national values. Considering current values of fv,k for structural timber and GLT according EN 338 [2] and EN 1194 [17], respectively, it consequences that higher quality timber is associated with lower kcr-values. This is contrary to practical observations and expectations, e.g. for C14 and ≥ C24 acc. EN 338 [2]: kcr = 2.0 / 3.0 = 0.67 and 2.0 / 4.0 = 0.50, respectively, for GL24h and GL36h acc. EN 1194 [17]: kcr = 2.5 / 2.7 = 0.93 and 2.5 / 4.3 = 0.58, respectively. Generally, it appears that there is definitive need for detailed clarification and harmonisation of European regulations.
Another important and perhaps one of the main parameters influencing shear strength is defined by its relation to the size of components and the volume exposed to shear. Again, controversial discussions in literature and consequently contradicting or insufficient regulations in standards are present. Thereby, as beams stressed in shear fail rather brittle the applicability and more often the validity of Weibull’s weakest link theory (WLT; Weibull [47]) is presumed in discussions of size effects. This is in particular of interest as many of the assumptions underlying this theory are violated by the material timber. Nevertheless, e.g. Foschi & Barrett [48], [49] and Colling [50] applied WLT based on fv ~ 2pWD for the explanation of size effects and the influence of stress distribution on shear strength. Thereby WD-shape parameters of β = 5.53 and 5.00, respectively, were applied, corresponding to CoV[fv] = 20.9% and 22.9%. Huggins et al. [51], Rammer et al. [14] and Rammer & Soltis [18] used the power model of WLT for the relationship between fv and size. Thereby power parameters in the range of –0.20 to –0.24 for As (Rammer & Soltis [18], ST & GLT; Asselin [52], ST) and –0.15 for Vs (Asselin [52], ST), which are far in line with previously mentioned β, were found by means of power regression analysis. In contrast, Longworth [53] and Keenan [20], [21] used logarithmic regression models to account for size effects on fv, in particular in dependency of As. According 2pWD and extreme value theory a constant CoV[fv], independent of the volume under shear stress, depth or shear area is given. Thus size effects on fv,mean and fv,05 are predicted to be equal. Observations made by Keenan et al. [22] contradict this circumstance. In contrast to fv,mean practically no influence of Vs on fv,05 was observed. Based on simulations Klapp & Brüninghoff [54] concluded that WLT clearly overestimates depth and length effects on fv of GLT. Of course, results of these simulations have to be treated with caution because the input data on basis of test results of Denzler & Glos [19] is censored. The applied test configuration failed in securing representative data of structural timber because tests on e.g. specimen with knots failed due to other reasons. In addition, the assumption of ND as representative statistical distribution model (RSDM) and deterministic treatment of fv within each board in GLT-lamellas are additionally questionable aspects. Although shear failures in timber appear brittle, in modelling the characterisation as quasi-brittle is recommended. This is argued by the observation that some specimens show the ability to a further load increase even after partial failures. Mistler [55] and much earlier Daniels [56] developed models to account for parallel system action and the ability to redistribute stresses after partial failures. Such a parallel system in timber stressed in shear can e.g. be associated with increasing width, in timber bridge decks or flatwise-loaded GLT, see also Rammer [45]. Consequently, a reduction in fv with increasing width in magnitude comparable with the influence of depth or length is not expected. For example, Yeh & Williamson [44] and Keenan [20], [21] found no influence on or even an increase of fv,mean with increasing width of

5
structural timber and GLT. In contrast, shear area As, which is by definition a function of width and test length, is often confirmed and proposed as main geometric parameter for prediction of size effects on fv, see e.g. Keenan [20], [21], Longworth [53], Keenan et al. [22], Rammer & Soltis [18], Asselin [52], Rammer et al. [14] and Gehri [57].
Fig. 1 Mean shear strength fv,12,mean vs. depth d for GLT and ST: right-censored data and MLE-estimates
Fig. 2 Mean shear strength fv,12,mean vs. shear area As for GLT and ST: right-censored data and MLE-estimates
On basis of a comprehensive literature survey of Lackner [58] the existence and magnitude of size effects on shear strength of structural timber (ST) and glued laminated timber (GLT, glulam) are discussed. For comparability of test data, solely results of shear strength gained from (three-, four- and five-point) bending tests performed on I-beams as well as prismatic cross sections but of various softwood species were considered. In the analysis, fv following a two-parameter lognormal distribution (2pLND) as RSDM was assumed. All data was corrected to uref = 12% according the proposal in Tab. 1. Parameters of shear (fv,mean, CoV[fv], etc.) and geometry were related to each other by means of regression and correlation analysis. In addition to Lackner [58] further data sets were included. The maximum-likelihood estimation technique (MLE) for right censored data was applied on data sets were early failures e.g. in bending or compression occurred, so far all required information was available. The parameters of 2pLND were estimated by maximising the log-likelihood function
[ ] [ ]⎥⎦⎤⎢⎣⎡ ⎟
⎠⎞⎜
⎝⎛θ
θ=⎟
⎠⎞⎜
⎝⎛θ ixLixL lnmaxln)
, with ( ) ( ) ( )[ ] iii
diX
iiXi
n
ixFxfxL d −∏ θ−θθ
=⋅= 1
11
) (4)
with indicator variable di = 1 if the event equals the target and di = 0 otherwise.

6
Overall, 198 test-series of 23 literature sources were considered as shown in Tab. 9 (annex). Fig. 1 and Fig. 2 contain right-censored (RC) data and statistics from MLE of GLT and ST separately. Fig. 1 shows the dependency between fv,mean and the depth d. This plot is based on 77# GLT samples (60# adopted by MLE) and 120# ST samples (70# adopted by MLE). Fig. 2 shows the dependency between fv,mean and the shear area As of the tested samples. This plot is based on 45# GLT samples (39# adopted by MLE) and 80# ST samples (34# adopted by MLE). Hereby As was defined as the product of width and the length under constant maximum shear stress between support and loading minus an assumed length influenced by compression stresses considering a load distribution angle of α = 30° in standard tests and α = 0° in case of reinforcement against compression perpendicular to grain, see Fig. 2.
Although the quantity of tests included in Fig. 1 is much higher than in Fig. 2, the degree of determination of fv vs. d is much lower than of fv vs. As, for fv of both, ST and GLT. Beside of fv,MLE,GLT vs. d all power parameters of regression models are comparable and about 0.20, which is in-line with previously given literature data. In both plots, shear strength of GLT is on average below that of ST. This was already earlier observed by Soltis & Rammer [59] who remarked also a comparable size effect on GLT and ST and the fact that fv,ST > fv,GLT. Some explanations regarding this last circumstance are discussed later. All regression models applied on MLE-estimates reflect clearly the influence of censored data analysis giving overall higher estimates for fv,mean by more or less comparable power parameters.
Overall, these two plots should clarify the answer of ongoing discussions and the question if size effects on shear strength of structural timber or GLT exist or not. This aspect is in particular of interest as current European standards do not include any size effect for structural timber and GLT whereas in a previous version (prEC 5 [60]) the influence of Vs on fv,05 was considered based on a 2pWD with β = 5, also for beams of continuous prismatic cross section! Nevertheless, beside the analysis of size effects on arithmetic means, based on data in Tab. 9, also the relationship between CoV[fv,MLE] of ST and GLT vs. depth and shear area were analysed briefly. It was found that in both graphs of ST the CoV[fv,MLE] increases with increasing dimensions, whereas vice versa was found for GLT. It can be concluded that the independency of shear resistances between GLT-lamellas in case of increasing depth (often in-line with an increase in length and thus in As) provokes a decrease in variation due to serial system action. In contrast, an increase in depth of edgewise stressed structural timber seems to enlarge the possibilities how shear failures can develop and thus provokes raising of variability. Overall, these are only tendencies and fitted power models deliver insignificant slope parameters. Thus the assumption of a constant behaving CoV[fv] = 15% for both, ST and GLT, appears reasonable.
Based on the discussions in regard to influences on shear strength, e.g. of shear plane (RL, TL), knottiness, checks & splits and size, it can be concluded that differences between structural timber (primary stressed edgewise) and GLT (lamellas primary stressed flatwise) can be expected! For example, the gain in shear strength in RL, e.g. by stressing timber elements edgewise, is counteracted by the influence of checks and knots which are in particular common in timber from the centre of logs. Nevertheless, if the width of such specimen is increased it can be assumed that shear strength remains constant or becomes even slightly higher due to parallel system action. An increase in depth causes an enlargement of the zone under nearly maximum shear stress. Consequently, the probability that a weaker section arises within this zone increases. In particular in timber which origins near the pith, also the probability that the slope of annual rings exceeds nearly 45° increases. Thus, a failure in TL can be expected. In standard test procedures, test span is normally a function of depth. Thus an increase of depth coincides directly with an increase in length and thus also with an enlargement of As. Consequently, a distinctive reduction of shear strength due to size effects is expected. In contrast, edgewise stressed GLT suffers from shear failures in TL. In high quality timber, which lacks of reinforcing knots together with TL-failure plane, lower shear strength than in edgewise stressed structural timber is expected. An increase in width of GLT in case of lamellas of low strength, which is normally cut near the centre of logs, increases the probability that the curvature of annual rings becomes steeper, at least at the outer regions of lamellas. This aspect, together with a higher share of knots as reinforcement, raises shear strength. Nevertheless, in deeper GLT-beams again the zone of maximum shear stress increases. In contrast to structural timber, an increasing amount of lamellas is involved suffering from serial system action. Hereby even a higher size effect than in structural timber can be presumed as the lamellas and thus their individual shear resistances are iid (identical and

7
independent distributed). To conclude, there are two main reasons why shear resistance in GLT can be expected to be lower than in structural timber of the same quality: the first aspect is that failure primary occurs in the weaker TL-plane, although and in particular in lower strength timber a positive effect from reinforcing knots can be expected. Secondly, the iid shear resistance of GLT-lamellas, which raises the magnitude of size effects.
The third category (iii) deals with influences on shear strength caused by test method & configuration. Starting with configurations for testing small clear specimen, the shear block test according ASTM D 2555-98 [61] & ASTM D 143-94 [62], the shear test of EN 408 [63] (former EN 1193 [64]), the torsion test, Iosipescu & Arcan test and the three-, four- or five-point bending tests (3pB, 4pB, 5pB) can be mentioned. Hereby specimen with I- or prismatic cross section are used. The general aim is to initiate nearly constant and pure shear stresses, but this aim is practically only (nearly) reached by Iosipescu, Arcan or torsion tests (see e.g. Dahl & Malo [65] and Gupta & Siller [66]). All other configurations suffer from interaction of shear with compression or tension stresses perpendicular to grain or local stress peaks which lead to unrealistic shear strengths, if explicit consideration in analysis, in particular the later use in engineering practice, is taken into account (see e.g. Gupta & Siller [66] and Riyanto [13]). Furthermore, due to the orthotropic material shear resistances of in total three different shear planes, RL, TL and RT are required.
In structural and glued laminated timber, the aims on an adequate test configuration are comparable. In Europe EN 408 anchors a shear test configuration for a specimen of length 300 ± 2 mm, a width of 32 ± 1 mm and a depth of 55 ± 1 mm. The specimen shall be glued to steel plates, mounted in a test machine and loaded in an angle between the load direction and the longitudinal axis of the test sample of 14°. Based on the results of e.g. Denzler & Glos [19] it was concluded that this shear test configuration is not adequate to derive shear strength values representative for structural timber. Characteristics of ST like knots or knot clusters cannot be tested in shear because of early failures in the glue-line between the metal plates and the specimen and / or due to exceedance of resistances perpendicular to grain. Hereby it is not only a censoring of data but due to scaling effects in particular a censoring of the material itself. This makes a reliable derivation of fv by means of MLE for right censored data even impossible. Comparable remarks are reported for the shear block test configuration of ASTM. Hereby shear resistances of clear wood are derived whereby local stress peaks and the interaction of shear stresses with moments additionally occur. Riyanto [13] provides a valuable overview of pros and cons of various test configurations. Although he confirmed that shear strength of clear wood correlates with that of structural timber, irrespective of the applied test method, he proposed to apply 3pB configuration for derivation of practical relevant shear strengths. Nevertheless, for determination of shear strength of the material rather than of a structural component he suggests to use torsion tests. Based on own experiences made and in review of literature (e.g. Quaile & Keenan [23], Schickhofer & Obermayr [67], Schickhofer [43], Korin [68], [69], Riyanto [13] and Gehri [57]), the following aspects are seen as worthwhile to consider:
1) shear stress distribution during testing should be of practical relevance: It is recommended to perform bending tests. Hereby 3pB instead of 5pB is preferred, not only because of the advantage of a statically determined system;
2) it is recommended to test I-beams: Hereby flanges are characterised by high resistance in bending and compression perpendicular to grain. The web, representing the test specimen, has comparably low resistance in shear. For a failure rate in shear of ≥ 90% shear forces should be calculated equivalent to fv,95. At this load level edge bending resistance of flanges should be ≥ fm,05. The test span follows from optimisation of shear and bending resistance. If the bending resistance of the associated strength class is below the requirements it is advised to proof load bottom flanges in tension parallel to grain by applying a proof stress σt,0,pl = σm,05 | τ95 = fv,95. The use of slotted I-beams, e.g. according Korin [69], is not advised. Hereby the test section (web) is judged as being not representative. In I-beams, the shear stress distribution within the web leads to higher fullness parameters. This means that the probability of failure is higher if compared to prismatic cross sections of same geometry and size. Consequently, minor conservative shear strengths are derived. In this respect, shear failure is initiated in one of two possible shear zones. Thus a serial system of two is given;

8
3) equality of E0,flange ≈ E0,web per specimen is recommended: This is to prevent jumps in the normal bending stresses;
4) a maximum difference of shear stresses at contact zone between web and flange of ≤ 5 N/mm² is proposed: Hereby shear failures in the transition zone between web and flange and in particular in the glue-line have to be prevented;
5) the application of reinforcements in compression perpendicular to grain is advised: Full-threaded self-tapping screws or glued-in rods as reinforcements at supports and centre loading area are recommended. This was already outlined by Gehri [57] who focused in particular on the application of glued-in rods, to minimise the volume of specimen by maximising the volume stressed in shear and to assure nearly uniform shear stress distributions in longitudinal direction of the beam between the nearest corners of loading and support plates;
6) evaluation of fv by means of simple beam theory, rigid compound action and MLE should be applied: Hereby the failure made by applying simple beam theory for a plate-like specimen should be corrected, e.g. by performing FE-analysis as shown e.g. in Keenan [20] and Aicher & Ohnesorge [70]. For example, Quaile & Keenan [23] state that at least a distance of two times the depth between support and loading should be kept; otherwise fv evaluated according simple beam theory is overestimated. Early failures in bending or compression shall be considered in the application of MLE for right-censored data. After careful judgement, the same procedure shall be also applied for specimen (e.g. with checks) already before testing;
7) the bending stiffness of the load-distribution plates at supports and loading zone should be equivalent with that of the I-beam: This is recommended to prevent local stress concentrations and local failure in compression perpendicular to grain;
Overall, a comprehensive overview of relevant aspects, concerning the definition of a shear test configuration for testing structural timber and GLT, was given. As next above statements are clarified for the herein tested samples and the experiences are discussed.
3 Materials and Methods
3.1 Material The accomplished test program involves seven series analysing shear strength by means of I-beams tested in 3pB and one series for determination of bending characteristics on prismatic specimens by means of standard 4pB tests. The material used was Norway spruce (Picea abies (L.) Karst.) of provenience Styria (Austria, Central Europe). It was kiln dried and visually graded to S10+ (DIN 4074-1 [71]), representing strength class C24+ according EN 338 [2]. To reduce influences by the radial position within the log (wood zones, share of knots, affinity to checking, etc.) a constant normal distance between pith and right side of the web specimen of 60 mm was chosen. Before final testing, several pre-examinations were made, e.g. determination of moisture content, density and modulus of elasticity Edyn,0,12 based on eigenfrequency measurement device of Eiser & Kastner [72]. The static modulus of elasticity Et,0,12,est was estimated based on results of Eiser & Unterwieser [73], see
[ ]2%)12(104,1
0,,12,0, ⋅−+⋅= u
EE dyn
estt (5)
Results of Et,0,est,12 were used for stiffness grading and fitting of web and flanges with a maximum difference of Et,0,est,12,flange and Et,0,est,12,web of 1,000 N/mm². The estimation of the relationship fm,05 vs. fv,95, done by Lackner [58], based on a regression function gained from GLT shear tests of Schickhofer [43]. After availability of improved estimates from literature, an adaptation of the tests was necessary. As the material was already ordered and most of the specimens fabricated, adaptation was only possible in the span / depth ratio. That is why this ratio varies finally as shown in Tab. 3. After updating of information, the proof loading performed on bottom flanges was not sufficient in all series causing a higher share of bending failures than initially presumed. The estimation of forces was done by applying simple beam theory and rigid composite action. To account for the bias made by

9
applying simple beam theory on a more plate-like specimen, an FE-analysis was additionally performed. FE-modelling and results will be presented later (see section 3.2). A rigid connection between web and flanges was assured by means of polyurethane adhesive. Overall, more detailed information about the material, preparation and testing can be found in Lackner [58] and Gatternig [74].
Fig. 3 Nominal cross sections and quality of test specimen (web) for analysing size effects (left) and the effect of timber
quality (right)
The influence of size on shear strength was analysed by means of five series of varying depth and / or width (see Fig. 3, left). For falsification of the relationship fm,05 vs. fv,05 as anchored in EN 338 [16], [2] three series (T-3 to T-5; see Fig. 3, right), were tested in addition. The allocation of specimen to T-3 to T-5 was done according their stiffness, with Et,0,12,est,mean ≈ E0,mean,EN 338, to C16 (T-3), C24 (T-4) and C40 (T-5).
The suitability of allocation of stiffness graded specimen to the strength class system of EN 338 [2] was controlled by an additional series T-8 tested in standard 4pB according EN 408 [63]. An overview of main specifications and results of mean density and stiffness of all series is provided in Tab. 3. Tab. 3 Specifications of series T-1 to T-8 and mean values of Et,0,12,est and ρ12
Shea
r T
ests
(3pB
)
Series Material Quantity Dimensions Characteristics
[--] [--] [--] Global Web Flange Web Web
l lef ww / dw wf / df Et,0,12,est,mean ρ12,mean [mm] [mm] [mm] [mm] [N/mm²] [kg/mm²]
T-1 spruce C24+ * 40 # 985 3.7 ∙ dw 40/75 110/40 11,307 447 T-2 spruce C24+ * 34 # 1,970 3.1 ∙ dw 40/145 110/80 12,191 449 T-3 spruce C16 ** 11 # 1,970 2.2 ∙ dw 80/150 220/80 8,505 389 T-4 spruce C24 * 40 # 1,970 3.2 ∙ dw 80/150 220/80 11,420 414 T-5 spruce C40 ** 40 # 1,970 3.7 ∙ dw 80/150 220/80 14,247 467 T-6 spruce C24+ * 20 # 3,940 3.7 ∙ dw 80/300 220/160 11,708 417 T-7 spruce C24+ * 36 # 1,200 3.3 ∙ dw 80/80 220/80 10,747 430
4pB
Series Material Quantity l w d Et,0,12,est,mean ρ12,mean T-8 spruce C24+ * 50 # 2,850 80 150 12,125 441
* … strength class according EN 338 [2] ** … allocation to strength class system according EN 338 [2] solely by stiffness grading
3.2 Methods
3.2.1 Test configuration for determination of shear strength and modulus
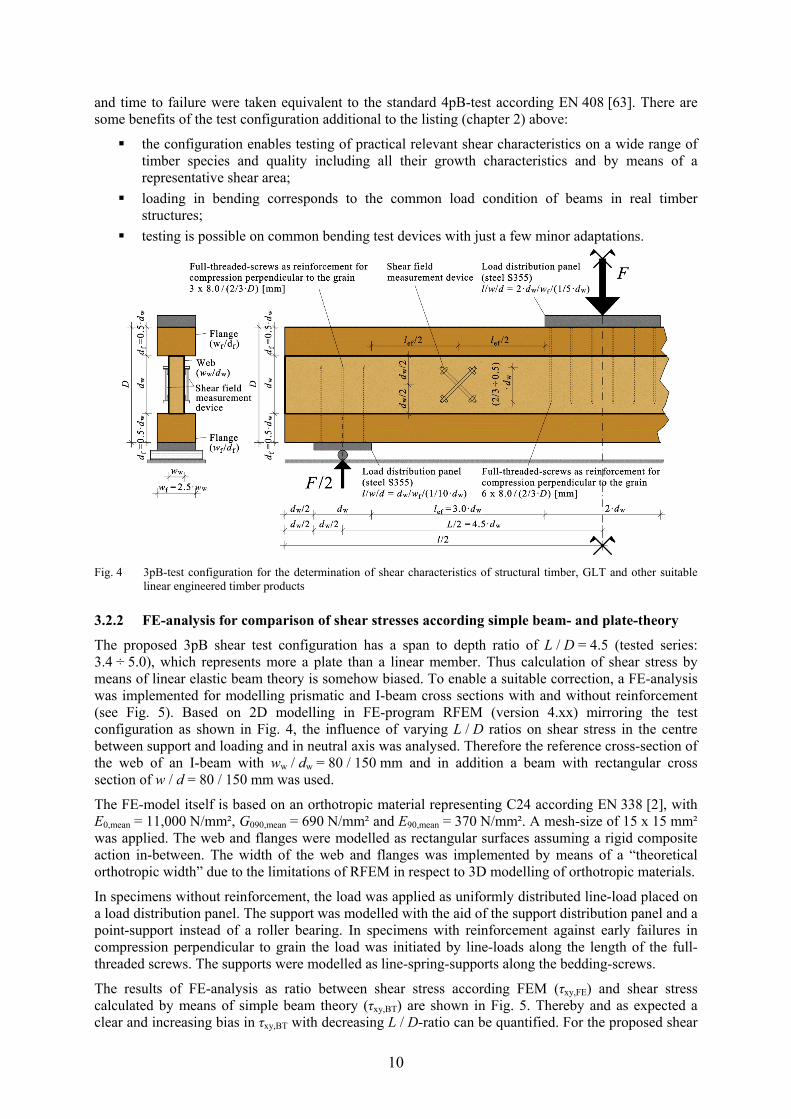
Based on the discussions in chapter 2 a 3pB-test configuration together with an I-beam of optimised geometry was developed to meet widely all before defined requirements (see Lackner [58] and Gatternig [74]). The proposed configuration, which in principle enables coherent determination of shear strength and shear modulus of structural timber, GLT and other linear engineered timber products, is presented in Fig. 4. Further requirements on test procedure, e.g. climate, moisture content
10
and time to failure were taken equivalent to the standard 4pB-test according EN 408 [63]. There are some benefits of the test configuration additional to the listing (chapter 2) above:
the configuration enables testing of practical relevant shear characteristics on a wide range of timber species and quality including all their growth characteristics and by means of a representative shear area;
loading in bending corresponds to the common load condition of beams in real timber structures;
testing is possible on common bending test devices with just a few minor adaptations.
Fig. 4 3pB-test configuration for the determination of shear characteristics of structural timber, GLT and other suitable
linear engineered timber products
3.2.2 FE-analysis for comparison of shear stresses according simple beam- and plate-theory
The proposed 3pB shear test configuration has a span to depth ratio of L / D = 4.5 (tested series: 3.4 ÷ 5.0), which represents more a plate than a linear member. Thus calculation of shear stress by means of linear elastic beam theory is somehow biased. To enable a suitable correction, a FE-analysis was implemented for modelling prismatic and I-beam cross sections with and without reinforcement (see Fig. 5). Based on 2D modelling in FE-program RFEM (version 4.xx) mirroring the test configuration as shown in Fig. 4, the influence of varying L / D ratios on shear stress in the centre between support and loading and in neutral axis was analysed. Therefore the reference cross-section of the web of an I-beam with ww / dw = 80 / 150 mm and in addition a beam with rectangular cross section of w / d = 80 / 150 mm was used.
The FE-model itself is based on an orthotropic material representing C24 according EN 338 [2], with E0,mean = 11,000 N/mm², G090,mean = 690 N/mm² and E90,mean = 370 N/mm². A mesh-size of 15 x 15 mm² was applied. The web and flanges were modelled as rectangular surfaces assuming a rigid composite action in-between. The width of the web and flanges was implemented by means of a “theoretical orthotropic width” due to the limitations of RFEM in respect to 3D modelling of orthotropic materials.
In specimens without reinforcement, the load was applied as uniformly distributed line-load placed on a load distribution panel. The support was modelled with the aid of the support distribution panel and a point-support instead of a roller bearing. In specimens with reinforcement against early failures in compression perpendicular to grain the load was initiated by line-loads along the length of the full-threaded screws. The supports were modelled as line-spring-supports along the bedding-screws.
The results of FE-analysis as ratio between shear stress according FEM (τxy,FE) and shear stress calculated by means of simple beam theory (τxy,BT) are shown in Fig. 5. Thereby and as expected a clear and increasing bias in τxy,BT with decreasing L / D-ratio can be quantified. For the proposed shear

11
test configuration and up to L / D ≥ 6 the differences between specimen with and without reinforcement are negligible. Following Quaile & Keenan [23] who recommended a distance between support and loading of ≥ 2 · D a bias in τxy,BT of about 10% and 20% in testing prismatic or I-beam cross sections, respectively, can be expected. Following the results in Fig. 5 application of simple beam theory for calculation of shear strength clearly overestimates real shear resistance with decreasing L / D-ratio. As the use of this theory is common and accurate enough in engineering practice and structural components with a common L / D-ratio of 15 ÷ 20 it is required to correct fv,12,BT derived from tests to “real” shear strengths relevant for practice. This is done later in chapter 5.
Fig. 5 Relationship between the shear stress according FE-analysis τxy,FE and according simple beam theory τxy,BT in
dependency of the L / D-ratio: prismatic cross sections and I-beams, with or without reinforcement
4 Results
4.1 Results of 3pB shear tests Tab. 4 gives a failure classification schema of all main causes observed during testing, together with a brief description and the total realised quantities (see also Tab. 5). A summary of main statistics of all test results is provided in Tab. 5. Based on the moisture content u, determined for every specimen at the time of testing (according ON EN 13183-1 [75], except series T-6: determined by means of Gann Hydromette M4050), density and E-modulus were transferred to uref = 12% according EN 384 [76]. Adaptation of shear strength was done according the proposal in Tab. 1. Statistics of fv,12 involve only specimens which failed in shear within the web (S_WEB).
As shown in Fig. 4, in series T-6 also shear modulus G090,12,SF was determined according Brandner et al. [77] but with adaptation to account for the I-beam. Values were transferred to uref = 12% equal to E-modulus according EN 384 [76]. In total 8 of 10 tests of series T-6 with shear measurement devices and without checks in measurement domain could be accepted. The main statistics are: G090,12,mean = 599 N/mm² (G090,12,50 = 586 N/mm²) and CoV[G090,12] = 12.0%. Furthermore, simple linear regression analysis of G090,12 vs. density ρ12 [kg/m³], Et,0,12,est [N/mm²] and fv,12 [N/mm²] gave adjusted squared correlation coefficients (R²adj) of +0.33, –0.16 and +0.33, respectively. Tab. 4 Overview of the classified causes of failure of 3pB shear tests; series T-1 to T-7
Cause of failure Quantity Visualisation
S_WEB shear failure of web
(test section) 101 #

12
Cause of failure Quantity Visualisation
S_TRA shear failure at the transition zone
between web and flange (failure of glue line was not noticed)
63 #
S_PEC shear failure caused by growth and production characteristics
within the web (e.g. cracks or bark inclusions)
14 #
B_BFL bending-tension failure of
the bottom flange 25 #
OTHER involving miscellaneous causes, e.g. shear failure in the upper or lower
flange, bending failure in the web, etc. 18 #
Tab. 5 Statistics of three-point bending tests carried out on I-beams of series T-1 to T-7
Series T-1 T-2 T-3 “C16” T-4 C24 T-5 “C40” T-6 T-7 u
[%] Mean 12.9% 11.1% 10.3% 10.0% 10.7% 11.1% 11.1%
R (range) 1.1% 0.7% 0.8% 1.5% 1.5% 1.3% 1.6%
ρ12 [kg/m³]
mean 447 449 389 414 467 417 432 median 445 448 390 413 463 421 430
CoV 7.1% 6.0% 3.7% 5.8% 6.5% 6.5% 10.6%
Et,0,12,est [N/mm²]
mean 11,307 12,191 8,505 11,420 14,247 11,708 10,747 median 11,102 11,846 8,513 11,373 14,100 11,345 10,269
CoV 13.2% 11.9% 8.7% 3.9% 7.1% 11.8% 9.6% realised
numbers of failure
categories [--]
S_WEB 10 # 21 # 7 # 21 # 19 # 10 # 13 # S_TRA 11 # 7 # -- 9 # 14 # 4 # 18 # S_PEC 1 # 3 # 1 # -- 2 # 6 # 1 # B_BFL 16 # 1 # 1 # 2 # 3 # -- 2 #
OTHER 2 # 2 # 2 # 8 # 2 # -- 2 #
τ1,12 [N/mm²]
quantity 40 # 34 # 11 # 40 # 40 # 20 # 36 # min 5.4 2.8 3.2 5.1 3.4 1.0 4.9
mean 7.6 6.8 6.4 6.4 6.1 4.3 7.8 median 7.7 7.0 6.6 6.3 6.4 4.6 7.7
max 9.5 9.9 7.7 8.3 8.0 6.5 9.0 CoV 12.2% 22.3% 18.9% 11.9% 18.5% 34.2% 10.0%
fv,12 [N/mm²]
quantity 10 # 21 # 7 # 21 # 19 # 10 # 13 # min 6.6 3.9 5.9 5.1 3.4 2.7 7.1
mean 7.9 6.7 6.4 6.6 6.0 4.8 8.1 median 7.9 7.0 6.3 6.5 6.5 4.8 8.0
max 8.9 9.5 7.2 8.3 8.0 6.5 8.9 CoV 9.1% 19.2% 7.0% 12.9% 22.6% 22.9% 6.2%
Results of 4p-bending tests The main statistics of standard 4pB-tests according EN 408 [63] of series T-8 are given in Tab. 6. One of in total 50 specimens had to be rejected because of not fulfilment of the requirements on S10 / C24. Computation of global bending E-modulus Em,0,g,12 was done by assuming G090,mean = 500 N/mm². The empirical 5%-quantile of bending strength based on rank statistics is given by fm,05 = 22.7 N/mm², the

13
characteristic value following EN 14358 [78] by fm,k = 22.6 N/mm². The characteristic density according EN 384 [4] reveals ρk = 404 kg/m³. Overall, the requirements of C24 according EN 338 [2] are fulfilled for E-modulus and density, the realised characteristic bending strength is a bit lower. Tab. 6 Main statistics of 4pB-tests of series T-8
Series T-8 u [%]
ρ12 [kg/m³]
Edyn,0,12 [N/mm²]
Em,0,l,12 [N/mm²]
Em,0,g,12 [N/mm²]
fm,u [N/mm²]
Quantity 49 # 49 # 49 # 49 # 49 # 49 # min 9.1 % 398 7,148 6,414 6,937 21.3
mean 9.7 % 441 12,611 11,673 11,873 44.1 median 9.6 % 449 12,726 11,619 12,162 43.3
max 10.9 % 475 16,191 15,202 15,507 68.2 CoV 4.2 % 5.1 % 18.5 % 21.0 % 19.9 % 31.4 %
5 Discussion Since the aim of this testing program was to determine shear strength of visually judged unchecked test specimens representative for the analysed strength classes of timber, specimens with pre-existing strength-reducing characteristics like distinctive drying-cracks or bark pockets, categorised as S_PEC (see Tab. 4), were excluded from further statistical processing, irrespective their realised resistance in shear. Hereby it has to be outlined that experiences made during testing underline the necessity for further detailed analysis about the influence of checks and splits on shear strength, as this aspect has a decisive impact on strength but was not explicitly analysed here.
In total only 101 of 221 of in shear tested specimens failed in shear within the web. As for all other beams the information of maximum shear stress at first failure due to other reasons (τ1,12) has been available, statistical parameters of fv assuming 2pLND as RSDM (in line with e.g. JCSS [79]) and other statistics were estimated by applying MLE for right censored data, see equ. (4). Fig. 6 shows box-plots of shear stresses and shear strengths as well as estimates from MLE.
The MLE estimates for mean and coefficient of variation were further adjusted according the results of FE-analysis. The results and adjustment parameters are given in Tab. 7. Tab. 7 Statistics of fv,12 based on estimates from MLE for right censored data, adapted in regard to FE-analysis
Series T-1 T-2 T-3 T-4 T-5 T-6 T-7 Quantity [--] 39 # 31 # 10 # 40 # 38 # 14 # 35 #
fv,MLE,12 [N/mm²] mean 8.9 7.5 6.9 6.9 7.2 5.3 8.5 CoV 12.5% 24.4% 11.9% 12.5% 28.6% 27.1% 7.5%
fv,MLE,adj,12 [N/mm²] adjustment 84% 80% 74% 81% 84% 84% 75%
mean 7.4 6.0 5.1 5.6 6.0 4.5 6.3 CoV 15.0% 30.4% 16.1% 15.4% 34.3% 32.1% 10.1%
Following the results, doubling of depth and thus also the tested length (nearly constant L / D-ratio) leads to a distinctive reduction in average shear strength. Results of pairwise t-test accomplished on logarithmised data comparing fv,12,MLE,adj of T-1 to T-2 and T-4 to T-6 gives a rejection of the hypotheses of equal mean values at α ≤ 1% significance level. In contrast, the rejection of the same hypotheses by comparing means of series T-2 and T-4, which corresponds to a doubling of width, is not possible. Pairwise t-tests performed on T-3 to T-4, T-4 to T-5 and T-3 to T-5 allow no rejection of assumed equal mean-values. Thus, a significant influence of strength class on average shear strength cannot be confirmed. Interestingly, doubling of depth (which coincides with doubling of length and As; T-1 to T-2, T-4 to T-6) doubles also the CoV[fv,12,MLE,adj], whereas doubling of width (T-2 to T-4) halves the CoV[fv,12,MLE,adj]. These observations are not judged as hazard results because ratios of L / D as well as mostly also the share of shear failures (aside from T-1 with only 26% share of S_WEB) between compared test series are not that different. Although analysis of literature data (see chapter 2) indicates an increase of CoV[fv] with increasing depth and length in structural timber the herein observed change in variability was not expected. Of course, there are no explanations for the magnitude of changing variability but some for the tendency in general.

14
Fig. 6 Box-plots of shear stress at first failure (τ1,12), shear strength at first failure (fv,12) and of estimates for shear strength
fv,MLE,12 based on MLE for right-censored data: width of boxes adjusted to the number of realisations
As already outlined for edgewise stressed structural timber in chapter 2 an increase in depth reduces the gradient of the parabolic shear stress distribution in z-direction. Absolutely, this implies that a larger zone of the specimen is nearly under maximum shear stress. In case of I-beams, in proportion of web and flanges used in herein reported project, this effect is lower. The difference between maximum shear stress in centre line and that at the transition zone between web and flange is only about 10%. Thus nearly the whole cross section is under constant shear stress. Nevertheless, an increase in depth reduces also the gradient of annual rings on the outer zones of the web. Tests of Denzler & Glos [19] showed that an average gradient of 45° lead already to a reduction of fv, equal to that in TL-plane. Thus it can be assumed, that shear failures in deeper beams occur more often eccentrically. Herein presented tests show increasing mean values of eccentricity, starting at about 15 mm (T-1) to about 30 mm (T-2, T-3, T-4, T-5) and to about 55 mm in T-6. In contrast, doubling of width reflected no effect on eccentricity.
The energy required for TL-shearing is lower than for RL-plane, so far clear wood is concerned, but in structural timber knots act as reinforcement in TL-plane. Occurrence of single knots and knot clusters varies not only in longitudinal direction but also in width (here depth) and also, but of lower importance, in thickness. Hereby a reduction in share of knots with increasing width (depth) can be expected. In contrast, the probability of occurrence of (visually hard or even not detectable) drying checks, which also weaken shear resistance in RL, can be also expected to increase with increasing width (depth). Consequently, with increasing depth an increase of failure causes and possible failure planes can be expected which coincides with a higher variability in realised shear strength. Due to the direct relationship of length and depth via the regulation of a constant L / D-ratio in tested specimens, even a further increase in variability can be expected. For example, the probability that knot clusters along the test length may occur and the diversity in their formation increases with increasing length.
The reduction in CoV[fv,12,MLE,adj] with increasing width can be traced back to the effect of parallel system action and thus to a higher amount of varying latewood which has to be sheared. Hereby a principle change in failure plane does not occur within the practical range, thus the variability in failure causes does not increase.
Concerning the falsification of the relationship fm vs. fv and as already mentioned above, statistically a significant difference in fv,mean between herein analysed series (T-3, T-4 & T-5) of different nominal strength (stiffness) classes could not be found, although a minor positive trend is given (see e.g. Tab. 7, Tab. 8 and Fig. 6). Due to variation in CoV[fv,12,MLE,adj] this trend is not so clear on 5%-level. In Tab. 8 also 5%-quantiles calculated based on realised means but fixed CoV[fv] are shown. Hereby two different variations are analysed; first a CoV[fv] = 25% as anchored in JCSS [79] and secondly a CoV[fv] = 15% as found on average from literature survey presented in chapter 2. In comparison to

15
current regulations of fv,k according EN 338 [2] it can be concluded that under the conservative assumption of a CoV[fv] of 25% congruent results based on test data and with fv ~ 2pLND can be found. In respect to findings so far and in-line with current attempts to regulate shear strength of GLT independent of strength class in prEN 14080 [3], the same is also proposed for structural timber (see also e.g. Glos & Denzler [12] and Poussa et al. [11]). Hereby a value of fv,k = 4.0 at reference geometries of dref = 150 mm and wref = 80 mm and for visually unchecked structural components is suggested. Tab. 8 Comparison of past and current characteristic shear strengths of EN 338 [16], [2] with test results, in dependency
of (nominal) strength (stiffness) class
strength class acc. EN 338 [2] „C16“ C24 „C40“ fv,12,mean,MLE,adj 5.1 5.6 6.0 fv,12,05 2pLND,MLE,adj 3.9 4.3 3.3 fv,12,05 CoV=25%,MLE,adj (CoV acc. JCSS [79]) 3.3 3.6 3.9 fv,12,05 CoV=15%,MLE,adj (CoV acc. literature) 3.9 4.3 4.6 fv,k acc. EN 338 [16] 1.8 2.5 3.8 fv,k acc. EN 338 [2] 3.2 4.0 4.0
Furthermore, the influence of size on shear strength of edgewise stressed structural timber was examined. As the power model according WLT of Weibull [47] is very common, power regression and correlation analyses were accomplished to study the influence of width, depth, span, shear volume Vs and shear area As. The analysis revealed that a width effect on fv cannot be confirmed, neither between T-1 & T-7 nor between T-2 and T-4. Nevertheless, statistical high significant power models were found for fv vs. depth, shear stressed volume and shear area. Best predictions were found in fv vs. depth (see also Keenan et al. [22]), with a power model of fv,12,MLE,adj,mean = 35.1 · d –0.36 and R² = 0.88. Comparable results were also achieved with Vs and As. Nevertheless, a standard rule to account for size effects on shear requires to be also practicable. For example, As can be very well determined in case of concentrated loads but not in case of uniformly distributed loads (see also Soltis & Rammer [80]). Thus, a power model for fv vs. d is preferred. Although herein presented test data reflects a significant higher depth effect than found on average in literature, in regard to a more general regulation of size effects it is proposed to consider a power coefficient of 0.20, which is also in line with the general assumed WD-shape parameter. Thus, for d ≠ dref it is recommended to regulate the depth effect on shear strength of structural timber as
⎪⎭
⎪⎬⎫
⎪⎩
⎪⎨⎧
⎟⎠⎞
⎜⎝⎛⋅=⋅= 5.4;1500.4min
2.0
,,, dkff drefkvkv (6)
6 Conclusions Within this paper, results based on a comprehensive literature survey were presented. Focus was on clarification of main influences on shear strength of structural timber and GLT, in particular on influences by (i) climatic conditions, (ii) size and scale effects and (iii) influences beside from test method and configuration. Based on gained information the relevance of the direction how shear stresses are applied (edgewise or flatwise) and the expectable differences between structural timber and GLT were figured out. Furthermore, data collection and harmonisation of international studies enabled a statistical analysis and modelling of size effects on shear strength. Hereby the relevance of size effect consideration was visualised. As common, a power regression and correlation analysis was performed revealing an average power parameter of 0.20. Analysis of CoV[fv] in relation to size effects reflected a positive and a negative tendency, respectively, for structural timber and GLT. A review of data and publications concerning test methods turned out a preference for shear tests by means of a bending test configuration with short span-to-depth ratios. Current test configuration of EN 408 [63] is not adequate for determination of representative shear strengths; neither for structural timber nor for GLT (see e.g. Denzler & Glos [19]). Furthermore and based on some test series published in Lackner [58] a 3pB-test configuration by means of against compression failures perpendicular to grain reinforced I-beams was defined, see Fig. 4.

16
A comprehensive test program was accomplished to examine size effects on structural timber of Norway spruce and to falsify the relationship fm,k vs. fv,k or more generally between strength class and shear strength, e.g. as anchored in EN 338 [16], [2]. In total 101 of 221 specimens tested failed in shear within the web. This low proportion of shear failures can be traced back to too late information updating of shear strengths higher than initially expected. Consequently, an updated test configuration including all experiences is proposed in Fig. 4. This configuration is judged to allow also a coherent determination of shear strength (and shear modulus) of structural timber and GLT as well as of other linear engineered timber products. As early failures due to other reasons than shear cannot be precluded, it is recommended to implement MLE for right-censored data (see equ. (4)) in standards for testing and evaluation. Furthermore, a FE-analysis was performed for quantifying the bias induced in calculation of shear stresses by means of simple beam theory in case of short span-to-depth ratios. The presented correction diagram (Fig. 5) derived for the proposed test configuration enables a fast and comfortable estimation of bias and correction. It is also recommended to include this or a similar graph in the testing and evaluation standard as part of data analysis.
Following the analysis of test data, it was concluded that a width effect on shear in edgewise loaded structural timber can be neglected, whereas a depth effect with a power of 0.20 should be implemented in product and design standards. Furthermore, an increase in CoV[fv] with increasing depth and length, but a decrease of CoV[fv] with increasing width was observed. Several possibilities to explain this circumstance were presented qualitatively. Additionally, a dependency of shear strength on strength class could not be confirmed. Thus it is proposed to regulate shear strength constant and irrespective of the strength class.
Overall a coherent determination of shear strength should be assured. The proposed test configuration enables this circumstance. Analysis of influences on shear strength clearly outlines the necessity to regulate this characteristic in dependency of the product and stressed shear plane. It was also outlined that size effects have a significant influence on shear strength. This aspect is currently not taken into account in European standards. Need for implementation is given, a proposal made.
7 Acknowledgement The research work within the project 1.2.4-1 reinforce_connections | shear is financed by the competence centre holz.bau forschungs gmbh and performed in collaboration with the Institute of Timber Engineering and Wood Technology of the Graz University of Technology and the partners from industry involved. The project is fostered through the funds of the Federal Ministry of Economics, Family and Youth, the Federal Ministry of Transport, Innovation and Technology, the Styrian Business Promotion Agency Association and the province of Styria (A14).
The support of E. Gehri, his worthwhile and encouraging discussions and recommendations have to be gratefully acknowledged. Great thanks also to H. Lackner who performed a very good job in analysing influences on shear strength and in developing an adequate test configuration as topic of his diploma thesis.
8 References
8.1 Standards, Papers and Reports [1] EN 1995-1-1, “Design of timber structures – Part 1-1: General – Common rules and roles for buildings,” 2009. [2] EN 338, “Structural timber – Strength classes,” 2009. [3] prEN 14080, “Timber structures – Glued laminated timber and glued solid timber,” 2010. [4] EN 384, “Structural timber – Determination of characteristic values of mechanical properties and density,” 2010. [5] Kollmann F, “Technologie des Holzes und der Holzwerkstoffe. Erster Band, 2. Auflage,” 1951. [6] Kretschmann D and Green D, “Strength properties of low moisture content,” Proceedings of the Pacific Timber
Engineering Conference, Gold Coast, Australia, 1994. [7] Rammer D R and McLean D I, “Recent research on the shear strength of wood beams,” Proceedings of the International

17
Wood Engineering Conference, 1996. [8] Gerhards C C, “Effect of Moisture Content and Temperature on the Mechanical Properties of Wood – An Analysis of
Immediate Effects,” Wood and Fiber, 14(1), 1980. [9] Müller K, Sretenovic A, Gindl W, Grabner M, Wimmer R and Teischinger A, “Effects of macro- and micro-structural
variability on the shear behavior of softwood,” IAWA Journal, Vol. 25(2), 2004. [10] Dahl K B and Malo K A, “Linear shear properties of spruce softwood,” Wood Science and Technology, 2009. [11] Poussa M, Tukiainen P and Ranta-Maunus A, “Experimental study of compression and shear strength of spruce
timber,” CIB-W18/40-6-2, Bled, Slovenia, 2007. [12] Glos P and Denzler J K, “Characteristic shear strength values based on tests according to EN 1193,” CIB-W18/36-6-1,
Colorado, USA, 2003. [13] Riyanto D S, “Comparative Test Methods for Evaluating Shear Strength of Structural Timber,” Oregon State University,
Oregon, 1996. [14] Rammer D R, Soltis L A and Lebow P K, “Experimental shear strength of unchecked solid-sawn douglas fir,” United
States Department of Agriculture, Forest Products Laboratory, FPL-RP-553, Madison, WI, 1996. [15] Lam F, Yee H and Barrett J D, “Shear strength of canadian softwood structural lumber,” CIB-W18/28-6-1,
Copenhagen, Denmark, 1995. [16] EN 338, “Structural timber – Strength classes,” 2003. [17] EN 1194, “Timber structures – Glued laminated timber – Strength classes and determination of characteristic values,”
1999. [18] Rammer D R and Soltis L A, “Experimental shear strength of glued-laminated beams,” United States Department of
Agriculture, Forest Products Laboratory, FPL-RP-527, Madison, WI, 1994. [19] Denzler J K and Glos P, “Determination of shear strength values according to EN 408,” Materials and Structures, vol.
40, pp. 79-86, 2007. [20] Keenan F J, “The shear strength of glued-laminated timber,” University of Toronto, Department of Civil Engineering,
1973. [21] Keenan F J, “Shear strength of wood beams,” Forest Products Journal, vol. 24, no. 9, pp. 63-70, 1974. [22] Keenan F J, Kryla J and Kykong B, “Shear strength of spruce glued-laminated timber beams,” Canadian Journal of
Civil Engineering, vol. 12, pp. 661-672, 1985. [23] Quaile A T and Keenan F J, “Shear strength of small composite wood beams,” Wood Science, vol. 11, no. 1, pp. 1-9,
1978. [24] Bensten B A and Porter S, “Comparison of results from standard 2-inch and 1.5-inch shear block tests,” Forest Products
Journal, vol. 28, no. 7, pp. 54-56, 1978. [25] Spengler T, “Festigkeitsverhalten von Brettschichtholz unter zweiachsiger Beanspruchung,” Technische Universität
München, Bericht zur Zuverlässigkeitstheorie der Bauwerke, Heft 62, München, Germany, 1982. [26] ON B 1995-1-1, “Design of timber structures – Part 1-1: General – Common rules and rules for buildings – National
specifications, national comments and national supplements concerning ÖNORM EN 1995-1-1,” Austria, 2010. [27] DK EN 1995-1-1, “Nationalt Anneks til – Eurocode 5: Trækonstruktioner – Del 1-1: Generelt - Almindelige regler samt
regler for bygningskonstruktioner,” Denmark, 2010. [28] DIN EN 1995-1-1, “National Annex – Nationally determined parameters – Eurocode 5: Design of timber structures –
Part 1-1: General – Common rules and rules for buildings,” Germany, 2010. [29] SFS-EN 1995-1-1, “National Annex to Amendment A1 of Standard SFS-EN 1995-1-1 –Eurocode 5: Design of Timber
Structures – Part 1-1: Common rules and rules for buildings,” Finland, 2008. [30] pr NF EN 1995-1-1, “T1 Eurocode 5 : Conception et calcul des structures en bois – Partie 1-1: Généralités – Règles
communes et règles pour les bâtiments,” France, 2009. [31] DNA EN 1995-1-1, “Dutch National Annexes for EN 1995-1-1 (Design of timber structures – general – common rules
and rules for buildings),” Netherlands, 2010. [32] UNI EN 1995-1-1, “Appendice nazionale – UNI-EN-1995-1-1 – Progettazione delle strutture di legno: Parte 1.1: Regole
comuni e regole per gli edifici,” Italy, 2008. [33] NS-EN 1995-1-1, “National Annex NA – Eurocode 5: Design of timber structures – Part 1-1: General Common rules
and rules for buildings,” Norway, 2010. [34] PN-EN 1995-1-1, “Dotyczy – PN-EN 1995-1-1:2010 – Eurokod 5 – Projektowanie konstrukcji drewnianych – Część 1-
1: Postanowienia ogólne Reguly ogólne i reguly dotyczące budynków,” Poland, 2010. [35] SR EN 1995-1-1, “Eurocode 5: Design of timber structures – Part 1-1: General – Common rules and rules for buildings.
National Annex,” Romania, 2008. [36] SS-EN 1995-1-1, “Svensk Standard – SS-EN 1995-1-1:2004/A1:2008 – Eurocode 5: Design of timber structures – Part
1-1: General – Common rules and rules for buildings,” Sweden, 2008. [37] STN EN 1995-1-1, “Eurocode 5: Design of timber structures – Part 1-1: General – Common rules and rules for
buildings. National Annex,” Slovakia, 2008. [38] SIST EN 1995-1-1, “Nacionalni dodatek k – SIST EN 1995-1-1,” Slovenia, 2001.

18
[39] ČSN EN 1995-1-1, “National Annex – Eurocode 5: Design of timber structures – Part 1-1: General – Common rules and rules for buildings,” Czech Republic, 2007.
[40] BS EN 1995-1-1, “UK National Annex to Eurocode 5: Design of timber structures – Part 1-1: General – Common rules and rules for buildings,” Great Britain, 2008.
[41] CYS EN 1995-1-1, “National Annex to CYS EN 1995 Eurocode 5: Design of Timber Structures – Part 1-1: General –Common rules and rules for buildings,” Cyprus, 2011.
[42] Wilson T R C and Cottingham W S, “Tests on glued laminated wood beams and columns and development of principles of design,” United States Department of Agriculture, Forest Products Laboratory, FPL-R1687, Madison, WI, 1947.
[43] Schickhofer G, “Determination of shear strength values for GLT using visual and machine graded spruce laminations,” CIB W18 (34):12-6, Venice, Italy, 2001.
[44] Yeh B and Williamson T G, “Evaluation of glulam shear strength using a full-size four-point test method,” CIB-W18/34-12-2, Venice, Italy, 2001.
[45] Rammer D R, “Shear strength of glued-laminated timber beams and panels,” National Conference on Wood Transportation Structures, FPL-GTR-94, USDA Forest Service, Madison, WI, 1996.
[46] ASTM D 3737-93, “Standard Practice for Establishing Allowable Properties for Structural Glued Laminated Timber,” 1995.
[47] Weibull W, “A statistical theory of the strength of materials,” Ingeniörsvetenskapsakademiens, Handlinggar Nr. 151, Royal Swedish Institute, 1939.
[48] Foschi R O and Barrett J D, “Longitudinal shear strength of Douglas-fir,” Canadian Journal of Civil Engineering, vol. 3, pp. 198-208, 1976.
[49] Foschi R O and Barrett J D, “Longitudinal shear in wood beams: a design method,” Canadian Journal of Civil Engineering, vol. 4, pp. 363-370, 1977.
[50] Colling F, “Influence of Volume and Stress Distribution on the Shear Strength and Tensile Strength Perpendicular to Gain,” CIB-W18/19-12-3, Florence, Italy, 1986.
[51] Huggins M W and Aplin E N and Palmer J H L, “Static and repeated load test of delaminated glulam beams,” Department of Civil Engineering, Toronto, Toronto, Ontario, 1964.
[52] Asselin S S, “Effects of member size on the shear strength of sawn lumber beams,” Washington State University, Department of Civil and Environmental Engineering, Washington, 1995.
[53] Longworth J, “Longitudinal shear strength of timber beams,” University of Alberta, Department of Civil Engineering, Edmonton, Alberta, 1977.
[54] Klapp H and Brüninghoff H, “Shear strength of glued laminated timber,” CIB-W18/38-6-3, Karlsruhe, Germany, 2005. [55] Mistler H L, “Die Tragfähigkeit des am Endauflager unten rechtwinkelig ausgeklinkten Brettschichtholzträgers,”
Universität Karlsruhe, Karlsruhe, Germany, 1979. [56] Daniels H E, “The statistical theory of the Strength of Bundles of Threads,” Proceedings of the Royal Society A, vol.
183, pp. 405-435, 1945. [57] Gehri E, “Eingeklebte Anker – Anforderungen und Umsetzungen,” 15. Internationales Holzbauforum, Garmisch
Patenkirchen, 2009. [58] Lackner H, “Festlegung einer Prüfkonfiguration für die Ermittlung der Schubfestigkeit von Vollholz sowie Analyse des
Größeneinflusses,” Institute of Timber Engineering and Wood Technology, Graz University of Technology, 2011. [59] Soltis L A and Rammer D R, “Shear strength of unchecked glued-laminated beams,” Forest Products Journal, vol. 44,
no. 1, pp. 51-57, 1994. [60] Eurocode Nr. 5, “Gemeinsame einheitliche Regeln für Holzbauwerke,” Amt für amtliche Veröffentlichungen der
Europäischen Gemeinschaft, Luxenburg, 1987. [61] ASTM D 2555-98, “Standard Test Method for Establishing Clear Wood Strength Values,” 1999. [62] ASTM D 143-94, “Standard Test Method for Small Clear Specimen of Timber,” 2000. [63] EN 408, “Timber structures – Structural timber and glued laminated timber – Determination of some physical and
mechanical properties,” 2010. [64] EN 1193, “Timber structures. Structural timber and glued laminated timber. Determination of shear strength and
mechanical properties perpendicular to the grain,” 1998. [65] Dahl K B and Malo K A, “Nonlinear shear properties of spruce softwood: experimental results,” Wood Science and
Technology, 2009. [66] Gupta R and Siller T, “Shear strength of structural composite lumber using torsion tests,” Journal of Testing and
Evaluation, vol. 33, no. 2, pp. 110-117, 2005. [67] Schickhofer G and Obermayr B, “Development of an optimised test configuration to determine shear strength of glued
laminated timber,” CIB-W18/31-21-1, Savonlinna, Finland, 1998. [68] Korin U, “Shear strength in bending of timber,” CIB-W18A/21-6-3, Parksville, Vancouver Island, Canada, 1988. [69] Korin U, “Determination of the shear strength of timber,” International Wood Engineering Conference, 1996. [70] Aicher S and Ohnesorge D, “Shear strength of glued laminated timber made from European beech timber,” European
Journal of Wood Products, 2010.

19
[71] DIN 4074-1, “Strength grading of wood – Part 1: Coniferous sawn timber,” 2009. [72] Eiser A and Kastner E, „Die erweiterte Längsschwingungsmessung,“ Institute of Timber Engineering and Wood
Technology, Graz University of Technology, 2009. [73] Eiser A and Unterwieser H, “Untersuchung der dynamischen Kenngrößen von Schnittholz bei unterschiedlichen
Temperaturen und Holzfeuchtegehalten sowie Ermittlung der statischen Zugkenngrößen,” Prüfbericht, Forschungsprojekt 2.1.5 pregrading, COMET K-Projekt, Kompetenzzentrum holz.bau forschungs gmbh, Graz, 2009.
[74] Gatternig W, “Determination of the shear strength of solid timber by testing and analysis of the member size effect,” Institute of Timber Engineering and Wood Technology, Graz University of Technology, Austria, 2012.
[75] ON EN 13183-1, “Moisture content of a piece of sawn timber – Part 1: Determination by oven dry method,” 2004. [76] EN 384, “Structural timber – Determination of characteristic values of machnical properties and density,” 2010. [77] Brandner R, Freytag B and Schickhofer G, “Determination of Shear Modulus by means of standardized Four-Point
Bending tests,” CIB-W18/41-21-1, St. Andrews, Canada, 2008. [78] EN 14358, “Timber structures – Calculation of characteristic 5-percentile values and acceptance criteria for a sample,”
2007. [79] JCSS, “Joint Probabilistic Model Code – Part 3: Resistance Models, Properties of Timber,” Joint Committee on
Structural Safety, 2006. [80] Soltis L A and Rammer D R, “Experimental shear strength of glued-laminated beams,” United States Department of
Agriculture, Forest Products Laboratory, FPL-RP-527, Madison,WI, 1994. [81] Meadows J C, “Longitudinal shear in wooden beams,” Forest Products Journal, pp. 337-339, 1956. [82] Breitinger H, Leicester R, Seath C and Walsh P, “In-grade wood beam-shear strength,” Pacific Timber Engineering
Conference, Gold Coast Australia, 1994. [83] Schickhofer G and Brandner R, “Alterung und (Rest)Tragfähigkeit von Bauholz,” 2. Grazer Holzbau-Sonderfachtagung,
Graz, 2011. [84] Yoshihara H and Furushima T, “Shear strengths of wood measured by various short beam shear test methods,” Wood
Science and Technology, vol. 37, pp. 189-196, 2003. [85] Klöck W, “Statistical analysis of the shear strength of glued laminated timber based on full-size flexural tests,” Otto-
Graf-Journal, vol. 16, pp. 225-243, 2005. [86] Brandner R, Freytag B and Schickhofer G, “Determination of Shear Modulus by means of standardized Four-Point
Bending tests,” CIB-W18/41-21-1, St. Andrews, Canada, 2008.

20
9 Annex Tab. 9 Overview of data from literature survey
Reference
CoV
As,korr
fv,mean,12
fv,mean,12,MLE
Material
MC
Test-
config. Quantity
Width (web)
Depth (web)
Length
[-] [%] [mm²] [N/mm²] [N/mm²] [-] [%] [-] [#] [mm] [mm] [mm] Poussa et al.
[11] 9.0% 2,799 8.6 -- Sc. P. ST 12.0% 4pB 40 42.0 95.0 1080.0 8.0% 2,799 8.3 -- S. ST 12.0% 4pB 40 42.0 95.0 1080.0
Rammer et al. [14]
16.8% 4,056 8.7 8.7 D. ST 21.7% 5pB 11 36.0 237.0 2370.0 13.2% 10,779 8.3 8.3 D. ST 24.6% 5pB 30 99.0 202.0 2020.0 17.9% 23,289 6.9 6.9 D. ST 24.6% 5pB 17 98.0 302.0 3020.0 12.7% 21,701 6.8 6.8 D. ST 23.9% 5pB 17 95.0 350.0 3500.0
Rammer, McLean [7]
20.9% -- 11.1 11.1 E. S. ST 22.0% 5pB 57 51.0 102.0 1020.0 29.1% -- 10.6 10.6 E. S. ST 22.0% 5pB 40 51.0 203.0 2030.0 19.7% -- 9.4 9.4 E. S. ST 22.0% 5pB 30 102.0 203.0 2030.0 17.0% -- 5.6 5.6 E. S. ST 22.0% 5pB 30 102.0 305.0 3050.0 13.4% -- 5.1 5.1 E. S. ST 22.0% 5pB 30 102.0 356.0 3560.0 8.2% -- 13.2 13.2 So. P. ST 22.0% 5pB 56 51.0 102.0 1020.0 22.0% -- 10.2 10.2 So. P. ST 22.0% 5pB 42 51.0 203.0 2030.0 9.1% -- 9.2 9.2 So. P. ST 22.0% 5pB 30 102.0 203.0 2030.0 11.6% -- 7.7 7.7 So. P. ST 22.0% 5pB 25 102.0 305.0 3050.0 18.7% -- 6.7 6.7 So. P. ST 22.0% 5pB 30 102.0 356.0 3560.0 13.1% -- 12.8 12.8 So. P. ST 12.0% 5pB 60 51.0 102.0 1020.0 15.6% -- 10.7 10.7 So. P. ST 12.0% 5pB 30 51.0 203.0 2030.0 20.9% -- 11.3 11.3 So. P. ST 12.0% 5pB 59 102.0 203.0 2030.0 20.0% -- 8.3 8.3 So. P. ST 12.0% 5pB 29 102.0 305.0 3050.0 8.5% -- 7.4 7.4 So. P. ST 12.0% 5pB 30 102.0 356.0 3560.0
Lackner [58] 17.6% 3,611 7.1 7.0 S. ST 11.6% 3pB 4 40.0 145.0 1051.0 16.5% 8,468 5.7 5.7 S. ST 13.2% 3pB 5 80.0 170.0 1260.0 18.5% 11,955 6.3 6.3 S. ST 10.6% 3pB 5 80.0 240.0 1680.0
Meadows [81] 12.0% -- 12.1 14.0 So. P. ST 10.0% -- 11 41.3 92.2 457.2 19.9% -- 9.4 10.1 So. P. ST 10.0% -- 11 41.3 92.2 457.2
Korin [69]
8.5% 1,713 10.9 11.6 R. W. W. ST 10.0% 3pB 5 45.0 (18.0) 95.0 500.0
16.1% 1,713 14.8 17.2 So. Y. P. ST 9.0% 3pB 3 45.0 (18.0) 95.0 500.0
6.4% 1,713 12.4 12.9 F. R. W. ST 11.0% 3pB 4 45.0 (18.0) 95.0 500.0
3.6% 1,713 11.6 12.1 S. W. W. ST 11.0% 3pB 3 45.0 (18.0) 95.0 500.0
8.5% 1,713 9.9 11.2 SPF ST 11.0% 3pB 3 45.0 (18.0) 95.0 500.0
13.7% 642 9.4 11.5 R. W. W. ST 10.0% 5pB 3 40 (13,3) 95.0 1140.0 25.5% 642 12.0 13.2 So. Y. P. ST 9.0% 5pB 5 41 (13,3) 95.0 1140.0 4.9% 642 10.4 10.8 F. R. W. ST 11.0% 5pB 3 42 (13,3) 95.0 1140.0 10.1% 642 10.0 10.3 S. W. W. ST 11.0% 5pB 5 43 (13,3) 95.0 1140.0
16.5% 642 9.8 11.0 SPF ST 11.0% 5pB 3 44 (13,3) 95.0 1140.0
Lam et al. [15]
12.0% -- 8.7 -- D. ST 12.0% 5pB 54 38.0 185.0 925.0
12.0% -- 6.2 -- H. F. ST 12.0% 5pB 60 38.0 185.0 925.0
12.0% -- 6.7 -- SPF ST 12.0% 5pB 43 38.0 185.0 925.0
12.0% 2,652 9.5 -- D. ST 12.0% 5pB 50 38.0 185.0 1110.0
12.0% 2,652 7.9 -- H. F. ST 12.0% 5pB 50 38.0 185.0 1110.0
12.0% 2,652 7.7 -- SPF ST 12.0% 5pB 50 38.0 185.0 1110.0
Korin [68]
7.0% 1,808 9.2 -- P. (S.) ST 12.0% 3pB 4 45.0 (19.0) 95.0 450.0
9.0% 1,808 10.0 -- L. p. P. ST 12.0% 3pB 4 45.0 (19.0) 95.0 450.0
41.2% 1,808 8.9 -- SPF ST 12.0% 3pB 5 45.0 (19.0) 95.0 450.0
24.0% 1,808 9.1 -- SPF ST 12.0% 3pB 5 45.0 (19.0) 95.0 450.0
7.0% 1,808 8.1 -- S. (Y.) ST 12.0% 3pB 4 45.0 (19.0) 95.0 450.0

21
Reference
CoV
As,korr
fv,mean,12
fv,mean,12,MLE
Material
MC
Test-config.
Quantity
Width (web)
Depth (web)
Length
[-] [%] [mm²] [N/mm²] [N/mm²] [-] [%] [-] [#] [mm] [mm] [mm]
Breitinger et al. [82]
24.0% 4,098 8.3 -- R. P. ST 12.0% 5pB 80 35.0 70.0 840.0 23.0% 5,269 7.8 -- R. P. ST 12.0% 5pB 80 35.0 90.0 1080.0 22.0% 8,196 7.0 -- R. P. ST 12.0% 5pB 80 35.0 140.0 1680.0 24.0% 16,977 5.9 -- R. P. ST 12.0% 5pB 80 35.0 290.0 3480.0 18.0% 4,098 9.4 -- R. P. ST 12.0% 5pB 80 35.0 70.0 840.0 20.0% 5,269 8.9 -- R. P. ST 12.0% 5pB 80 35.0 90.0 1080.0 18.0% 8,196 8.3 -- R. P. ST 12.0% 5pB 80 35.0 140.0 1680.0 20.0% 16,977 6.5 -- R. P. ST 12.0% 5pB 80 35.0 290.0 3480.0 16.0% 4,098 11.6 -- R. P. ST 12.0% 5pB 80 35.0 70.0 840.0 16.0% 5,269 10.4 -- R. P. ST 12.0% 5pB 80 35.0 90.0 1080.0 15.0% 8,196 10.0 -- R. P. ST 12.0% 5pB 80 35.0 140.0 1680.0 15.0% 16,977 7.6 -- R. P. ST 12.0% 5pB 80 35.0 290.0 3480.0 26.0% 5,269 8.8 -- R. P. ST 12.0% 5pB 80 45.0 70.0 840.0 21.0% 6,774 8.1 -- R. P. ST 12.0% 5pB 80 45.0 90.0 1080.0 27.0% 10,538 7.2 -- R. P. ST 12.0% 5pB 80 45.0 140.0 1680.0 21.0% 21,828 6.2 -- R. P. ST 12.0% 5pB 80 45.0 290.0 3480.0 18.0% 10,538 8.7 -- R. P. ST 12.0% 5pB 80 45.0 140.0 1680.0 15.0% 10,538 9.7 -- R. P. ST 12.0% 5pB 80 45.0 140.0 1680.0
Keenan et al. [22]
8.4% -- 8.1 8.4 W. S. ST 8.0% 3pB 6 25.0 25.0 100.0 12.3% -- 7.3 7.5 W. S. ST 8.0% 3pB 6 50.0 25.0 100.0 13.7% -- 6.3 6.4 W. S. ST 8.0% 3pB 6 75.0 25.0 100.0 11.0% -- 8.6 8.7 W. S. ST 8.0% 3pB 6 25.0 50.0 200.0 16.6% -- 7.9 7.9 W. S. ST 8.0% 3pB 6 50.0 50.0 200.0 11.3% -- 6.6 6.6 W. S. ST 8.0% 3pB 6 75.0 50.0 200.0 5.6% -- 8.2 8.6 W. S. ST 8.0% 3pB 6 25.0 75.0 300.0 14.4% -- 7.7 7.7 W. S. ST 8.0% 3pB 6 50.0 75.0 300.0 8.0% -- 6.6 6.8 W. S. ST 8.0% 3pB 6 75.0 75.0 300.0
Keenan et al. [22]
5.8% -- 8.2 8.2 W. S. ST 8.0% 3pB 6 25.0 25.0 100.0 9.2% -- 8.1 9.1 W. S. ST 8.0% 3pB 6 50.0 25.0 100.0 17.1% -- 6.2 6.6 W. S. ST 8.0% 3pB 6 75.0 25.0 100.0 6.0% -- 9.2 9.2 W. S. ST 8.0% 3pB 6 25.0 50.0 200.0 10.5% -- 8.6 8.8 W. S. ST 8.0% 3pB 6 50.0 50.0 200.0 14.5% -- 6.6 7.4 W. S. ST 8.0% 3pB 6 75.0 50.0 200.0 9.5% -- 9.1 -- W. S. ST 8.0% 3pB 6 25.0 75.0 300.0 5.4% -- 8.6 8.6 W. S. ST 8.0% 3pB 6 50.0 75.0 300.0 12.4% -- 6.8 6.8 W. S. ST 8.0% 3pB 6 75.0 75.0 300.0
Asselin [52]
-- -- -- 11.9 SPF ST -- 5pB 57 40.1 90.7 889.0 -- 4,386 -- 9.8 SPF ST -- 5pB 30 89.4 190.0 1905.0 -- 12,781 -- 5.9 SPF ST -- 5pB 30 89.4 291.3 2921.0 -- 24,175 -- 5.6 SPF ST -- 5pB 30 101.3 362.5 3619.5 -- -- -- 13.5 So. P. ST -- 5pB 56 39.6 90.7 889.0 -- 1,008 -- 10.5 So. P. ST -- 5pB 42 39.9 187.2 1905.0 -- 3,882 -- 10.4 So. P. ST -- 5pB 30 88.1 190.8 1905.0 -- 11,569 -- 8.2 So. P. ST -- 5pB 27 88.9 286.3 2857.5 -- 16,860 -- 7.3 So. P. ST -- 5pB 30 89.2 338.1 3365.5
Riyanto [13] -- 221 -- 10.2 D. ST -- 3pB 76 38.0 88.8 444.5 -- -- -- 12.7 D. ST -- 5pB 76 38.0 88.8 889.0
Schickhofer, Brandner [83] -- 63,210 -- 6.5 S. ST -- -- -- -- -- --
Yoshihara, Furushima
[84]
8.8% 383 16.2 16.2 W.H. ST 20.0% asym4pB -- 18.0 18.0 125.0 5.7% 1,008 13.6 13.6 W.H. ST 20.0% asym4pB -- 18.0 30.0 250.0 6.5% 58 27.9 27.9 W.H. ST 20.0% asym4pB -- 4.5 18.0 100.0 12.2% 96 26.2 26.2 W.H. ST 20.0% asym4pB -- 4.5 18.0 125.0 11.5% 133 22.7 22.7 W.H. ST 20.0% asym4pB -- 4.5 18.0 150.0 10.6% 171 19.2 19.2 W.H. ST 20.0% asym4pB -- 4.5 18.0 175.0 6.2% 208 19.8 19.8 W.H. ST 20.0% asym4pB -- 4.5 18.0 200.0 10.0% 246 18.0 18.0 W.H. ST 20.0% asym4pB -- 4.5 18.0 225.0
Klöck [85] 11.8% 91,102 5.6 5.6 S. GLT 12.0% 4pB 30 140.0 456.0 3048.0
Longworth [53]
10.9% 3,681 8.5 8.4 D. GLT 10.7% 4pB 25 76.2 114.3 698.5 14.5% 8,589 7.6 7.0 D. GLT 14.3% 4pB 27 76.2 266.7 1460.5 13.9% 25,052 5.9 5.2 D. GLT 13.6% 4pB 26 222.3 266.7 1460.5 15.5% 23,314 5.0 5.1 D. GLT 13.5% 4pB 24 76.2 723.9 3746.5 15.1% 38,856 5.3 4.5 D. GLT 14.8% 4pB 28 127.0 723.9 3746.5
Rammer, Soltis [18]
10.7% -- 12.8 14.4 So. P. GLT 10.0% 5pB 22 38.1 101.6 1016.0 9.8% -- 10.7 12.0 So. P. GLT 10.1% 5pB 39 63.5 139.7 1397.0 12.3% -- 10.6 12.0 So. P. GLT 10.2% 5pB 37 63.5 139.7 1397.0 8.6% 7,063 9.2 9.2 So. P. GLT 12.0% 5pB 20 76.2 279.4 2794.0 10.4% 49,349 6.4 6.4 So. P. GLT 10.5% 5pB 20 127.0 558.8 5588.0

22
Reference
CoV
As,korr
fv,mean,12
fv,mean,12,MLE
Material
MC
Test-config.
Quantity
Width (web)
Depth (web)
Length
[-] [%] [mm²] [N/mm²] [N/mm²] [-] [%] [-] [#] [mm] [mm] [mm]
Rammer, Soltis [18]
10.7% -- 12.8 14.4 So. P. GLT 10.0% 5pB 22 38.1 101.6 1016.0 9.8% -- 10.7 12.0 So. P. GLT 10.1% 5pB 39 63.5 139.7 1397.0 12.3% -- 10.6 12.0 So. P. GLT 10.2% 5pB 37 63.5 139.7 1397.0 8.6% 7,063 9.2 9.2 So. P. GLT 12.0% 5pB 20 76.2 279.4 2794.0 10.4% 49,349 6.4 6.4 So. P. GLT 10.5% 5pB 20 127.0 558.8 5588.0
Rammer, Soltis [18]
8.3% -- 9.6 10.0 D. GLT 10.7% 5pB 32 38.1 139.7 1397.0 10.5% -- 8.9 9.0 D. GLT 12.1% 5pB 31 63.5 165.1 1651.0 6.7% 11,233 6.7 6.7 D. GLT 11.3% 5pB 19 79.4 304.8 3048.0 10.7% 13,013 6.1 6.5 D. GLT 10.1% 5pB 37 111.1 292.1 2921.0 8.7% 63,297 5.2 5.2 D. GLT 11.3% 5pB 20 130.2 609.6 6096.0 9.7% 556 9.6 10.0 D. GLT 10.8% 5pB 16 38.1 139.7 1397.0 7.8% 2,415 8.5 8.8 D. GLT 12.0% 5pB 17 63.5 165.1 1651.0 9.0% 13,013 6.1 6.6 D. GLT 9.7% 5pB 20 111.1 292.1 2921.0
Schickhofer [43]
15.0% 81,897 3.5 3.5 S. GLT 12.0% 3pB 5 220 (100)
608 (352) 3040.0
15.0% 24,025 4.4 4.4 S. GLT 12.0% 3pB 6 150 (100)
320 (192) 1600.0
15.0% 81,897 3.9 3.9 S. GLT 12.0% 3pB 6 220 (100)
608 (352) 3040.0
13.4% 81,897 3.7 3.7 S. GLT 12.0% 3pB 7 220 (100)
608 (352) 3040.0
9.8% 81,897 4.4 4.4 S. GLT 12.0% 3pB 11 220 (100)
608 (352) 3040.0
4.8% 81,897 4.1 4.1 S. GLT 12.0% 3pB 11 220 (100)
608 (352) 3040.0
11.8% 81,897 3.5 3.5 S. GLT 12.0% 4pB 5 220 (100)
608 (352) 3040.0
19.1% 16,525 5.6 5.6 S. GLT 12.0% 8pB 9 150 (100)
320 (192) 3600.0
-- 42,642 3.6 3.6 S. GLT 12.0% 3pB 3 100.0 592 (352) 2960.0
-- 42,642 4.8 4.8 S. GLT 12.0% 3pB 3 100.0 592 (352) 2960.0
6.5% 81,897 4.1 4.1 S. GLT 12.0% 3pB 15 220 (100)
608 (352) 3040.0
11.1% 81,897 3.8 3.8 S. GLT 12.0% 3pB 15 220 (100)
608 (352) 3040.0
Yeh, Williamson
[44]
7.3% 111,176 4.4 4.4 D. GLT 11.4% 4pB 39 171.0 457.0 3048.0 9.0% 51,362 4.7 4.7 D. GLT 11.5% 4pB 40 79.0 457.0 3048.0 11.5% 111,472 5.5 5.5 So. P. GLT 11.0% 4pB 42 171.0 454.0 3048.0 9.4% 51,499 5.0 5.0 So. P. GLT 10.3% 4pB 40 79.0 454.0 3048.0 14.4% 69,963 5.1 5.1 SPF GLT 14.5% 4pB 40 105.0 429.0 3048.0
Rammer [45]
8.3% 843 10.0 -- D. GLT 12.0% 5pB 9 152.0 130.0 650.0 9.7% 843 7.7 -- D. GLT 12.0% 5pB 18 130.0 152.0 760.0 14.9% 1,691 6.2 -- D. GLT 12.0% 5pB 18 130.0 305.0 1525.0 12.0% 2,323 5.8 -- D. GLT 12.0% 5pB 19 130.0 419.0 2095.0 14.6% 3,171 4.8 -- D. GLT 12.0% 5pB 19 130.0 572.0 2860.0 10.2% 4,225 4.6 -- D. GLT 12.0% 5pB 18 130.0 762.0 3810.0
Quaile, Keenan
[23]
-- 341 13.8 -- D. ST 12.0% 3pB 2 25.4 25.4 101.6 -- 937 13.4 -- D. ST 12.0% 3pB 2 25.4 50.8 203.2 -- 683 11.2 -- D. ST 12.0% 3pB 2 50.8 25.4 101.6 -- 1,532 12.5 -- D. ST 12.0% 3pB 2 25.4 76.2 304.8 -- 1,024 10.3 -- D. ST 12.0% 3pB 2 76.2 25.4 101.6 -- 1,873 11.6 -- D. ST 12.0% 3pB 2 50.8 50.8 203.2 -- 3,064 12.6 -- D. ST 12.0% 3pB 2 50.8 76.2 304.8 -- 2,810 11.3 -- D. ST 12.0% 3pB 2 76.2 50.8 203.2 -- 4,595 11.2 -- D. ST 12.0% 3pB 2 76.2 76.2 304.8 -- 341 10.5 -- D. ST 12.0% 3pB 2 25.4 25.4 101.6 -- 937 10.4 -- D. ST 12.0% 3pB 2 25.4 50.8 203.2 -- 683 10.2 -- D. ST 12.0% 3pB 2 50.8 25.4 101.6 -- 1,532 9.9 -- D. ST 12.0% 3pB 2 25.4 76.2 304.8 -- 1,024 9.2 -- D. ST 12.0% 3pB 2 76.2 25.4 101.6 -- 1,873 10.6 -- D. ST 12.0% 3pB 2 50.8 50.8 203.2 -- 3,064 10.8 -- D. ST 12.0% 3pB 2 50.8 76.2 304.8 -- 2,810 9.9 -- D. ST 12.0% 3pB 2 76.2 50.8 203.2 -- 4,595 9.5 -- D. ST 12.0% 3pB 2 76.2 76.2 304.8

23
Reference
CoV
As,korr
fv,mean,12
fv,mean,12,MLE
Material
MC
Test-config.
Quantity
Width (web)
Depth (web)
Length
[-] [%] [mm²] [N/mm²] [N/mm²] [-] [%] [-] [#] [mm] [mm] [mm]
Keenan et al. [22]
-- -- 8.9 -- B. S. GLT 9.0% 3pB 2 20.0 100.0 300.0 -- -- 9.1 -- B. S. GLT 9.0% 3pB 2 40.0 100.0 300.0 -- -- 6.9 6.9 B. S. GLT 9.0% 3pB 2 90.0 100.0 300.0 -- -- 4.8 -- B. S. GLT 9.0% 3pB 2 20.0 150.0 300.0 -- -- 6.3 6.3 B. S. GLT 9.0% 3pB 2 40.0 150.0 300.0 -- -- 5.7 5.7 B. S. GLT 9.0% 3pB 2 90.0 150.0 300.0 -- -- 4.4 4.4 B. S. GLT 9.0% 3pB 2 20.0 200.0 300.0 -- -- 5.4 5.4 B. S. GLT 9.0% 3pB 2 40.0 200.0 300.0 -- -- 4.7 4.7 B. S. GLT 9.0% 3pB 2 90.0 200.0 300.0 -- -- 5.9 -- B. S. GLT 9.0% 3pB 2 20.0 100.0 400.0 -- -- 7.4 -- B. S. GLT 9.0% 3pB 2 40.0 100.0 400.0 -- -- 6.4 6.4 B. S. GLT 9.0% 3pB 2 90.0 100.0 400.0 -- -- 5.1 -- B. S. GLT 9.0% 3pB 2 20.0 150.0 400.0 -- -- 5.9 5.9 B. S. GLT 9.0% 3pB 2 40.0 150.0 400.0 -- -- 4.6 4.6 B. S. GLT 9.0% 3pB 2 90.0 150.0 400.0 -- -- 4.2 4.2 B. S. GLT 9.0% 3pB 2 20.0 200.0 400.0 -- -- 5.3 5.3 B. S. GLT 9.0% 3pB 2 40.0 200.0 400.0 -- -- 4.4 4.4 B. S. GLT 9.0% 3pB 2 90.0 200.0 400.0 -- -- 5.7 -- B. S. GLT 9.0% 3pB 2 20.0 100.0 500.0 -- -- 5.0 -- B. S. GLT 9.0% 3pB 2 40.0 100.0 500.0 -- -- 5.2 5.2 B. S. GLT 9.0% 3pB 2 90.0 100.0 500.0 -- -- 4.7 -- B. S. GLT 9.0% 3pB 2 20.0 150.0 500.0 -- -- 4.3 4.3 B. S. GLT 9.0% 3pB 2 40.0 150.0 500.0 -- -- 4.2 -- B. S. GLT 9.0% 3pB 2 90.0 150.0 500.0 -- -- 3.7 -- B. S. GLT 9.0% 3pB 2 20.0 200.0 500.0 -- -- 4.1 4.1 B. S. GLT 9.0% 3pB 2 40.0 200.0 500.0 -- -- 4.0 4.0 B. S. GLT 9.0% 3pB 2 90.0 200.0 500.0
16.3% 13,112 5.0 5.0 SPF GLT 9.0% 3pB 10 76.0 200.0 800.0 8.3% 20,449 5.4 5.4 SPF GLT 9.0% 3pB 10 76.0 400.0 1600.0 5.0% 34,171 5.6 5.6 SPF GLT 9.0% 3pB 10 127.0 400.0 1600.0
Foschi, Barrett [48]
10.9% 7,513 8.8 8.8 D. GLT 12.0% 3pB 30 76.2 114.3 457.2 14.5% 17,531 7.1 7.1 D. GLT 12.0% 3pB 30 76.2 266.7 1066.8 13.8% 51,133 5.6 5.6 D. GLT 12.0% 3pB 30 222.3 266.7 1066.8 13.7% 47,585 4.7 4.7 D. GLT 12.0% 3pB 30 76.2 723.9 2895.6 15.1% 79,308 4.9 4.9 D. GLT 12.0% 3pB 30 127.0 723.9 2895.6
Shortcuts: Structural Timber [ST]; Glued Laminated Timber [GLT]; Scots Pine [Sc. P.]; Norway Spruce [S.]; Douglas Fir [D.]; Engelmann Spruce [E. S.]; Southern Pine [So. P.]; Russian White Wood [R. W. W.]; Southern Yellow Pine [So. Y. P.]; Finish Red Wood [F. R. W.]; Swedish White Wood [S. W. W.]; Spruce-Pine-Fir [SPF]; Hem-Fir [H. F.]; Pine (Sweden) [P. (S.)]; Lodgepole Pine (Canada) [L. p. P. (C.)]; SPF (Canada), 1. mill [SPF (C.), 1. mill]; SPF (Canada), 2. mill [SPF (C.), 2. mill]; Spruce (Yugoslavia) [S. (Y.)]; Radiata Pine [R. P.]; White Spruce [W. S.]; Black Spruce [B. S.]; Western Hemlock [W. H.]