Embed Size (px)
Citation preview
Innovations in Operational Risk
Joshua Corrigan, Milliman Principal
Agenda
• Introduction • Traditional Assessment Methods • Structural Modelling

INTRODUCTION Section 1
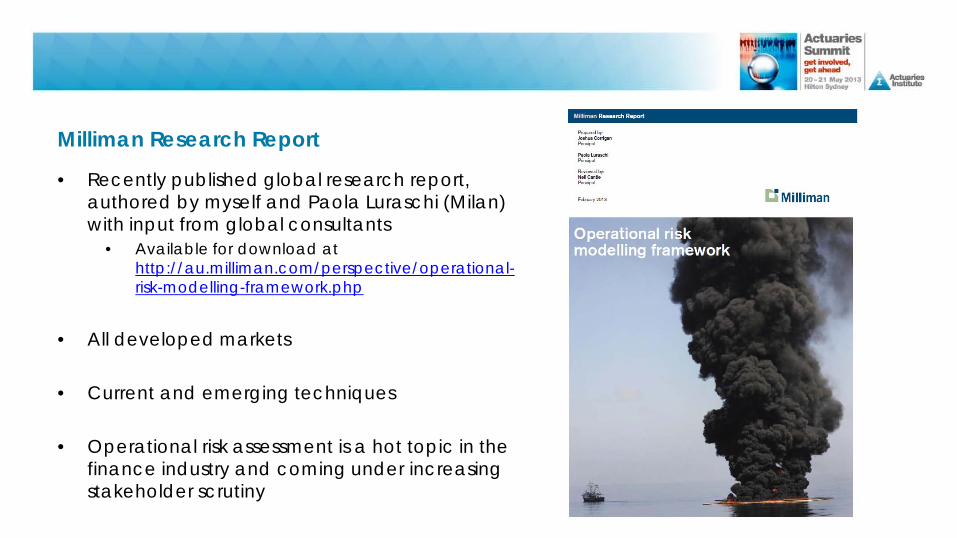
Milliman Research Report
• Recently published global research report, authored by myself and Paola Luraschi (Milan) with input from global consultants
• Available for download at http://au.milliman.com/perspective/operational-risk-modelling-framework.php
• All developed markets
• Current and emerging techniques
• Operational risk assessment is a hot topic in the
finance industry and coming under increasing stakeholder scrutiny
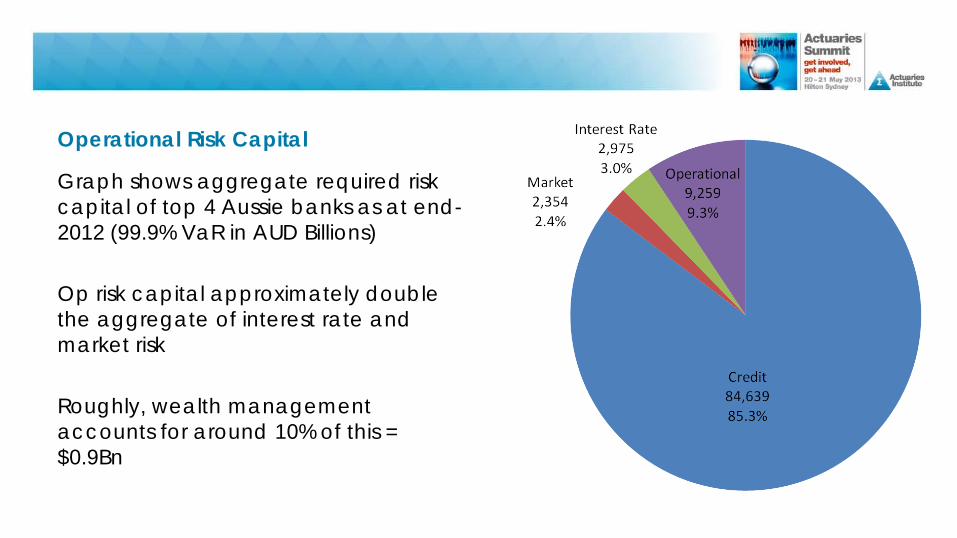
Operational Risk Capital
Graph shows aggregate required risk capital of top 4 Aussie banks as at end-2012 (99.9% VaR in AUD Billions) Op risk capital approximately double the aggregate of interest rate and market risk Roughly, wealth management accounts for around 10% of this = $0.9Bn
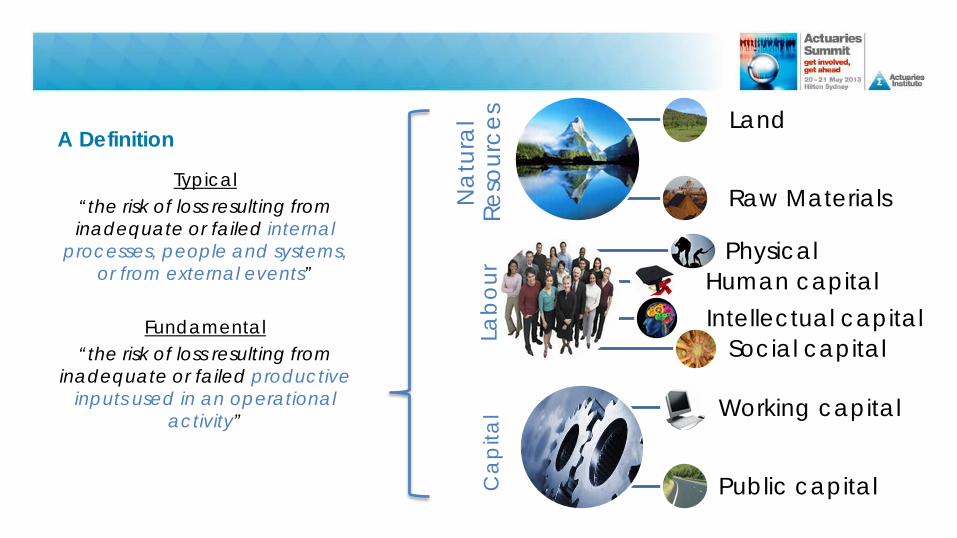
A Definition
Typical “the risk of loss resulting from inadequate or failed internal
processes, people and systems, or from external events”
Fundamental
“the risk of loss resulting from inadequate or failed productive
inputs used in an operational activity”
Nat
ural
Re
sour
ces Land
Raw Materials
Labo
ur Physical
Human capital Intellectual capital
Social capital
Ca
pita
l Working capital
Public capital
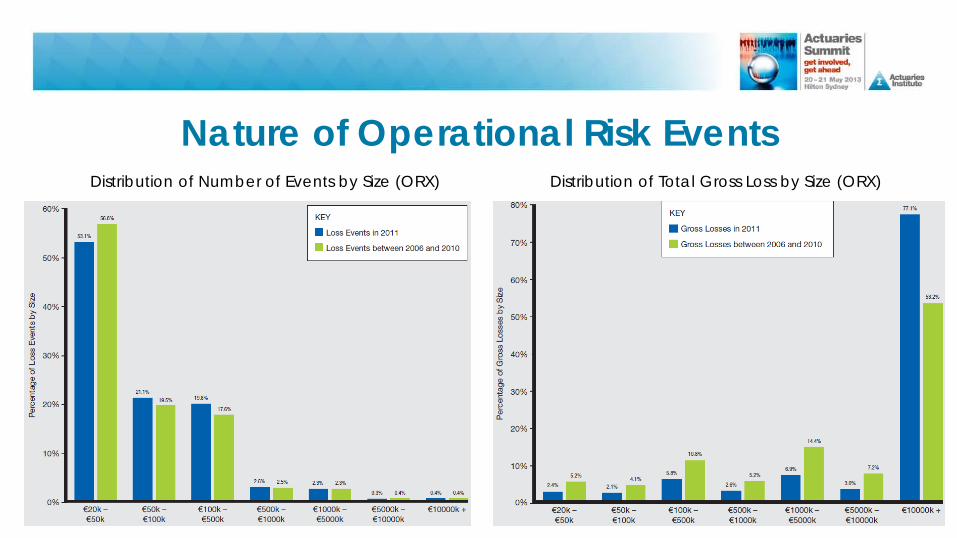
Nature of Operational Risk Events Distribution of Number of Events by Size (ORX) Distribution of Total Gross Loss by Size (ORX)
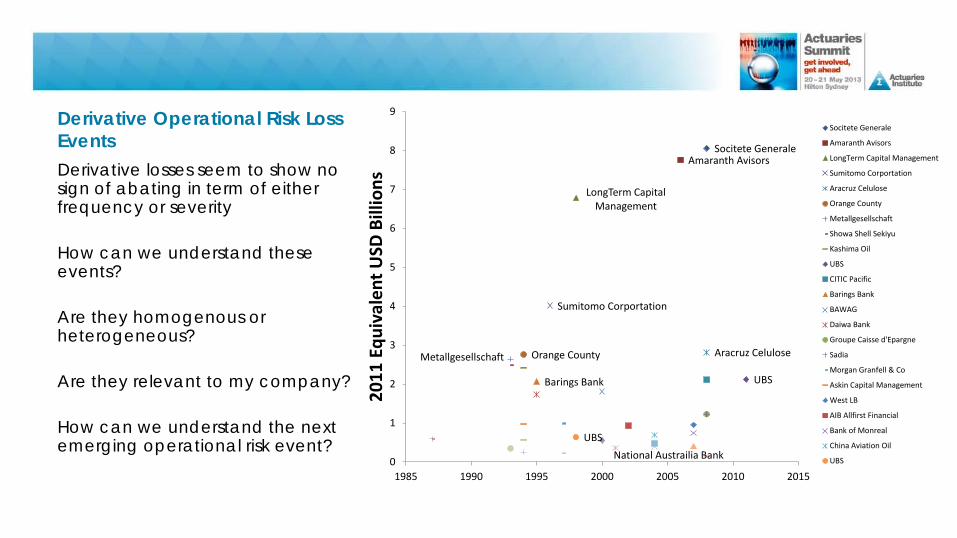
Derivative Operational Risk Loss Events Derivative losses seem to show no sign of abating in term of either frequency or severity How can we understand these events? Are they homogenous or heterogeneous? Are they relevant to my company? How can we understand the next emerging operational risk event?
Socitete GeneraleAmaranth Avisors
LongTerm Capital Management
Sumitomo Corportation
Aracruz CeluloseOrange CountyMetallgesellschaft
UBSBarings Bank
UBS
National Austrailia Bank0
1
2
3
4
5
6
7
8
9
1985 1990 1995 2000 2005 2010 2015
2011
Equ
ival
ent U
SD B
illio
ns
Socitete Generale
Amaranth Avisors
LongTerm Capital Management
Sumitomo Corportation
Aracruz Celulose
Orange County
Metallgesellschaft
Showa Shell Sekiyu
Kashima Oil
UBS
CITIC Pacific
Barings Bank
BAWAG
Daiwa Bank
Groupe Caisse d'Epargne
Sadia
Morgan Granfell & Co
Askin Capital Management
West LB
AIB Allfirst Financial
Bank of Monreal
China Aviation Oil
UBS
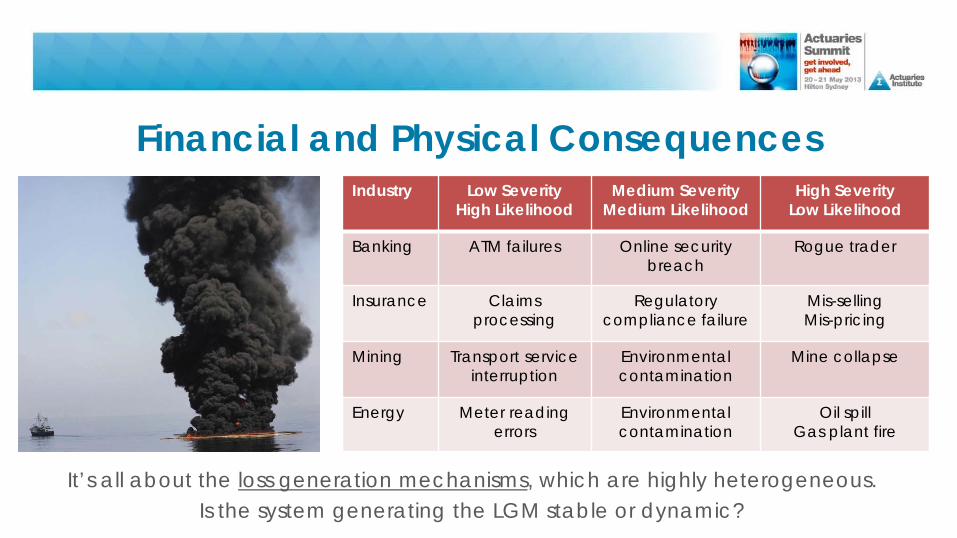
Financial and Physical Consequences Industry Low Severity
High Likelihood Medium Severity
Medium Likelihood High Severity
Low Likelihood
Banking ATM failures Online security breach
Rogue trader
Insurance Claims processing
Regulatory compliance failure
Mis-selling Mis-pricing
Mining Transport service interruption
Environmental contamination
Mine collapse
Energy Meter reading errors
Environmental contamination
Oil spill Gas plant fire
It’s all about the loss generation mechanisms, which are highly heterogeneous. Is the system generating the LGM stable or dynamic?
TRADITIONAL ASSESSMENT METHODS Section 2
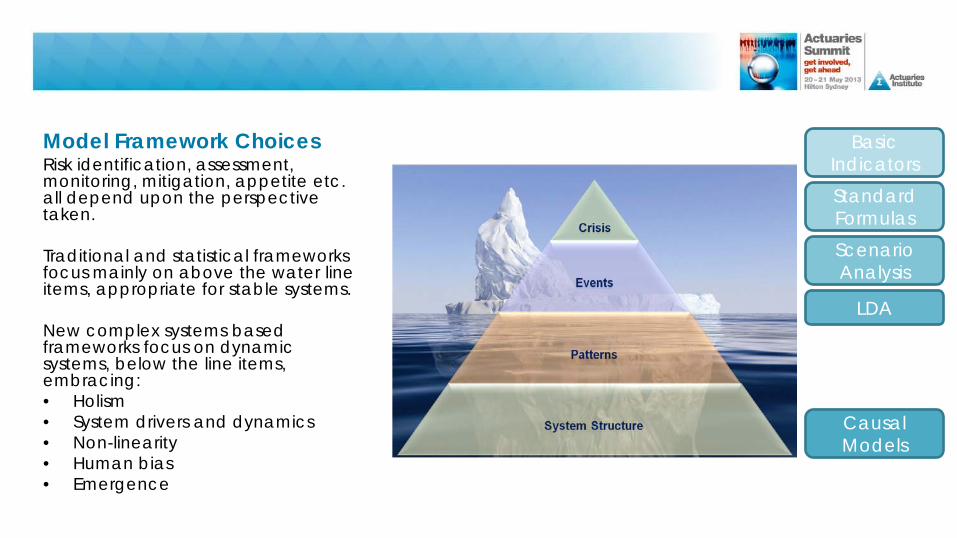
Model Framework Choices Risk identification, assessment, monitoring, mitigation, appetite etc. all depend upon the perspective taken. Traditional and statistical frameworks focus mainly on above the water line items, appropriate for stable systems. New complex systems based frameworks focus on dynamic systems, below the line items, embracing: • Holism • System drivers and dynamics • Non-linearity • Human bias • Emergence
Basic Indicators Standard Formulas
LDA
Causal Models
Scenario Analysis
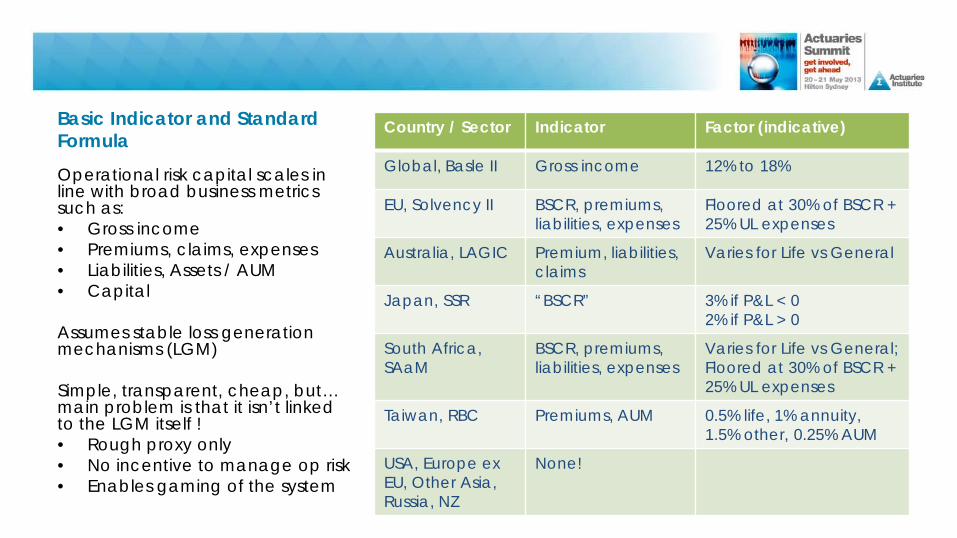
Basic Indicator and Standard Formula
Country / Sector Indicator Factor (indicative)
Global, Basle II Gross income 12% to 18%
EU, Solvency II BSCR, premiums, liabilities, expenses
Floored at 30% of BSCR + 25% UL expenses
Australia, LAGIC Premium, liabilities, claims
Varies for Life vs General
Japan, SSR “BSCR” 3% if P&L < 0 2% if P&L > 0
South Africa, SAaM
BSCR, premiums, liabilities, expenses
Varies for Life vs General; Floored at 30% of BSCR + 25% UL expenses
Taiwan, RBC Premiums, AUM 0.5% life, 1% annuity, 1.5% other, 0.25% AUM
USA, Europe ex EU, Other Asia, Russia, NZ
None!
Operational risk capital scales in line with broad business metrics such as: • Gross income • Premiums, claims, expenses • Liabilities, Assets / AUM • Capital Assumes stable loss generation mechanisms (LGM) Simple, transparent, cheap, but… main problem is that it isn’t linked to the LGM itself ! • Rough proxy only • No incentive to manage op risk • Enables gaming of the system
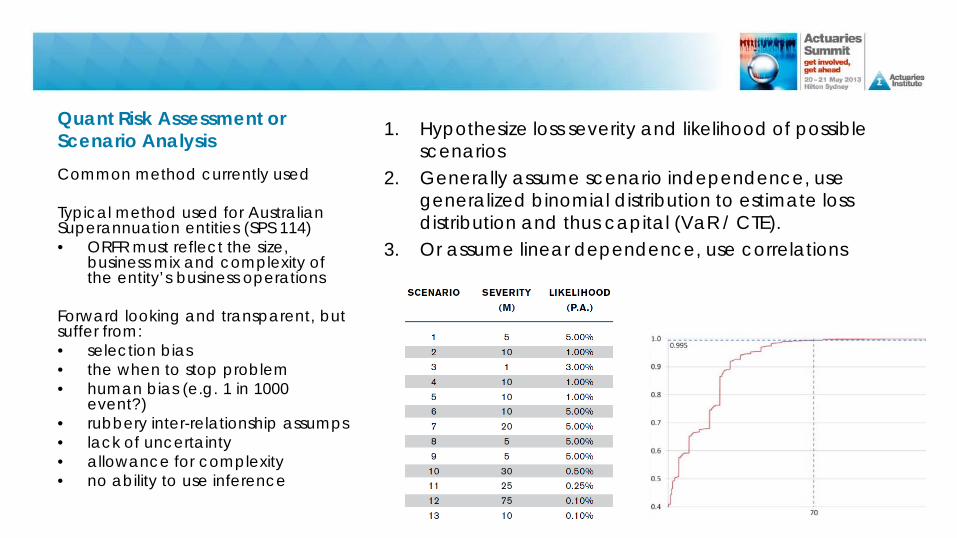
Quant Risk Assessment or Scenario Analysis 1. Hypothesize loss severity and likelihood of possible
scenarios 2. Generally assume scenario independence, use
generalized binomial distribution to estimate loss distribution and thus capital (VaR / CTE).
3. Or assume linear dependence, use correlations
Common method currently used Typical method used for Australian Superannuation entities (SPS 114) • ORFR must reflect the size,
business mix and complexity of the entity’s business operations
Forward looking and transparent, but suffer from: • selection bias • the when to stop problem • human bias (e.g. 1 in 1000
event?) • rubbery inter-relationship assumps • lack of uncertainty • allowance for complexity • no ability to use inference
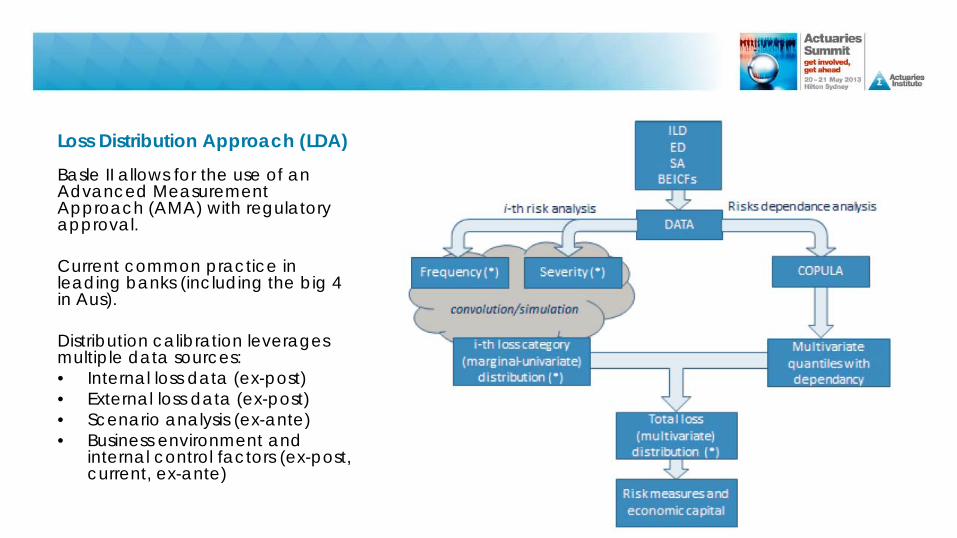
Loss Distribution Approach (LDA)
Basle II allows for the use of an Advanced Measurement Approach (AMA) with regulatory approval. Current common practice in leading banks (including the big 4 in Aus). Distribution calibration leverages multiple data sources: • Internal loss data (ex-post) • External loss data (ex-post) • Scenario analysis (ex-ante) • Business environment and
internal control factors (ex-post, current, ex-ante)
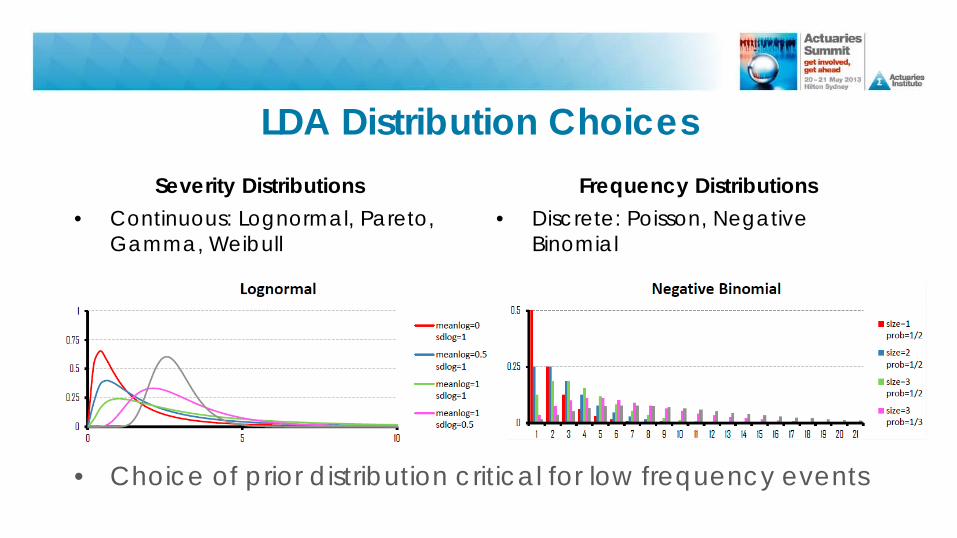
LDA Distribution Choices Severity Distributions
• Continuous: Lognormal, Pareto, Gamma, Weibull
Frequency Distributions • Discrete: Poisson, Negative
Binomial
• Choice of prior distribution critical for low frequency events
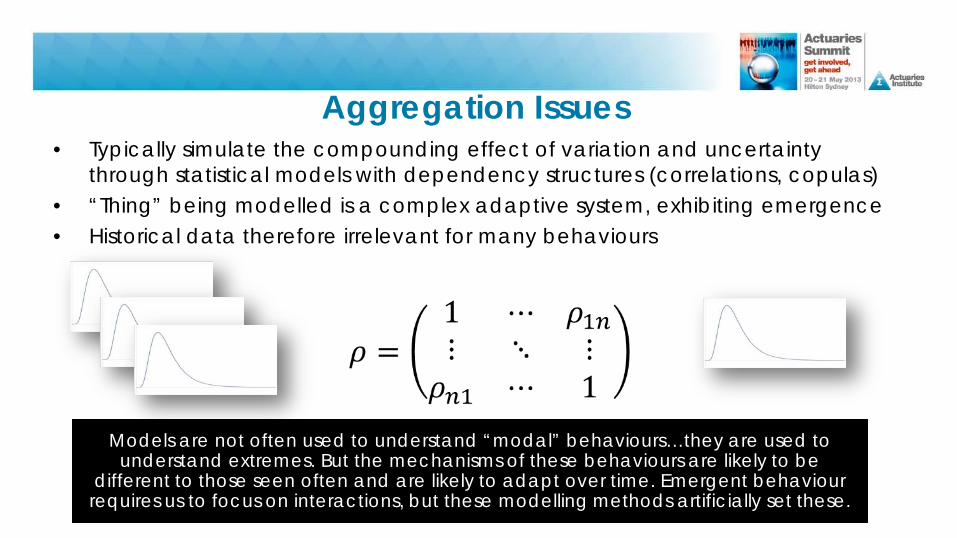
Aggregation Issues • Typically simulate the compounding effect of variation and uncertainty
through statistical models with dependency structures (correlations, copulas) • “Thing” being modelled is a complex adaptive system, exhibiting emergence • Historical data therefore irrelevant for many behaviours
Models are not often used to understand “modal” behaviours…they are used to understand extremes. But the mechanisms of these behaviours are likely to be
different to those seen often and are likely to adapt over time. Emergent behaviour requires us to focus on interactions, but these modelling methods artificially set these.
An Anthropological Study of Op Risk
4. “The Business” gets on with life
2. “The Business” imparts wisdom
3. “The Business” is shown the model
1. Modeler meets “The Business”
STRUCTURAL MODELLING Section 3
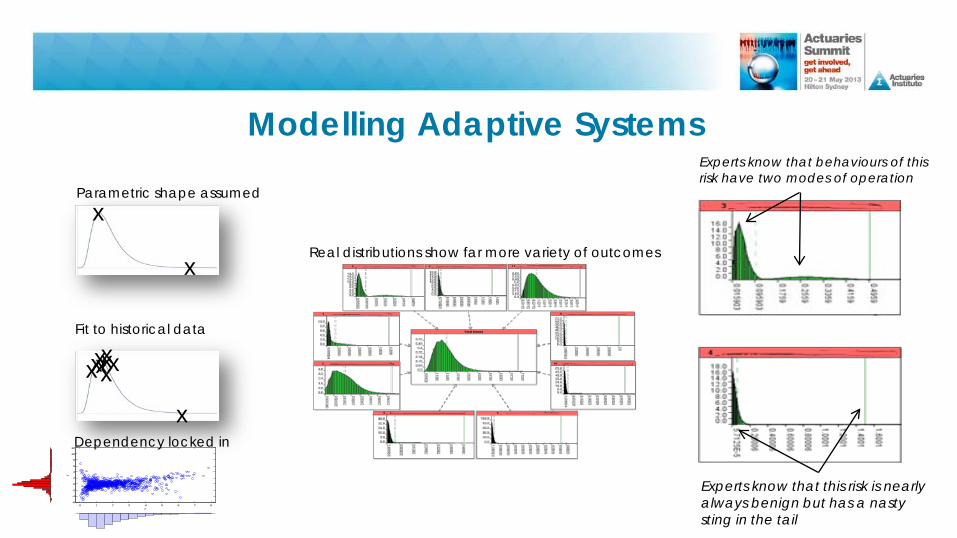
Modelling Adaptive Systems
x
x
Parametric shape assumed
x
x x x x x x x x Fit to historical data
0 1 2 3 4 5 6 7 8-6
-4
-2
0
2
4
6
8
10
12
x
y
Dependency locked in
Real distributions show far more variety of outcomes
Experts know that behaviours of this risk have two modes of operation
Experts know that this risk is nearly always benign but has a nasty sting in the tail
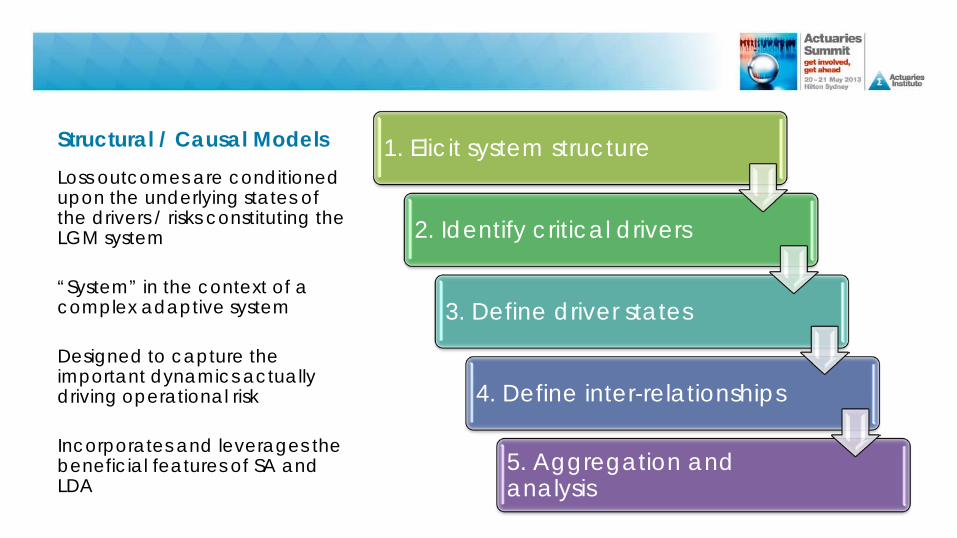
Structural / Causal Models 1. Elicit system structure
2. Identify critical drivers
3. Define driver states
4. Define inter-relationships
5. Aggregation and analysis
Loss outcomes are conditioned upon the underlying states of the drivers / risks constituting the LGM system “System” in the context of a complex adaptive system Designed to capture the important dynamics actually driving operational risk Incorporates and leverages the beneficial features of SA and LDA
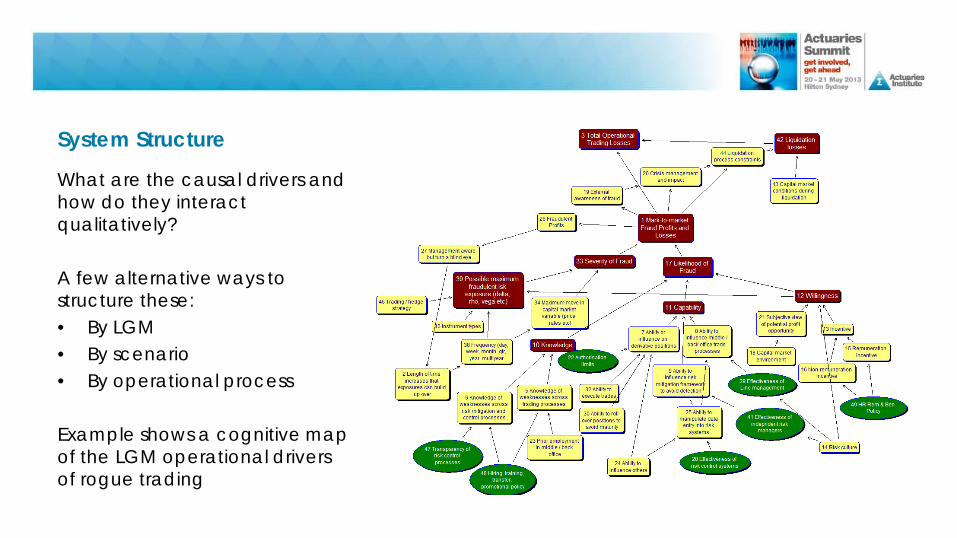
System Structure
What are the causal drivers and how do they interact qualitatively? A few alternative ways to structure these: • By LGM • By scenario • By operational process Example shows a cognitive map of the LGM operational drivers of rogue trading
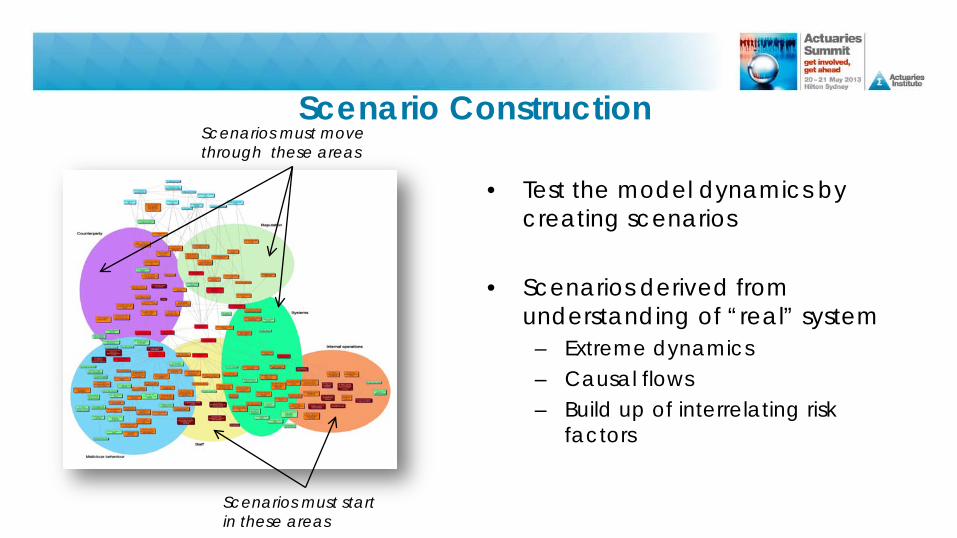
Scenario Construction
• Test the model dynamics by creating scenarios
• Scenarios derived from understanding of “real” system
– Extreme dynamics – Causal flows – Build up of interrelating risk
factors
Scenarios must start in these areas
Scenarios must move through these areas
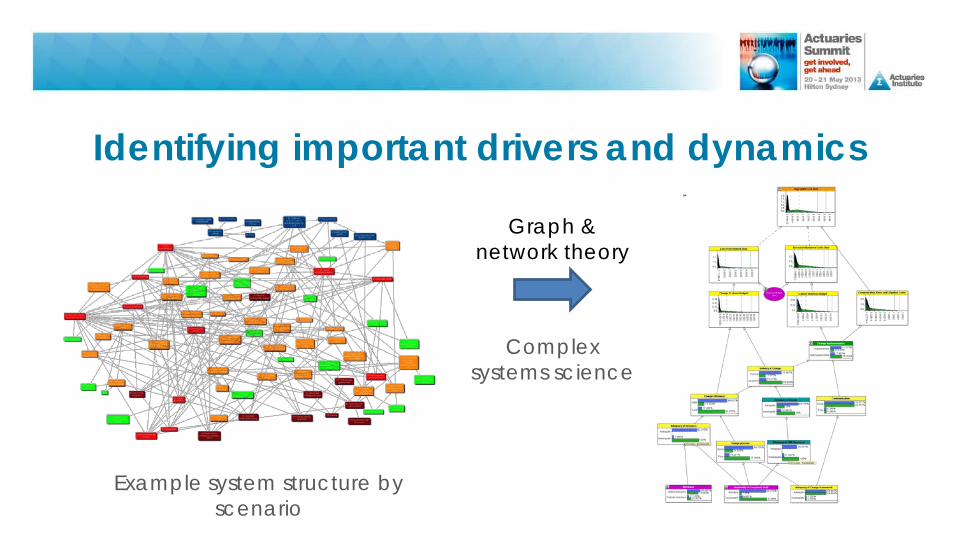
Identifying important drivers and dynamics
Graph & network theory
Complex systems science
Example system structure by scenario
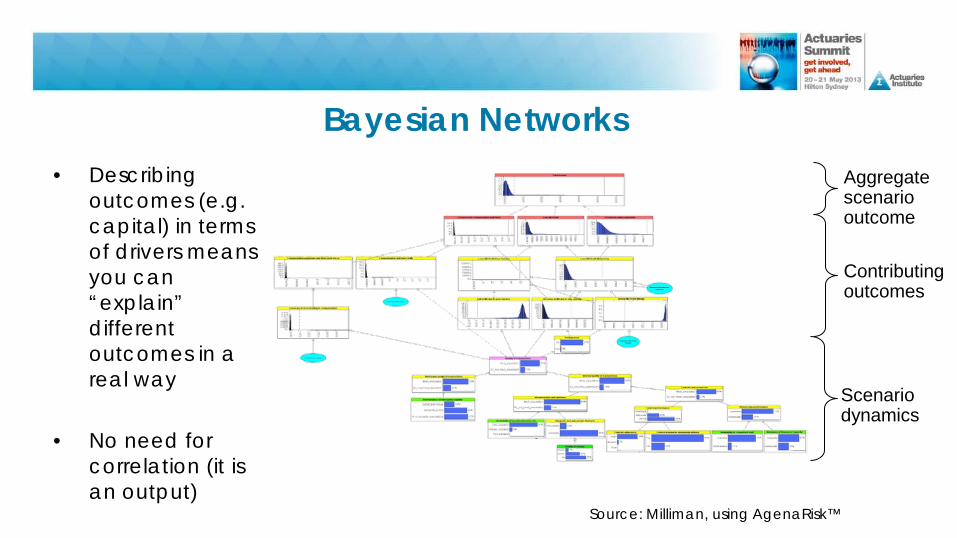
Bayesian Networks • Describing
outcomes (e.g. capital) in terms of drivers means you can “explain” different outcomes in a real way
• No need for correlation (it is an output)
Source: Milliman, using AgenaRisk™
Scenario dynamics
Contributing outcomes
Aggregate scenario outcome
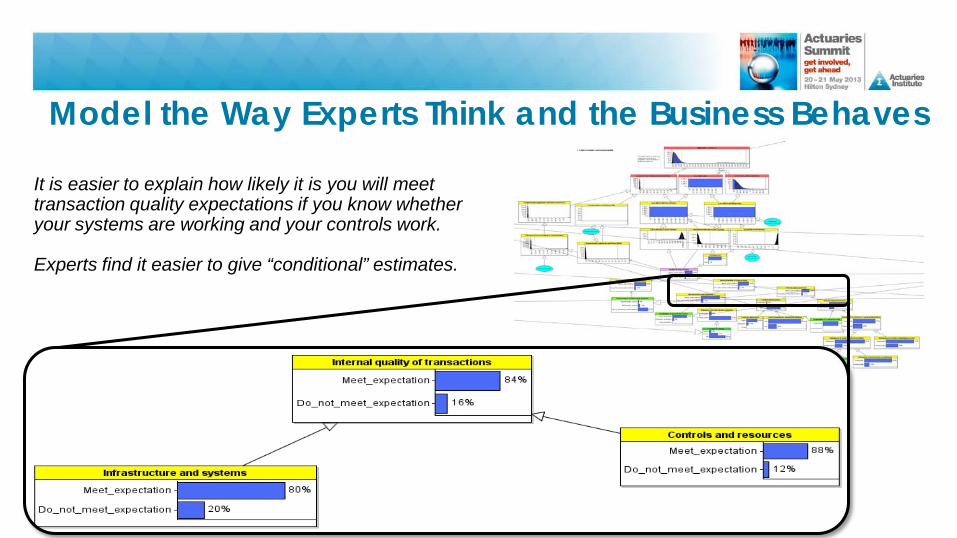
Model the Way Experts Think and the Business Behaves
It is easier to explain how likely it is you will meet transaction quality expectations if you know whether your systems are working and your controls work. Experts find it easier to give “conditional” estimates.
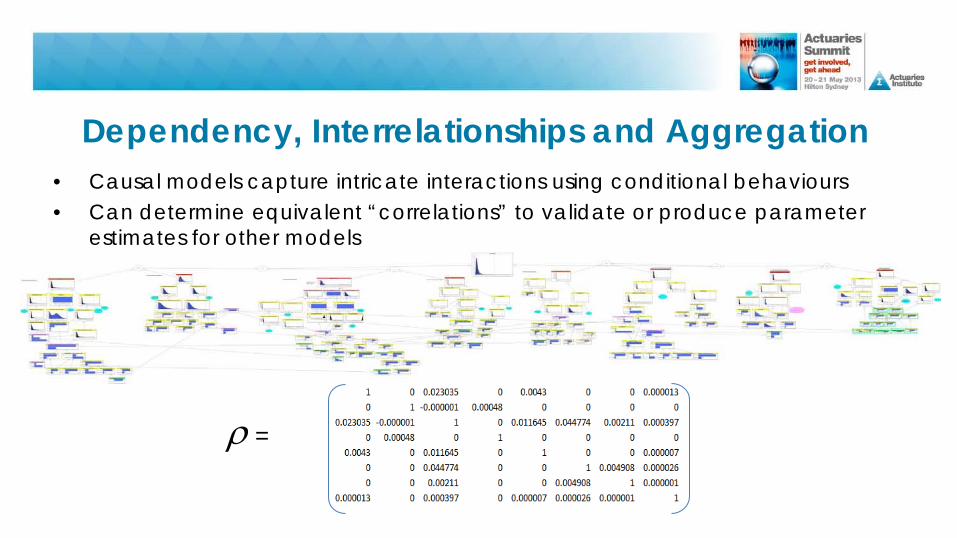
Dependency, Interrelationships and Aggregation
• Causal models capture intricate interactions using conditional behaviours • Can determine equivalent “correlations” to validate or produce parameter
estimates for other models
ρ =
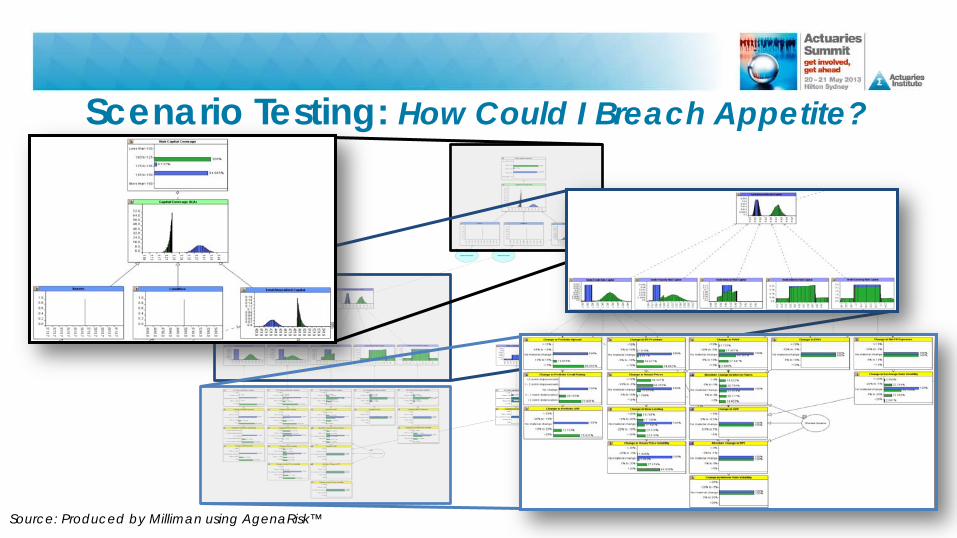
Scenario Testing: How Could I Breach Appetite?
Source: Produced by Milliman using AgenaRisk™
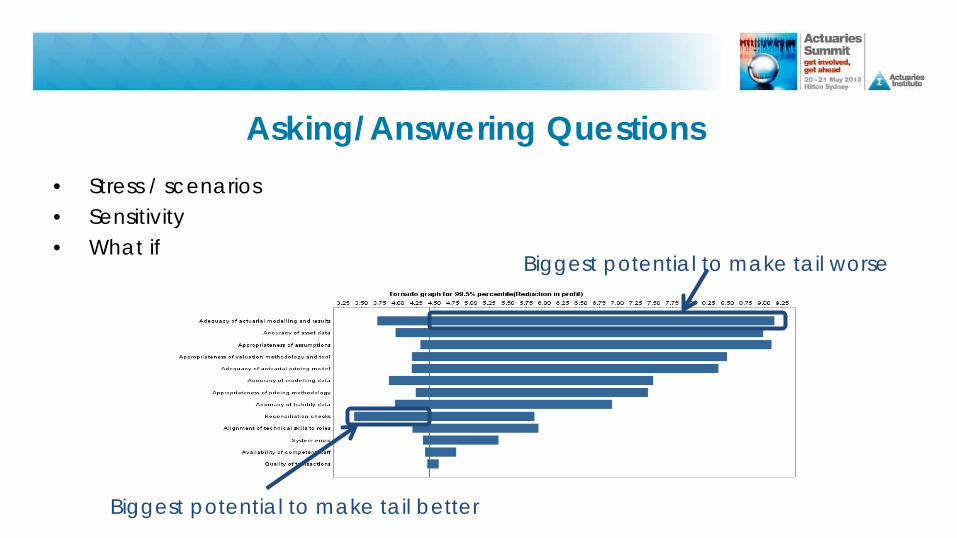
Asking/Answering Questions • Stress / scenarios • Sensitivity • What if
Biggest potential to make tail worse
Biggest potential to make tail better
Professional Developments and Loss Databases ORX is the established global database collector and provider for operational risk for the banking community, and ORIC in the UK for insurance companies. Nothing exists for insurance or wealth management, outside of those entities that are divisions of banks. ORX is designed to meet the needs of banks first. We, the Actuaries Institute RMPC and associated Operational Risk Working Party, is investigating the creation of a LDC service for the Australian wealth management industry serving the operational risk needs of: • Life and General insurers • Superannuation funds • Wealth managers
Regulatory harmonisation?
Call to Action
1. Actuaries to get involved in operational risk
2. Focus on how operational risk frameworks can add value to management decisions focused on:
1. Explanation, not just prediction 2. Profitability and capital 3. Business resilience 4. Trade-offs between these
3. Push the boundaries for the use of new techniques where
appropriate, rather than replicate simple techniques that are lacking Questions / Comments?
![Corrigan Collection Artist Surname or Place of Year of ... · Corrigan Collection Artist Surname or ... Robyn Brady 1989 Corrigan 4/8 ... Donald Gregor Grant commons [Sydney]](https://img.pdfslide.us/doc/110x75/5b1842347f8b9a41258ba6d5/corrigan-collection-artist-surname-or-place-of-year-of-corrigan-collection.jpg)