Embed Size (px)
Citation preview

Tampere University of Technology
Aspects of Critical Communications in Disturbance Scenarios
CitationSäe, J. (2017). Aspects of Critical Communications in Disturbance Scenarios. (Tampere University ofTechnology. Publication; Vol. 1467). Tampere University of Technology.
Year2017
VersionPublisher's PDF (version of record)
Link to publicationTUTCRIS Portal (http://www.tut.fi/tutcris)
Take down policyIf you believe that this document breaches copyright, please contact [email protected], and we will remove access tothe work immediately and investigate your claim.
Download date:18.05.2018

Joonas SäeAspects of Critical Communications in Disturbance Scenarios
Julkaisu 1467 • Publication 1467
Tampere 2017

Tampereen teknillinen yliopisto. Julkaisu 1467 Tampere University of Technology. Publication 1467 Joonas Säe Aspects of Critical Communications in Disturbance Scenarios Thesis for the degree of Doctor of Science in Technology to be presented with due permission for public examination and criticism in Tietotalo Building, Auditorium TB109, at Tampere University of Technology, on the 28th of April 2017, at 12 noon. Tampereen teknillinen yliopisto - Tampere University of Technology Tampere 2017

Supervisor Jukka Lempiäinen, Professor Laboratory of Electronics and Communications Engineering Tampere University of Technology Pre-examiner Jouko Vankka, Professor Department of Military Technology Finnish National Defence University Helsinki, Finland Pre-examiner and opponent Riku Jäntti, Professor Department of Communications and Networking Aalto University Helsinki, Finland Opponent Mario Garcia-Lozano, Professor Department of Signal Processing and Communications Polytechnic University of Catalonia Barcelona, Spain ISBN 978-952-15-3932-9 (printed) ISBN 978-952-15-3933-6 (PDF) ISSN 1459-2045

Abstract
Infrastructures are the foundations of modern societies. The most important onesare the so-called critical infrastructures: mobile networks and electricity networks.
If these networks are damaged or otherwise unavailable, the functionality of the wholesociety is at risk and can result even in public safety hazards. Furthermore, people expectall the time ubiquitous access to internet through mobile networks as many services relyon these wireless networks. The dependence is growing all the time as the number ofworldwide subscriptions has already exceeded the world population and the amount ofinternet of things (IoT) and other connected devices continues to increase exponentially.
This thesis focuses on the critical communications aspects of mobile networks duringdisturbance scenarios. These are defined as situations where, e.g. there is a powerblackout in the electricity network, which affects the functionality of the mobile network.
The contributions of this thesis can be divided into three main themes. The firstone is the actual functionality of mobile networks during disturbance scenarios. Thisincludes finding out how the behavior of subscribers changes when there is an uncommondisturbance scenario in the mobile network and how to prolong the disturbance timefunctionality of the existing networks. The results show that subscribers utilize mobilenetworks more than usual already before the power blackout starts when they try tofind out information about the status of an upcoming storm. Immediately after thedisturbance scenario starts, the subscribers within the blackout area are more activeas the statistics show 73 % increase in the number of new calls and 84 % in the amountof short message service (SMS) messages. The results show also that the majority ofmobile network availability is lost after 3–4 hours from the start of the incident. In orderto prolong this availability time, simulations are performed to find out how utilizingonly a portion of the available base station (BS) sites affects the service coverage. Theresults show that around 20 % of BS sites would be enough to cover 75 % of the originalservice coverage. Therefore, the operational time of the so-called mobile network backupcoverage could be increased several times given that core network (CN) and backhaulnetwork are also operational.
The second main theme in this thesis presents a new developed situation awarenesssystem (SAS) that combines the outage information of both mobile and electricity
i

ABSTRACT
networks. This is an important tool for monitoring the networks and performing disasterand disturbance management. The user interface of the developed SAS is a map viewshowing the outage information, i.e. the faults, in both networks. It utilizes operationaldata from both networks such as the coverage outage areas of the mobile network andthe outages of transformers in the electricity network in near real-time. The developedSAS helps to prioritize maintenance and repair work to the most critical areas as wellas help to form a better overall situation awareness that fire and rescue services andauthorities could utilize for improving public safety actions.
The last main theme in the thesis considers innovative solutions in order to find outmethods to improve the performance, i.e., to mitigate the outage of mobile networks indisturbance scenarios. The three different approaches presented are the indirect guidanceof subscribers, the concept of a temporary low altitude platform (LAP) network with thehelp of drones, and the concept of a macro sensor network (MSN). First, the energy andcapacity aspects of mobile networks can be improved when the subscribers are indirectlyguided to self-optimize their location in the serving cell area. This can result in servingmore user equipment (UEs) within a cell or to decrease the amount of energy needed fortransmissions. Next, the coverage aspects of a LAP system are studied in order to findout the suitability of forming a temporary emergency coverage with a wireless local areanetwork (WLAN) equipped drones. The results show that this kind of approach couldprovide a suitable emergency coverage for a limited area with a reasonable number ofdrones. Finally, a framework for MSN is studied to investigate the possibility of bringingwireless sensor network (WSN) functionalities into mobile networks. The results showthat the concept of MSN could remarkably improve the resilience of mobile networksin situations where the backhaul connection is broken. However, implementing andfurther developing this kind of functionality will require changes in the 3rd GenerationPartnership Project (3GPP) specifications and self-organizing network (SON) featureswithin the network.
Overall, this thesis provides insight on how to develop the current and futuremobile networks toward more resilient infrastructures. It highlights the importance ofcritical communications as a fundamental part of modern societies. Thus, securing thefunctionality and performance of mobile networks in all situations is crucial. As a result,the contributions in this thesis can be utilized as a starting point in the future researchto develop new functionalities for mobile networks. One of such approaches can be asafety mode, which would improve the mobile network resiliency during disasters anddisturbance scenarios.
ii

Preface
This thesis is based on the research work carried out during the years 2013–2016 at theDepartment of Electronics and Communications Engineering, Tampere University
of Technology, Tampere, Finland.First, I gratefully acknowledge all the financial support received for enabling the
research work required for writing this thesis. The majority of the funding was receivedfrom Finnish Funding Agency for Technology and Innovation (Tekes) under a projectcalled “Cooperative planning and monitoring of mobile and electrical networks”. Iam also very pleased for the personal supportive grants from Tuula and Yrjö NeuvoFoundation, and Finnish Foundation for Technology Promotion (TES). I would alsolike to acknowledge doctoral training network in electronics, telecommunications andautomation (DELTA) for financial support in the form of travel funds to conferences.Finally, the supplementary dissertation funding of Tampere University of TechnologyGraduate School in the Doctoral Programme of Computing and Electrical Engineeringsupported me in finalizing this dissertation.
I would like to express my deepest gratitude to my supervisor Prof. Jukka Lempiäinen.It has been a pleasure to work with him and to follow his vision of the research in thefield of wireless communications and especially in the field of radio network planningand optimization. I would also like to thank Prof. Mikko Valkama and Prof. MarkkuRenfors for creating such a good and inspiring atmosphere over the years.
I am grateful to the thesis pre-examiners Prof. Riku Jäntti and Prof. Jouko Vankkafor their valuable time and efforts in the review process. Furthermore, I wish to thankProf. Mario Garcia-Lozano and Prof. Riku Jäntti for agreeing to act as the opponents inthe public examination of my thesis.
I wish to dedicate special thanks to my friendly ex-roommate and one of the co-authors Syed Fahad Yunas. His constructive and encouraging feedback has been trulyinvaluable. I would also like to express my gratitude to my other co-authors DipeshPaudel, Heidi Krohns-Välimäki, Jussi Haapanen and Prof. Pekka Verho for the enjoyablecollaboration. Furthermore, I would like to thank Muhammad Usman Sheikh with whomI have had the pleasure to discuss research related topics and to write publications
iii

PREFACE
outside the topic of this thesis. Special thanks are also required for Hans Ahnlund whohelped me with the simulations.
I have also had the joy of sharing our office with my other roommate ShararehNaghdi with whom I have had a pleasure to discuss work and life in general. I wish tothank also Tero Isotalo, Panu Lähdekorpi, Jussi Turkka, Markus Allén, Jukka Talvitie,Toni Levanen and Ari Asp for first acting as great teachers during my bachelor’s andmaster’s studies and later as colleagues. The work in the department would have beentoo exhausting without relaxing breaks and events with the aforementioned people aswell as with Aki Hakkarainen, Dani Korpi, Janis Werner, Mahmoud Abdelaziz, MatiasTurunen, Mike Koivisto and Simran Singh who have always been there when it comesto coffee, lunch or sauna. Besides the previously mentioned activities, I wish to thankPedro Figueiredo e Silva, Timo Huusari and Jaakko Marttila for accompanying me to thegym or other sports-related activities which have helped me to achieve “a healthy mindin a healthy body”. I would also like to thank everyone else whom I had the pleasure ofmeeting and working in these years. I am grateful also to our helpful secretaries HeliAhlfors, Tuija Grek, Sari Kinnari, Soile Lönnqvist and Päivi Oja-Nisula who have takencare of all the daily practicalities at work.
I would especially like to thank my parents Anja and Juha, my sisters Noora andJenna, as well as my brother-in-law Mikko for encouraging me to push forward and forsupporting me throughout my studies and life in every way. I also want to thank mywife’s parents Elisa and Erkko, her siblings Erkka and Elina, as well as Ene and Sanni.Finally, and most of all, I want to thank my beloved wife Evita for all the love, patienceand care over the years.
Tampere, March 2017Joonas Säe
iv

Table of Contents
Abstract i
Preface iii
List of Publications vii
Abbreviations ix
Symbols and Notations xi
1 Introduction 11.1 Background and motivation . . . . . . . . . . . . . . . . . . . . . . . . . 11.2 Objectives and scope of the thesis . . . . . . . . . . . . . . . . . . . . . . 21.3 Thesis contributions and structure . . . . . . . . . . . . . . . . . . . . . 21.4 Author’s contributions to the publications . . . . . . . . . . . . . . . . . 31.5 Methodology . . . . . . . . . . . . . . . . . . . . . . . . . . . . . . . . . 4
2 Critical Infrastructures 52.1 Disaster and disturbance scenarios . . . . . . . . . . . . . . . . . . . . . 52.2 Mobile networks . . . . . . . . . . . . . . . . . . . . . . . . . . . . . . . 62.3 Electricity networks . . . . . . . . . . . . . . . . . . . . . . . . . . . . . 62.4 Interdependencies between mobile networks and electricity networks . . 7
3 Mobile Networks in Disturbance Scenarios 93.1 Impact of disturbance scenario on mobile network service demand . . . 9
3.1.1 Random service access . . . . . . . . . . . . . . . . . . . . . . . . 103.1.2 Measurement results and analysis from the real network . . . . . 123.1.3 Discussion on subscriber behavior in disturbance scenarios . . . . 14
3.2 Maintaining mobile network coverage availability . . . . . . . . . . . . . 183.2.1 Energy saving concepts in cellular networks . . . . . . . . . . . . 19
v

TABLE OF CONTENTS
3.2.2 Radio network planning . . . . . . . . . . . . . . . . . . . . . . . 213.2.3 Mobile network simulations . . . . . . . . . . . . . . . . . . . . . 243.2.4 Performance results with limited configuration . . . . . . . . . . 263.2.5 Conclusions on maintaining mobile network coverage availability 28
4 Situation Awareness System for Disturbance Management 314.1 Existing situation awareness systems . . . . . . . . . . . . . . . . . . . . 314.2 Situation awareness system implementation . . . . . . . . . . . . . . . . 324.3 Live demonstration - Case in Finland . . . . . . . . . . . . . . . . . . . . 334.4 Situation awareness system conclusions . . . . . . . . . . . . . . . . . . . 35
5 Innovative Approaches for Mitigating Mobile Network Service Outage 375.1 User-guided energy and capacity optimization for mobile networks . . . 37
5.1.1 Energy and capacity efficiency . . . . . . . . . . . . . . . . . . . 385.1.2 Measurement campaign . . . . . . . . . . . . . . . . . . . . . . . 395.1.3 Measurement results . . . . . . . . . . . . . . . . . . . . . . . . . 405.1.4 User-guided energy and capacity optimization conclusions . . . . 41
5.2 Low altitude platforms for disaster scenarios . . . . . . . . . . . . . . . . 425.2.1 Service area simulations . . . . . . . . . . . . . . . . . . . . . . . 425.2.2 Low altitude platform results . . . . . . . . . . . . . . . . . . . . 445.2.3 Low altitude platform conclusions . . . . . . . . . . . . . . . . . 47
5.3 Macro sensor network . . . . . . . . . . . . . . . . . . . . . . . . . . . . 475.3.1 Macro sensor network concept . . . . . . . . . . . . . . . . . . . 475.3.2 Macro sensor network operational framework . . . . . . . . . . . 485.3.3 Macro sensor network conclusions . . . . . . . . . . . . . . . . . 48
6 Conclusions 516.1 Summary . . . . . . . . . . . . . . . . . . . . . . . . . . . . . . . . . . . 516.2 Discussion and further development . . . . . . . . . . . . . . . . . . . . 52
References 55
Publications 63
vi

List of Publications
This thesis is a compound thesis based on the following seven publications.
[P1] J. Säe and J. Lempiäinen, “Mobile Network Service Demand in case of Electric-ity Network Disturbance Situation,” in Proceedings of the 27th InternationalSymposium on Personal, Indoor, and Mobile Radio Communication (PIMRC),Valencia, Spain, September 2016.
[P2] J. Säe and J. Lempiäinen, “Maintaining Mobile Network Coverage Availabilityin Disturbance Scenarios,” in Mobile Information Systems, volume 2016, 10pages, September 2016.
[P3] H. Krohns-Välimäki, J. Säe, J. Haapanen, P. Verho, and J. Lempiäinen, “Improv-ing Disturbance Management with Combined Electricity and Mobile NetworkSituation Awareness System,” in International Review of Electrical Engineering,volume 11, number 5, pages 542–553, October 2016.
[P4] H. Krohns-Välimäki, J. Haapanen, P. Verho, J. Säe, and J. Lempiäinen, “Com-bined electricity and mobile network situation awareness system for disturbancemanagement,” in Proceedings of the IEEE Innovative Smart Grid Technologies -Asia (ISGT ASIA), Bangkok, Thailand, November 2015.
[P5] J. Säe and J. Lempiäinen, “User guided energy and capacity optimization inUMTS mobile networks,” in Proceedings of the 25th International Symposiumon Personal, Indoor, and Mobile Radio Communication (PIMRC), WashingtonD.C., USA, September 2014.
vii

LIST OF PUBLICATIONS
[P6] J. Säe, S. F. Yunas, and J. Lempiäinen, “Coverage aspects of temporary LAPnetwork,” in Proceedings of the 12th Annual Conference on Wireless On-demandNetwork Systems and Services (WONS), Cortina d’Ampezzo, Italy, January2016.
[P7] D. Paudel, J. Säe, and J. Lempiäinen, “Applicability of macro sensor network indisaster scenarios,” in Proceedings of the 4th International Conference on Wire-less Communications, Vehicular Technology, Information Theory and Aerospace& Electronic Systems (VITAE), Aalborg, Denmark, May 2014.
viii
Abbreviations
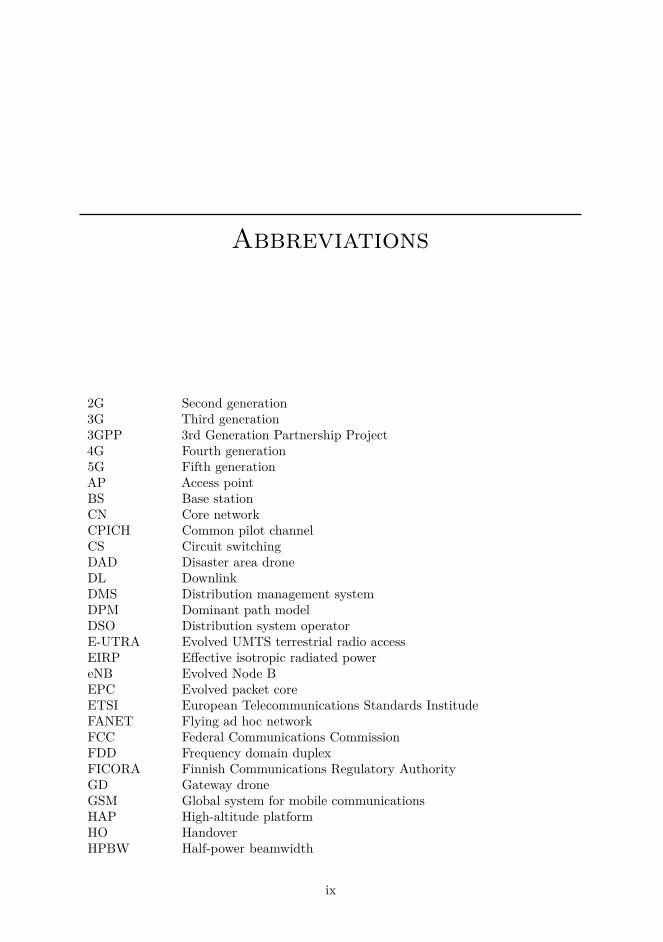
2G Second generation3G Third generation3GPP 3rd Generation Partnership Project4G Fourth generation5G Fifth generationAP Access pointBS Base stationCN Core networkCPICH Common pilot channelCS Circuit switchingDAD Disaster area droneDL DownlinkDMS Distribution management systemDPM Dominant path modelDSO Distribution system operatorE-UTRA Evolved UMTS terrestrial radio accessEIRP Effective isotropic radiated powereNB Evolved Node BEPC Evolved packet coreETSI European Telecommunications Standards InstitudeFANET Flying ad hoc networkFCC Federal Communications CommissionFDD Frequency domain duplexFICORA Finnish Communications Regulatory AuthorityGD Gateway droneGSM Global system for mobile communicationsHAP High-altitude platformHO HandoverHPBW Half-power beamwidth
ix

ABBREVIATIONS
HTTP Hypertext transfer protocolHTTPS Hypertext transfer protocol secureICT Information and communication technologyIDD Inter-drone distanceIEEE Institute of Electrical and Electronics EngineersIoT Internet of thingsISD Inter-site distanceKPI Key performance indicatorLAP Low altitude platformLOS Line-of-sightLTE Long term evolutionMANET Mobile ad hoc networkMEO Medium-Earth OrbitMNO Mobile network operatorMPG Mobile performance gamingMSN Macro sensor networkMySQL Structured query languageNLOS Non-LOSOLOS Obstacle LOSPS Packet switchingQoS Quality of serviceRAB Radio access bearerRAN Radio access networkRSCP Received signal code powerRSRP Reference signal received powerSA Situation awarenessSAS Situation awareness systemSCADA Supervisory control and data acquisitionSDCCH Standalone dedicated control channelSINR Signal-to-interference-and-noise ratioSMS Short message serviceSOAP Simple object access protocolSON Self-organizing networkTRX TransceiverUAV Unmanned aerial vehicleUE User equipmentUL UplinkUMTS Universal mobile telecommunications systemWLAN Wireless local area networkWSN Wireless sensor networkXML Extensible markup language
x

Symbols and Notations
A Frequency dependent parameter for Okumura-Hata modela(·) City size dependent functionB Frequency dependent parameter for Okumura-Hata modelC User-defined parameter for tuning the propagation slopeCm Area correction factord Distance between transmitter and receiverdkm Distance between BS and UE [km]f(·) Interaction loss functionfMHz Frequency [MHz]gt Transmitting antenna gainhBS BS antenna heighthUE UE antenna heighti Interaction indexiDL Average other-to-own cell interferenceK Total number of users per cellk User indexL Path lossL Average path lossl Channel indexm Number of busy channelsN Maximum number of interactionsn Path loss exponentNF Noise figureNrf Noise spectral densitypm Blocking probabilityRk Bit rate of the kth userT Temperaturet Time of arriving callvk Activity factor of the kth user
xi

SYMBOLS AND NOTATIONS
W System chip rate
αk Orthogonality factor of the kth userηDL Downlink load factorλ Wavelengthλr Amount of inter-arrival incidents over timeµ Amount of calls over timeρk SINR of the kth userϕ Propagation direction angleΩ Amount of calls over time
xii

CHAPTER 1
Introduction
All the time ubiquitous mobile networks are the foundation for wireless networksin modern societies. People expect that they can access the internet and other
services from everywhere and at any time. Nowadays, many services such as subscriberservices (phone calls, instant messaging, internet browsing, etc.), resilience infrastructuremaintenance and repair work (mobile networks and electricity networks), and emergencyservices rely on wireless communications access provided by mobile networks. Thus, themajority of services within a society require a working wireless connection.
1.1 Background and motivationThe worldwide amount of mobile connections has already exceeded the population withover 7.4 billion subscriptions [27,38]. Besides connecting people, the internet of things(IoT) will further increase the importance of cellular networks with the emergence ofnew fifth generation (5G) mobile networks within a few year, i.e. already before 2020 asexpected in the industry [4,27,69]. Moreover, it is estimated that currently there areover 400 million IoT devices utilizing only mobile networks and it is forecast that by2022 it will reach already 1.5 billion [27]. Thus, societies rely and continue to dependmore and more on the availability and functionality of these networks.
The reliability of cellular networks has improved greatly during the 21st century, tosome extend as a result of the Tampere Convention on the Provision of TelecommunicationResources for Disaster Mitigation and Relief Operations treaty [49] negotiated andadopted on June 18, 1998 [48], which officially came into force on January 8, 2005 [50].Many countries have improved the resiliency of mobile networks to some extent, but fewcountries in the world have prepared for the worst possible outcome.
Since the majority of modern technologies utilize electricity as their power resource,the functionality of critical services is directly related to the availability of electricity.Without it, e.g. the whole communications network would not work. Thus, the resilienceof mobile networks usually translates to how long it can maintain its functionalitywithout electricity from the main grid by utilizing some other power resources. Theseinclude mostly backup batteries and aggregates or the utilization of renewable energy
1
INTRODUCTION
resources directly at the base station (BS) sites where they are needed (given they aresufficient enough, i.e. they are a suitable option for that particular location).
The main cause of not having electricity from the grid to power other infrastructuresis a power blackout, which can result from a simple hardware failure or in the worstcase some (natural) disaster scenario. Naturally, given a normal utilization of thecommunications networks, the backup energy resources are dimensioned to last somepredefined time period. However, if the cellular network has to rely on backup powerthis usually means that a power blackout has also occurred, and that the behavior ofmobile network subscribers has changed. This translates into more demand for mobilenetwork services, which results in the lack of capacity and shorter time period for thebackup batteries to maintain operation.
This thesis focuses on the problems that occur with disturbance scenarios in mobilenetworks. How do subscribers change their mobile network service behavior duringdisturbances? How to prolong the operational time of mobile network services duringa disturbance scenario? How to improve disturbance management and the overallsituation awareness? What kind of innovative methods could be utilized for criticalcommunications in order to mitigate mobile network service outages?
1.2 Objectives and scope of the thesisThe main objective of the thesis is to investigate innovative methods to improve theperformance and restoration of mobile networks in case of disturbance scenarios. Thisincludes studying the effects of disturbance situations in mobile networks and theireffect on the mobile network subscriber behavior, new methods to monitor the networkfunctionality in order to improve the overall disaster management, and finding outdifferent innovative approaches to improve the performance (i.e. to mitigate serviceoutage) of mobile networks.
1.3 Thesis contributions and structureIn short, the main contributions of the thesis are the following.
• Providing information on the current mobile network subscriber behavior duringdisturbance scenarios by analyzing operative cellular network service demandcaused by a power blackout in the electricity network [P1].
• Prolonging the “disturbance time availability” of mobile networks by utilizing onlya portion of BS sites within a disturbance area during a power blackout [P2].
• Improving disaster management by developing and studying a combined situationawareness (SA) system for mobile and electricity networks [P3–P4].
• Proposal and analysis of indirectly optimizing mobile network energy and capacityusage with the help of mobile network subscribers [P5].
• Analyzing the coverage possibilities of a temporary low altitude platform (LAP)system deployed into a disaster area with the help of a wireless local area network(WLAN) equipped drones connected to a cellular network [P6].
2

1.4 Author’s contributions to the publications
• Investigating the applicability of a wireless sensor network (WSN) functionalitiesfor cellular networks in disaster scenarios [P7].
Publications [P1–P7] provide more details and examples compared with what is discussedin this thesis summary. In order to provide a fluent reading experience, the notation ofthe thesis and the visual appearance of some figures differs slightly from the associatedpublications.
The thesis is organized into three different main parts. The first part includes Chap-ters 2 and 3. Chapter 2 provides insight into the background of critical infrastructures,whereas Chapter 3 presents the contributions of the thesis on how mobile networksubscribers behave during a disturbance scenario and how to prolong the disturbancetime availability of the networks. The second part discusses in detail the developedSA system in Chapter 4. The last part in Chapter 5 presents innovative approaches toimprove the performance of mobile networks especially during disturbance and disasterscenarios. Finally, Chapter 6 concludes the thesis.
1.4 Author’s contributions to the publicationsThe base for this thesis topic was formed in the context of a Tekes-funded projectcalled “Joint planning and monitoring for mobile communication and electrical networks”(referred to as “TELE4SG” later on). This project inspired the author and Prof. JukkaLempiäinen to device the actual topic together regarding the aspects of mobile networksas a critical infrastructure.
In general, Prof. Jukka Lempiäinen has contributed to all publications [P1–P7]by mainly initiating a discussion about a possible idea for a publication, providingsupport with discussions during the research phase, and giving feedback for the writtenmanuscripts. The final topics of the publications were mainly finalized by the author,except for publications [P3–P4], which were formed together with M.Sc. Heidi Krohns-Välimäki and publication [P7], which was formed together with M.Sc. Dipesh Paudel.
The author is the main contributor to the majority of the publications [P1–P2,P5–P6]. In [P1–P2], the author performed all the simulations, analysis, and manuscriptwriting leading to publications. In [P5], Prof. Jukka Lempiäinen performed the requiredmeasurements and initiated the writing process, but the author did all of the analysisand the majority of the actual manuscript preparation. Likewise, the simulations in[P6] were performed by D.Sc. Syed Fahad Yunas, but all of the writing process andsimulations scenarios planning with the analysis of the obtained results were preparedby the author.
Publications [P3–P4] were written in cooperation with M.Sc. Heidi Krohns-Välimäkias the first author, with co-authors M.Sc. Jussi Haapanen and Prof. Pekka Verho fromthe Department of Electrical Engineering in Tampere University of Technology. Thetopics for these publications came from the TELE4SG project, where the author was themain researcher for wireless communication field and H. Krohns-Välimäki, J. Haapanenand P. Verho were responsible for the topics related to electrical engineering. In practice,the author contributed to these publications by refining the ideas for the manuscripts,writing the parts of the publications related to wireless communications, performingthe required simulations from the wireless communications part of the manuscripts,
3

INTRODUCTION
suggesting and applying changes to the manuscripts, and finalizing the papers. Prof.Pekka Verho provided similar support for these publications as Prof. Jukka Lempiäinenand J. Haapanen programmed the SA system. H. Krohns-Välimäki presented the workof [P4] in Bangkok, Thailand in 2015.
M.Sc. Dipesh Paudel is the first author of the last publication [P7]. The authorof the thesis served as the supervisor and examiner for D. Paudel and gave him thetopic initially for his master of science thesis. The author helped D. Paudel with thecalculations, the writing process and the forming of the operational framework for themanuscript. The author also participated in the writing process and finalized the paper.D. Paudel and the author presented the work of [P7] in Aalborg, Denmark in 2014.
1.5 MethodologyThis thesis utilizes several different methodologies, or more precisely methods, in orderto study the topic of this thesis. Understanding the merits and limitations of thesechosen methods help to evaluate the accuracy of the results and possible sources of error.The utilized methods in different publications are shortly described in the following.
Empirical methods (measurements) are utilized in [P1, P5]. Measurements providedata, which can be analyzed and utilized to draw a conclusion from the measuredproperties. Thus, existing measurable phenomena can be modeled with the help ofempirical methods. Possible errors can occur e.g. due to errors in the accuracy of themeasurements. As a result, the grade of possible errors should always be taken intoaccount.
The situation awareness system (SAS) developed in [P3–P4] follows the proof ofconcept methodology. In other words, this methodology is a realization of a prototypeand the target is to determine its feasibility. This method can present and verify thatthe suggested idea functions in real life. The limitations of this methodology are relatedin taking account all possible situations available. Therefore, the feasibility of, e.g., atested system depends on how thoroughly the new system has been tested.
Computer simulations are the approach utilized in [P2, P6]. Simulations offer arelatively inexpensive way to test real-world processes with the help of models. Thus,e.g. the suitability of (expensive) complex systems are easier to implement and test.The drawbacks of utilizing simulation methods are the limitations related to models andaccuracy. As such, the results are only as accurate as the models are and how well thosemodels can match real-world characteristics.
The last utilized methodology is a type of constructive framework, an algorithm, in[P7]. It provides a logical array of connected elements as a self-contained sequence ofoperations to be performed. Like in (computer) simulations, the accuracy of algorithmsor the actions they perform are limited to the elements included in the algorithm. Thus,all possible states and their interconnections in the algorithm should be defined preciselyfor it to function without any errors. As a result, the outcome of an algorithm iswell-known.
4

CHAPTER 2
Critical Infrastructures
Societies depend heavily on infrastructures; the technical structures or the under-lying framework that provides the foundation for a working nation. The design,
construction and maintenance of infrastructures are usually categorized as tasks in civilengineering and moreover in municipal engineering. They are in charge e.g. of streets,sidewalks, bridges, water supply and sewer networks, and street lighting.
Modern societies, i.e. the majority of current societies, rely specifically on the socalled critical infrastructures. These are the most important infrastructures, known aslevel 1 infrastructures [60]:
• information and communication technology (ICT): mobile networks;• electricity generation, transmission and distribution: electricity networks;• water supply.
Thus, in order to maintain the functionalities of current societies, it is very importantfor any nation to secure the operation of these fields in all situations. This chapterintroduces first disaster and disturbance scenarios and then shortly two of the mostimportant critical infrastructures: mobile networks and electricity networks and theinterdependencies existing between them.
2.1 Disaster and disturbance scenariosDisaster scenarios usually occur without any warning. The cause of these incidentscan be earthquakes, tsunamis, hurricanes or other (natural) weather-based storms orman-made disasters, such as accidents, cyber-attacks or sabotage. The effects can bedevastating and prevent the normal utilization of the networks.
In recent years, there have been many cases of large disasters scenarios around theEarth. For example, a powerful earthquake struck off the Pacific coast of Tohoku, 400 kmnortheast of Tokyo, Japan, in March 2011. This caused a tsunami that damaged theinfrastructure very seriously [8]. Another large example occurred in the United Statesof America when Hurricane Sandy caused widespread disaster scenarios in the EastCoast from Florida to Maine in October 2012 [30]. The devastating earthquake that
5

CRITICAL INFRASTRUCTURES
struck Nepal in April 2015 [37] also destroyed a large part of the existing infrastructure.These examples show that even modern societies are very vulnerable to extreme weatherconditions and solutions to improve the resilience of the infrastructures have to bedeveloped.
A milder version of a disaster scenario is a situation, where the functionality of thenetwork is partly limited but not directly and immediately life-threatening. Disturbancescenarios can be considered to be e.g. electricity network blackouts from the mobilenetwork point-of-view. These power blackouts are usually caused by strong weatherphenomena, like storms and strong winds, which cut down trees that will break powerlines. This will eventually stop the functionality of mobile networks and the wholesociety is at risk to be halted, which can eventually result in a public safety hazard.
2.2 Mobile networksThe current mobile networks, i.e. the widely existing second generation (2G), thirdgeneration (3G) and fourth generation (4G) networks, or ICT in general, are one ofthe key parts of societies. The societies depend more and more on mobile networks aseverything starts to be connected to the internet and this dependence has grown fast inthe past few decades especially with the remarkable growth in the number of connecteddevices like (smart) phones, tablets, and IoT equipment.
In fact, there are already regulations on how to prepare for disturbance scenariosand power blackouts. For example, Finnish Communications Regulatory Authority(FICORA) has instructed that cellular network BS sites in Finland must have backuppower for at least two to four hours. This depends on the type and environment ofthe BS site, i.e. whether the equipment are located inside a private property in anurban area or a mast in a rural area [31]. This regulation should guarantee that mobilenetworks continue to operate at least few hours after a power blackout, but again itdepends on the condition of the backup batteries or other reserve power at the BS sitesand the service demand as high load translates to higher power consumption [62].
Mobile networks consist of a core network (CN), a backhaul network and BS sites.Mobile networks in this thesis concern mainly the BS sites and the actual service coveragethey provide. Usually, mobile network operators (MNOs) have their own infrastructuresalthough the majority of BS site locations and masts are shared among different operators.This thesis concentrates on providing service from only one MNO infrastructure in thestudies.
2.3 Electricity networksElectricity networks are also categorized as level 1 critical infrastructures. The reason forthis is quite obvious: the majority of modern society’s functionalities require electricity.Electrical networks consist of electricity generation, transmission and distribution. Thisthesis limits electricity networks to the distribution network: the network that deliverselectric power to the end users. This is because the majority of the faults that end usersexperience occur at this part of the network.
6

2.4 Interdependencies between mobile networks and electricity networks
Distribution system operators (DSOs) are roughly the electricity network equivalentsof MNOs. They operate the electricity network distribution with the help of a distributionmanagement system (DMS) and supervisory control and data acquisition (SCADA)control system. DMS is utilized to monitor and control the distribution network withSCADA, which provides means to remotely access a variety of control modules locatede.g. in electricity network substations and transformers.
2.4 Interdependencies between mobile networks andelectricity networks
Mobile networks, like any other electronic devices, require electricity in order to work.Thus, the operation of mobile networks depends heavily on electricity networks althoughreserve power resources and alternative sources of electricity like solar panels and windturbines provide some alternative possibilities.
The operation of electricity networks would not first seem to depend on the availabilityof mobile network services. However, modern electricity networks begin to have moreintelligence with them in a concept known as the smart grid. This means that theconventional operation of just distributing electricity from one place to another haschanged so that electricity distribution can be guided in several directions, whereever it is needed. Besides this advanced delivery, smart grids have e.g. advancedmetering and monitoring and is more closely dependent on different communicationtechnologies [14]. For example, the so-called remote-controlled switches have beeninstalled in the distribution networks in order to improve the restoration process. Theseremote-controlled switches utilize mobile networks for the communication part and ifmobile networks stop working the repair teams need to be dispatched to close themmanually, which will slow down the restoration process. In fact, remote-controlledswitches can improve the reestablishment time with several hours [12,23].
Nowadays, many parts of electricity networks utilize mobile networks as a mean toestablish a connection to SCADA and DMS. The most critical connections are backedup with satellite connections, but e.g. connections from the remote-controlled switchesin transformers utilize mostly mobile networks for the communication. Furthermore, notso critical, but still important part is the remote automatic meter reading meters, whichsend information about the electricity usage from the end customers to DSOs.
One more interdependence between these critical networks is the availability of mobilenetworks in the restoration process, i.e. after a disturbance has occurred. The repairteams need communication access to receive instructions, mostly by utilizing smartphones, tablets or laptops, on how to proceed with the situation. The teams need tochange location without this information, i.e. drive to another area, in order to regain theconnection. Thus, a lot of time is wasted without a connection. This further highlightsthe importance of backup power at the BS sites and the overall functionality of mobilenetworks during a disturbance scenario.
The authors in [45] have evaluated the interdependencies between mobile communi-cation and electricity distribution networks in fault scenarios. They list also ensuringpower supply to base stations as one of the most important solutions to improve theresiliency of both mobile and electricity networks.
7

CHAPTER 3
Mobile Networks in DisturbanceScenarios
This chapter is the first main part of the thesis and is based on the results providedin publications [P1–P2]. It focuses on the subscriber behavior and the functionality
of mobile networks during disturbance scenarios. First, data from an actual operativenetwork is analyzed [P1] to express how an up-to-date modern cellular network functionsduring a disturbance situation and what kind of impact it has on the behavior ofsubscribers. This chapter also analyzes how to maintain the cellular network disturbancetime functionality, i.e. how long the network could function without electricity from thepower grid by utilizing the existing, limited reserve power [P2].
3.1 Impact of disturbance scenario on mobile net-work service demand
Mobile network traffic follows a certain routine day after day. This includes normally:some high service demand hours, the so-called busy hours, that occur usually duringlunch time or after work hours when people make calls to their friends and families;other mediocre network usage time periods during the day; and a very low networkusage time period during the night. This daily routine repeats day after day and has aspecific profile which can be noticed from the statistics for each of the evolved Node B(eNB) cell. The profiles for working days, i.e. from Monday to Friday, are very similarwith each other, but the profiles are clearly different for the weekends.
These mobile network traffic profiles also tend to repeat similarly week after week.Moreover, the change of the season can be observed from the (weekly) traffic profiles,e.g. from spring to summer as people have summer vacations that break the normalroutine. Major changes or uncommon events can also be noticed from the statistics. Forexample, a large gathering of people is visible in the statistics with increased traffic andblocking rates as the mobile network capacity is not dimensioned for such events. Thesecan include, among others, music concerts, sports events or festivals that gather massive
9

MOBILE NETWORKS IN DISTURBANCE SCENARIOS
amounts of people. Thus, the network at these locations can not meet the demandrequirements set by the temporarily increased number of subscribers. This results in thelack of service for the portion of the demand that exceeds the planned service capacityfor that specific geographical area. However, usually information for these kind of eventsis available in advance. Therefor, mobile operators can set up temporary extra capacitywith transferable BS trailers for these areas in order to increase the capacity to meetthe expected service demand increase.
This is not the same for sudden, unexpected disturbances in the network or majordisaster scenarios. These can include, among others, storms that eventually cause poweroutages. This relates back to mobile network BSs since their operation depends on theavailability of electricity. Should a power blackout occur, the continuity of the cellularnetwork service depends on the availability of reserve power, which in turn dependsusually on national regulation and the preparedness of mobile operators. However,even reserve power does not guarantee the availability of mobile network services indisturbance areas. This is because the service demand usually changes as the subscriberbehavior changes, which can result in the cellular network not being able to handle allthe (increased) traffic, i.e. the capacity is not planned to cope with the extra trafficcaused by the disturbance or disaster scenarios. It should be noted that the behaviorof the subscribers can be dissimilar in different environments, i.e. the subscribers inrural areas might be more used to or prepared for power blackouts than users in urbanor suburban areas. The cause of the disaster scenario also affects the behavior of thesubscribers as large natural disasters will result in more panic among the citizen thanan uncommon blackout, e.g. in the electricity network.
3.1.1 Random service accessThe capacity dimensioning of cellular networks is based on the potential number ofsubscribers and the expected network resource utilization. This includes e.g. how oftensubscribers utilize services of a different kind and how much these services requirecapacity. In general, the target is to offer reasonable capacity to subscribers and stillconsider the overall costs. This way mobile operators can secure cost-efficient networkoperation.
The available mobile network capacity depends heavily on the subscriber behavior(e.g. data usage) and the offered services. In modern societies, subscribers are assumedto have freedom such that they may move around and utilize services independentlyand access the network anywhere and at any time. This kind of behavior is based onPoisson distribution, which can be utilized e.g. for traditional speech users. In a Poissondistribution, users have a random length of a call and follow the negative exponentialcurve [53], [13], i.e. the probability density function is defined as
p(t) = µe−µt, (3.1)
where t denotes the time of the arriving call and µ is the amount of calls over time, i.e.1/µ is the average call duration. In addition to the random length of a call, subscribershave random time between the calls, also following the negative exponential curve. Theprobability density function is likewise defined as
10
3.1 Impact of disturbance scenario on mobile network service demand
p(t) = λre−λrt, (3.2)
where λr is the amount of inter-arrival incidents over time, or 1/λr is the average inter-arrival time. When both the length of the calls and the arrival time of the calls arerandom, the most interesting value is the probability of a user not being able to make acall. Thus, the well-known Erlang-B formula (without queuing) [13] defines the blockingprobability pm as
pm =
(λrµ
)m/m!
m∑l=0
(λr
µ
)l/l!, (3.3)
where m is the number of busy channels and l is the channel index. Thus, with thehelp of (3.3) the (speech) traffic capacity can be defined for a know configuration with apredefined blocking probability target.
In [53], a comparison between operative network and equation 3.3 is shown for atraditional one transceiver (TRX) BS having 7 traffic channels (1 channel reservedfor signaling, 8 channels in total) in global system for mobile communications (GSM).Equation 3.3 results in 2.0 Erl capacity with 0.3 % blocking probability and measurementsfrom the real network give 2.0 Erl traffic and 0.4 % blocking probability, i.e. practicalvalues follow the theoretical calculations quite well. The theoretical maximum capacity(7 traffic channels, without blocking) would be 7 Erl if callers are not able to access thenetwork randomly and no gaps exist between calls. Thus, 4.5 Erl of capacity is missedin order to have freedom for users to make calls randomly and with random call lengths,and simultaneously to keep the blocking at the level of 1 %.
Erlang-B formula is a good way to approximate the normal capacity need in thenetwork. However, when a sudden change, like a disturbance scenario, occurs thebehavior of subscribers most likely changes. Usually, this means that the randomness ofusers accessing the network changes as well. During such events, it is more probable thatarriving calls start to correlate, i.e. subscribers are more likely to access the networksimultaneously and usually in batches. In queuing theory, this can be modeled with the socalled batch arrivals model [13]. When comparing this ideology with the Erlang-B model,the capacity need will be greatly higher for batch arrivals model. Thus, if the mobilenetwork capacity demand would be dimensioned based on this model, the operationof the networks would be far of from being cost-efficient as disturbance occasions arerelatively rare in the networks. As a result, MNOs are not planning their networks withthe help of the batch arrivals model. A more suitable option would be to try to influenceand control how mobile network subscribers will behave during disturbance scenarios.
In order to increase the available capacity in disturbance or disaster scenarios, therandomness of call lengths and times could be temporarily disabled and specific timeslots could be reserved for different users in the disturbance area. The randomnessof call lengths is easy to control by forcing the ongoing calls to disconnect at desiredcall length, but the randomness of accessing the network will require strong guidelinesfor the subscribers. These could be sent beforehand to the subscribers and as a textmessage with short message service (SMS) at the beginning, or in some cases even
11

MOBILE NETWORKS IN DISTURBANCE SCENARIOS
before a possible disturbance scenario, to notify the users that the network is not ableto handle normal operations at that moment and that call durations are e.g. fixedto a certain maximum duration with a predefined time slot. For example, in 1 TRXGSM case, capacity could be increased from 2.5 Erl theoretically up to 7 Erl (with0 % blocking) meaning a notable capacity increase in this very limited configuration.The same 7 Erl capacity would be achieved with 24.9 % blocking if the randomness ofaccessing the network and the call length would remain the same as in normal scenarios.The emergency calls should be prioritized so that they will get through in all situations,but for the not-so-time-critical-calls this method should provide some fairness amongthe subscribers, e.g. subscribers can not reserve the channels for themselves for too long.
3.1.2 Measurement results and analysis from the real networkDescription of the power blackout area
The analysis in publication [P1] was performed to a certain area in Finland with thestatistics of one MNO. The geographical area was roughly 1500 km2 with a populationaround 7000 people, in which the MNO had roughly 39 % market share. The GSMnetwork of the MNO had a total number of 19 BS sites having 58 cells and correspondinglythe total number of universal mobile telecommunications system (UMTS) sites was 14with 62 cells. The raw data of the GSM and UMTS network consisted of key performanceindicator (KPI) statistics. This data was gathered before, during and after a powerblackout that lasted for several hours. As a result, the backup power ran out from mostof the BS sites. The power blackout started at 15.30 on Thursday, when roughly halfof the regional electricity network of the studied area went down, and at 15.55 already87 % of the area was missing electricity as seen from Fig. 3.1. The effects of the blackoutstarted to decrease after this as repair teams progressed in reconnecting the outageareas back online and around 1.00 in the next day, i.e. after nine and a half hours50 % of the area had been reconnected to the electricity network. It then took 11 hoursmore to reach 90 % availability in the electricity network around 12.00 on Friday. Thelast remaining 10 % of the outage areas still took around 12 hours to fully restore theelectricity network.
Besides electricity, also the outage of GSM and UMTS mobile network technologiesare shown in Fig. 3.1. The shape follows that of the electricity network version asexpected. One of the GSM mobile network BS sites did not manage to reboot itselfautomatically, thus a zero percentage outage for GSM network was not achieved eventhough electricity was restored. The time resolution for the electricity network data isfive minutes, and one hour for mobile network data, correspondingly. Furthermore, inFig. 3.1 the mobile network outage seems to start before the electrical network blackout,but this is indeed because of the time resolution and the way the performance data iscollected and stored. Events in the mobile network, that have occurred e.g. between15.00 and 15.59, are shown in the data at 15.00.
Mobile network outage analysis
Fig. 3.2 and Fig. 3.3 show the GSM and UMTS mobile network statistics before, duringand after the blackout in the electrical network. The green, orange, and blue bars show
12

3.1 Impact of disturbance scenario on mobile network service demand
Day of the week / time [ddd HH:MM]
Th
u 1
2:0
0
Th
u 1
5:0
0
Th
u 1
8:0
0
Th
u 2
1:0
0
Fri
00
:00
Fri
03
:00
Fri
06
:00
Fri
09
:00
Fri
12
:00
Fri
15
:00
Fri
18
:00
Fri
21
:00
Sa
t 0
0:0
0
Ou
tag
e [%
]
0
10
20
30
40
50
60
70
80
90
100
Electricity network
GSM network
UMTS network
Figure 3.1: Outage percentage for both electricity and mobile networks. The time resolutionis 5 min for the electricity network and 1 h for mobile networks. The date / time format is ’ddd’refering to the first three letters of a day and ’HH:MM’ for a time presentation with two digitsfor both hours and minutes.
KPIs for Wednesday, Thursday, and Friday, respectively. The solid, dashed, and dottedlines present the availability of the electricity network for Wednesday, Thursday, andFriday. A numerical summary of the data is given in Table 3.1 after the figures.
Fig. 3.2a shows the number of new calls. Normally, the KPI profile for each weekdayis similar, but when the availability of the network drops at 15.00 on Thursday, thereis a spike in the number of new calls. The increased amount of new calls continues forthe whole Thursday evening, which indicates that the power blackout has activatedsubscribers to call more than usually. The same effect is visible in Fig. 3.2b; the numberof new standalone dedicated control channel (SDCCH) seizures in uplink (UL) peakswhen the electricity blackout began. This effect is also visible during the night betweenThursday and Friday, i.e. in the early hours of Friday, most likely due to networkmaintenance workers. It should be noted that besides call setups SDCCH also includeslocation updates and SMS messages. The actual call traffic has increased when comparedwith the profile on Wednesday in Fig. 3.2c. Table 3.1 shows that the call traffic hasincreased from a total of 376 Erl to 471 Erl (from Wednesday to Thursday), resulting ina total traffic increase of 25 %. Finally, the packet switching (PS) data traffic allocatedto GSM in Fig. 3.2d seems higher than the reference day (Wednesday), but this is partlybecause the availability of UMTS network had decreased, which results in part of thedata traffic falling to GSM network. Overall, the KPIs values in GSM network have anoticeable change caused by the electrical network blackout.
13

MOBILE NETWORKS IN DISTURBANCE SCENARIOS
Correspondingly, Fig. 3.3 shows the situation in UMTS network statistics. First,in Fig. 3.3a, the amount of circuit switching (CS) traffic is shown in Erlangs. Thisamount is slightly higher before and right at the time when the power blackout begins.The amount of CS traffic is reduced after this as the availability of the UMTS networkdegrades, however, the reduction is caused by the lack of service availability, not fromthe reduced CS traffic behavior, since the CS traffic increases notably as the availabilityincreases. In Fig. 3.3b, the amount of downlink (DL) data is shown; a similar effectas in CS traffic is noticeable, i.e. the availability is reducing the amounts of data. Onthe other hand, the traffic amounts are greatly higher before the power blackout starts,most likely due to subscribers trying to search for information about the storm thateventually caused the electricity outage. Fig. 3.3c shows the number of SMS messages inUMTS network. The power blackout causes a clear spike in the chart and the amount ofSMS messages in the entire Thursday evening is clearly higher than in the reference day.Finally, in Fig. 3.3d, the number of radio access bearers (RABs) has a very noticeablespike at the time when the power blackout started. RAB is used for information transferbetween a user equipment (UE) and the CN.
3.1.3 Discussion on subscriber behavior in disturbance scenar-ios
The observed results presented in the previous Section 3.1.2 show how the mobile networksubscribers behave in the case of a small and uncommon disturbance scenario in theform of an electricity network blackout in rural area. The statistics from the GSMand UMTS networks show how the subscriber mobile network service behavior changeswhen a disturbance scenario occurs. This behavior can already be noticed before theactual disturbance began from the amount of DL data, as subscribers e.g. try to findinformation related to the possible upcoming storm. When the disturbance (i.e. thepower blackout in this case) had finally occurred, especially the call traffic and theamount of SMS messages had a noticeable spike in the network statistics. These include73 % increase in the number of new calls and an increase of 84 % in the number ofSMS messages compared with the reference day (Wednesday) at the time when thedisturbance situation started. This increased service demand trend continued throughthe majority of the power blackout, i.e. the subscribers continued to utilize the networkmore than usual despite the lack of mobile network availability. In addition, the resultsshow that the largest mobile network outage occurred after 3–4 hours from the beginningof the outage, thus meeting the requirements set by FICORA although some BS sitesrun out of energy already before this.
In order to cope with the lack of mobile network services caused by the outages in theelectrical network, some possible solutions can be considered. One of these suggestions ispartially restricting the ubiquitous cellular network experience, i.e. instead of using thenetwork all the time and everywhere, some limitations for the services might be beneficialfrom the overall network functionality and also from the subscriber point of view. Theselimitations should not, however, prevent the real need in the case of life-threateningemergencies, but instead help to prevent the cellular network (service) congestion. Afairly simple solution would include guidelines, i.e. common rules, which would statethat if a power blackout should occur, the subscribers should avoid making unnecessary
14

3.1 Impact of disturbance scenario on mobile network service demand
Time [HH:MM]
00:00 03:00 06:00 09:00 12:00 15:00 18:00 21:00 00:00
New
ca
lls
[pcs
]
0
225
450
675
900
Av
ail
ab
ilit
y [
%]
0
25
50
75
100
Wednesday
Thursday
Friday
Availability (Wed)
Availability (Thu)
Availability (Fri)
(a) The number of new calls.
Time [HH:MM]
00:00 03:00 06:00 09:00 12:00 15:00 18:00 21:00 00:00
SD
CC
H s
eizu
re a
ttem
pts
[p
cs]
0
750
1500
2250
3000
Av
ail
ab
ilit
y [
%]
0
25
50
75
100
Wednesday
Thursday
Friday
Availability (Wed)
Availability (Thu)
Availability (Fri)
(b) The number of new SDCCH seizures.
Time [HH:MM]
00:00 03:00 06:00 09:00 12:00 15:00 18:00 21:00 00:00
Ca
ll t
raff
ic [
Erl
]
0
10
20
30
40
Av
ail
ab
ilit
y [
%]
0
25
50
75
100
Wednesday
Thursday
Friday
Availability (Wed)
Availability (Thu)
Availability (Fri)
(c) The amount of call traffic.
Time [HH:MM]
00:00 03:00 06:00 09:00 12:00 15:00 18:00 21:00 00:00
PS
tra
ffic
[E
rl]
0
7.5
15
22.5
30
Av
ail
ab
ilit
y [
%]
0
25
50
75
100
Wednesday
Thursday
Friday
Availability (Wed)
Availability (Thu)
Availability (Fri)
(d) The amount of PS traffic.
Figure 3.2: GSM network statistics from the electricity blackout. The bars present the KPIvalues and the lines the availability of electricity network. The time format is ’HH:MM’ for atime presentation with two digits for both the hours and minutes.
15

MOBILE NETWORKS IN DISTURBANCE SCENARIOS
Time [HH:MM]
00:00 03:00 06:00 09:00 12:00 15:00 18:00 21:00 00:00
CS
tra
ffic
[E
rl]
0
12.5
25
37.5
50
Av
ail
ab
ilit
y [
%]
0
25
50
75
100
Wednesday
Thursday
Friday
Availability (Wed)
Availability (Thu)
Availability (Fri)
(a) The amount of CS traffic.
Time [HH:MM]
00:00 03:00 06:00 09:00 12:00 15:00 18:00 21:00 00:00
DL
da
ta [
Gb
it]
0
75
150
225
300
Av
ail
ab
ilit
y [
%]
0
25
50
75
100
Wednesday
Thursday
Friday
Availability (Wed)
Availability (Thu)
Availability (Fri)
(b) The amount of DL data.
Time [HH:MM]
00:00 03:00 06:00 09:00 12:00 15:00 18:00 21:00 00:00
SM
S [
pcs
]
0
100
200
300
400
Av
ail
ab
ilit
y [
%]
0
25
50
75
100
Wednesday
Thursday
Friday
Availability (Wed)
Availability (Thu)
Availability (Fri)
(c) The number of SMS.
Time [HH:MM]
00:00 03:00 06:00 09:00 12:00 15:00 18:00 21:00 00:00
RA
B a
ttem
pts
, v
oic
e [p
cs]
0
500
1000
1500
2000
Av
ail
ab
ilit
y [
%]
0
25
50
75
100
Wednesday
Thursday
Friday
Availability (Wed)
Availability (Thu)
Availability (Fri)
(d) The number of RAB attempts for voice calls.
Figure 3.3: UMTS network statistics from the electricity blackout. The bars present the KPIvalues and the lines the availability of electricity network. The time format is ’HH:MM’ for atime presentation with two digits for both the hours and minutes.
16

3.1 Impact of disturbance scenario on mobile network service demand
Tab
le3.
1:GSM
andUMTSne
tworkstatist
icsbe
fore,d
uringan
daftertheelectricity
blackout.The
meanan
dmed
ianvalues
presentthe
values
foron
eho
ur.
Key
perf
orm
ance
indi
cato
rW
edne
sday
Thu
rsda
yFr
iday
tota
lm
ean
med
ian
std
tota
lm
ean
med
ian
std
tota
lm
ean
med
ian
std
2G
The
numbe
rof
new
calls
[pcs]
5787
241
274
199
7652
319
415
254
6794
283
301
228
The
numbe
rof
new
SDCCH
seizures
[pcs]
2510
310
4610
7445
029
890
1245
1380
566
3213
913
3914
0839
6Callt
raffic[Erl]
376
1621
1247
120
2615
434
1822
13PStraffi
c[Erl]
319
1315
535
815
166
342
1415
4
3G
CStraffi
c[Erl]
536
2230
1651
121
2317
543
2329
16The
amou
ntof
DLda
ta[G
bit]
3958
165
200
8437
1415
516
172
3429
143
164
70The
numbe
rof
SMS[pcs]
2577
107
106
6629
5212
313
682
2498
104
9255
The
numbe
rof
RAB
attempts[pcs]
1108
846
248
237
212
012
501
548
420
1218
850
853
539
4
17

MOBILE NETWORKS IN DISTURBANCE SCENARIOS
calls and reduce the mobile network utilization in general. This solution, however, is noteasy to control since it is only a guideline. Nevertheless, instructions and guidance inadvance would increase the probability of unnecessary cellular network utilization. Whenthe capacity requirement could be lowered, some of the cellular network technologiescould be shut down immediately to spare more backup energy.
A more complex solution to increase the (speech) capacity during disturbancesituations would be to restrict the randomness of the call lengths and the randomnessof the subscribers to access the network by allowing only a certain set of subscriberswithin the area to access the network. If applied to the configuration of the examplenetwork analysis, an increase from 410 Erl (Erlang-B (3.3), 1 % blocking) to 435 Erlwould be theoretically possible although in practice this would be somewhere betweenthe normal and the theoretical value. This would need efficient algorithms to allocatemobile network subscribers to specific time slots to access the network beforehand andto restrict the customers to access the network outside this time slot. Emergency callsshould always be prioritized in these situations.
It should be noted that the results in this study are based on one disturbance scenarioand the reference day for the analysis is also from only one day, thus the generalizationof these results would require several other study cases. Nevertheless, this study offersdata from an operational mobile network operator, and shows how subscribers utilizethe network during an uncommon power blackout situation.
3.2 Maintaining mobile network coverage availabilityDisturbance and especially disaster scenarios can happen without a warning. Whetherthey are disasters caused by human, such as accidents or sabotages, or natural weather-based storms, the effects can be destructive, which can prevent the normal utilizationof mobile networks. Typically, the major causes of blackouts in electrical grids arestorms [77]. Furthermore, they affect commercial mobile networks and public services,thus yielding service and communication outages. Eventually, this can prevent emergencyhelp requests in these areas. In addition, rescue and maintenance teams can notcommunicate through commercial mobile networks in these conditions and have to havea separate communication system.
Coverage outages in mobile networks are mainly caused by (storm-related) poweroutages. In order to maintain some service level in these cases, macro BS sites aretypically supplied with backup batteries. These reserve energy resources provide powerto keep BSs operational, but only for a very limited amount of time. For example, inFinland BSs have to be operational for 2–4 hours, as required by FICORA [31]. Thishelps to mitigate a majority of shorter power blackouts, however, the repair-work maytake even several days to restore the networks especially after some strong weatherphenomenon. This results in the unavailability of commercial cellular networks, whichmay also endanger rescue operations. One alternative is to have power aggregates atcertain critical BS sites, to guarantee their electricity supply for a longer period oftime. Aggregates are slightly costly to be supplied and used at every site, thus someoptimization is needed in a similar way as in the case of battery backups, i.e. how manyaggregates should be enough to enable sufficient cellular network coverage from the
18

3.2 Maintaining mobile network coverage availability
location point of view. Moreover, in case of longer-term electrical cut-offs (i.e. over oneday), aggregates are eventually required to guarantee (cost-efficient) mobile networkcommunications in disturbance scenarios, given that the backhaul and core network arealso equipped such that the communication is still possible.
Besides coverage outage caused by power blackouts, other type of critical discontinuityin mobile networks may happen due to (major) malfunctions in the CN equipment ormajor damage in the core network elements. Besides pure technical malfunctions, theseproblems can be caused by a cyber-attack or sabotage, thus potentially paralyzing thewhole mobile network. However, these are out of the scope of this study and the focus ison optimizing the backup energy utilization.
Some solutions for mobile communications have been proposed to manage especiallydisaster scenarios in order to improve the resilience of mobile networks. In Japan,the so-called critical sites have been implemented in urban areas to durable high-risebuildings [70] with at least 24 h backup batteries to give continuous service e.g. in case ofdisasters. High-altitude platforms (HAPs) [57] have been discussed earlier as a possiblesolution to provide service coverage in case the existing infrastructure has been destroyede.g. as a result of an earthquake, a tsunami, or a hurricane. This idea has been takenfurther with Google’s project Loon, which targets to provide worldwide Internet accessthrough HAPs, which are implemented with balloon platforms [36]. Also Facebook hasutilized the HAP approach in the internet.org project [51], where solar powered dronesare utilized instead of balloons.
Nowadays, satellite communication services are also possible for disaster areas al-though these systems can be rather expensive. One example of these are the so-calledMedium-Earth Orbit (MEO) satellite systems, which are able to provide global servicealthough the service is limited to ±62 latitude [47]. Moreover, temporary, movablenetworks, like mobile ad hoc networks (MANETs), are a popular research area fordisaster scenarios as seen from many publications on the topic in [16, 55, 74, 75, 89].Although MANET is a prominent technology for these occasions, they usually replacethe existing infrastructure with a new one instead of trying to improve it. Thus, insteadof implementing a new infrastructure, it would be more beneficial to enhance the existingone towards a resilient network, which would be able to maintain its functionality aslong as possible.
In order to maintain even some services in a disturbance areas, publication [P2]analyzes the effect of reducing the number of active eNB sites to save energy with theremaining part of eNB sites. As a result, the cellular network will function longer thanconventionally.
3.2.1 Energy saving concepts in cellular networksThe two most common energy-saving concepts in mobile networks are: the so-calledgreen cellular networks and cellular networks with sleep mode techniques. The ideaof green cellular networks originates from utilizing sustainable energy sources andtaking into account environmental aspects in cellular networks. This usually relates tofavoring renewable energy resources to reduce the carbon footprint of cellular networkinfrastructures or saving energy by reducing the energy consumption of base stations.Nowadays green cellular networks are studied widely, and e.g. the authors in [41] present
19

MOBILE NETWORKS IN DISTURBANCE SCENARIOS
a survey on the state of green cellular networks and the possible challenges they currentlyhave. It is important to realize that the largest power consuming part of cellular networkinfrastructures are base stations, as presented in [40]. Furthermore, the largest part ofbase station power consumption comes from the power amplifiers (50 % to 80 %) [17].
The so-called sleep mode concept can be divided into three main approaches: savingenergy through actions in time, frequency, and spatial domain [66]. Thus, switching offdevices (BSs) for some period of time by taking into account the traffic amount helps tosave energy. The traditional sleep mode concept has been studied e.g. in [64], where theeffect of one or more base stations turned to sleep has been evaluated. A case study ofdynamically switching off base station sites is presented in [71], where the authors showgreat energy saving in the cellular network during low traffic periods. One of the mostrecent wide surveys on these energy-efficient base stations, i.e. base station sites withsleep modes as well as green cellular networks, is presented in [94]. The authors presentan extensive list of recent publications on these topics and discuss the assumptions andsimplifications utilized in these papers to show the great effect they can have in theachievable benefits in actual networks.
Most of the conventional sleep mode techniques are applied to normal networkutilization, i.e. the network is working normally without any disruptions or abnormalities.As a result, sleep mode techniques can be utilized during low-traffic time periods, i.e.certain times within a day and night, when the capacity demand is low. However, itshould be highlighted that the traffic load increases during disturbance scenarios [P1] assubscribers access the mobile network in these areas to search for information regardingthe cause of the disturbance situation and try to e.g. call other people from these areas(and vice versa) to make sure that they are ok. Therefore, sleep mode algorithms basedon low-traffic network utilization could not be directly utilized in these events.
One way to enable sleep mode techniques during disturbance scenarios is to ignorethe instantaneous traffic, i.e. to force BSs to sleep. As a result, energy is saved byutilizing only a portion of the BS sites to provide the so-called backup coverage for areaswhere the electricity supply from the power grid is (temporarily) cut off, because of theabnormal circumstances. Thus, a modified sleep mode concept in cellular networks isthe main approach utilized in this study for the functionality of BS sites operating onlywith backup power (i.e. during a disturbance scenario). However, during this sleep modeBS sites only wait for their turn to power on, without broadcasting anything duringthis time. Therefore, power amplifiers and air conditioning are not needed and signalprocessing power requirements are very low as there is nothing to transmit or receiveduring the sleep time. As a result, the power consumption of these sleeping BS sites isvery marginal. This is more effective in saving energy then having traditional sleep modetechniques, where the BSs wake up to check the situation every once in a while. Theapproach utilized in this study does not take into account traffic loads, instead the targetis to find out what would be the effect of selecting only a portion of the available BSsites to the overall network performance it a specific area. Moreover, the study does notinclude algorithms in how to actually select the usable BS sites (although the selectionof BS sites is based on choosing active BS sites evenly within a target area).
20

3.2 Maintaining mobile network coverage availability
Figure 3.4: Cloverleaf tessellation (layout) with seven three-sectored BS sites.
3.2.2 Radio network planningRadio network planning is a process to design (the best possible) wireless communicationnetwork such that coverage, capacity and the quality of service (QoS) meet (and exceed)the set requirements in a cost-efficient manner. The requirements refer to providinga certain level of service to the given amount of subscribers in a target geographicalarea. In order to maximize these aspects, a radio network planner needs to pay carefulattention to some very important factors. These include the target area environment,which defines the propagation slope, the model used to calculate the maximum pathloss to estimate the cell range, and the network layout in terms of base station locationswith respect to other base stations.
Network layout
The performance of a mobile network depends on many factors and one of the importantones is the used network layout, also known as the tessellation. In the ideal case, itforms a continuous network with raster-like properties, i.e. the layout has symmetricshapes regarding the positions of the BS sites and the antenna directions. The half-power beamwidth (HPBW) of the antennas also affect the choice of tessellation, but thecloverleaf tessellation is the most optimal choice for a 65 degree HPBW antenna [54].This is the most commonly utilized tessellation in Europe and an example of it withseven BS sites is presented in Fig. 3.4. It shows that every antenna in a BS site is pointeddirectly towards one of the neighbor BS sites. Thus, each beam from a directionalantenna is not directed towards another beam resulting in lower interference from theneighbor BS cell.
Propagation model
Coverage of a mobile network generally defined as a geographical area, where a BS anda UE can still communicate with each other. The exact coverage area of a macro BS sitewould require perfect knowledge of the intended environment. Thus, coverage areas areestimated with path loss models to achieve reasonable accuracy for practical networks.
21

MOBILE NETWORKS IN DISTURBANCE SCENARIOS
One of the most common practices is to utilize a well-known Okumura-Hata predictionmodel (and its extended version, the COST-Hata-Model) [15,43,58]:
L = A+B ·log10(fMHz) − 13.82·log10(hBS)− a(hUE) + [C − 6.55·log10(hBS)]·log10(dkm)+ Cm,
(3.4)
where
L is path loss in [dB],A and B are parameters set according to Table 3.2,C is a user-defined parameter for tuning the propagation slope,fMHz is frequency in [MHz],hBS is BS antenna height in [m],hUE is UE antenna height in [m],a(·) is a city size dependent function,dkm is distance between BS and UE in [km], andCm is an area correction factor.
Table 3.2: Frequency dependent A and B parameters for the Okumura-Hata model.
150–1500 MHz 1500–2000 MHzA 69.55 46.3B 26.16 33.9
When Okumura-Hata model (3.4) is utilized, it should be remembered that it requirestuning for different environments in order to achieve accurate results. For example,the area correction factor, Cm, has to be set with correct morphological values definedby the propagation environment. Correspondingly, the propagation slope, which isdefined by [C− 6.55·log10(hBS)], can be tuned with BS antenna height (during the initialradio network planning phase) and by tuning the C parameter to achieve the correctpropagation path loss exponent. As seen from Table 3.2, there are some limitationsto the utilization of Okumura-Hata model regarding the frequencies. However, theselimitations do not prevent the utilization of this model with other values, it just meansthat the model will start to have some errors. Therefore, this has to be kept in mindwhen analyzing the results for the utilized 2600 MHz band. However, the nature of thisstudy is to present the difference between utilizing a different, limited number of eNBsites, thus the absolute values are not highlighted. Other restricting parameters are theheights of the antennas [43, 58] although it is more important that the BS antenna isabove the rooftop level then the absolute value.
22

3.2 Maintaining mobile network coverage availability
Planning thresholds
Planning thresholds are also needed when calculating the maximum path loss withpropagation models. One of the most important planning thresholds is the slow fadingmargin [59]. It can be calculated from the standard deviation of the slow fading, thepropagation slope and the coverage probability target for the required services in a targetarea. Moreover, the values for slow fading margin are clearly different for indoor andoutdoor locations. When the target is to design a radio network with indoor coverage,some additional planning thresholds are needed. First, the value for slow fading marginneeds to be updated from the outdoor version and then the building penetration lossshould be added to the link budget calculation.
Inter-site distance and coverage overlapping
The shortest distance (direct path) between the closest neighboring BS sites is usuallyreferred to as inter-site distance (ISD). These distances are clearly different for rural andurban environments and for different type of cells, e.g. for macrocells and microcells.One example of the magnitude of these ISDs is 750 m for urban and 7500 m for ruralenvironment, according to 3rd Generation Partnership Project (3GPP) [1].
Coverage overlapping occurs when one (geographical) location has service from two ormore cells. Usually, the grade of coverage overlapping is smaller in rural areas comparedwith urban areas because of large ISDs. Vice versa, the coverage overlapping is higherin urban areas since BS sites are close to each other, i.e. the ISD is shorter. As a result,the probability to have a service coverage with a reduced number of BS sites is higher inurban areas compared with rural areas.
Practical capacity requirements
As mentioned before, mobile network (capacity) requirements depend on populationdensity with the potential number of subscribers and the requested services for a givenarea. The serving mobile network cells for these areas are shared mediums, thus theavailable capacity per UE depends on the total number of simultaneous users withinthe same serving cell, the data throughput requests of each UE and the instantaneouschannel conditions. To expand this limited capacity of one channel, more channels,i.e. additional frequency bands can be utilized. Thus, recent implementations includeseveral frequency layers (bands) and technologies at one BS site [68]. An example of thiswould be a BS site, that has a GSM base station, a UMTS base station, and a long termevolution (LTE) base station (eNB) and each of these technologies would operate on atleast two different frequency bands. These could be e.g. GSM operating at 900 MHz and1800 MHz, UMTS operating at 900 MHz and 2100 MHz, and LTE operating at 800 MHzand 2600 MHz. In order to minimize the required power, several technologies, e.g. GSMand UMTS and several frequency layers could be switched off (e.g. only the lowestfrequency band of the remaining technology is utilized for service, such as LTE 800 MHz),and still certain services such as short messages, speech, or limited data services shouldbe maintained (depending on the available technology and its capabilities). This resultsin conserving backup power in crisis situations, but still enables services for a longerperiod of time compared with a situation where BS sites would continue to operate
23

MOBILE NETWORKS IN DISTURBANCE SCENARIOS
normally and quickly consume the available reserve energy. This approach, for example,is nowadays utilized in Finland.
3.2.3 Mobile network simulations
The analysis of prolonging mobile network availability was studied with link-levelsimulations implemented with commercially available radio network planning softwarecalled ICS Designer [10]. The chosen area was a randomly picked and relatively flat areain France, which had a 25 m resolution digital elevation map. After the simulation resultswere obtained, they were exported into MATLAB software [84] for further analysis.
Macrocellular cloverleaf tessellation with three-sectored eNB sites was utilized in thesimulations. A conventional grid of 19 eNB sites was the base for the network layout,which has one eNB site in the middle and two tiers, first tier with six sites and second tierwith twelve eNB sites, around it forming a hexagonal grid. All eNB sites in the originallayout had an equal ISD of 500 m for urban and 4000 m for rural environment. Resultswere analyzed from a circular area with 1.25 km and 10 km radii from the center eNBsite. Thus, the maximum amount of cells was 57 in normal situation. Three additionaltiers of eNB sites were placed around the central grid in order to take into account theeffect of eNB sites outside the target area. As a result, continuous coverage was formedsuch that the selection of eNB sites was repeated around the target area.
The Okumura-Hata model was used for calculating the path loss values in thesimulations and the model itself is adjusted with topographical corrections. Moreover,fading was taken into account with log-normal distribution having zero mean and 9 dBstandard deviation. LTE is utilized in the simulations with evolved UMTS terrestrialradio access (E-UTRA) bands 3 and 7 (1800 MHz and 2600 MHz) for urban environment.E-UTRA bands 20 and 3 (800 MHz and 1800 MHz) are utilized for rural environment.All of the considered frequency bands are frequency domain duplex (FDD) channels.All key parameters regarding the simulations are presented in Table 3.3 and additionalsimulation information is available in [P2]. The selection of antenna gain and thecorresponding HPBW have been fixed in order to compare only the differences causedby the wireless channel.
In order to study the performance of a mobile network with a limited configuration,a set of eNB sites need to be selected from the total amount of 19 eNB sites in a grid. Ifall possible combinations would be considered, the maximum number of different sets(in any order), e.g. with nine eNB sites out of 19 eNB sites would be
(199)
= 92 378, andwith just three eNB sites out of 19 eNB sites result in
(193)
= 969 different sets. Becauseeach set of selected eNB sites had to be defined manually for the commercial radionetwork planning tool, the number of different sets was reduced considerably, down tosix different configurations per given amount of eNB sites. Nevertheless, this provides atrend on how the performance of the network behaves as a function of available eNBsites. In order to noticeably prolong the backup coverage time duration, the focus wasin cases, where less than half of the eNB sites per studied area remained. Moreover, theselection of remaining eNB sites was chosen manually such that the coverage would besufficient, i.e. the set of eNB sites was chosen evenly from the grid of 19 eNB sites.
24

3.2 Maintaining mobile network coverage availability
3 4
5 6 7
8 9
Figure 3.5: Selection of different three to nine eNB site configurations that were utilized inthe simulations for a target area (and repeated in a similar way around this area to form acontinuous coverage). The selected eNB sites out of a grid of 19 eNB sites are highlighted withblue color.
Table 3.3: Key simulation parameters.
Parameter Value
E-UTRA band20 (FDD) 800 MHz3 (FDD) 1800 MHz7 (FDD) 2600 MHz
Spectrum resourcesbandwidth 10 MHznumber of usable resource blocks 50 pcsloading 75 %
Dimensions
calculation resolution 25 mbuilding height 8 mISD – urban 500 mISD – rural 4000 m
eNB
antenna height (urban/rural) 20 m/40 mantenna gain 17.22 dBiantenna HPBW 65
additional losses 3 dBmaximum transmission power 20 W
UE antenna height 1.5 mantenna gain 0 dBi
25

MOBILE NETWORKS IN DISTURBANCE SCENARIOS
3.2.4 Performance results with limited configuration
The performance of a limited network configuration is analyzed with a selection ofKPI values. The most interesting values are the mean reference signal received power(RSRP) levels (Fig. 3.6a), the mean service probabilities (Fig. 3.6b), and the averagesignal-to-interference-and-noise ratio (SINR) (Fig. 3.6c) with respect to the number ofeNB sites. The corresponding exact values are presented in Table 3.1.
Fig. 3.6a shows that when the number of eNB sites grows, the average RSRP levelsincrease, which is intuitively expected. Rural environment with E-UTRA band 20(800 MHz) has the highest average RSRP values and correspondingly rural environmentwith E-UTRA band 3 (1800 MHz) has the lowest RSRP values. The environment typewith different antenna heights for the rural and urban areas has a huge impact on theaverage RSRP values, because the antenna height for the rural area cases is two timesthe height of the antenna in urban area cases. Another important factor is the utilizedfrequency, i.e. for rural area the higher 1800 MHz frequency band is more than twicethe lower 800 MHz frequency band. In the urban cases, the higher 2600 MHz frequencyband is less then twice the lower 1800 MHz frequency band, thus the differences betweenthe average RSRP values for two rural cases is more evident than the correspondingdifferences for the urban cases. It should not be forgotten that the urban cases areaffected by buildings, thus there is some additional attenuation with respect to ruralcases.
The average probability to have (backup) coverage in the different cases is shown inFig. 3.6b. E-UTRA band 7 (2600 MHz) had the lowest average probability (55.44 %) tohave service coverage in the urban environment. This occurs naturally when the amountof eNB sites is the smallest (15.79 %). Thus, although the urban area had a denser eNBsite placement than the rural area, the coverage areas with a higher frequency band arequite limited, as well as the overlapping areas. This is mostly because the attenuation ishigher in the urban environment (with buildings) as well as with a higher frequency band.When the same frequency band was utilized in both the urban and rural environment,the urban E-UTRA band 3 had slightly higher probability to have a service than its ruralcounterpart (rural E-UTRA band 3). The highest service availability was achieved withthe lowest frequency, i.e. 800 MHz band in the rural case, where the probability to havea service was over 80 % even with the lowest amount of eNB sites (15.79 %). In order tohave the same amount probability for (backup) coverage in other cases, E-UTRA band3 cases (1800 MHz) would need around 26.32 % in urban and 31.58 % in rural scenariosand E-UTRA band 7 (2600 MHz) up to 50 % of the eNB sites in the urban environment.
In Fig. 3.6c, the average SINR values are presented. It can be noticed that in ruralenvironment the achievable values are much higher than in urban cases, mostly becauseof low interference from less dense eNB site placements, i.e. the minimum ISD is 4000 m.When more eNB sites are available, the average SINR degrades because of the increasedinterference levels.
When the exact values are observed from Table 3.4 as a function of available eNBsites, the differences between different E-UTRA bands and environments are easy tocompare. Intuitively thinking, each KPI (RSRP, service probability, and SINR) shouldhave a better value as the percentage of eNB sites per area is increased, and in generalthis is observed in Table 3.4. The only difference is the utilized lower urban frequency
26

3.2 Maintaining mobile network coverage availability
amount of eNBs per area [%]
15 20 25 30 35 40 45 50
mea
n R
SR
P [
dB
m]
-84
-82
-80
-78
-76
-74
-72
-70
Rural 800 MHz
Rural 1800 MHz
Urban 1800 MHz
Urban 2600 MHz
(a) Average RSRP level.
amount of eNBs per area [%]
15 20 25 30 35 40 45 50
mea
n s
ervic
e p
rob
ab
ilit
y [
%]
0
10
20
30
40
50
60
70
80
90
100
Rural 800 MHz
Rural 1800 MHz
Urban 1800 MHz
Urban 2600 MHz
(b) Average service probability.
amount of eNBs per area [%]
15 20 25 30 35 40 45 50
mea
n S
INR
[d
B]
1
1.5
2
2.5
3
3.5
4
4.5
5
5.5
6
Rural 800 MHz
Rural 1800 MHz
Urban 1800 MHz
Urban 2600 MHz
(c) Average SINR.
Figure 3.6: Visualizations of the simulation results.
27

MOBILE NETWORKS IN DISTURBANCE SCENARIOS
band (1800 MHz), where the average SINR value is slightly increased when more than31.58 % of eNB sites are utilized. However, this increase stops after more than 42.11 %of eNB sites are utilized.
3.2.5 Conclusions on maintaining mobile network coverage avail-ability
Backup coverage is required when disasters or disturbance scenarios occur. As the namesuggests, the mobile network can not have “normal” service availability in these casesas the goal is to provide acceptable or even some coverage to enable communications.When eNB sites are equipped with reserve power, the goal is to extent the availabilityof mobile network services as long as possible. Thus, instead of immediately utilizingthe backup power in all eNB sites, one way to prolong the functionality of the sitesis to utilize only a set of eNB sites at a time. This means that some areas would nothave coverage at every time instant during the overall backup coverage time window.However, as the operating sets of eNB sites are cycled over time, all areas would havea certain time window when the mobile network services are available. Thus, in orderto achieve e.g. approximately 75 % (area) availability only 20 % to 42 % of eNB sitesin urban areas, and 15 % to 25 % of eNB sites in rural areas are needed according tothe simulations. This would result in an increase of 100 % to 500 % on the operationaltime of backup coverage, correspondingly. As a result, this kind of operation can beconsidered as a different kind of state in the mobile networks called the “safety mode”.Another way to interpret this is to observe that mediocre coverage would be possible fora longer period of time if only 20 % of eNB sites were equipped with aggregates or anyother means of powering up eNB sites. This could be cheaper than having e.g. up to24 h backup batteries deployed to these eNB sites as is the case in [70].
Traditional sleep mode techniques are designed to save energy mainly during the lowtraffic time periods and this is usually not the case during disturbance situations. Manystudies such as [64,71,94] consider different sleep mode techniques with heterogeneousnetworks having eNB site layouts of a different kind. In order to get some idea aboutthe effectiveness of the approach utilized within this paper, the authors in [6] presenta comparable sleep mode technique, where part of the eNB sites remain active all thetime and part of the eNB sites can switch to the sleep mode. The results in the studysuggest that on average the power savings from an actual network implementation wouldrange from 7.38 % to 27.72 % on a 24 h time period during normal network operation.Consequently, although still not directly comparable, the energy savings are only a partof the approach utilized in this study. This difference can be explained with high QoS,i.e. sleep mode techniques are designed to have high service availability. However, inthis study the requirements for QoS are clearly lower because the idea is to lower QoSto enable even some (sufficient) level of service for a clearly longer period of time byaggressive energy saving.
The studied availability levels with a limited amount of active eNBs can be reachedin existing networks by adding only controlling units. Moreover, the achieved resultsassume that backhauls and core networks are properly functioning (which is usually thecase, at least in Finland, as the backhaul element backup power regulation is stricterfor backhaul elements than for eNB sites by a factor of 2–6 [31]). Thus, more specific
28

3.2 Maintaining mobile network coverage availability
Tab
le3.
4:Simulationresults
with
limite
dne
tworkconfi
guratio
n.
Percentage
meanRSR
P[dBm]
meanserviceprob
ability
[%]
meanSINR
[dB]
ofeN
Bsites
rural
rural
urba
nurba
nrural
rural
urba
nurba
nrural
rural
urba
nurba
n
perarea
800M
Hz
1800
MH
z18
00M
Hz
2600
MH
z80
0MH
z18
00M
Hz
1800
MH
z26
00M
Hz
800M
Hz
1800
MH
z18
00M
Hz
2600
MH
z
15.7
9%−
76.3
7−
82.6
8−
78.8
3−
80.8
380.3
568.5
272.5
055.4
45.
225.
621.
533.
51
21.0
5%−
75.3
5−
81.7
5−
77.9
1−
80.3
883.3
572.4
475.8
159.8
14.
533.
891.
132.
55
26.3
2%−
74.2
9−
80.8
8−
76.7
7−
79.7
986.2
876.4
180.5
066.3
24.
113.
531.
171.
99
31.5
8%−
73.5
6−
80.2
9−
76.0
7−
79.2
589.3
780.6
682.6
269.2
33.
983.
301.
041.
64
36.8
4%−
72.9
1−
79.6
7−
75.3
3−
78.7
990.6
682.5
885.0
673.0
53.
963.
271.
271.
60
42.1
1%−
72.3
9−
79.2
0−
75.0
3−
78.5
191.6
184.2
486.3
675.2
93.
693.
021.
321.
57
47.3
7%−
71.9
1−
78.7
2−
74.2
9−
78.2
392.3
885.4
787.3
377.4
93.
452.
791.
321.
57
29
MOBILE NETWORKS IN DISTURBANCE SCENARIOS
solutions need to be proposed to maintain their availabilities in case of disconnections. Itshould be noted that in real operational networks the selection of eNB sites for backupcoverage is not straightforward. The geographical distribution of eNB sites is first of allasymmetric and in practice only roughly follows the cloverleaf tessellation. Moreover,this study only showed how the network would perform if each eNB site was independentof another eNB site, i.e. the study did not take into account the possible backhaulconnection limitations of (wirelessly) linked eNB sites. This can have more serious effectswithin rural environments if, for example, wireless microwave links are utilized morefrequently compared with urban areas, where wireless links between eNB sites rarelyexist.
30

CHAPTER 4
Situation Awareness System forDisturbance Management
Important part of restoring damaged infrastructures is disaster management. In thissecond main part of the thesis, a new developed SAS [P3–P4] is presented to improve
and help the disaster management process. The new SAS is based on combining theoutage information from two different infrastructures: mobile networks and electricitynetworks. This information is visualized for a quick and easy to comprehend view on amap, which e.g. helps to prioritize the restoration plans for the most critical areas inboth networks.
4.1 Existing situation awareness systemsThe concept of a situation awareness has a long history. In general, SA can be interpretedwith many different kinds of contexts and is usually associated with decision makingin complex systems containing huge amount of data, known as the concept of bigdata [63, 65]. Nowadays, some of these decisions are decided by machines, e.g. byautomated computer programs, but usually the most critical decisions fall eventually tohumans. For example, [26] lists different contexts for SA as follows: aircraft, air trafficcontrol, large-systems operations, tactile and strategic systems, or even other ordinaryactivities like walking and driving a car. The SAS developed in this thesis can be listedas a tactile and strategic system: a tool helpful for deciding the best course of actionthat addresses critical information in widely varying situations. Thus, the developedSAS itself does not perform decisions, but it is helpful in determining the next move onhow to improve the situation at hand.
Coverage area maps are usually freely available and accessible for the majority ofMNOs around the globe. These coverage maps are convenient for checking whether aMNO has e.g. wide LTE coverage around the areas where the subscriber should need it.An example of these can be found e.g. from the services of MNOs in Finland [22,25,83],or MNOs in United Kingdom [46,79,90] to give a few examples. Thus, although moderncellular networks are advertised to have coverage all the time and everywhere, there
31

SITUATION AWARENESS SYSTEM FOR DISTURBANCE MANAGEMENT
can still be areas without mobile network coverage. For the majority of the subscribers,however, all the time ubiquitous connectivity is achieved through mobile networks.
Commercial or public mobile network SASs are not that common. From the MNOspoint of view, these are systems that give more information than just the estimatedcoverage areas. These systems give up-to-date information from the status of the networkand possibly even the estimated areas where they are likely to occur. This kind ofinformation is well-known for MNOs themselves, but it has not been traditionally shownto the subscribers. There can be many reasons behind it, like showing a better status ofthe network than it actually is as the telecommunications field is very competitive, orthe information is too critical for public, i.e. it could be utilized for backtracking e.g.the locations of BS antenna locations in order to sabotage them.
Nevertheless, some SASs for mobile networks exists. In Finland, for example, FICORAhas launched a service called MONITORi already at the end of 2013, which currentlyprovides up-to-date geographic information about a number of different services. Atpresent these services include information in Finland such as broadband and telephonenetwork availability, coverage areas of terrestrial television and radio, postal servicesand most importantly faults and disturbances of mobile networks [33–35]. The faultsand disturbances service of MONITORi combines the fault information of all MNOsand visualizes the areas which are affected on a map. However, only severe and verysevere disruptions are visualized, and this information is provided by MNOs on aregional accuracy after the incidents. Thus, the service provides only a delayed andrough geographical area of the mobile network disturbances. In other words, it is not asuitable tool for even near real-time SA, but only providing information about what hadhappened. More accurate and closer to real-time SASs are available e.g. on the websitesof all MNOs in Finland [21, 24, 82]. It should be noted that FICORA has regulated howMNOs need to notify the faults in their networks to subscribers according to [32], but itdoes not require the visualization of these disturbances. Thus, each MNO has decidedon their own how accurate information is visualized in their SAS in Finland.
Similar SASs can be found e.g. from Sweden [78, 80, 81], but other similar SASsare hard to find. In United Kingdom, there is one MNO, who visualizes problematicareas on an online map service, however, it only works after specifying an address and itshows only a symbol on the map and not the actual extent (geographical area) of thedisturbances [90]. Another example of a similar approach can be found from Australia,where one MNO shows live outages on an online map after specifying an address to thesystem [88]. However, it presents just symbols to inform whether there is a problem atspecific BS sites without actual estimated influence areas.
4.2 Situation awareness system implementationThe new implemented SAS combines the information from two different critical infras-tructures: mobile networks and electricity networks. The information is visualized in anonline map service, where the disturbances are shown in near real-time.
The information for the mobile network is based on the actual live network status ofan operating MNO. This includes the configuration of the corresponding mobile networkof the MNO and accurate pre-calculated simulations of the corresponding coverage areas
32

4.3 Live demonstration - Case in Finland
(simulated with the Okumura-Hata model) of each cell in the network. Thus, when thereis a problem in the network, e.g. a faulty BS, information about it will be sent to thesystem and the corresponding cells are visualized in the system. To be more precise, thesystem visualizes only coverage outages. This means that one faulty BS might not causecoverage outage, because other neighbor BSs are still able to provide coverage for theseareas because of coverage overlapping.
The disturbance information for the electricity network part is provided by differentDSOs through their DMS services. DMS generates the outage information data of thecurrent status of electricity network, including details like the start and end time ofdisturbances, as we as the type and description of these events. This outage informationis provided on two different levels: a transformer level and a customer level. Thetransformer level information data is generic and can not be utilized to identify a singlecustomer. However, it contains a list of affected transformers and with the help ofcustomer level information, which contains e.g. customer identification information, itcan be used to identify a single customer. In the developed SAS systems case, the closesttransformer of each BS indicates the availability of electricity of that specific BS. Theinformation data is provided through extensible markup language (XML) format, whichis fetched over hypertext transfer protocol secure (HTTPS) protocol. The data is furtherparsed and finally displayed in a browser-based user interface.
Furthermore, the system combines other beneficial information besides the status ofthe critical infrastructures. These include information on the current weather conditions,the status of fire and rescue service tasks, and traffic report, as shown in the structureof the system in Fig. 4.1. The weather information is fetched using hypertext transferprotocol (HTTP) from a web feature service interface provided by the Finnish Meteorol-ogy Institute. Correspondingly, the information from the fire and rescue service tasks isfetched over HTTP from an interface provided by the Finnish rescue services. Finally,the information about the traffic data can be fetched from the Finnish Transport Agencyservice with simple object access protocol (SOAP).
The system was also designed to include other critical information, such as theso-called critical customers. These can be, e.g. hospitals, water pumping stations, elderlypeople with safety phones or patients with special health care needs. The information ofcritical customers is a manually updated structured query language (MySQL) database,which can be updated by the users themselves. The SAS can then visualize differentcritical customers in the online map service.
The overall user interface is presented in Fig. 4.2, where a snapshot of the system ispresented for one example case. The system highlights the borders of the correspondingmunicipality where there are problems in the networks. For example, a faulty transformerstation in the network is visualized with a gray light bulb icon and additional informationabout that disturbance can be received by clicking the corresponding symbol. A faultyBS site is visualized with a BS icon.
4.3 Live demonstration - Case in FinlandThe suitability of the developed SAS was tested in practice with a live demonstration.A real-life disturbance scenario is shown in Fig. 4.3, which occurred in a certain area in
33

SITUATION AWARENESS SYSTEM FOR DISTURBANCE MANAGEMENT
DSOs
Municipa-lities
Fire andrescue
services
DSOs
MNOs
Fire andrescue
services' tasks
Weatherservice
Traffic reportservice
Web-baseduser interface
Criticalsites
OpenStreetMap
User groups
Service providers
MNOs
Outage informationproviders
Manually updatedstatic MySQL
database
Figure 4.1: A diagram of the implemented SA system.
Figure 4.2: The user interface of the developed SA system.
Finland in 2015. For simplicity, only GSM network was analyzed. The red polygon ( )represents the areas without GSM network coverage. Moreover, the symbols representdifferent points of interest in the map. First, the gray light bulb icon ( ) indicates theoutage of a transformer in the electricity network. The blue, yellow and red symbols of aBS represent the status of it: normal BS operation ( ), BS operation with backup power
34

4.4 Situation awareness system conclusions
2G
3G
3G
Electricity network outage
Mobile network base stationwithout electricity
Mobile network base stationoperating with backup power
Mobile network base stationoperating normally
Remote controlled switchwithout mobile connection
Remote controlled switchoperating normally
Safety phone customerwithout electricity
Critical time of critical sitehas exceeded
Figure 4.3: Detailed view of the user interface during a disturbance scenario with focus onGSM network outage.
( ), and non-operational BS ( ), respectively. The status of additional information isalso given with other symbols, as shown in the legend of Fig. 4.3. The information aboutthe status of remote controlled switch is presented with two icons: on ( ) and off ( ).Finally, critical customers, such as (elderly) people with safety phones, are presented inthe map with orange icons ( ) and when the predefined critical customer’s critical timewindow has expired, the symbol will have a red edge ( ).
The effect of a disturbance scenario on the availability of cellular network coverage isclearly visible in Fig. 4.3, as the majority of BSs are without electricity after few hoursfrom the start of the blackout, and only one area in the center of the figure has workingBSs. The reason for this is that this area is a city center of a small town, thus the BSsites in this area have more reserve energy. This also indicates that these BSs are morecritical than the other BSs in the surrounding area. The exact location and the maplayer is removed because of a non-disclosure agreement with the cooperating MNO.
4.4 Situation awareness system conclusionsThe most obvious benefit of using the developed SA system is the easy way to monitorboth networks in the same service at the same time. Moreover, by utilizing this kindof service, the interoperabilities of the different infrastructures are easy to observe.
35

SITUATION AWARENESS SYSTEM FOR DISTURBANCE MANAGEMENT
This information can then be e.g. utilized in prioritizing the restoration process afterdisturbance scenarios.
Besides MNOs and DSOs, also authorities and other parties are able to benefit fromthe system. For example, municipalities in Finland are responsible for the well-being ofelderly citizens [5]. Thus, when the critical customers have been included in the system,the status of mobile network coverage (e.g. for safety phones) and the availability ofelectricity in that location are easy to monitor.
The most vulnerable parts of critical infrastructures can be found out over time byutilizing the SAS. This in turn is useful information in improving or even planning newnetworks. Over time, MNOs can also benefit from the system by detecting deterioratedbackup power batteries. This is possible, since the duration of the backup batteriesshould be known and the system is able to provide information of the actual duration ofthe BS operation with reserve power. Correspondingly, DSOs can utilize the informationabout critical locations with degraded reserve power to prioritize the repair actions tosuch locations.
The main challenge in the functionality of existing SASs, which combine informationfrom more than one critical infrastructure [72, 76], is the lack of interdependencyinformation between different infrastructures. By utilizing this information, the overallSA view is easier to comprehend. Moreover, information is available for many differentuser groups, such as MNOs, DSOs, fire and rescue services, and authorities.
One crucial point, that has to be addressed when talking about SASs, is the actualimplementation part. As the system is based on utilizing information from commercialnetworks, SASs can not be implemented without data directly from these companies.Thus, adopting this kind of system depends entirely on the willingness of stakeholdersto participate in these kind of systems. As a result, developing SASs can be challengingunless there would exist e.g. legislation that would force different stakeholders to providedata for such systems, which would help authorities to improve the resiliency of society.
36

CHAPTER 5
Innovative Approaches forMitigating Mobile Network
Service Outage
This chapter is based on the work in [P5–P7]. It is the third main part of this thesisand presents different innovative methods in order to improve the functionality of
mobile networks especially during disturbance scenarios.
5.1 User-guided energy and capacity optimization formobile networks
Mobile network coverage is rather stable with a fixed configuration, however, theinstantaneous state of the mobile network channel changes all the time. This channelstate is related to the location of the receiver with respect to the transmitter, thesurrounding environment, the actual time incident of the measurement, as well asthe utilized frequency. Overall, it can be stated the wireless cellular channel is time-,frequency-, and space-variant. Thus, changes in any of these domains can alter the UEQoS of the serving cell connection.
One of the most intuitive ways to improve the connection between UE and BSantennas is to change the location of the UE. For example, simply moving a UE from anoutage area to a location with coverage. This idea can be taken further by improvingthe connection between a UE and BS antennas by (indirectly) guiding the UE to abetter location within service coverage. In practice, this means that a subscriber wouldchange the location where he or she is making a phone call or otherwise utilizing themobile phone. This change in the location can be from one room to another room oreven different location within one room in indoor locations. The idea is the same: thechange in location affects the channel conditions. [42]
In the majority of modern cellular networks, the indoor network coverage is providedfrom the outdoor network infrastructure. This raises severe problems in modern buildings:
37

INNOVATIVE APPROACHES FOR MITIGATING MOBILE NETWORKSERVICE OUTAGE
the building penetration loss is very high as the building material has changed over theyears as energy saving demands are stricter in the construction industry [20]. In practicethis can be seen from reinforced walls with metallic surfaces and windows with theso-called low emission glasses [9]. This just emphasizes the importance of the locationinside the building to utilize the mobile phone, i.e. to find the best possible positionsuch that the channel conditions would be as good as possible.
In order to get some understanding about the channel conditions indoors, subscriberscan e.g. see what the signal strength icon in their phones is showing and try to improveit by simply changing their location. The problem is that normally people are notinterested in what the channel conditions are, thus they ignore the instantaneous signalstrength and try to improve their location only when there is e.g. some problem withongoing phone calls. In order to study the effects of slightly changing the UE location,a concept known as mobile performance gaming (MPG) was utilized in [P5]. Theconcept is simple: the properties of a game in mobile phone changes with respect to theinstantaneous channel conditions and the information is sent for analysis. For example,the difficulty of a game is harder when the UE is located closer to the cell edge area.Because people are not playing all the time or are not interested in playing at all, theMPG concept was utilized with the help of the so-called live wallpapers for mobilephones. The properties of the wallpaper, i.e. the visualization, changed with respect tothe instantaneous channel conditions. This way subscriber can pay more easily attentionto the channel conditions.
5.1.1 Energy and capacity efficiency
The transmission powers of wireless networks are limited. In practice this means thatthere is a certain range of powers that can be utilized, e.g. to transmit (DL/UL) signalsin mobile networks. Moreover, energy-efficiency is very important in order to save energy.
The same idea is valid for capacity: maximize the spectral efficiency in order toutilize resources more efficiently. Thus, a system which has a high value for successfullytransmitted and received bits/second/Hertz is more efficient than a system having lowvalue for the corresponding KPI with the same spectral resources (i.e. bandwidth). Inpractice this means that capacity is higher with a more spectrum-efficient system, whichis the same as providing service to a higher number of UEs.
Because the measurements in this study were performed in UMTS network, thebenefit of having a better channel condition is evaluated with the help of estimating therequired average transmission power in BS to serve a number of users. The measurementUE saved the received DL power level, which corresponds to measuring the receivedsignal code power (RSCP) from the common pilot channel (CPICH), which is transmittedwith a constant power in UMTS network [2]. The CPICH power is typically between 5 %to 15 % of the total transmission power, e.g. 10 % out of 20 W equals to 2 W ≈ 33 dBm.
The actual average transmission power PDLTX in UMTS can be approximated with
the following equation [44]:
PDLTX =
Nrf ·W ·L·∑Kk=1(vk · ρk
W/Rk)
1 − ηDL. (5.1)
38

5.1 User-guided energy and capacity optimization for mobile networks
Here, Nrf denotes the noise spectral density of the UE receiver front-end. It can becalculated with
Nrf = k·T + NF, (5.2)
where k is the Boltzmann’s constant (≈ 1.381·10−23 J/K), T is temperature in Kelvins(normal assumption is T = 290 K), and NF is the UE noise figure. The other parametersin (5.1) are the following: W is the system chip rate, L is the average attenuationbetween a BS transmitter and UE receiver, i.e. the mean path loss, k is the user index,and K is the total number of users per cell. Moreover, vk is the activity factor, ρk is theSINR, and Rk is the bit rate of the kth user. The DL load factor is denoted with ηDLand calculated as
ηDL =K∑k=1
ρk ·Rk ·vkW
·[(1 − αk) + iDL]. (5.3)
Here, αk is the orthogonality factor of kth user in the cell and iDL is the averageother-to-own cell interference.
5.1.2 Measurement campaignThe effect of small-scale displacement in indoor mobile networks was studied with thehelp of commercial UMTS networks. LTE coverage was still limited at the time of themeasurements in a normal urban residential apartment in downtown Helsinki, Finlandin 2013, thus the data from UMTS network was utilized and collected with the help ofMPG application in the measurement phone. It was a non-calibrated Samsung GalaxyS4 smart phone, thus the absolute values were not highlighted. The measurement UEwas placed on different tables around the apartment (height approximately 50 cm to120 cm) and left at one location for a few minutes in the measurements.
A rough blueprint of the measurement apartment (first floor) is shown in Fig. 5.1. Itshows four different measurement scenarios:
1. UE placed around common areas in the apartment (all tables).
2. UE placed in a subset area of measurement scenario 1. The maximum locationdifference was 3 m to 6 m within the area (different tables).
3. UE placed in a subset area of measurement scenario 2. The maximum locationdifference was 1 m to 2 m within the area (different locations on one table).
4. UE fixed to one location within the area of measurement scenario 3.
The measurement UE did not have any body contact during the measurements,however, the measurement person was able to move around in the surroundings approxi-mately 3 m to 5 m from the phone. All of the measurements were performed with thephone staying in idle mode, i.e. no data transmission or call was ongoing, and the phonewas able to perform a handover (HO) to different available cells. The MPG applicationsaved the measurements such that average values for every 10 s were recorded, thus datawith a rate of 6 samples per minute was imported to the analysis.
39

INNOVATIVE APPROACHES FOR MITIGATING MOBILE NETWORKSERVICE OUTAGE
1. 2. 3. 4.
Figure 5.1: Blueprints of the measurement apartment with different areas for the measurementscenarios 1.–4.
5.1.3 Measurement results
All of the measurement results are visualized in Fig. 5.2. During the measurements, themeasurement UE was connected to 3–7 different BS cells within four different scenariosinside an apartment in downtown Helsinki, Finland. As can be seen from the mean andstandard deviation values in Table 5.1, the channel conditions are close to that of atypical indoor coverage values in a cell edge area.
As the measurement area is shrunk down, the standard deviation is smaller, meaningthat there is less variation between the measurement data. Taking this into account andthe fact that the overall measurement values ranged from −127 dBm to −95 dBm, it canbe noted that the received signal power level can be improved easily 10 dB. Furthermore,it is possible to improve the received signal strength from 20 dB to 25 dB by movingfrom the worst location to the best location.
In practice, an improvement of 10 dB or 20 dB in the path loss is remarkable. Forexample, by utilizing (5.3) with 33 speech users (Rk = 12.2 kbit/s) and the followingtypical values: ρk = 6 dB, vk = 0.5 αk = 0.7 and iDL = 0.5, the DL load factor ηDLequals to 16.7 %. As a result, when this value is utilized in (5.1) with 7 dB UE noise figureand an average 150 dB path loss (e.g. measurement scenario 1: RSCP = −117 dBm,CPICH = 33 dBm, UE antenna gain = 0 dBi, BS antenna gain = 17 dBi, and buildingpenetration loss = 17 dB), the required total transmission power is 42.9 dBm (≈ 20 W).An improvement of 10 dB in the path loss would result in total transmission power of32.9 dBm (≈ 2 W) and 20 dB improvement into 22.9 dBm (≈ 0.2 W), respectively. Thisclearly shows the benefit of improving the average path loss from the energy point ofview. Correspondingly, the theoretical capacity inspection shows that if the transmissionpower was fixed to 20 W, then an improvement of 10 dB in the path loss would result inincreasing the number of speech users from 33 to theoretically up to 133 (downlink loadfactor would increase from 16.7 % to 67.3 %). The improvement would be even higher
40

5.1 User-guided energy and capacity optimization for mobile networks
RSCP [dBm]
-135 -130 -125 -120 -115 -110 -105 -100 -95 -90 -85
Nu
mb
er o
f d
ata
sa
mp
les
0
5
10
15
20
25
30
Case 1
Case 2
Case 3
Case 4
Figure 5.2: Histograms of the measurement scenarios 1.–4.
with 20 dB path loss gain, but the DL load factor would start to limit the number ofadditional users as well as the maximum number of simultaneous active users supportedin one UMTS cell. Taking these into account, the improvement of 20 dB would result,e.g. theoretically up to 150 speech users causing 75.9 % load with only 34.9 dBm (lessthan 4 W) transmission power. Thus, improvements are practically seen with moresimultaneous users (up to the system limit) and lower transmission powers.
Table 5.1: Mean and standard deviation values for measurement scenarios 1–4.
measurement scenario mean RSCP (dBm) standard deviation (dB)
scenario 1 −108.5 8.46scenario 2 −104 5.54scenario 3 −106 3scenario 4 −111 3
5.1.4 User-guided energy and capacity optimization conclusionsThe obtained measurements show that the DL signal power level (RSCP in UMTS) at thereceiver (UE) could be increased up to 10 dB to 25 dB, when the UE location is optimized.This can significantly improve the mobile network energy-efficiency and capacity-efficiencywhen subscribers perform this kind of indirect mobile network optimization. However,it should be noted that in order to achieve high benefits from this kind of system, themajority of subscribers should improve their channel conditions if possible. Nevertheless,all improvements, especially from very bad channel conditions, will improve the overallsituation and reduce the required transmission power of the UE.
41

INNOVATIVE APPROACHES FOR MITIGATING MOBILE NETWORKSERVICE OUTAGE
Although the measurements were performed in a UMTS network, similar energysavings are possible to achieve in other cellular network technologies. The challengingpart, however, is to motivate subscribers into actually optimize their location. Duringdisturbance and disaster scenarios these kind of actions would help to save the BS backupenergy, and eventually prolong the functionality of the network operating with reservepower.
5.2 Low altitude platforms for disaster scenariosThe existing mobile network infrastructure can be temporarily unavailable after disasterstrikes. Assuming local backup power, the BS sites can maintain their operation only fora short period of time. Moreover, when repair and emergency teams are able to reach thedisaster-hit area, the reserve power can already be finished. This would mean that thecommunications in that area would not work and that other methods for communicationshave to be utilized, besides the existing cellular network, as mentioned in Section 3.2.
The coverage aspects of LAP network are investigated in [P6] with the help of drones,or more generally known as unmanned aerial vehicles (UAVs). The idea is similar tothat of HAP systems [36,51,57]: provide a (temporary) communication infrastructurefor the so-called emergency coverage in disaster-hit areas. The idea is similar to theone presented in [39,85,86]: the utilization of UAVs to form a temporary network fordisaster response. However, the authors in [39, 85, 86] focus on deploying only a verysmall-scale version of the idea.
The LAP concept proposed in [P6] is presented in Fig. 5.3 and it utilizes Institute ofElectrical and Electronics Engineers (IEEE) 802.11 family standards to form a flying adhoc network (FANET) as presented in [11]. The emergency coverage is provided throughWLAN access points (APs) utilizing 2.4 GHz frequency band with 20 MHz bandwidth inthe so-called disaster area drones (DADs). The backhaul connection between DADs isbased on utilizing 5 GHz frequency band with 40 MHz bandwidth. The actual connectionto the Internet in this concept is provided through gateway drones (GDs), i.e. UAVsequipped also with 3G/4G modems, which have to be placed in the border area betweenthe disaster-hit and still unaffected areas.
It is assumed that the operation of drones is semi-automatic. Thus, the system isable to connect and provide a temporary network coverage for a desired location. Thismeans that the emergency field team just need to launch the drones at a predefinedsuitable location, and that the drone would automatically take off to a suitable hoveraltitude. As such, the aim of this study is to focus on the coverage capabilities of theproposed LAP concept. In order to form an idea about these aspects, simulations wereperformed to find out how would e.g. different inter-drone distances (IDDs) and thehover altitudes of DADs affect the service coverage areas.
5.2.1 Service area simulationsThe simulations in this study were performed with ProMan tool, which is softwarefor wave propagation and radio network planning. It is a part of WinProp SoftwareSuite [7]. The propagation model chosen for the simulations was the dominant pathmodel (DPM) [7]. The model determines the dominant paths between UEs and BSs, as
42

5.2 Low altitude platforms for disaster scenarios
Cellular Coverage
Gateway Drone (GD)
Disaster Area Drone (DAD)
3G/4G connection
Backhaul WLAN 802.11ac (5 GHz)
Cellular coverage
Emergency WLAN coveragewith 802.11ac (2.4 GHz)
Disaster area
Figure 5.3: An example of the LAP network concept.
in most cases only two or three propagation paths contribute more than 90 % of the totalenergy [91, 92]. Thus, the heavy calculations of ray-tracing or ray-optical models can besimplified to consider only the main paths. As a result, the computation time of DPMis comparable to that of empirical models (such as Okumura-Hata or Walfisch-Ikegami),but the accuracy of the model is close to that of ray-tracing models. The DPM modelto calculate the path loss L is defined as:
L = 20·log10
(4πλ
)+ 10·n·log10(d) +
N∑i=0
f(ϕ, i) + Ω + gt, (5.4)
where λ is the wavelength of the utilized frequency, n is the path loss exponent and dis the distance between the transmitter and receiver. Moreover, the sum of individualinteraction loss function, f(ϕ, i), is due to diffraction loss for interaction i up to maximumnumber of interactions N with ϕ as the angle between the former propagation directionand the new direction. The so-called tunneling effect, i.e. the wave-guiding effect ofpropagating signals is taken into account with Ω. It is empirically determined anddescribed in detail in [7, 93]. The last parameter, gt is the gain of the transmittingantenna.
All of the important simulation parameters are presented in Table 5.2. The simulationarea consisted of 6 km × 6 km flat rural and dense urban (Manhattan) environments.The choice of IDD was set to 960 m for both environments, to be in line with test resultsprovided in [73]. In addition, the effects of densification were studied with 480 m IDDfor urban areas as well as increasing the number of DADs from one up to 11 × 11 = 121drones in a square grid. The drones were set to hover in the altitudes from 50 m to500 m. The path loss exponent n in line-of-sight (LOS) paths was set to 2 before and to2.6 after the break point distance to match the measurement results in [61]. The pathloss exponent for obstacle LOS (OLOS), or commonly known as non-LOS (NLOS), wasset to 3.5 to match (dense) urban environment.
The detailed information for drone parameters is shown in Table 5.3. The effectiveisotropic radiated power (EIRP) for 2.4 GHz frequency band in WLAN is limited to20 dBm in Europe according to European Telecommunications Standards Institude(ETSI) [28]. Correspondingly, the EIRP for 2.4 GHz frequency band in WLAN is limitedto 36 dBm in the United States according to Federal Communications Commission(FCC) [29]. The minimum usable coverage threshold can be considered to be −82 dBm
43
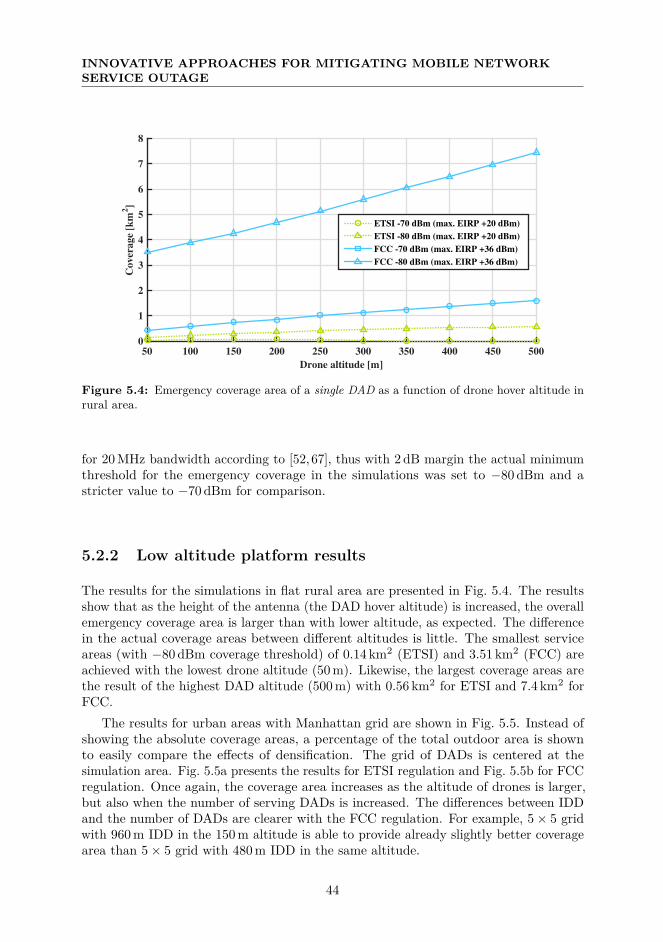
INNOVATIVE APPROACHES FOR MITIGATING MOBILE NETWORKSERVICE OUTAGE
Drone altitude [m]
50 100 150 200 250 300 350 400 450 500
Cover
age
[km
2]
0
1
2
3
4
5
6
7
8
ETSI -70 dBm (max. EIRP +20 dBm)
ETSI -80 dBm (max. EIRP +20 dBm)
FCC -70 dBm (max. EIRP +36 dBm)
FCC -80 dBm (max. EIRP +36 dBm)
Figure 5.4: Emergency coverage area of a single DAD as a function of drone hover altitude inrural area.
for 20 MHz bandwidth according to [52, 67], thus with 2 dB margin the actual minimumthreshold for the emergency coverage in the simulations was set to −80 dBm and astricter value to −70 dBm for comparison.
5.2.2 Low altitude platform results
The results for the simulations in flat rural area are presented in Fig. 5.4. The resultsshow that as the height of the antenna (the DAD hover altitude) is increased, the overallemergency coverage area is larger than with lower altitude, as expected. The differencein the actual coverage areas between different altitudes is little. The smallest serviceareas (with −80 dBm coverage threshold) of 0.14 km2 (ETSI) and 3.51 km2 (FCC) areachieved with the lowest drone altitude (50 m). Likewise, the largest coverage areas arethe result of the highest DAD altitude (500 m) with 0.56 km2 for ETSI and 7.4 km2 forFCC.
The results for urban areas with Manhattan grid are shown in Fig. 5.5. Instead ofshowing the absolute coverage areas, a percentage of the total outdoor area is shownto easily compare the effects of densification. The grid of DADs is centered at thesimulation area. Fig. 5.5a presents the results for ETSI regulation and Fig. 5.5b for FCCregulation. Once again, the coverage area increases as the altitude of drones is larger,but also when the number of serving DADs is increased. The differences between IDDand the number of DADs are clearer with the FCC regulation. For example, 5 × 5 gridwith 960 m IDD in the 150 m altitude is able to provide already slightly better coveragearea than 5 × 5 grid with 480 m IDD in the same altitude.
44

5.2 Low altitude platforms for disaster scenarios
Table 5.2: Simulation environment parameters.
Parameter Valuemodel dominant path
Path loss exponent (LOS) 2 / 2.6 (before / after break point)exponent (OLOS) 3.5area 6 km × 6 km
Calculation resolution 20 m (rural) / 10 m (urban)environment Flat (rural) / Manhattan (urban)building size (urban) 100 m × 100 m
Dimensions building height (urban) 25 mstreet width (urban) 20 m
Drone inter-drone distance 960 m (rural)960 m, 480 m (urban)
UE receiver (UE) antenna height 1.5 m
Table 5.3: Drone parameters.
Parameter Disaster Area Drone
WLAN
standard IEEE 802.11 family [52]frequency band 2.4 GHz / 5.8 GHzbandwidth 20 MHz / 40 MHzmax. EIRP (backhaul) 35 dBmmax. EIRP (emergency coverage) 20 dBm (ETSI) / 36 dBm (FCC)additional losses 2 dB
Antenna
heights (drone altitudes) 50 m, 100 m, 150 m, 200 m, 250 m,300 m 350 m, 400 m, 450 m, 500 m
model (backhaul) HVG-2458-05U [56]model (emergency) NanoStation locoM2 [87]HPBW (backhaul) 360 × 45 (azimuth & zenith)HPBW (emergency) 60 × 60 (azimuth & zenith)tilting (backhaul) -tilting (emergency) 90 (Facing downwards)gain (backhaul) 5 dBigain (emergency) 8.5 dBi
45

INNOVATIVE APPROACHES FOR MITIGATING MOBILE NETWORKSERVICE OUTAGE
Drone altitude [m]
50 100 150 200 250 300 350 400 450 500
Urb
an
area
cov
ered
[%
]
0
20
40
60
80
100
1 Drone (ETSI)
3x3 Grid, 480 m IDD (ETSI)
5x5 Grid, 480 m IDD (ETSI)
7x7 Grid, 480 m IDD (ETSI)
9x9 Grid, 480 m IDD (ETSI)
11x11 Grid, 480 m IDD (ETSI)
3x3 Grid, 960 m IDD (ETSI)
5x5 Grid, 960 m IDD (ETSI)
7x7 Grid, 960 m IDD (ETSI)
(a) Maximum DAD emergency coverage EIRP = 20 dBm (ETSI).
Drone altitude [m]
50 100 150 200 250 300 350 400 450 500
Urb
an
area c
overed
[%
]
0
20
40
60
80
100
1 Drone (FCC)
3x3 Grid, 480 m IDD (FCC)
5x5 Grid, 480 m IDD (FCC)
7x7 Grid, 480 m IDD (FCC)
9x9 Grid, 480 m IDD (FCC)
11x11 Grid, 480 m IDD (FCC)
3x3 Grid, 960 m IDD (FCC)
5x5 Grid, 960 m IDD (FCC)
7x7 Grid, 960 m IDD (FCC)
(b) Maximum DAD emergency coverage EIRP = 36 dBm (FCC).
Figure 5.5: Dense urban environment outdoor coverage for the Manhattan grid. Coveragethreshold limited to −80 dBm.
46

5.3 Macro sensor network
5.2.3 Low altitude platform conclusionsThe coverage aspects of the proposed LAP concept show that the emergency coveragewould be possible to implement with a reasonable number of drones. However, theenergy of drones will present a problem, as the batteries will not last long. This problemcan be partially solved with the so-called persistent drones, which can utilize a thinfilament for providing energy from the ground up to ≈ 120 m (400 ft) [18].
As the capacity aspects were out of the scope in [P6], the two most limiting factor forincreasing the emergency coverage area were the maximum EIRP and the IDD. Changesin the EIRP would need permission from ETSI/FCC and more directive (high gain)antennas would be needed in order to increase IDD. However, this would require moreprecise alignment between the drone antennas.
5.3 Macro sensor networkBesides the availability of electricity, the functionality of cellular networks depends onthe availability of backhaul connection to the CN. Thus, a large part of the mobilenetwork can be temporary down if a (critical) connection is cut off. To improve theresilience of mobile networks in such occasions, [P7] suggests the concept of a macrosensor network (MSN). The idea is to provide a WSN functionality for mobile networksin order to maintain some connectivity to CN.
When the conventional backhaul connection is cut off, BSs stop working, i.e. commu-nication becomes impossible. However, the current mobile networks are very dense, i.e.there is a lot of overlapping between the serving cells. Furthermore, with high masts,LOS connections are possible between different BSs sites. One possibility to enablecommunication would be to relay data directly from one BS to another in the manner ofmulti-relay communication [19]. Multi-relay communication resembles also the so-calledself-backhauling or in-band relaying concepts where the idea is quite the same: enablea connection from the UE to the network through more than one eNB. However, thisideology has not been taken to the macro level in the context of disaster scenarios. Asalready mentioned in Section 3.2, the usual approach to disaster-hit areas is to form anew temporary infrastructure with the help of MANETs. Instead, improving the existingnetwork with the help of the proposed MSN concept would be more suitable.
5.3.1 Macro sensor network conceptThe resilience of mobile networks can be increased by developing mobile network func-tionalities for coping disturbance or disaster scenarios. The MSN presented in this studyis an example of such concepts.
In this study, a disaster scenario means a situation, where the link between the radioaccess network (RAN) and CN is broken. For LTE, this corresponds to a situationwhere the link between eNBs and the evolved packet core (EPC) is unavailable. Whensuch incident occurs, the WSN functionality is activated within eNBs and EPC. Thiskind of automatic process can be considered to be close to that of a self-organizingnetwork (SON). Eventually, the realization of WSN capabilities within LTE utilizes theX2 interface as defined by 3GPP [3]. The X2 interface is essentially a logical connection
47

INNOVATIVE APPROACHES FOR MITIGATING MOBILE NETWORKSERVICE OUTAGE
to enable direct connections between (neighbor) eNBs and the physical connection isnot restricted into a wired connection. Thus, the implementation of the X2 connectionbetween eNBs is eventually vendor-specific and can be implemented even over a wirelesschannel. This capability of LTE is utilized in this macro sensor network concept suchthat the wireless X2 connection is actually implemented with the help of reserving partof the resource blocks to communications between eNBs.
5.3.2 Macro sensor network operational frameworkThe framework for the proposed WSN concept is presented in Fig. 5.6. When the linkbetween eNB and EPC is broken, the functionality of the eNBs and the EPC will switchto “WSN mode”. The eNBs within the disturbance area will switch to WSN mode assoon as the connection to the EPC breaks. Next, eNBs will begin to search for neighboreNBs by sending a discovery message. If the neighbor eNB site has a working backhaulconnection, it sends back an acknowledgment message with “flag 1” to indicate thatcommunication to the EPC is possible through it. If the neighbor eNB is missing thelink to the EPC, it sends back an acknowledgment message with “flag 0” as well asinformation about its one hop neighbors.
EPC will also activate the WSN functionality of those eNBs which are geographicallysituated in the vicinity of the affected area as shown in Fig. 5.7. This is required in orderto enable WSN functionality discovery message flow and finally the actual communicationto the disaster area. When the disaster scenario is over, EPC can send a command toall MSN eNB sites to disable the WSN functionality and return to the normal operationmode.
5.3.3 Macro sensor network conclusionsA realization of a LTE network with WSN functionality, also known as MSN wassuggested in [P7]. The node-to-node or eNB-to-eNB functionality in LTE for MSN wouldenable limited communication for disaster areas where the link between the eNB andEPC is broken, but the eNB sites still have power to maintain operation.
The concept proposed in this study falls to the category of SONs as this MSNfunctionality will need to be implemented as an automated service. This will bringflexibility to the networks to cope with disturbances in the backhaul connections, thusimproving the resilience of the networks. Besides actual disaster or disturbance scenarios,this kind of functionality would also improve the network operations during backhaulmaintenance. However, in order to realize and further develop this kind of functionality,some changes in the 3GPP specifications are eventually needed.
48

5.3 Macro sensor network
eNB
eNB with WSN functionality
search for neighbor eNB
neighbor eNB discovered
neighbor eNB with link to EPC
mark flag 1 for active link with EPC and send to requesting eNB
establish connection with previouseNB with flag 0 for active link with
information about its 1 hop neighbors
neighbor eNB without link to EPC
disaster scenario (no link to EPC)
(hello message, discovery message)
Figure 5.6: Node-to-node (eNB-to-eNB) communication flow chart.
send a command
disaster scenario detected
search for eNB closest to disaster area& enable WSN functionality to accept
link requests
eNB with active EPC link & WSNfunctionality enabled
Figure 5.7: EPC events.
49


CHAPTER 6
Conclusions
Critical infrastructures are the foundations of modern societies. The most critical,known as level 1 infrastructures, are mobile networks and electricity networks.
This thesis concentrated on the aspects of critical communications, thus the studiesperformed for this thesis were considered mainly from the wireless communications field.These include understanding the current “behavior” of subscribers when somethingpartly unexpected occurs, how to improve the existing systems by utilizing the currentequipment, how to improve the restoration of these networks by utilizing new SAS andother innovative approaches in order to mitigate service outages.
6.1 SummaryThe behavior of modern cellular network subscribers in normal situations follows asimilar, predictable, trend over time. However, when an uncommon disturbance scenariooccurs, the particular behavior of subscribers change as was discussed in Section 3.1[P1] in Chapter 3. In short, the subscribers within the disturbance area are more activethan in normal situations. If the network is not capacity limited, as is usually the casein rural areas, the network can be expected to cope with the suddenly increased servicedemand. However, capacity related problems are expected to occur, when operating inhigh loaded areas, such as urban areas as the service demand is expected to increase upto 84 %, thus service blocking starts to limit the availability of mobile network services.
When a disturbance scenario occurs and results in the lack of electricity from themain grid, the disturbance time functionality of mobile networks is limited by theavailability of reserve power. In modern mobile networks, this reserve power is usuallybackup batteries. Thus, the operational time of mobile network BSs is limited by theamount of energy within these batteries. Moreover, the network is configured to try tomaintain normal operation with the help of this reserve power. One possible solution toprolong the mobile network operation utilizing backup batteries in disturbance scenarioswas presented in Section 3.2 [P2] in Chapter 3. By utilizing only a portion of the existingBS sites at a time, and loosening service coverage requirements, around 20 % of BS siteswould be enough to serve roughly 75 % of the disturbance area. Thus, the disturbance
51

CONCLUSIONS
time functionality could be prolonged several times given that CN and backhaul networkare also operational during this time period.
One of the most important parts of restoring the possibly damaged infrastructure isdisaster management. It includes everything required in order to normalize the situationand one essential tool for it is a situation awareness system as developed and presented inChapter 4 [P3–P4]. The new SAS developed for this purpose combines the information oftwo critical infrastructures: mobile networks and electricity networks. The user interfaceof the developed SAS is a map view, where the actual faults and the affected areas inthe operative networks are visualized in near real-time. The most obvious benefit of thissystem is the combined view of both networks. Thus, information regarding both ofthem are easy to observe at the same time and e.g. the prioritization of maintenanceand repair actions are more fluent by taking into account the interdependencies betweenthese networks as provided in the SAS. Furthermore, the SAS helps to build a moreaccurate SA that e.g. authorities, and fire and rescue services can utilize for publicsafety actions.
The innovative approaches to mitigating mobile network service outage were presentedin Chapter 5 with Sections 5.1–5.3 focusing on Publications [P5–P7]. First, in Section 5.1[P5], the focus was on guiding mobile network subscribers indirectly to self-optimizetheir location such that the channel conditions were improved. Thus, the overall impacton the system level saves both energy and capacity within mobile networks. Next, thecoverage possibilities of a temporary LAP network were investigated with the help ofdrones in Section 5.2 [P6]. The obtained results show that this kind of approach could beutilized for a limited area with a reasonable number of drones. Finally, the possibilitiesof bringing WSN capabilities into cellular networks were suggested in Section 5.3 [P7].The MSN concept was based on reconnecting eNB sites without a link to EPC throughother eNBs in a relay type of manner. The actual implementation of such system wouldrequire SON features and changes into 3GPP specifications, but the outcome of suchsystem would remarkably improve the resilience of mobile networks.
6.2 Discussion and further development
It is well-known that after disaster scenarios mobile networks will either immediatelystop working because of destroyed infrastructure or relatively fast after the incident as aresult of a power blackout in the electricity network. If the cellular network retains itscapability to function, the huge surge in cellular network service demand will most likelyprevent the utilization of the network. However, the effects of disturbance scenarios, i.e.the “milder” versions of disaster scenarios and their effects on service demand are notusually studied. Thus, publications on the topic are hard to find. The results in thisthesis provide this information, i.e. results from an uncommon disturbance scenario inmodern society. This information provides insight on how to design the networks towithstand the capacity increase caused by disturbance scenarios. In order to deepen thisknowledge and to keep up with the development of mobile networks, future studies areneeded to generalize the achieved results and to observe the impact of the upcoming 5Gnetworks e.g. on subscriber service behavior.
52

6.2 Discussion and further development
The so-called green or energy-efficient communications approach for cellular networkstargets to save and reduce the energy these networks consume and the majority ofenergy consumption relates to BSs. The existing approaches in this field are mostlydifferent strategies to shortly switching off BSs during low traffic time periods. Thestudies performed in this thesis are a state of the art for considering saving the energyof BSs in disturbance scenarios. Conventionally this kind of approach is not utilized inorder to retain full mobile network service coverage after disturbances. However, it ismore beneficial to prolong the availability of a mobile network at the expense of reducingthe QoS than having full service coverage for a shorter period of time. As the results ofthis thesis are based on a theoretical BS site layout, a clear future topic in this area isto model an operative mobile network layout and apply the utilized approach to it.
The situation awareness system presented in this thesis is a state of the art tool formodern societies. Disturbance management is very important in order to recover froma disturbance scenario and the developed SAS provides a solution to handle it. Themost obvious benefit of the developed system is the combination of both of the mostcritical infrastructures. The challenges in these kind of new systems are usually relatedto gaining access to the operative data of several different companies. Thus, in order toset up this kind of a system e.g. for a whole country requires a great deal of cooperationand means the be able to receive data from many different kinds of companies. As aresult, successfully implementing this kind of a system for broad utilization requiresmost likely either a legislation or at least some sort of regulation.
Innovative methods are always needed in any (research) field. As the name suggests,the target is to find new perspectives to (improve) existing solutions. The studies inthis thesis presented a few different possibilities related to finding innovative methods.By definition, these present state of the art approaches for mitigating mobile networkoutage or improving their resiliency. However, more studies are needed in these newapproaches in order to eventually implement these features into existing mobile networks.Therefore, this is especially interesting and fruitful research area for future studies.
Altogether, this thesis emphasizes the importance of critical infrastructures anddifferent approaches on how to improve the current mobile networks. The obtainedresults provide insight on how to develop the current and future mobile networks towardmore resilient infrastructures in order to improve the critical communications partespecially in disturbance (and disaster) scenarios. In addition, the contributions inthis thesis can be utilized in the future, e.g., as a starting point to develop a newstate for mobile networks called a safety mode. It could change the functionality ofmobile networks such that the critical communication can be sustained better duringdisturbance or disaster scenarios.
53


References
[1] 3GPP TR 25.816 version 8.0.0, “Technical specification group radio access network;UMTS 900 MHz work item technical report (Release 8),” 3rd Generation PartnershipProject (3GPP), Tech. Rep., 2009.
[2] 3GPP TS 25.211 version 3.12.0, “Universal mobile telecommunications system(UMTS); Physical channels and mapping of transport channels onto physical chan-nels (FDD),” 2002.
[3] 3GPP TS 36.423 version 12.3.0, “LTE; Evolved universal terrestrial radio accessnetwork (E-UTRAN); X2 application protocol (X2AP),” 2014.
[4] 5G-PPP, ERTICO, EFFRA, EUTC, NEM, CONTINUA and Networld2020ETP, 5G empowering vertical industries, Feb. 2016. [Online]. Available:https://5g-ppp.eu/wp-content/uploads/2016/02/5PPP-FLYER_BAT_PL-.pdf
[5] 980/2012, Act on Supporting the Functional Capacity of the Older Populationand on Social and Health Care Services for Older Persons, 2012, Ministry ofSocial Affairs and Health, Finland. [Online]. Available: http://www.finlex.fi/en/laki/kaannokset/2012/en20120980.pdf
[6] A. Ali and S. E. Elavoubi, “Design and performance evaluation of site sleep modein LTE mobile networks,” in Proc. 26th International Teletraffic Congress (ITC),Sep. 2014, pp. 1–6.
[7] Altair Engineering, Inc., WinProp - Urban and Suburban: Propagation Models.[Online]. Available: http://www.altairhyperworks.com/product/FEKO/WinProp---Urban-and-Suburban
[8] L. Appleby, Connecting the last mile: The role of communicationsin the Great East Japan earthquake, Mar. 2013. [Online]. Avail-able: https://www.internews.org/sites/default/files/resources/InternewsEurope_Report_Japan_Connecting_the_last_mile_Japan_2013.pdf
55

REFERENCES
[9] A. Asp, Y. Sydorov, M. Keskikastari, M. Valkama, and J. Niemelä, “Impact ofmodern construction materials on radio signal propagation: Practical measurementsand network planning aspects,” in Proc. IEEE 79th Vehicular Technology Conference(VTC-Spring), May 2014, pp. 1–7.
[10] ATDI, ICS Designer. [Online]. Available: http://www.atdi.com/ics-designer/
[11] İ. Bekmezci, O. K. Sahingoz, and Ş. Temel, “Flying ad-hoc networks (FANETs): Asurvey,” Ad Hoc Networks, vol. 11, no. 3, pp. 1254–1270, May 2013.
[12] D. P. Bernardon, V. J. Garcia, M. Sperandio, J. L. Russi, E. F. B. Daza, andL. Comassetto, “Automatic reestablishment of power supply in distribution systemsusing smart grid concepts,” in Proc. IEEE/PES Transmission and DistributionConference and Exposition: Latin America (T&D-LA), Nov. 2010, pp. 44–49.
[13] D. Bertsekas and R. Gallager, Data Networks (2nd edition). Prentice-Hall, 1992.
[14] CEN/CENELEC/ETSI Joint Working Group on Standards for Smart Grids,Final report of the CEN/CENELEC/ETSI Joint Working Group on Standards forSmart Grids, 2011. [Online]. Available: ftp://ftp.cen.eu/CEN/Sectors/List/Energy/SmartGrids/SmartGridFinalReport.pdf
[15] D. Cichon and T. Kümer, “Chapter 4: Propagation prediction models,” in Digitalmobile radio towards future generation systems – final report, COST Action 231,Ed. European Commission, Tech. Rep., 1999, pp. 115–208.
[16] M. Conti and S. Giordano, “Mobile ad hoc networking: milestones, challenges, andnew research directions,” Communications Magazine, IEEE, vol. 52, no. 1, pp.85–96, Jan. 2014.
[17] L. M. Correia, D. Zeller, O. Blume, D. Ferling, Y. Jading, I. Gódor, G. Auer, andL. Van der Perre, “Challenges and enabling technologies for energy aware mobileradio networks,” IEEE Communications Magazine, vol. 48, no. 11, pp. 66–72, Nov.2010.
[18] CyPhy Works Inc., The Persistent Aerial Reconnaissance and Communications(PARC) vehicle system, 2016. [Online]. Available: http://cyphyworks.com/parc
[19] W. Dang, M. Tao, H. Mu, and J. Huang, “Subcarrier-pair based resource alloca-tion for cooperative multi-relay OFDM systems,” IEEE Transactions on WirelessCommunications, vol. 9, no. 5, pp. 1640–1649, May 2010.
[20] Directive 2010/31/EU, Energy performance of buildings (recast), 2010. [Online].Available: http://eur-lex.europa.eu/eli/dir/2010/31/oj
[21] DNA Oyj, Häiriökartta, Finnish. [Online]. Available: https://kartat.dna.fi/Hairiokartta/
[22] DNA Oyj, Kuuluvuus ja peittoalueet, Finnish. [Online]. Available: https://www.dna.fi/kuuluvuus-ja-peittoalueet
56

REFERENCES
[23] F. Edström and L. Söder, “Impact of remote control failure on power systemrestoration time,” in Proc. IEEE 11th International Conference on ProbabilisticMethods Applied to Power Systems (PMAPS), Jun. 2010, pp. 343–347.
[24] Elisa Oyj, Elisan häiriökartta, Finnish. [Online]. Available: https://elisa.fi/kartat/#mobile
[25] Elisa Oyj, kuuluvuus, Finnish. [Online]. Available: https://elisa.fi/kuuluvuus/
[26] M. R. Endsley, “Toward a theory of situation awareness in dynamicsystems,” Human Factors: The Journal of the Human Factors and ErgonomicsSociety, vol. 37, no. 1, pp. 32–64, Mar. 1995. [Online]. Available: http://hfs.sagepub.com/content/37/1/32.abstract
[27] Ericsson, Ericsson Mobility Report - On the Pulse of the Networked Society,Nov. 2016. [Online]. Available: https://www.ericsson.com/res/docs/2016/ericsson-mobility-report-2016.pdf
[28] ETSI EN 300 328 version 1.8.1, “Electromagnetic compatibility and Radio spectrummatters (ERM); Wideband transmission systems; Data transmission equipmentoperating in the 2,4 GHz ISM band and using wide band modulation techniques;Harmonized EN covering the essential requirements of article 3.2 of the R&TTEDirective,” 2012, European Telecommunications Standards Institude.
[29] FCC, “Code of Federal Regulations, Title 47, Part 15 (47 CFR 15),” FederalCommunications Commission.
[30] FEMA, Hurricane Sandy FEMA After-Action Report, Jul. 2013. [Online].Available: https://www.fema.gov/media-library-data/20130726-1923-25045-7442/sandy_fema_aar.pdf
[31] FICORA 54 B/2014 M, Regulation on resilience of communications networksand services., Dec. 2014, Finnish Communications Regulatory Author-ity. Finnish. [Online]. Available: https://www.viestintavirasto.fi/attachments/maaraykset/Viestintavirasto54B2014M.pdf
[32] FICORA 57 A/2012 M, On the maintenance of communications networks andcommunications services, procedures, and notifications in the event of faultsand disturbances, Jan. 2012, Finnish Communications Regulatory Authority.Unofficial translation to English. [Online]. Available: https://www.viestintavirasto.fi/attachments/maaraykset/Viestintavirasto57A2012M_EN.pdf
[33] Finnish Communications Regulatory Authority, FICORA’s MONITORi ser-vice. [Online]. Available: https://www.viestintavirasto.fi/en/statisticsandreports/generalinformation/monitoriservice.html
[34] Finnish Communications Regulatory Authority, MONITORi. [Online]. Available:https://eservices.ficora.fi/monitori/area
57

REFERENCES
[35] Finnish Communications Regulatory Authority, Häiriöt kartalla – Vi-estintäviraston uusi MONITORi-palvelu, Nov. 2013, Finnish. [Online].Available: https://www.viestintavirasto.fi/viestintavirasto/ajankohtaista/2013/hairiotkartalla-viestintavirastonuusimonitori-palvelu.html
[36] Google, Loon for all. [Online]. Available: http://www.google.com/loon/
[37] Government of Nepal, Nepal earthquake 2015: Post Disaster RecoveryFramework, Apr. 2016. [Online]. Available: http://reliefweb.int/sites/reliefweb.int/files/resources/PDRF%20Report_FINAL10May.pdf
[38] GSA – Global mobile Suppliers Association, Mobile fast facts, Aug. 2016. [Online].Available: http://gsacom.com/paper/gsa-fast-facts-august-2016/
[39] Y. Gu, M. Zhou, S. Fu, and Y. Wan, “Airborne WiFi networks through directionalantennae: An experimental study,” in Proc. IEEE Wireless Communications andNetworking Conference (WCNC), Mar. 2015, pp. 1314–1319.
[40] C. Han, T. Harrold, S. Armour, I. Krikidis, S. Videv, P. M. Grant, H. Haas, J. S.Thompson, I. Ku, C.-X. Wang, T. A. Le, M. R. Nakhai, J. Zhang, and L. Hanzo,“Green radio: radio techniques to enable energy-efficient wireless networks,” IEEECommunications Magazine, vol. 49, no. 6, pp. 46–54, Jun. 2011.
[41] Z. Hasan, H. Boostanimehr, and V. K. Bhargava, “Green cellular networks: A survey,some research issues and challenges,” IEEE Communications Surveys Tutorials,vol. 13, no. 4, pp. 524–540, Apr. 2011.
[42] H. Hashemi, “The indoor radio propagation channel,” Proceedings of the IEEE,vol. 81, no. 7, pp. 943–968, Jul. 1993.
[43] M. Hata, “Empirical formula for propagation loss in land mobile radio services,”IEEE Transactions on Vehicular Technology, vol. 29, no. 3, pp. 317–325, Aug. 1980.
[44] H. Holma and A. Toskala, WCDMA for UMTS. John Wiley & Sons, Ltd, 2007.
[45] S. Horsmanheimo, N. Maskey, L. Tuomimäki, H. Kokkoniemi-Tarkkanen, andP. Savolainen, “Evaluation of interdependencies between mobile communicationand electricity distribution networks in fault scenarios,” in 2013 IEEE InnovativeSmart Grid Technologies-Asia (ISGT Asia), Nov. 2013, pp. 1–6.
[46] Hutchison 3G UK Limited, Check coverage & network status. [Online]. Available:http://www.three.co.uk/Discover/Network/Coverage
[47] Informa UK Ltd., The case of rural data services and satellite backhaul(White Paper), 2012. [Online]. Available: http://www.o3bnetworks.com/wp-content/uploads/2015/02/Informa-o3b_rural-data-services_online.pdf
[48] International Telecommunication Union, Tampere Convention - A Life-Saving Treaty. [Online]. Available: http://www.itu.int/en/ITU-D/Emergency-Telecommunications/Pages/TampereConvention.aspx
58
REFERENCES
[49] International Telecommunication Union, Tampere Convention, 1998. [Online]. Avail-able: http://www.itu.int/en/ITU-D/Emergency-Telecommunications/Documents/Tampere_Convention/Tampere_convention.pdf
[50] International Telecommunication Union, Tampere Convention on EmergencyTelecommunications Comes Into Force, 2005. [Online]. Available: http://www.itu.int/newsroom/press_releases/2005/01.html
[51] internet.org by Facebook, Connectivity Lab. [Online]. Available: https://info.internet.org/en/story/connectivity-lab/
[52] ISO/IEC/IEEE 8802-11:2012(E), “Information technology – Telecommunicationsand information exchange between systems – Local and metropolitan area networks– Specific requirements – Part 11: Wireless LAN medium access control (MAC)and physical layer (PHY) specifications,” Institute of Electrical and ElectronicsEngineers, Standard 802.11TM-2012, 2012, pp. 1–2798.
[53] J. Itkonen, V. Salomaa, and J. Lempiäinen, “Air interface capacity for GPRS/EDGEover GSM traffic load,” in Proc. IEEE 56th Vehicular Technology Conference (VTC-Fall), vol. 1, Dec. 2002, pp. 396–400.
[54] J. Itkonen, B. Tuzson, and J. Lempiäinen, “Assessment of network layoutsfor CDMA radio access,” EURASIP Journal on Wireless Communicationsand Networking, vol. 2008, no. 1, p. 259310, Aug. 2008. [Online]. Available:http://jwcn.eurasipjournals.com/content/2008/1/259310
[55] S. S. Jadhav, A. V. Kulkarni, and R. Menon, “Mobile ad-hoc network (MANET)for disaster management,” in Proc. Eleventh International Conference on Wirelessand Optical Communications Networks (WOCN), Sep. 2014, pp. 1–5.
[56] L-com, Inc., HyperLink Wireless 2.4/5.8 GHz Omnidirectional antennas, 2015.[Online]. Available: http://www.l-com.com/multimedia/datasheets/DS_HGV-2458-XXU.PDF
[57] P. Lähdekorpi, T. Isotalo, K. Kylä-Liuhala, and J. Lempiäinen, “Replacing terres-trial UMTS coverage by HAP in disaster scenarios,” in Proc. European WirelessConference (EW), Apr. 2010, pp. 14–19.
[58] J. Laiho, A. Wacker, and T. Novosad, Radio Network Planning and Optimizationfor UMTS. John Wiley & Sons, 2006.
[59] J. Lempiäinen and M. Manninen, UMTS Radio Network Planning, Optimizationand Qos Management: For Practical Engineering Tasks. Norwell, MA, USA: KluwerAcademic Publishers, 2004.
[60] T. G. Lewis, Critical Infrastructure Protection in Homeland Security: Defending aNetworked Nation (2). John Wiley & Sons, 2014.
[61] L. Liechty, E. Reifsnider, and G. Durgin, “Developing the best 2.4 GHz propagationmodel from active network measurements,” in Proc. IEEE 66th Vehicular TechnologyConference (VTC), Sep. 2007, pp. 894–896.
59

REFERENCES
[62] J. Lorincz, T. Garma, and G. Petrovic, “Measurements and modelling of basestation power consumption under real traffic loads,” Sensors (Basel, Switzerland),vol. 12, no. 4, pp. 4181–4310, Mar. 2012.
[63] J. Manyika, M. Chui, B. Brown, J. Bughin, R. Dobbs, C. Roxburgh, and A. H.Byers, Big data: The next frontier for innovation, competition, and productivity,2011. [Online]. Available: http://www.mckinsey.com/business-functions/digital-mckinsey/our-insights/big-data-the-next-frontier-for-innovation
[64] M. A. Marsan, L. Chiaraviglio, D. Ciullo, and M. Meo, “On the effectiveness ofsingle and multiple base station sleep modes in cellular networks,” ComputerNetworks, vol. 57, no. 17, pp. 3276–3290, Dec. 2013. [Online]. Available:http://www.sciencedirect.com/science/article/pii/S1389128613002429
[65] A. McAfee and E. Brynjolfsson, “Big data: The management revolution,” HarvardBusiness Review, vol. 90, no. 10, pp. 61–67, Oct. 2012.
[66] S. Morosi, P. Piunti, and E. D. Re, “Sleep mode management in cellular networks:a traffic based technique enabling energy saving,” Transactions on EmergingTelecommunications Technologies, vol. 24, no. 3, pp. 331–341, Feb. 2013. [Online].Available: http://dx.doi.org/10.1002/ett.2621
[67] National Instruments, Introduction to Wireless LAN Measurements – From 802.11ato 802.11ac, 2015. [Online]. Available: http://download.ni.com/evaluation/rf/Introduction_to_WLAN_Testing.pdf
[68] Nokia, Flexi Multiradio 10 Base Station. [Online]. Available: http://resources.alcatel-lucent.com/asset/200091
[69] Nokia Networks, 5G masterplan - five keys to create the new communications era(White Paper). [Online]. Available: http://resources.alcatel-lucent.com/asset/200316
[70] NTT DoCoMo, Deployment Status of the New Disaster Preparedness Measures,Feb. 2012. [Online]. Available: https://www.nttdocomo.co.jp/english/info/media_center/pr/2012/pdf/20120223_attachment02.pdf
[71] E. Oh, B. Krishnamachari, X. Liu, and Z. Niu, “Toward dynamic energy-efficientoperation of cellular network infrastructure,” IEEE Communications Magazine,vol. 49, no. 6, pp. 56–61, Jun. 2011.
[72] J. Pagotto and D. O’Donnell, “Canada’s multi-agency situational awareness system:Keeping it simple,” in Proc. 9th International Conference on Information Systemsfor Crisis Response and Management (ISCRAM), Jan. 2012.
[73] U. Paul, R. Crepaldi, J. Lee, S.-J. Lee, and R. Etkin, “Characterizing WiFi linkperformance in open outdoor networks,” in Proc. IEEE 8th Annual CommunicationsSociety Conference on Sensor, Mesh and Ad Hoc Communications and Networks(SECON), Jun. 2011, pp. 251–259.
60
REFERENCES
[74] A. Polydoros, N. Dimitriou, G. Baldini, I. N. Fovino, M. Taddeo, and A. M.Cipriano, “Public protection and disaster relief communication system integrity: Aradio-flexibility and identity-based cryptography approach,” Vehicular TechnologyMagazine, IEEE, vol. 9, no. 4, pp. 51–60, Dec. 2014.
[75] L. Sassatelli, A. Ali, M. Panda, T. Chahed, and E. Altman, “Reliable transportin delay-tolerant networks with opportunistic routing,” Wireless Communications,IEEE Transactions on, vol. 13, no. 10, pp. 5546–5557, Oct. 2014.
[76] A. Schweer, K. Schaum, D. Hollmach, and A. Dressler, “A new grid driven approachto guarantee reliable communication during power outages,” in Proc. 22nd Interna-tional Conference and Exhibition on Electricity Distribution (CIRED), Jun. 2013,pp. 1–4.
[77] J. Strandén, H. Krohns, P. Verho, and J. Sarsama, “Major disturbances – develop-ment of preparedness in Finland during the last decade,” in Proc. 21st InternationalConference on Electricity Distribution, Jun. 2011, p. 4.
[78] Tele2 AB, Driftkarta Mobilnätet, Swedish. [Online]. Available: http://www.tele2.se/tackning/driftstorning-mobilnat/
[79] Telefónica UK Limited, Check coverage and network status. [Online]. Available:http://www.o2.co.uk/coveragechecker
[80] Telenor AB, Driftkarta, Swedish. [Online]. Available: http://www.telenor.se/kundservice/drift-och-tackning/driftinformation/driftkarta/
[81] Telia Company AB, Driftinformation - Mobil telefoni, Swedish. [Online]. Available:https://www.telia.se/privat/driftinformation/mobiltelefoni
[82] Telia Finland Oyj, Matkapuhelinverkon häiriökartta, Finnish. [Online]. Available:https://www.telia.fi/asiakastuki/verkko/verkko/hairiokartta
[83] Telia Finland Oyj, Verkkokartta, Finnish. [Online]. Available: https://www.telia.fi/asiakastuki/verkko/verkko/verkkokartta
[84] The MathWorks, Inc., MATLAB. [Online]. Available: https://www.mathworks.com/products/matlab.html
[85] G. Tuna, T. V. Mumcu, and K. Gulez, “Design strategies of unmanned aerial vehicle-aided communication for disaster recovery,” in Proc. 9th International Conferenceon High Capacity Optical Networks and Enabling Technologies (HONET), Dec. 2012,pp. 115–119.
[86] G. Tuna, B. Nefzi, and G. Conte, “Unmanned aerial vehicle-aided communicationssystem for disaster recovery,” Journal of Network and Computer Applications,vol. 41, pp. 27–36, 2014.
[87] Ubiquiti Networks, Inc., NanoStation M / NanoStation Loco M Datasheet, 2015.[Online]. Available: https://dl.ubnt.com/datasheets/nanostationm/nsm_ds_web.pdf
61

REFERENCES
[88] Virgin Mobile Australia, Network coverage. [Online]. Available: http://www.virginmobile.com.au/coverage/
[89] N.-S. Vo, T. Q. Duong, and M. Guizani, “Quality of sustainability optimizationdesign for mobile ad hoc networks in disaster areas,” in Proc. IEEE Global Commu-nications Conference (GLOBECOM), Dec. 2015, pp. 1–6.
[90] Vodafone Limited, Check our network. [Online]. Available: https://www.vodafone.co.uk/explore/network/uk-coverage-map/
[91] R. Wahl, G. Wölfe, P. Wertz, P. Wildbolz, and F. Landstorfer, “Dominant pathprediction model for urban scenarios,” in Proc. IEEE IST Mobile & WirelessCommunications Summit, Jun. 2005.
[92] R. Wahl and G. Wölfle, “Combined urban and indoor network planning usingthe dominant path propagation model,” in Proc. First European Conference onAntennas and Propagation (EuCAP), Nov. 2006, pp. 1–6.
[93] G. Wölfle and F. M. Landstorfer, “Dominant paths for the field strength prediction,”in Proc. IEEE 48th Vehicular Technology Conference (VTC), vol. 1, May 1998, pp.552–556.
[94] J. Wu, Y. Zhang, M. Zukerman, and E. K. N. Yung, “Energy-efficient base-stationssleep-mode techniques in green cellular networks: A survey,” IEEE CommunicationsSurveys Tutorials, vol. 17, no. 2, pp. 803–826, Feb. 2015.
62

Publications
63

Publication 1
J. Säe and J. Lempiäinen, “Mobile Network Service Demand in case of Electricity NetworkDisturbance Situation,” in Proceedings of the IEEE 27th International Symposium onPersonal, Indoor, and Mobile Radio Communication (PIMRC), Valencia, Spain, 4.-7.Sep. 2016. DOI: 10.1109/PIMRC.2016.7794961
Copyright c© 2016 IEEE. Reprinted, with permission, from the Proceedings of IEEE27th International Symposium on Personal, Indoor, and Mobile Radio Communication(PIMRC).
In reference to IEEE copyrighted material which is used with permission in this thesis, theIEEE does not endorse any of Tampere University of Technology’s products or services. In-ternal or personal use of this material is permitted. If interested in reprinting/republishingIEEE copyrighted material for advertising or promotional purposes or for creatingnew collective works for resale or redistribution, please go to http://www.ieee.org/publications_standards/publications/rights/rights_link.html to learn how toobtain a License from RightsLink.
65


Mobile Network Service Demand in case ofElectricity Network Disturbance Situation
Joonas Sae and Jukka LempiainenDepartment of Electronics and Communications Engineering
Tampere University of Technology (TUT)Tampere, FINLAND
Email: [email protected], [email protected]
Abstract—The aim of this study is to analyze how cellularnetwork subscribers behave during an electricity network distur-bance situation. Furthermore, removing the effect of randomlyaccessing the network could improve especially the speech ca-pacity during these events. When part of the mobile networkis unavailable, the availability of the cellular network servicesdecreases. However, the subscribers have increased demand forservices during disturbance scenarios since they fetch informationfrom the Internet and try to contact their family and friends.The analysis in this paper shows that even an uncommon powerblackout resulted in an increase of 73 % in new calls and 84 % inthe number of short message service (SMS) demand for mobilenetwork services in a rural area.
Index Terms—Availability, mobile networks, disturbance, dis-aster, blackout, service demand, rural.
I. INTRODUCTION
After any major incident, such as a natural disaster scenario,the service demand behavior of mobile network subscriberschanges. Traditionally, the large-scale statistics of the mobilenetwork traffic from any region, like a certain city or even alarger area of a municipality, follow a certain routine day afterday. This includes normally: a very low network usage timeperiod during the night; some high service demand hours, theso called busy hours, that occur usually during lunch time orafter work hours when people make calls to their families andfriends; and other mediocre network usage time periods duringthe day. This cycle repeats day after day and has a specificprofile which can be noticed from the statistics. The profilesfor working days, i.e. from Monday to Friday, are very similar,but the profiles for the weekends are slightly different. This canactually be already noticed on Friday evenings as subscriberstend to prepare for the weekend, thus usually increasing theservice demand.
The mobile network traffic profiles tend to repeat similarlyweek after week. It is also normal to observe a change inthe traffic profiles when the season changes, e.g. from springto summer as people have holidays that break the normalcycle. If there are some major changes or uncommon events,their affect can also be noticed from the statistics. A largegathering of people can be noticed from the statistics withincreased traffic and blocking rates as the mobile networkcapacity is not dimensioned for these events. They can include,among others, rock concerts, sports events or festivals that
gather massive amounts of people. Thus, the network at theselocations can not meet the demand requirements set by thetemporarily increased number of subscribers and results tolack of service for the portion of the demand that exceeds theplanned service capacity for that specific area. However, thereis usually some information available in advance for these kindof events and mobile operators can set up some extra capacitywith movable base stations (BSs) for these areas in order totemporarily increase the capacity to meet the expected servicedemand increase.
This is not the same for sudden, unexpected network distur-bances or disaster scenarios. These can include, among others,storms that cause destruction to electricity networks resultingeventually in power outages. This relates back to mobilenetwork BSs since their functionality depends on the avail-ability of electricity. In Finland, the Finnish CommunicationsRegulatory Authority (FICORA) has assigned that cellularnetwork BSs sites must have backup power for two to fourhours depending on the type and the environment of the BSs,i.e. whether the equipment is located inside a private propertyin urban area or a mast in rural area [1]. This should guaranteethat mobile networks continue to operate (voice and data) atleast few hours after a power blackout, but this again dependson the condition of the backup batteries or other reserve powerat the BS sites with respect to the service demand. However,this does not guarantee the availability of mobile networkservices at those locations. This is because the service demandincreases as the subscriber behavior changes, which results inthe cellular network not being able to handle all the increasedtraffic, i.e. the capacity is not planned to cope with the extratraffic caused by disturbance or disaster scenarios. It should benoted that the behavior of the subscribers might be dissimilarin different environments, i.e. the users in rural areas mightbe more used to power blackouts than users in urban areas.The cause of the disaster scenario also affects the behavior ofthe subscribers as large natural disasters will result in morepanic among the citizen than an uncommon blackout, e.g. inthe electricity network.
This paper presents a study performed in Finland, whereone regional electricity network power blackout (caused by astorm) was analyzed from the mobile network statistics pointof view. The target is to show how the cellular network traf-
fic demand changes according to an unexpected, uncommonevent. This helps to understand how the networks should bedesigned to prepare for possible disturbance scenarios or whatare the possible problems that should be taken into account.Furthermore, the situation could be improved with guidelineson how to utilize the network in these disturbance situationswith some modifications on the basic principles for accessingthe network.
II. BACKGROUND
Mobile network capacity dimensioning is initially based onthe number of potential subscribers and some assumptions.These include e.g. how often calls are made and how longthese calls should last or what other kind of services could beexpected. Moreover, the target is to offer suitable capacity tosubscribers with minimal costs, i.e. the network should be fullyutilized in the busiest time periods. This way the operatorsdo not have to invest in additional capacity and the networkoperation should be cost-efficient.
A. Random service access
Mobile network capacity depends heavily on the offeredservices and the user behavior. A general assumption is thatusers may move and utilize services freely and randomly any-where and any time. For traditional speech users, a relativelyaccurate modeling based on Poisson process can be utilized.In a Poisson process, users have a random length of a calland follow the negative exponential curve [2], [3], i.e. theprobability density function is defined as
p(T ) = µe−µT , (1)
where T denotes the time of the arriving call and 1/µ is theaverage call duration. In addition, users have random timebetween the calls, also following the negative exponentialcurve and the probability density function is, respectively
p(T ) = λe−λT , (2)
and 1/λ is the average inter-arrival time. When both thelength of the calls and the arrival time of the calls arerandom, the most interesting value is the probability of auser not being able to make a call. The well-known Erlang-Bformula (without queuing) can be defined [3] and the blockingprobability pm is defined as
pm =
(λµ
)m/m!
m∑
n=0
(λ
µ
)n/n!
, (3)
where m is the number of channels that are busy and n is thenumber of total channels in the system.
Erlang-B formula gives estimation about the availablespeech traffic of a certain configuration (the amount of chan-nels) when certain blocking probability is expected, and whenthe subscriber call behavior is random. In [2], a comparison
is shown for a traditional one transceiver (TRX) BS having7 traffic channels (1 channel reserved for signaling) in globalsystem for mobile communication (GSM). Erlang-B formulaprovides 2.5Erl traffic in case of 1% blocking probability.Measurements from the real network give 2.0Erl traffic and0.4% blocking i.e. practical values follow the theoreticalcalculations quite well. The theoretical maximum capacity(7 traffic channels, without blocking) would be 7Erl if callershave a certain allocated time slot for a service and no gapsexist between the channel allocation in the time domain. Thus,4.5Erl of capacity is missed in order to have freedom forusers to make calls randomly, and simultaneously to keep theblocking at the level of 1%. Thus, to increase the availablecapacity in disturbance or disaster scenarios, the randomnessof call lengths and times could be temporarily disabled andspecific time slots could be reserved for different users in thedisturbance area. For example, in 1 TRX GSM case, capacitycan be increased from 2.5Erl theoretically up to 7Erl (with0% blocking) meaning a notable capacity increase in thisvery limited configuration. The same 7Erl capacity would beachieved with 24.9% blocking if randomness would remain.This will obviously need some algorithms to allocate ”callslots” so that the subscribers in these areas know when theycan make their calls. The emergency calls should get throughin all situations, but for the not-so-time-critical-calls thismethod should provide some fairness among the subscribers,e.g. subscribers can not reserve the channels for too long. Asystem of this kind would need some method in order to callor notify the subscribers whose time slot to call is up so thatthe signaling still works without congesting too much.
B. Related work
The impact of disaster scenarios on mobile network traffichas been investigated mostly after major natural disasters. Theauthors in [4] show that the availability of mobile networkswas lowered by 32% in Hurricane Sandy in 2012. Likewise,the authors in [5] show that the cellular network call amountwas increased 60 times the normal demand after the Tsunamihad hit Japan in 2011, resulting in a blocking rate of 95% fornew calls. Thus, the service demand increase is huge in majordisaster scenarios. This paper, however, studies the effectof a smaller, uncommon power blackout on the subscriberbehaviour.
As a suggestion for these enormous service demands, theauthors in [6] show that if the mobile network core isvirtualized, the operation of such network can be improvedduring these events by reprioritizing the cellular network trafficservices. They show that when the call traffic has a sudden50-fold increase, the voice call acceptance rate is around 5%without any modifications on the core network. When thecore network resources are reallocated, the call acceptance isincreased up to 25%, thus improving the overall situation onlyby changing the core services.
Some studies ([7], [8]) also suggest automatic algorithmsand machine learning to discover anomalous patterns in net-work traffic to predict when a major event is about to emerge.
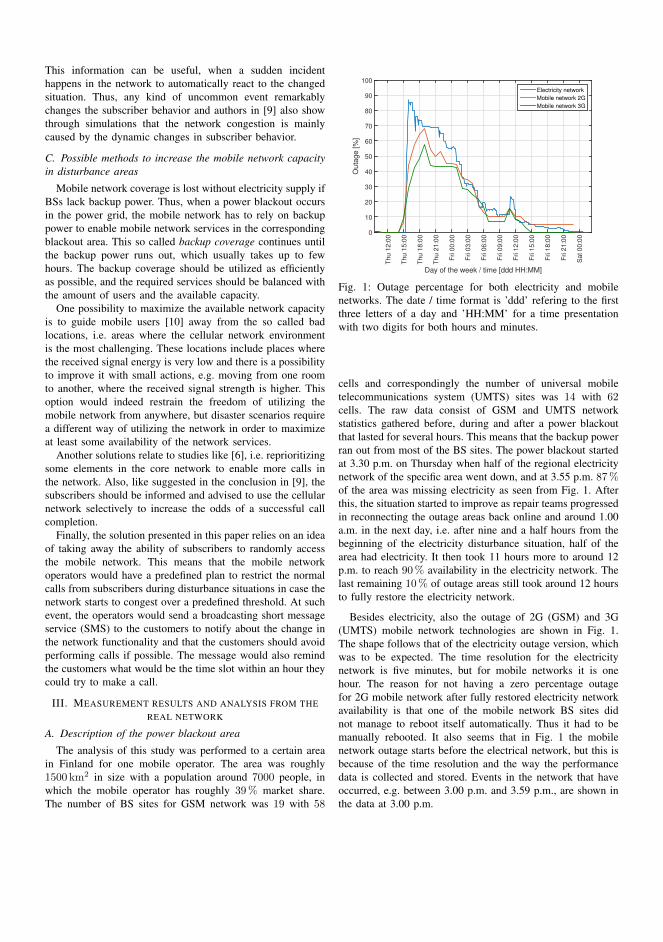
This information can be useful, when a sudden incidenthappens in the network to automatically react to the changedsituation. Thus, any kind of uncommon event remarkablychanges the subscriber behavior and authors in [9] also showthrough simulations that the network congestion is mainlycaused by the dynamic changes in subscriber behavior.
C. Possible methods to increase the mobile network capacityin disturbance areas
Mobile network coverage is lost without electricity supply ifBSs lack backup power. Thus, when a power blackout occursin the power grid, the mobile network has to rely on backuppower to enable mobile network services in the correspondingblackout area. This so called backup coverage continues untilthe backup power runs out, which usually takes up to fewhours. The backup coverage should be utilized as efficientlyas possible, and the required services should be balanced withthe amount of users and the available capacity.
One possibility to maximize the available network capacityis to guide mobile users [10] away from the so called badlocations, i.e. areas where the cellular network environmentis the most challenging. These locations include places wherethe received signal energy is very low and there is a possibilityto improve it with small actions, e.g. moving from one roomto another, where the received signal strength is higher. Thisoption would indeed restrain the freedom of utilizing themobile network from anywhere, but disaster scenarios requirea different way of utilizing the network in order to maximizeat least some availability of the network services.
Another solutions relate to studies like [6], i.e. reprioritizingsome elements in the core network to enable more calls inthe network. Also, like suggested in the conclusion in [9], thesubscribers should be informed and advised to use the cellularnetwork selectively to increase the odds of a successful callcompletion.
Finally, the solution presented in this paper relies on an ideaof taking away the ability of subscribers to randomly accessthe mobile network. This means that the mobile networkoperators would have a predefined plan to restrict the normalcalls from subscribers during disturbance situations in case thenetwork starts to congest over a predefined threshold. At suchevent, the operators would send a broadcasting short messageservice (SMS) to the customers to notify about the change inthe network functionality and that the customers should avoidperforming calls if possible. The message would also remindthe customers what would be the time slot within an hour theycould try to make a call.
III. MEASUREMENT RESULTS AND ANALYSIS FROM THEREAL NETWORK
A. Description of the power blackout area
The analysis of this study was performed to a certain areain Finland for one mobile operator. The area was roughly1500 km2 in size with a population around 7000 people, inwhich the mobile operator has roughly 39% market share.The number of BS sites for GSM network was 19 with 58
Day of the week / time [ddd HH:MM]
Th
u 1
2:0
0
Th
u 1
5:0
0
Th
u 1
8:0
0
Th
u 2
1:0
0
Fri 0
0:0
0
Fri 0
3:0
0
Fri 0
6:0
0
Fri 0
9:0
0
Fri 1
2:0
0
Fri 1
5:0
0
Fri 1
8:0
0
Fri 2
1:0
0
Sa
t 0
0:0
0
Ou
tag
e [
%]
0
10
20
30
40
50
60
70
80
90
100
Electricity network
Mobile network 2G
Mobile network 3G
Fig. 1: Outage percentage for both electricity and mobilenetworks. The date / time format is ’ddd’ refering to the firstthree letters of a day and ’HH:MM’ for a time presentationwith two digits for both hours and minutes.
cells and correspondingly the number of universal mobiletelecommunications system (UMTS) sites was 14 with 62cells. The raw data consist of GSM and UMTS networkstatistics gathered before, during and after a power blackoutthat lasted for several hours. This means that the backup powerran out from most of the BS sites. The power blackout startedat 3.30 p.m. on Thursday when half of the regional electricitynetwork of the specific area went down, and at 3.55 p.m. 87%of the area was missing electricity as seen from Fig. 1. Afterthis, the situation started to improve as repair teams progressedin reconnecting the outage areas back online and around 1.00a.m. in the next day, i.e. after nine and a half hours from thebeginning of the electricity disturbance situation, half of thearea had electricity. It then took 11 hours more to around 12p.m. to reach 90% availability in the electricity network. Thelast remaining 10% of outage areas still took around 12 hoursto fully restore the electricity network.
Besides electricity, also the outage of 2G (GSM) and 3G(UMTS) mobile network technologies are shown in Fig. 1.The shape follows that of the electricity outage version, whichwas to be expected. The time resolution for the electricitynetwork is five minutes, but for mobile networks it is onehour. The reason for not having a zero percentage outagefor 2G mobile network after fully restored electricity networkavailability is that one of the mobile network BS sites didnot manage to reboot itself automatically. Thus it had to bemanually rebooted. It also seems that in Fig. 1 the mobilenetwork outage starts before the electrical network, but this isbecause of the time resolution and the way the performancedata is collected and stored. Events in the network that haveoccurred, e.g. between 3.00 p.m. and 3.59 p.m., are shown inthe data at 3.00 p.m.

B. Mobile network statistics analysis
The figures on the following page, i.e. Fig. 2 and Fig. 3,show the 2G and 3G cellular network statistics before, duringand after the disturbance in the electrical network. The green,orange, and blue bars show some selected key performanceindicators (KPIs) for Wednesday, Thursday, and Friday, re-spectively. The solid, dashed, and dotted lines also showthe availability of the electricity network for Wednesday,Thursday, and Friday. A numerical summary of the data isshown in Table I after the figures.
Fig. 2a shows how the number of new calls differ for eachday. The KPI profile for each weekday is similar, but whenthe availability of the network drops at 3.00 p.m. on Thursday,there is a spike in the number of new calls. This trendcontinues for the whole Thursday evening, which indicatesthat the power blackout has activated subscribers to make morephone calls than usual. The same effect is visible in Fig. 2b; thenumber of new standalone dedicated control channel (SDCCH)seizures peaks when the electricity blackout begins. The effectis also visible during the night between Thursday and Friday,i.e. in the early hours of Friday, most likely due to repairworkers. This is because besides call setups SDCCH alsoincludes location updates and SMSs. In Fig. 2c, the actualcall traffic has some increase compared with the call trafficon Wednesday. From Table I it can be seen that the calltraffic increased from a total of 376 Erl on Wednesday to471 Erl on Thursday, resulting in a total traffic increase of25%. Finally, in Fig. 2d, the data traffic allocated to 2G seemshigher than the reference day (Wednesday), but this is mostlybecause the availability of 3G network is also lower than thenormal situation, which results in part of the data traffic fallingto 2G network. Besides SDCCH seizures, all other KPIs in2G network have a noticeable increase in the values fromWednesday to Thursday followed by a decrease on Friday.
Correspondingly, Fig. 3 shows the situation in 3G networkstatistics. First, in Fig. 3a, the amount of circuit-switched (CS)traffic is shown in Erlangs. This amount is slightly higherbefore and right at the time when the power blackout starts.The amount of CS traffic is reduced after this as the availabilityof the 3G network degrades, however, the reduction is causedby the lack of service availability, not from the reduced CStraffic behaviour, since the CS traffic increases notably as theavailability increases. In Fig. 3b, the amount of downlink (DL)data is shown. A similar effect as in CS traffic is noticeable,i.e. the availability is reducing the data amounts. On the otherhand, the traffic amounts are greatly higher before the powerblackout starts, most likely due to subscribers trying to searchfor information about the storm that eventually caused theelectricity outage. Fig. 3c shows the number of SMSs in 3Gnetwork. The power blackout causes a clear spike in the chartand the amount of SMSs in the entire Thursday evening isclearly higher than in the reference day. Finally, in Fig. 3d, thenumber of radio access bearers (RABs) has a very noticeablespike at the time when the power blackout started.
C. Example of the capacity increase without random access
In the smallest GSM configuration case 1 TRX has 7 trafficchannels meaning capacity of 2.5Erl with 1% blocking prob-ability. With the assumption of one call lasting 90 s, whichis 25mErl, this corresponds to having 100 calls in one hour.The difference with regard to 7Erl means that the numberof calls could be increased theoretically up to 280, i.e. anincrease of 180% for the number of calls would be achieved.This assumes that there is no blocking because of the idea ofpreventing the users from calling randomly.
If this idea is applied to the given GSM configuration of thepower blackout area, the following increase in the capacity canbe noted. The area has 58 TRXs resulting to 464 channels intotal, but actually 435 can only be utilized for calls since 29channels are reserved for signalling purposes (one signalingchannel per two TRX). Thus, 435 traffic channels can supportroughly 410Erl of traffic (16400 calls), whereas theoreticallyup to 435Erl (17400 calls) could be supported. The differenceis additional 1000 calls (6%) in this configuration.
The significant relative difference in the improvement with1% blocking versus the theoretical case in these two examplesare caused by lack of overlapping calls, i.e. the capability ofcalling randomly is removed and perfect call slot allocationis assumed. However, it would be more beneficial to reducethe available capacity in order to save energy to prolongthe cellular network service during these electricity networkdisturbance scenarios. When this idea is combined with thepre-allocation of traffic channels to increase the capacitywith no random access, the offered capacity is higher thanconventionally and the backup coverage lasts longer.
IV. CONCLUSIONS AND DISCUSSION
This paper provided statistics and analysis from an opera-tional mobile network in Finland. The observed results showhow the cellular network subscribers behave in the case ofsmall and uncommon disturbance scenario in the form ofelectricity network blackout in rural area. The statistics fromthe GSM and UMTS networks showed how the subscribermobile network behavior changes when it occurred. Thisbehavior can already be noticed before the actual disturbancetime, e.g. from the amount of DL data, as the subscribers try tofind information related to the possible upcoming disturbanceevent. When the disturbance (i.e. the power blackout in thiscase) had finally occurred, especially the call traffic andthe amount of SMSs had a noticeable spike in the networkstatistics. These include an increase of 73% in the numberof new calls and an increase of 84% in the number ofSMSs compared with the reference day at the time when thedisturbance situation started. The increased service demandtrend continued through the majority of the blackout, i.e.despite the lack of cellular network availability the subscriberscontinued to utilize the network more than usual. It should benoted that the results are based on one disturbance scenarioand the reference day for the analysis is also from only oneday, thus the generalization of these results would requireseveral other study cases. Nevertheless, this study offers data

Time [HH:MM]
00:00 03:00 06:00 09:00 12:00 15:00 18:00 21:00 00:00
New
ca
lls
[pcs
]
0
225
450
675
900
Av
ail
ab
ilit
y [
%]
0
25
50
75
100
Wednesday
Thursday
Friday
Availability (Wed)
Availability (Thu)
Availability (Fri)
(a) The number of new calls.
Time [HH:MM]
00:00 03:00 06:00 09:00 12:00 15:00 18:00 21:00 00:00
SD
CC
H s
eizu
re a
ttem
pts
[p
cs]
0
750
1500
2250
3000
Av
ail
ab
ilit
y [
%]
0
25
50
75
100
Wednesday
Thursday
Friday
Availability (Wed)
Availability (Thu)
Availability (Fri)
(b) The number of new SDCCH seizures.
Time [HH:MM]
00:00 03:00 06:00 09:00 12:00 15:00 18:00 21:00 00:00
Ca
ll t
raff
ic [
Erl
]
0
10
20
30
40
Av
ail
ab
ilit
y [
%]
0
25
50
75
100
Wednesday
Thursday
Friday
Availability (Wed)
Availability (Thu)
Availability (Fri)
(c) Call traffic in Erl.
Time [HH:MM]
00:00 03:00 06:00 09:00 12:00 15:00 18:00 21:00 00:00
PS
tra
ffic
[E
rl]
0
7.5
15
22.5
30
Av
ail
ab
ilit
y [
%]
0
25
50
75
100
Wednesday
Thursday
Friday
Availability (Wed)
Availability (Thu)
Availability (Fri)
(d) PS traffic in Erl.
Fig. 2: 2G statistics from the electricity blackout. The time format is ’HH:MM’ for a time presentationwith two digits for both the hours and minutes.
Time [HH:MM]
00:00 03:00 06:00 09:00 12:00 15:00 18:00 21:00 00:00
CS
tra
ffic
[E
rl]
0
12.5
25
37.5
50
Av
ail
ab
ilit
y [
%]
0
25
50
75
100
Wednesday
Thursday
Friday
Availability (Wed)
Availability (Thu)
Availability (Fri)
(a) CS traffic in Erl.
Time [HH:MM]
00:00 03:00 06:00 09:00 12:00 15:00 18:00 21:00 00:00
DL
da
ta [
Gb
it]
0
75
150
225
300
Av
ail
ab
ilit
y [
%]
0
25
50
75
100
Wednesday
Thursday
Friday
Availability (Wed)
Availability (Thu)
Availability (Fri)
(b) The amount of DL data.
Time [HH:MM]
00:00 03:00 06:00 09:00 12:00 15:00 18:00 21:00 00:00
SM
S [
pcs
]
0
100
200
300
400
Av
ail
ab
ilit
y [
%]
0
25
50
75
100
Wednesday
Thursday
Friday
Availability (Wed)
Availability (Thu)
Availability (Fri)
(c) The number of SMS.
Time [HH:MM]
00:00 03:00 06:00 09:00 12:00 15:00 18:00 21:00 00:00
RA
B a
ttem
pts
, v
oic
e [p
cs]
0
500
1000
1500
2000
Av
ail
ab
ilit
y [
%]
0
25
50
75
100
Wednesday
Thursday
Friday
Availability (Wed)
Availability (Thu)
Availability (Fri)
(d) The number of RAB attempts for voice calls.
Fig. 3: 3G statistics from the electricity blackout. The time format is ’HH:MM’ for a time presentationwith two digits for both the hours and minutes.

TABLE I: 2G and 3G network statistics before, during and after the electricity blackout. The mean and median values presentthe values for one hour.
KPI Wednesday Thursday Fridaytotal mean median std total mean median std total mean median std
2G
The number of new calls [pcs] 5787 241 274 199 7652 319 415 254 6794 283 301 228
The number of new SDCCH seizures [pcs] 25103 1046 1074 450 29890 1245 1380 566 32139 1339 1408 396
Call traffic [Erl] 376 16 21 12 471 20 26 15 434 18 22 13
PS traffic [Erl] 319 13 15 5 358 15 16 6 342 14 15 4
3G
CS traffic [Erl] 536 22 30 16 511 21 23 17 543 23 29 16
The amount of DL data [Gbit] 3958 165 200 84 3714 155 161 72 3429 143 164 70
The number of SMS [pcs] 2577 107 106 66 2952 123 136 82 2498 104 92 55
The number of RAB attempts [pcs] 11088 462 482 372 12012 501 548 420 12188 508 535 394
from an operational mobile network operator, and shows howsubscribers utilize the network during an uncommon blackoutsituation.
In order to cope with the lack of mobile network ser-vices caused by the outages in the electrical network, somepossible solutions were considered. One of these solutionscould be partially restricting the ubiquitous cellular networkexperience, i.e. instead of using the network all the timeand everywhere, some limitations for the services might bebeneficial from the overall network functionality point of view.These limitations should, however, not prevent the real needin the case of life-threatening emergencies, but instead bringsome help to prevent the congestion of cellular networks. Afairly simple solution would include guidelines, i.e. commonrules, which would state that if a power blackout shouldoccur, the subscribers should avoid making unnecessary callsand reduce the cellular network utilization in general. Thissolution, however, is not easy to control since it is only aguideline. Nevertheless, instructions and guidance in advancewould increase the probability of unnecessary cellular networkutilization. When the capacity requirement could be lowered,some of the cellular network technologies could be shut downimmediately to spare more backup energy.
A more complex solution to increase the (speech) capacityduring disturbance situations would be to restrict the random-ness of the subscribers to access the network. If applied to theconfiguration of the example network analysis, an increasefrom 410Erl (Erlang-B, 1% blocking) to 435Erl would betheoretically possible. This would need efficient algorithms toallocate mobile network subscribers to specific time slots toaccess the network beforehand and to restrict the customersto access the network outside this time slot. Emergency callsshould always be prioritized in these situations.
The future work will concentrate on studying how muchlonger mobile networks could operate in the case of dis-turbance scenarios while operating on backup power andapplying some energy saving prospects. These include in-structions and guidelines for the subscribers on how to utilizethe network during disturbance scenarios. This in itself is aninteresting research topic: how would this kind of preparednessaffect the subscriber behaviour. It would enable a highersuccess rate on completed calls as the congestion would be
much lower than in current solutions and enable more capacity,i.e. the available resources would be utilized more efficientlyduring these events. This should also lead to being able tooperate on more restricted configuration resulting in moreenergy savings and prolonging the backup coverage time.
ACKNOWLEDGMENT
The authors would like to thank European CommunicationsEngineering (ECE) ltd, the Finnish Funding Agency for Inno-vation (TEKES).
REFERENCES
[1] FICORA 54 B/2014 M, “Regulation on resilience of communi-cations networks and services. Finnish Communications Regula-tory Authority,” https://www.viestintavirasto.fi/attachments/maaraykset/Viestintavirasto54B2014M.pdf, p. 16, December 2014, [Finnish, online;accessed 1-February-2016].
[2] J. Itkonen, V. Salomaa, and J. Lempiainen, “Air interface capacityfor GPRS/EDGE over GSM traffic load,” in Vehicular TechnologyConference, 2002. Proceedings. VTC 2002-Fall. 2002 IEEE 56th, vol. 1,2002, pp. 396–400 vol.1.
[3] D. Bertsekas and R. Gallager, Data Networks (2nd edition). Prentice-Hall, 1992, pp. 149–269.
[4] A. Kwasinski, “Effects of hurricanes isaac and sandy on data andcommunications power infrastructure,” in Telecommunications EnergyConference ’Smart Power and Efficiency’ (INTELEC), Proceedings of2013 35th International, Oct 2013, pp. 1–6.
[5] M. Fujino, “ICT responses to The Great East Japan EarthquakeOne Year Later.” http://www.soumu.go.jp/main sosiki/joho tsusin/eng/presentation/pdf/120418 1.pdf, Counselor for Communications Policy,Embassy of Japan., April 2012, [Online; accessed 29-October-2015].
[6] T. Shimizu, T. Nakamura, S. Iwashina, W. Takita, A. Iwata, M. Kiuchi,Y. Kubota, and M. Ohhashi, “An experimental evaluation of dynamicvirtualized networking resource control on an evolved mobile corenetwork: A new approach to reducing massive traffic congestion aftera devastating disaster,” in Humanitarian Technology Conference (R10-HTC), 2013 IEEE Region 10, Aug 2013, pp. 270–275.
[7] M. Mackrell, K. Twilley, W. Kirk, L. Lu, J. Underhill, and L. Barnes,“Discovering anomalous patterns in network traffic data during crisisevents,” in Systems and Information Engineering Design Symposium(SIEDS), 2013 IEEE, April 2013, pp. 52–57.
[8] Y. Zang, F. Ni, Z. Feng, S. Cui, and Z. Ding, “Wavelet transformprocessing for cellular traffic prediction in machine learning networks,”in Signal and Information Processing (ChinaSIP), 2015 IEEE ChinaSummit and International Conference on, July 2015, pp. 458–462.
[9] A. Jrad, G. O’Reilly, S. Richman, S. Conrad, and A. Kelic, “Dynamicchanges in subscriber behavior and their impact on the telecom networkin cases of emergency,” in Military Communications Conference, 2006.MILCOM 2006. IEEE, Oct 2006, pp. 1–7.
[10] J. Sae and J. Lempiainen, “User guided energy and capacity optimizationin UMTS mobile networks,” in Personal, Indoor, and Mobile RadioCommunication (PIMRC), 2014 IEEE 25th Annual International Sym-posium on, Sept 2014, pp. 882–886.
Publication 2
J. Säe and J. Lempiäinen, “Maintaining Mobile Network Coverage Availability in Dis-turbance Scenarios,” in Mobile Information Systems, volume 2016, 10 pages, Sep. 2016.DOI: 10.1155/2016/4816325
Copyright c© 2016 Joonas Säe and Jukka Lempiäinen. This is an open access articledistributed under the Creative Commons Attribution License (CC BY), which permitsunrestricted use, distribution, and reproduction in any medium, provided the originalwork is properly cited.
73


1
Maintaining Mobile Network Coverage Availabilityin Disturbance Scenarios
Joonas Sae and Jukka Lempiainen
Abstract—Disturbance and disaster scenarios prevent the nor-mal utilization of mobile networks. The aim of this study isto maintain the availability of cellular networks in disturbancescenarios. In order to extend the disaster time functionality,energy usage optimization is needed to maintain reasonablecoverage and capacity. Simulations performed with differentnetwork layouts show the effects of choosing only a portion ofevolved node B (eNB) macro sites to operate at a time. Differentsets of three to nine three-sectored eNB sites are selected tostudy how the network would perform with a limited numberof eNB sites. Simulation results show how the mobile networkavailability duration can be sustained by selecting a set of eNBsites to operate at a time and still maintain a reasonable servicelevel and availability in disturbance scenarios. An increase of100 % to 500 % can be achieved in the duration of ”backupcoverage” in cellular networks with backup batteries when thepercentage of active eNB sites is reduced down to 20 %.
Index Terms—Availability, disaster, disturbance, mobile net-works, macro sites, network-level simulation, energy conserva-tion, resilience.
I. INTRODUCTION
D ISASTER and disturbance scenarios usually occur with-out a warning. Whether they are natural weather-based
storms or disasters caused by human, such as accidents orsabotages, the effects can be devastating and usually preventthe normal utilization of mobile networks. Typically, stormsare the cause of blackouts in electrical grids [1]; furthermorethey have an impact on public safety and commercial mobilenetworks, thus yielding service and communication outagesin urban and rural areas. This can eventually prevent citizensrequesting emergency help in these outage areas. In addition,maintenance and rescue teams can not communicate throughcommercial mobile networks and have to have a separatecommunication system.
Service outages in mobile networks are mainly caused by(storm-related) power outages. In order to enable some servicein these cases, evolved node B (eNB) macro sites are typicallysupplied with backup batteries. These reserve energy resourcesprovide power to run eNBs, but only for a limited time period.In Finland, this corresponds to 2–4 hours, as required bythe Finnish Communications Regulatory Authority [2]. Afterstrong weather phenomenon, in the worst case the repair-work may take several days resulting in the unavailability ofcommercial cellular networks that may also endanger rescueoperations. An alternative is to have aggregates over thenetwork or at certain critical eNB sites, to guarantee their
J. Sae and J. Lempiainen are with the Department of Electronics andCommunications Engineering, Tampere University of Technology, Tampere,FINLAND, e-mail: [email protected], [email protected].
electricity supply for a longer period of time. Because aggre-gates are slightly costly to be supplied and used at every site,some optimization is needed in a similar way as in the case ofbattery backups, i.e. how many aggregates should be enough toenable sufficient cellular network coverage. Moreover, in caseof longer-term electrical cut-offs (i.e. over one day), aggregatesare eventually required to guarantee (cost-efficient) mobilenetwork communications in disturbance scenarios.
Another type of critical discontinuity in mobile networksmay happen due to major malfunctions in the core transmis-sion network, major damage in the core network elements,such as controllers, or in the switching functions. Thesemalfunctions can also be caused by sabotage or a cyber-attack,which may cause very wide discontinuity in the whole mobilecommunications network. However, these are out of the scopeof this study as this paper is concentrating more on optimizingthe backup energy utilization.
Some solutions for mobile communications have been pro-posed to manage these disturbance and disaster scenarios toimprove the resiliency of mobile networks. In Japan, the socalled critical sites have been implemented in urban areasto durable high-rise buildings [3] with at least 24 h backupbatteries to give continuous service e.g. in case of disasters.High altitude platforms (HAPs) [4] have been discussed earlieras a possible solution to provide service coverage in case ofhurricanes and tornadoes have destroyed the existing infras-tructure of a cellular network in the disaster area. This ideahas been even taken further with Google’s project Loon, whichtargets to provide worldwide Internet access through HAPs,implemented with balloon platforms [5]. Also Facebook hastheir HAPs approach in their internet.org project [6]. Insteadof utilizing balloons, Facebook relies on solar powered drones.
There are also solutions to utilize satellite communicationservices for disaster areas although these systems are ratherexpensive and might not work inside buildings. Moreover,temporary movable networks, like mobile ad hoc networks(MANETs), are a popular research area for disaster scenariosas seen from publications on the topic in [7], [8] and [9]. Manyof these solutions are replacing the existing infrastructure witha new one instead of trying to improve it.
In this paper, the aim is to utilize the traditional macrocellular network infrastructure and extent the availability ofthe network several times from the current backup time whenthe electrical grid is down and the mobile network relies onbackup power. This is possible with an approach, where only aportion of the eNB sites are utilized at a time and switched toanother set of sites when the first set runs out of energy. Thisdiffers from a traditional sleep mode technique such that the
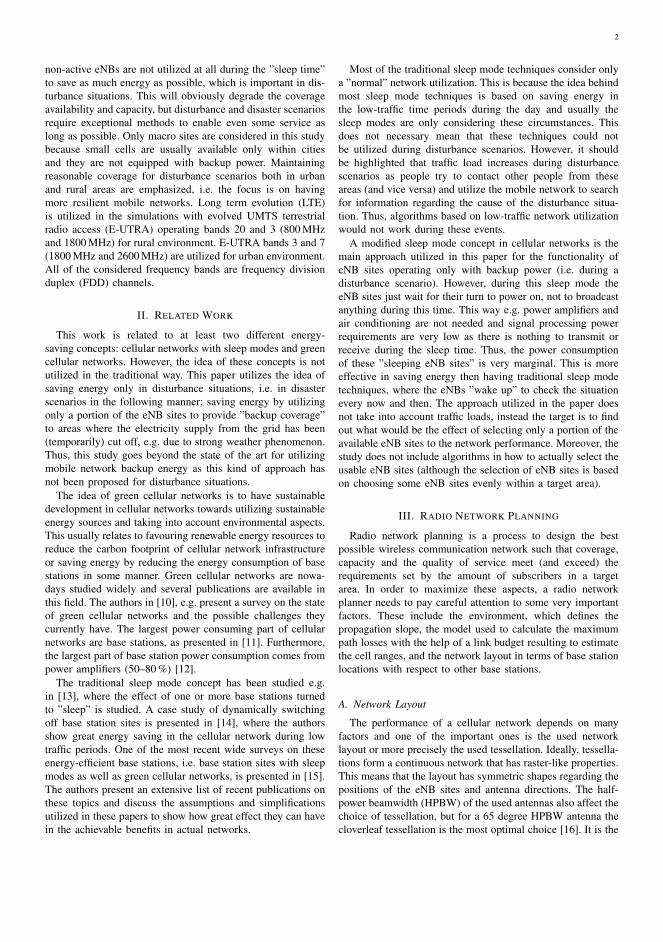
2
non-active eNBs are not utilized at all during the ”sleep time”to save as much energy as possible, which is important in dis-turbance situations. This will obviously degrade the coverageavailability and capacity, but disturbance and disaster scenariosrequire exceptional methods to enable even some service aslong as possible. Only macro sites are considered in this studybecause small cells are usually available only within citiesand they are not equipped with backup power. Maintainingreasonable coverage for disturbance scenarios both in urbanand rural areas are emphasized, i.e. the focus is on havingmore resilient mobile networks. Long term evolution (LTE)is utilized in the simulations with evolved UMTS terrestrialradio access (E-UTRA) operating bands 20 and 3 (800 MHzand 1800 MHz) for rural environment. E-UTRA bands 3 and 7(1800 MHz and 2600 MHz) are utilized for urban environment.All of the considered frequency bands are frequency divisionduplex (FDD) channels.
II. RELATED WORK
This work is related to at least two different energy-saving concepts: cellular networks with sleep modes and greencellular networks. However, the idea of these concepts is notutilized in the traditional way. This paper utilizes the idea ofsaving energy only in disturbance situations, i.e. in disasterscenarios in the following manner; saving energy by utilizingonly a portion of the eNB sites to provide ”backup coverage”to areas where the electricity supply from the grid has been(temporarily) cut off, e.g. due to strong weather phenomenon.Thus, this study goes beyond the state of the art for utilizingmobile network backup energy as this kind of approach hasnot been proposed for disturbance situations.
The idea of green cellular networks is to have sustainabledevelopment in cellular networks towards utilizing sustainableenergy sources and taking into account environmental aspects.This usually relates to favouring renewable energy resources toreduce the carbon footprint of cellular network infrastructureor saving energy by reducing the energy consumption of basestations in some manner. Green cellular networks are nowa-days studied widely and several publications are available inthis field. The authors in [10], e.g. present a survey on the stateof green cellular networks and the possible challenges theycurrently have. The largest power consuming part of cellularnetworks are base stations, as presented in [11]. Furthermore,the largest part of base station power consumption comes frompower amplifiers (50–80 %) [12].
The traditional sleep mode concept has been studied e.g.in [13], where the effect of one or more base stations turnedto ”sleep” is studied. A case study of dynamically switchingoff base station sites is presented in [14], where the authorsshow great energy saving in the cellular network during lowtraffic periods. One of the most recent wide surveys on theseenergy-efficient base stations, i.e. base station sites with sleepmodes as well as green cellular networks, is presented in [15].The authors present an extensive list of recent publications onthese topics and discuss the assumptions and simplificationsutilized in these papers to show how great effect they can havein the achievable benefits in actual networks.
Most of the traditional sleep mode techniques consider onlya ”normal” network utilization. This is because the idea behindmost sleep mode techniques is based on saving energy inthe low-traffic time periods during the day and usually thesleep modes are only considering these circumstances. Thisdoes not necessary mean that these techniques could notbe utilized during disturbance scenarios. However, it shouldbe highlighted that traffic load increases during disturbancescenarios as people try to contact other people from theseareas (and vice versa) and utilize the mobile network to searchfor information regarding the cause of the disturbance situa-tion. Thus, algorithms based on low-traffic network utilizationwould not work during these events.
A modified sleep mode concept in cellular networks is themain approach utilized in this paper for the functionality ofeNB sites operating only with backup power (i.e. during adisturbance scenario). However, during this sleep mode theeNB sites just wait for their turn to power on, not to broadcastanything during this time. This way e.g. power amplifiers andair conditioning are not needed and signal processing powerrequirements are very low as there is nothing to transmit orreceive during the sleep time. Thus, the power consumptionof these ”sleeping eNB sites” is very marginal. This is moreeffective in saving energy then having traditional sleep modetechniques, where the eNBs ”wake up” to check the situationevery now and then. The approach utilized in the paper doesnot take into account traffic loads, instead the target is to findout what would be the effect of selecting only a portion of theavailable eNB sites to the network performance. Moreover, thestudy does not include algorithms in how to actually select theusable eNB sites (although the selection of eNB sites is basedon choosing some eNB sites evenly within a target area).
III. RADIO NETWORK PLANNING
Radio network planning is a process to design the bestpossible wireless communication network such that coverage,capacity and the quality of service meet (and exceed) therequirements set by the amount of subscribers in a targetarea. In order to maximize these aspects, a radio networkplanner needs to pay careful attention to some very importantfactors. These include the environment, which defines thepropagation slope, the model used to calculate the maximumpath losses with the help of a link budget resulting to estimatethe cell ranges, and the network layout in terms of base stationlocations with respect to other base stations.
A. Network Layout
The performance of a cellular network depends on manyfactors and one of the important ones is the used networklayout or more precisely the used tessellation. Ideally, tessella-tions form a continuous network that has raster-like properties.This means that the layout has symmetric shapes regarding thepositions of the eNB sites and antenna directions. The half-power beamwidth (HPBW) of the used antennas also affect thechoice of tessellation, but for a 65 degree HPBW antenna thecloverleaf tessellation is the most optimal choice [16]. It is the
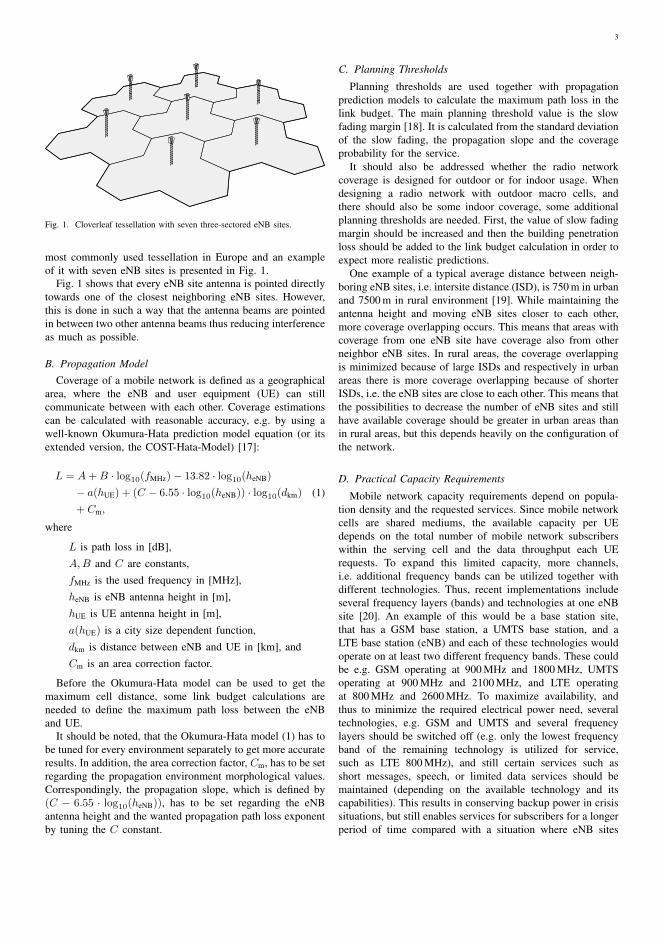
3
Fig. 1. Cloverleaf tessellation with seven three-sectored eNB sites.
most commonly used tessellation in Europe and an exampleof it with seven eNB sites is presented in Fig. 1.
Fig. 1 shows that every eNB site antenna is pointed directlytowards one of the closest neighboring eNB sites. However,this is done in such a way that the antenna beams are pointedin between two other antenna beams thus reducing interferenceas much as possible.
B. Propagation ModelCoverage of a mobile network is defined as a geographical
area, where the eNB and user equipment (UE) can stillcommunicate between with each other. Coverage estimationscan be calculated with reasonable accuracy, e.g. by using awell-known Okumura-Hata prediction model equation (or itsextended version, the COST-Hata-Model) [17]:
L = A+B · log10(fMHz)− 13.82 · log10(heNB)
− a(hUE) + (C − 6.55 · log10(heNB)) · log10(dkm)
+ Cm,
(1)
where
L is path loss in [dB],A,B and C are constants,fMHz is the used frequency in [MHz],heNB is eNB antenna height in [m],hUE is UE antenna height in [m],a(hUE) is a city size dependent function,dkm is distance between eNB and UE in [km], andCm is an area correction factor.
Before the Okumura-Hata model can be used to get themaximum cell distance, some link budget calculations areneeded to define the maximum path loss between the eNBand UE.
It should be noted, that the Okumura-Hata model (1) has tobe tuned for every environment separately to get more accurateresults. In addition, the area correction factor, Cm, has to be setregarding the propagation environment morphological values.Correspondingly, the propagation slope, which is defined by(C − 6.55 · log10(heNB)), has to be set regarding the eNBantenna height and the wanted propagation path loss exponentby tuning the C constant.
C. Planning Thresholds
Planning thresholds are used together with propagationprediction models to calculate the maximum path loss in thelink budget. The main planning threshold value is the slowfading margin [18]. It is calculated from the standard deviationof the slow fading, the propagation slope and the coverageprobability for the service.
It should also be addressed whether the radio networkcoverage is designed for outdoor or for indoor usage. Whendesigning a radio network with outdoor macro cells, andthere should also be some indoor coverage, some additionalplanning thresholds are needed. First, the value of slow fadingmargin should be increased and then the building penetrationloss should be added to the link budget calculation in order toexpect more realistic predictions.
One example of a typical average distance between neigh-boring eNB sites, i.e. intersite distance (ISD), is 750 m in urbanand 7500 m in rural environment [19]. While maintaining theantenna height and moving eNB sites closer to each other,more coverage overlapping occurs. This means that areas withcoverage from one eNB site have coverage also from otherneighbor eNB sites. In rural areas, the coverage overlappingis minimized because of large ISDs and respectively in urbanareas there is more coverage overlapping because of shorterISDs, i.e. the eNB sites are close to each other. This means thatthe possibilities to decrease the number of eNB sites and stillhave available coverage should be greater in urban areas thanin rural areas, but this depends heavily on the configuration ofthe network.
D. Practical Capacity Requirements
Mobile network capacity requirements depend on popula-tion density and the requested services. Since mobile networkcells are shared mediums, the available capacity per UEdepends on the total number of mobile network subscriberswithin the serving cell and the data throughput each UErequests. To expand this limited capacity, more channels,i.e. additional frequency bands can be utilized together withdifferent technologies. Thus, recent implementations includeseveral frequency layers (bands) and technologies at one eNBsite [20]. An example of this would be a base station site,that has a GSM base station, a UMTS base station, and aLTE base station (eNB) and each of these technologies wouldoperate on at least two different frequency bands. These couldbe e.g. GSM operating at 900 MHz and 1800 MHz, UMTSoperating at 900 MHz and 2100 MHz, and LTE operatingat 800 MHz and 2600 MHz. To maximize availability, andthus to minimize the required electrical power need, severaltechnologies, e.g. GSM and UMTS and several frequencylayers should be switched off (e.g. only the lowest frequencyband of the remaining technology is utilized for service,such as LTE 800 MHz), and still certain services such asshort messages, speech, or limited data services should bemaintained (depending on the available technology and itscapabilities). This results in conserving backup power in crisissituations, but still enables services for subscribers for a longerperiod of time compared with a situation where eNB sites
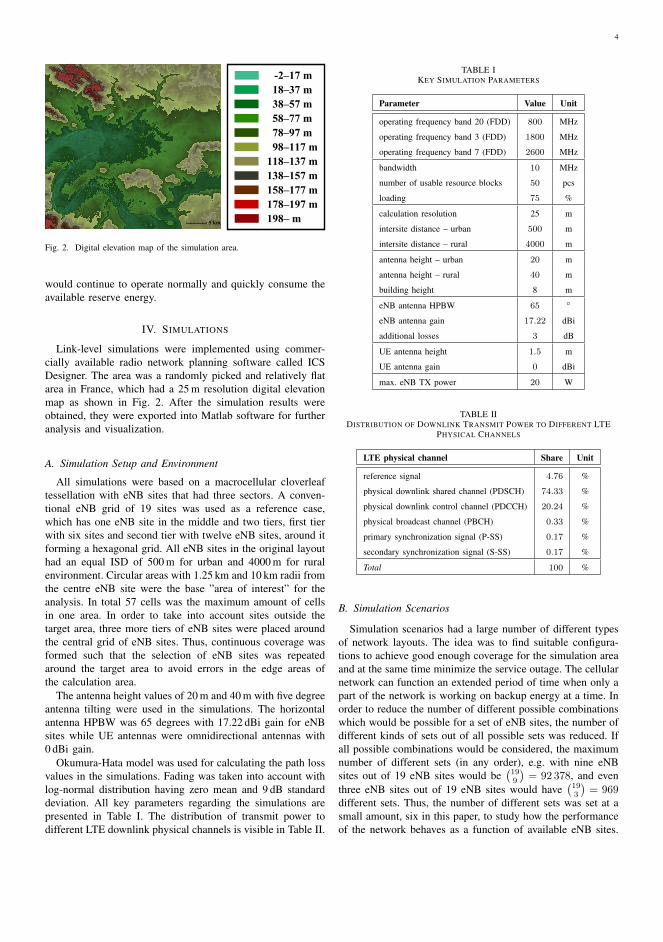
4
-2–17 m18–37 m38–57 m58–77 m78–97 m98–117 m
118–137 m138–157 m158–177 m178–197 m198– m5 km
Fig. 2. Digital elevation map of the simulation area.
would continue to operate normally and quickly consume theavailable reserve energy.
IV. SIMULATIONS
Link-level simulations were implemented using commer-cially available radio network planning software called ICSDesigner. The area was a randomly picked and relatively flatarea in France, which had a 25 m resolution digital elevationmap as shown in Fig. 2. After the simulation results wereobtained, they were exported into Matlab software for furtheranalysis and visualization.
A. Simulation Setup and Environment
All simulations were based on a macrocellular cloverleaftessellation with eNB sites that had three sectors. A conven-tional eNB grid of 19 sites was used as a reference case,which has one eNB site in the middle and two tiers, first tierwith six sites and second tier with twelve eNB sites, around itforming a hexagonal grid. All eNB sites in the original layouthad an equal ISD of 500 m for urban and 4000 m for ruralenvironment. Circular areas with 1.25 km and 10 km radii fromthe centre eNB site were the base ”area of interest” for theanalysis. In total 57 cells was the maximum amount of cellsin one area. In order to take into account sites outside thetarget area, three more tiers of eNB sites were placed aroundthe central grid of eNB sites. Thus, continuous coverage wasformed such that the selection of eNB sites was repeatedaround the target area to avoid errors in the edge areas ofthe calculation area.
The antenna height values of 20 m and 40 m with five degreeantenna tilting were used in the simulations. The horizontalantenna HPBW was 65 degrees with 17.22 dBi gain for eNBsites while UE antennas were omnidirectional antennas with0 dBi gain.
Okumura-Hata model was used for calculating the path lossvalues in the simulations. Fading was taken into account withlog-normal distribution having zero mean and 9 dB standarddeviation. All key parameters regarding the simulations arepresented in Table I. The distribution of transmit power todifferent LTE downlink physical channels is visible in Table II.
TABLE IKEY SIMULATION PARAMETERS
Parameter Value Unit
operating frequency band 20 (FDD) 800 MHz
operating frequency band 3 (FDD) 1800 MHz
operating frequency band 7 (FDD) 2600 MHz
bandwidth 10 MHz
number of usable resource blocks 50 pcs
loading 75 %
calculation resolution 25 m
intersite distance – urban 500 m
intersite distance – rural 4000 m
antenna height – urban 20 m
antenna height – rural 40 m
building height 8 m
eNB antenna HPBW 65
eNB antenna gain 17.22 dBi
additional losses 3 dB
UE antenna height 1.5 m
UE antenna gain 0 dBi
max. eNB TX power 20 W
TABLE IIDISTRIBUTION OF DOWNLINK TRANSMIT POWER TO DIFFERENT LTE
PHYSICAL CHANNELS
LTE physical channel Share Unit
reference signal 4.76 %
physical downlink shared channel (PDSCH) 74.33 %
physical downlink control channel (PDCCH) 20.24 %
physical broadcast channel (PBCH) 0.33 %
primary synchronization signal (P-SS) 0.17 %
secondary synchronization signal (S-SS) 0.17 %
Total 100 %
B. Simulation Scenarios
Simulation scenarios had a large number of different typesof network layouts. The idea was to find suitable configura-tions to achieve good enough coverage for the simulation areaand at the same time minimize the service outage. The cellularnetwork can function an extended period of time when only apart of the network is working on backup energy at a time. Inorder to reduce the number of different possible combinationswhich would be possible for a set of eNB sites, the number ofdifferent kinds of sets out of all possible sets was reduced. Ifall possible combinations would be considered, the maximumnumber of different sets (in any order), e.g. with nine eNBsites out of 19 eNB sites would be
(199
)= 92 378, and even
three eNB sites out of 19 eNB sites would have(193
)= 969
different sets. Thus, the number of different sets was set at asmall amount, six in this paper, to study how the performanceof the network behaves as a function of available eNB sites.

5
3 4
5 6 7
8 9
Fig. 3. Selection of different three to nine eNB site configurations that were utilized in the simulations for a target area (and repeated in a similar way aroundthis area to form a continuous coverage). The selected eNB sites are highlighted with blue color.
The focus is especially to study having less than half of theeNB sites per studied area. The eNB sites chosen for a set werebased on spreading the available sites as evenly as possible tothe studied area, since e.g. choosing only the three closest eNBsites from one ”corner” of the grid would results in the unevendistribution of backup coverage in the target area of interest.
Fig. 3 shows how eNB sites were chosen for three to nineeNB site cases. As can be seen, the eNB sites were chosen ina way to be able to serve the target area as evenly as possibly.An example of service probability with two different sets ofsix eNB sites is visualized in Fig. 4.
V. RESULTS
In the following, Fig. 5 shows the mean reference signalreceived power (RSRP) level, Fig. 6 the mean service proba-bility, and Fig. 7 the average signal-to-interference-and-noiseratio (SINR) with respect to the number of eNB sites. Fig. 8and Fig. 9 present the average area throughput to study theavailable capacity with respect to the amount of eNB sites.The corresponding exact values are presented in Table III andTable IV.
The mean RSRP values in Fig. 5 show that as the numberof eNB sites grow the average RSRP increases, which is ex-pected. Rural environment with E-UTRA band 3 (1800 MHz)has the lowest average RSRP values and correspondingly ruralenvironment with E-UTRA band 20 (800 MHz) has the highestRSRP values. The average values of RSRP are clearly differentfor all cases. First of all, the environment type with differentantenna heights for the rural and urban areas has a huge impacton the average RSRP values, since the antenna height for therural area is two times the height of the urban area. Next,another important factor is the utilized frequency, i.e. for rural
area the higher frequency band is more than twice the utilizedlower frequency band. In the urban cases, the higher frequencyband is less then twice the utilized lower frequency band, thusthe differences between the average RSRP values for the tworural cases is more dramatic than the corresponding differencesfor the two urban cases. Finally, the urban case is also affectedby the buildings, thus lowering the average RSRP values. Inthis study, the lowest value was −82.68 dBm with 15.79 % ofeNB sites available.
Fig. 6 presents the average probability to have backupcoverage in the different cases. The lowest probability tohave service coverage was with E-UTRA band 7 (2600 MHz)in the urban environment. The lowest value was 55.44 %with 15.79 % of the eNB sites available. Thus, although theurban area had denser eNB site placement than the rural area,the coverage areas with a higher frequency band are quitelimited, as well as overlapping areas. This is mostly becauseof the attenuation is higher in the urban environment (withbuildings) as well as in a higher frequency band. When thesame frequency band was utilized in both the urban and ruralenvironment, the urban E-UTRA band 3 had slightly higherprobability to have a service than its rural counterpart (rural E-UTRA band 3). The highest service availability was achievedwith the lowest frequency, E-UTRA band 20 in the rural case,where the probability to have a service was over 80 % evenwith the lowest number of eNB sites (15.79 %). In order tohave over 80 % probability for (backup) coverage in othercases, E-UTRA band 3 cases (1800 MHz) would need around26.32 % in urban and 31.58 % in rural scenarios and E-UTRAband 7 (2600 MHz) around 50 % in the urban environment.
When the exact values are observed from Table III as a func-tion of available eNB sites, the differences between different
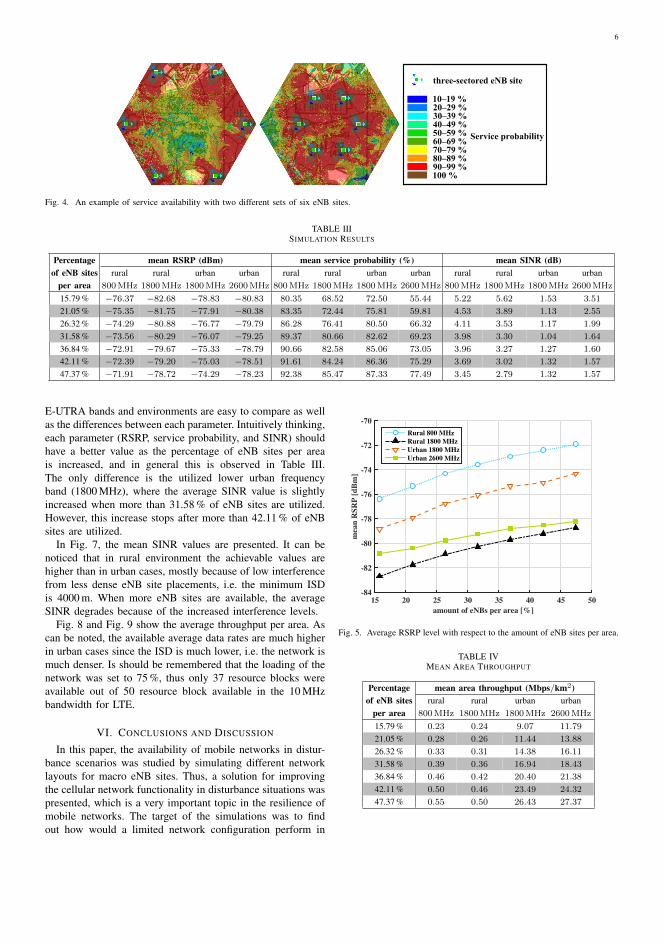
6
three-sectored8eNB8site
Service8probability
10–198%20–298%30–398%40–498%50–598%60–698%70–798%80–898%90–998%1008%
Fig. 4. An example of service availability with two different sets of six eNB sites.
TABLE IIISIMULATION RESULTS
Percentage mean RSRP (dBm) mean service probability (%) mean SINR (dB)of eNB sites rural rural urban urban rural rural urban urban rural rural urban urban
per area 800MHz 1800MHz 1800MHz 2600MHz 800MHz 1800MHz 1800MHz 2600MHz 800MHz 1800MHz 1800MHz 2600MHz
15.79 % −76.37 −82.68 −78.83 −80.83 80.35 68.52 72.50 55.44 5.22 5.62 1.53 3.51
21.05 % −75.35 −81.75 −77.91 −80.38 83.35 72.44 75.81 59.81 4.53 3.89 1.13 2.55
26.32 % −74.29 −80.88 −76.77 −79.79 86.28 76.41 80.50 66.32 4.11 3.53 1.17 1.99
31.58 % −73.56 −80.29 −76.07 −79.25 89.37 80.66 82.62 69.23 3.98 3.30 1.04 1.64
36.84 % −72.91 −79.67 −75.33 −78.79 90.66 82.58 85.06 73.05 3.96 3.27 1.27 1.60
42.11 % −72.39 −79.20 −75.03 −78.51 91.61 84.24 86.36 75.29 3.69 3.02 1.32 1.57
47.37 % −71.91 −78.72 −74.29 −78.23 92.38 85.47 87.33 77.49 3.45 2.79 1.32 1.57
E-UTRA bands and environments are easy to compare as wellas the differences between each parameter. Intuitively thinking,each parameter (RSRP, service probability, and SINR) shouldhave a better value as the percentage of eNB sites per areais increased, and in general this is observed in Table III.The only difference is the utilized lower urban frequencyband (1800 MHz), where the average SINR value is slightlyincreased when more than 31.58 % of eNB sites are utilized.However, this increase stops after more than 42.11 % of eNBsites are utilized.
In Fig. 7, the mean SINR values are presented. It can benoticed that in rural environment the achievable values arehigher than in urban cases, mostly because of low interferencefrom less dense eNB site placements, i.e. the minimum ISDis 4000 m. When more eNB sites are available, the averageSINR degrades because of the increased interference levels.
Fig. 8 and Fig. 9 show the average throughput per area. Ascan be noted, the available average data rates are much higherin urban cases since the ISD is much lower, i.e. the network ismuch denser. Is should be remembered that the loading of thenetwork was set to 75 %, thus only 37 resource blocks wereavailable out of 50 resource block available in the 10 MHzbandwidth for LTE.
VI. CONCLUSIONS AND DISCUSSION
In this paper, the availability of mobile networks in distur-bance scenarios was studied by simulating different networklayouts for macro eNB sites. Thus, a solution for improvingthe cellular network functionality in disturbance situations waspresented, which is a very important topic in the resilience ofmobile networks. The target of the simulations was to findout how would a limited network configuration perform in
amount of eNBs per area [%]
15 20 25 30 35 40 45 50
mea
n R
SR
P [
dB
m]
-84
-82
-80
-78
-76
-74
-72
-70
Rural 800 MHz
Rural 1800 MHz
Urban 1800 MHz
Urban 2600 MHz
Fig. 5. Average RSRP level with respect to the amount of eNB sites per area.
TABLE IVMEAN AREA THROUGHPUT
Percentage mean area throughput (Mbps/km2)of eNB sites rural rural urban urban
per area 800MHz 1800MHz 1800MHz 2600MHz
15.79 % 0.23 0.24 9.07 11.79
21.05 % 0.28 0.26 11.44 13.88
26.32 % 0.33 0.31 14.38 16.11
31.58 % 0.39 0.36 16.94 18.43
36.84 % 0.46 0.42 20.40 21.38
42.11 % 0.50 0.46 23.49 24.32
47.37 % 0.55 0.50 26.43 27.37

7
amount of eNBs per area [%]
15 20 25 30 35 40 45 50
mea
n s
erv
ice
pro
ba
bil
ity
[%
]
0
10
20
30
40
50
60
70
80
90
100
Rural 800 MHz
Rural 1800 MHz
Urban 1800 MHz
Urban 2600 MHz
Fig. 6. Average service probability with respect to the amount of eNB sitesper area.
amount of eNBs per area [%]
15 20 25 30 35 40 45 50
mea
n S
INR
[d
B]
1
1.5
2
2.5
3
3.5
4
4.5
5
5.5
6
Rural 800 MHz
Rural 1800 MHz
Urban 1800 MHz
Urban 2600 MHz
Fig. 7. Average SINR with respect to the amount of eNB sites per area.
amount of eNBs per area [%]
15 20 25 30 35 40 45 50
mea
n a
rea
th
rou
gh
pu
t [M
bp
s/k
m2]
0.2
0.25
0.3
0.35
0.4
0.45
0.5
0.55
Rural 800 MHz
Rural 1800 MHz
Fig. 8. Average area throughput with respect to the amount of eNB sites perarea in rural environment.
amount of eNBs per area [%]
15 20 25 30 35 40 45 50
mea
n a
rea
th
rou
gh
pu
t [M
bp
s/k
m2]
8
10
12
14
16
18
20
22
24
26
28
Urban 1800 MHz
Urban 2600 MHz
Fig. 9. Average area throughput with respect to the amount of eNB sites perarea in urban environment.
terms of coverage and capacity with mobile network avail-ability (without adding additional backup power sources). Thisminimum configuration can be utilized with battery backupsto extend the network availability called backup coverage.As the name suggests, this exceptional state of the networkcan not have ”normal” service availability as the goal is toprovide ”acceptable” or at least some coverage that wouldlast much longer than initially. This would mean that someareas would not have coverage at every time instant duringthe backup coverage time window, but since the operatingsets of eNB sites are cycled over time, all areas would havea certain time window when the service is still available.Thus, in order to achieve e.g. approximately 75 % availabilityonly 20 % to 42 % of eNB sites in urban areas, and 15 %to 25 % of eNB sites in rural areas are needed. This meansthat an increase of 100 % to 500 % could be achieved on theoperational time of backup coverage, correspondingly. Thisalso translates to having mediocre coverage for a longer periodof time if approximately 20 % of eNB sites would be equippedwith aggregates or any other means of powering up eNB sites,which would be cheaper than having e.g. 24 h backup batteriesdeployed to every possible eNB site.
The comparison of the achieved results to other sleepmode techniques is not that straight forward. First of all,the traditional sleep mode techniques are designed to saveenergy during low traffic time periods and this is not the caseduring disturbance situations. Second, many studies such as[13]–[15], all consider different sleep mode techniques withdifferent kind of eNB site layouts with heterogeneous networks(besides macro sites, there can also be micro and small cellsites). In order to get some idea about the effectiveness ofthe approach utilized within this paper, the authors in [21]present a comparable sleep mode technique, where part of theeNB sites remain active all the time and part of the eNB sitescan switch to sleep mode. The results in the study suggeststhat on average the power savings from an actual networkimplementation would be from 7.38 % to 27.72 % on a 24 htime period. Thus, although still not directly comparable, the

8
energy savings are clearly a lot less than in the approachutilized in this study. The difference is mostly explained withthe fact that the sleep mode technique is designed to keephigh quality of service (QoS), i.e. high service availability. Inthis paper the requirements for QoS are clearly lower sincethe idea is lower QoS to enable even some sufficient servicelevel for a clearly longer period of time by aggressively savingenergy.
Although it seems that there would be more overlappingin the rural areas, it should be noticed that the serviceavailability is higher in urban areas when the same E-UTRAfrequency bands are utilized (band 3). This indicates that theoperational time of the backup coverage in urban areas wouldlast somewhat longer. Thus, the achievable gain is stronglyrelated to the overlapping rate of neighbouring cells whichis also defined by the utilized frequency band as well as theconfiguration of the eNB sites.
The studied availability can be reached in existing networksby utilizing existing configurations and resources by addingonly controlling units. Moreover, the achieved results assumethat transmission lines and core networks are properly func-tioning (which is usually the case, at least in Finland, as thebackhaul element backup power regulation is stricter than foreNB sites by a factor of 2–6 [2]), and thus more specific solu-tions need to be proposed to maintain their availabilities in caseof disconnections. It should be noted that in real operationalnetworks the selection of eNB sites is not so straightforward.The geographical distribution of eNB sites is not symmetricaland only roughly follows the cloverleaf tessellation. Moreover,this study only showed how would the network perform if eacheNB site was independent of another eNB site, i.e. the studydid not take into account the possible backhaul connectionlimitations of linked eNB sites. This would have more seriouseffects within rural environments where wireless microwavelinks are utilized more frequently compared with urban areas,where wireless links between eNB sites rarely exist. Theresults are valid only for the given configuration, however,they were chosen such that they represent possible real-lifeimplementations and provide insight on the level of serviceavailability with a limited cellular network configuration.
The future work on this topic will consider more practicaleNB site layouts, i.e. the distribution of sites will be closerto real-life implementations with more clustered locations ofeNB sites. Moreover, the effect of wireless microwave links,i.e. the backhaul connection will also be taken into accountbased on an operational cellular network operator.
ACKNOWLEDGMENT
Author J. Sae would like to thank Tuula and Yrjo NeuvoFund and Finnish Foundation for Technology Promotion forsupporting the research work. The authors would also liketo thank European Communications Engineering (ECE) ltdand the Finnish Funding Agency for Innovation (TEKES) forfunding the research work.
REFERENCES
[1] J. Stranden, H. Krohns, P. Verho, and J. Sarsama, “Major disturbances –development of preparedness in finland during the last decade,” in 21stInternational Conference on Electricity Distribution, June 2011, p. 4.
[2] FICORA 54 B/2014 M, “Maarays 54 viestintaverkkojen ja -palvelujen varmistamisesta seka viestintaverkkojen synkronoin-nista,” https://www.viestintavirasto.fi/attachments/maaraykset/Viestintavirasto54B2014M.pdf, p. 16, December 2014, [Finnish,Online; accessed 7-July-2016].
[3] NTT DoCoMo, “Deployment status of the new disaster prepared-ness measures.” https://www.nttdocomo.co.jp/english/info/media center/pr/2012/pdf/20120223 attachment02.pdf, February 2012, [Online; ac-cessed 7-July-2016].
[4] P. Lahdekorpi, T. Isotalo, K. Kyla-Liuhala, and J. Lempiainen, “Replac-ing terrestrial UMTS coverage by HAP in disaster scenarios,” in WirelessConference (EW), 2010 European, April 2010, pp. 14–19.
[5] Google, “Loon for all,” http://www.google.com/loon/, [Online; accessed7-July-2016].
[6] internet.org by Facebook, “Connectivity lab,” https://info.internet.org/en/story/connectivity-lab/, [Online; accessed 7-July-2016].
[7] M. Conti and S. Giordano, “Mobile ad hoc networking: milestones,challenges, and new research directions,” Communications Magazine,IEEE, vol. 52, no. 1, pp. 85–96, January 2014.
[8] L. Sassatelli, A. Ali, M. Panda, T. Chahed, and E. Altman, “Reliabletransport in delay-tolerant networks with opportunistic routing,” WirelessCommunications, IEEE Transactions on, vol. 13, no. 10, pp. 5546–5557,Oct 2014.
[9] A. Polydoros, N. Dimitriou, G. Baldini, I. Fovino, M. Taddeo, andA. Cipriano, “Public protection and disaster relief communicationsystem integrity: A radio-flexibility and identity-based cryptographyapproach,” Vehicular Technology Magazine, IEEE, vol. 9, no. 4, pp.51–60, Dec 2014.
[10] Z. Hasan, H. Boostanimehr, and V. K. Bhargava, “Green cellularnetworks: A survey, some research issues and challenges,” IEEE Com-munications Surveys Tutorials, vol. 13, no. 4, pp. 524–540, Fourth 2011.
[11] C. Han, T. Harrold, S. Armour, I. Krikidis, S. Videv, P. M. Grant,H. Haas, J. S. Thompson, I. Ku, C. X. Wang, T. A. Le, M. R. Nakhai,J. Zhang, and L. Hanzo, “Green radio: radio techniques to enable energy-efficient wireless networks,” IEEE Communications Magazine, vol. 49,no. 6, pp. 46–54, June 2011.
[12] L. M. Correia, D. Zeller, O. Blume, D. Ferling, Y. Jading, I. Godor,G. Auer, and L. V. D. Perre, “Challenges and enabling technologies forenergy aware mobile radio networks,” IEEE Communications Magazine,vol. 48, no. 11, pp. 66–72, November 2010.
[13] M. A. Marsan, L. Chiaraviglio, D. Ciullo, and M. Meo, “On theeffectiveness of single and multiple base station sleep modes incellular networks,” Computer Networks, July 2013, 07 2013. [Online].Available: http://www.eurecom.fr/publication/4094
[14] E. Oh, B. Krishnamachari, X. Liu, and Z. Niu, “Toward dynamic energy-efficient operation of cellular network infrastructure,” IEEE Communi-cations Magazine, vol. 49, no. 6, pp. 56–61, June 2011.
[15] J. Wu, Y. Zhang, M. Zukerman, and E. K. N. Yung, “Energy-efficientbase-stations sleep-mode techniques in green cellular networks: A sur-vey,” IEEE Communications Surveys Tutorials, vol. 17, no. 2, pp. 803–826, Secondquarter 2015.
[16] J. Itkonen, B. Tuzson, and J. Lempiainen, “Assessment of networklayouts for cdma radio access,” EURASIP Journal on WirelessCommunications and Networking, vol. 2008, no. 1, p. 259310,2008. [Online]. Available: http://jwcn.eurasipjournals.com/content/2008/1/259310
[17] D. Cichon and T. Kumer, “Chapter 4: Propagation prediction models,” inDigital mobile radio towards future generation systems – final report,COST Action 231, Ed. European Commission, Tech. Rep., 1999, pp.115–208.
[18] J. Lempiainen and M. Manninen, UMTS Radio Network Planning,Optimization and Qos Management: For Practical Engineering Tasks.Norwell, MA, USA: Kluwer Academic Publishers, 2004.
[19] 3GPP, “Technical Specification Group Radio Access Network; UMTS900 MHz Work Item Technical Report (Release 8),” 3rd GenerationPartnership Project (3GPP), Tech. Rep., 2009, TR 25.816.
[20] Nokia, “Flexi multiradio 10 base station,” http://networks.nokia.com/sites/default/files/document/nokia flexi multiradio 10 base stationbrochure 0.pdf, [Online; accessed 1-September-2015].
[21] A. Ali and S. E. Elavoubi, “Design and performance evaluation of sitesleep mode in lte mobile networks,” in Teletraffic Congress (ITC), 201426th International, Sept 2014, pp. 1–6.
9
Joonas Sae was born in Hyvinkaa, Finland, in 1987.He received both his BSc and MSc degrees (bothwith distinction) in Signal Processing and Commu-nications Engineering from Tampere University ofTechnology, Tampere, Finland, in 2011 and 2012,respectively. Currently he is working towards theDr. Tech. degree as a researcher in the Departmentof Electronics and Communications Engineering atTampere University of Technology. His main in-terests are radio network planning aspects and theperformance improvements of mobile networks es-
pecially in disaster scenarios. He is a student member of IEEE.
Jukka Lempiainen was born in Helsinki, Finland,in 1968. He received an MSc, Lic Tech, Dr. Tech. allin Electrical Engineering, from Helsinki Universityof Technology, Espoo, Finland, in 1993, 1998 and1999, respectively. He is a Senior Partner and thePresident of European Communications EngineeringLtd. He has altogether more than twenty years’ expe-rience in GSM based mobile network planning andconsulting. Currently, he is also a part-time Professorof the Telecommunications (Radio Network Plan-ning) at Tampere University of Technology, Finland.
He has written two international books about GSM/GPRS/UMTS cellularradio planning, several international journal and conference papers and hehas three patents. He is URSI National Board Member, Finland.


Publication 3
H. Krohns-Välimäki, J. Säe, J. Haapanen, P. Verho, and J. Lempiäinen, “ImprovingDisturbance Management with Combined Electricity and Mobile Network SituationAwareness System,” in International Review of Electrical Engineering, volume 11, number5, pages 542–553, October 2016. DOI: 10.15866/iree.v11i5.10175
Copyright c© 2016 Praise Worthy Prize S.r.l. Reprinted, with permission, from theInternational Review of Electrical Engineering (IREE).
85


International Review of Electrical Engineering (I.R.E.E.), Vol. 11, n. 5 (2016)
Improving Disturbance Management with Combined Electricity and
Mobile Network Situation Awareness System
Heidi Krohns-Välimäki1, Joonas Säe2, Jussi Haapanen3, Pekka Verho4, Juk-
ka Lempiäinen5
Abstract – This paper presents a new method to improve the disturbance management of elec-
tricity networks and mobile networks with a situation awareness system that was developed in this
study. The system is based on combining the disturbance information from electricity and mobile
networks. Both of the networks provide useful information for disturbance management: electricity
outage areas from the electricity network systems and coverage outage areas from the cellular
network operators. The outage information from an electricity network is received through the
Distribution Management System (DMS) service and combined with customer identification codes
to find out whether mobile network base stations lack electricity. This information is combined
with operational mobile network coverage areas calculated beforehand with an empirical Okumu-
ra-Hata path loss model in order to visualize coverage outage areas. A situation awareness system
that combines these parts provides new disturbance management insights and shows the disturb-
ances of both networks with one glance. Thus, the restoration plans for both networks can be sped
up and critical areas can be more easily prioritized since a clear visual presentation of the situa-
tion is easy to comprehend. Therefore, this new method improves the resilience of society, espe-
cially during major disturbances.
Keywords: Disturbance management, Electricity network, Mobile network, Situation Awareness
System
NOMENCLATURE
A frequency-dependent constant
a(hMS) city size -dependent function
B frequency-dependent constant
Cm area correction factor
dkm distance
fMHz frequency
hBS effective base station antenna height
hMS effective mobile station antenna height
L path loss
I. Introduction
Storms such as Valio in 2015, the Tapani storm at
Christmas 2011, four storms in the summer of 2010 in
Finland and the storms Per 2006 and Gudrun 2005 in
Sweden caused widespread and long-lasting disturbances
in the supply of electric power. In these storms, some
individual customers were without electricity even for
several weeks. In January 2011 and January 2015, the
snow load on trees caused widespread disturbances in
Finland. In addition to storms that affect rural areas, e.g.,
Hurricane Sandy caused widespread disturbances in ur-
ban areas in the eastern USA in October 2012. There
were, e.g., floods that caused an outage to Manhattan in
New York. Most of these disturbances caused problems
for mobile networks, water supply, residential heating and
the conditions of farm animals. In July 2014 and January
2015 in Finland, the disturbances of the electricity net-
work caused notable outage regions for mobile networks.
Some areas were left without mobile network coverage
for almost a day, which greatly influenced the resilience
of society. [1]-[10]
A situation where both the electricity and mobile net-
works have a disturbance at the same time is complex to
manage. Nowadays the electricity network has a lot of
remote-controlled devices such as switches. Some of
these devices use a mobile network to communicate with
Supervisory Control and Data Acquisition (SCADA).
Meanwhile, mobile network base stations need electricity
to operate. The Finnish Communications Regulatory Au-
thority (FICORA) has determined that base stations in
Finland must have backup power batteries or some other
form of reserve power to maintain the transmission for at
least three hours in the event of a disturbance in the elec-
tricity network [11]. However, an electricity disturbance
can last longer than the reserve backup power, e.g., if a
storm delays the beginning of the repair process for a
certain time. In addition to remote-controlled devices, the
Distribution System Operator (DSO) relies on mobile
networks to contact and follow repair teams and contrac-
tors during disturbances. If both stakeholders receive
information from each other’s networks, their recovery
processes could be executed more efficiently.
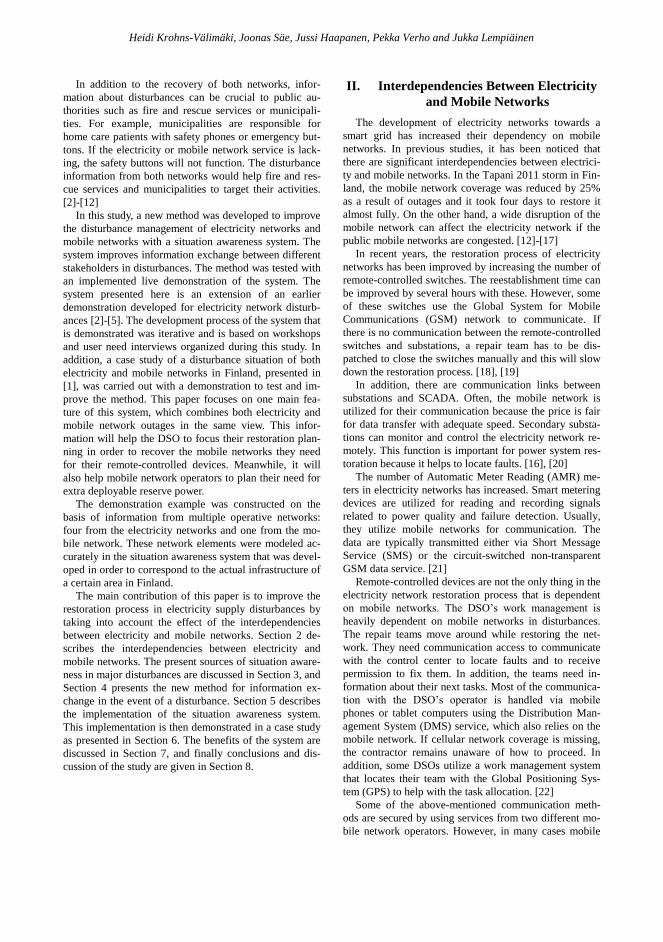
Heidi Krohns-Välimäki, Joonas Säe, Jussi Haapanen, Pekka Verho and Jukka Lempiäinen
In addition to the recovery of both networks, infor-
mation about disturbances can be crucial to public au-
thorities such as fire and rescue services or municipali-
ties. For example, municipalities are responsible for
home care patients with safety phones or emergency but-
tons. If the electricity or mobile network service is lack-
ing, the safety buttons will not function. The disturbance
information from both networks would help fire and res-
cue services and municipalities to target their activities.
[2]-[12]
In this study, a new method was developed to improve
the disturbance management of electricity networks and
mobile networks with a situation awareness system. The
system improves information exchange between different
stakeholders in disturbances. The method was tested with
an implemented live demonstration of the system. The
system presented here is an extension of an earlier
demonstration developed for electricity network disturb-
ances [2]-[5]. The development process of the system that
is demonstrated was iterative and is based on workshops
and user need interviews organized during this study. In
addition, a case study of a disturbance situation of both
electricity and mobile networks in Finland, presented in
[1], was carried out with a demonstration to test and im-
prove the method. This paper focuses on one main fea-
ture of this system, which combines both electricity and
mobile network outages in the same view. This infor-
mation will help the DSO to focus their restoration plan-
ning in order to recover the mobile networks they need
for their remote-controlled devices. Meanwhile, it will
also help mobile network operators to plan their need for
extra deployable reserve power.
The demonstration example was constructed on the
basis of information from multiple operative networks:
four from the electricity networks and one from the mo-
bile network. These network elements were modeled ac-
curately in the situation awareness system that was devel-
oped in order to correspond to the actual infrastructure of
a certain area in Finland.
The main contribution of this paper is to improve the
restoration process in electricity supply disturbances by
taking into account the effect of the interdependencies
between electricity and mobile networks. Section 2 de-
scribes the interdependencies between electricity and
mobile networks. The present sources of situation aware-
ness in major disturbances are discussed in Section 3, and
Section 4 presents the new method for information ex-
change in the event of a disturbance. Section 5 describes
the implementation of the situation awareness system.
This implementation is then demonstrated in a case study
as presented in Section 6. The benefits of the system are
discussed in Section 7, and finally conclusions and dis-
cussion of the study are given in Section 8.
II. Interdependencies Between Electricity
and Mobile Networks
The development of electricity networks towards a
smart grid has increased their dependency on mobile
networks. In previous studies, it has been noticed that
there are significant interdependencies between electrici-
ty and mobile networks. In the Tapani 2011 storm in Fin-
land, the mobile network coverage was reduced by 25%
as a result of outages and it took four days to restore it
almost fully. On the other hand, a wide disruption of the
mobile network can affect the electricity network if the
public mobile networks are congested. [12]-[17]
In recent years, the restoration process of electricity
networks has been improved by increasing the number of
remote-controlled switches. The reestablishment time can
be improved by several hours with these. However, some
of these switches use the Global System for Mobile
Communications (GSM) network to communicate. If
there is no communication between the remote-controlled
switches and substations, a repair team has to be dis-
patched to close the switches manually and this will slow
down the restoration process. [18], [19]
In addition, there are communication links between
substations and SCADA. Often, the mobile network is
utilized for their communication because the price is fair
for data transfer with adequate speed. Secondary substa-
tions can monitor and control the electricity network re-
motely. This function is important for power system res-
toration because it helps to locate faults. [16], [20]
The number of Automatic Meter Reading (AMR) me-
ters in electricity networks has increased. Smart metering
devices are utilized for reading and recording signals
related to power quality and failure detection. Usually,
they utilize mobile networks for communication. The
data are typically transmitted either via Short Message
Service (SMS) or the circuit-switched non-transparent
GSM data service. [21]
Remote-controlled devices are not the only thing in the
electricity network restoration process that is dependent
on mobile networks. The DSO’s work management is
heavily dependent on mobile networks in disturbances.
The repair teams move around while restoring the net-
work. They need communication access to communicate
with the control center to locate faults and to receive
permission to fix them. In addition, the teams need in-
formation about their next tasks. Most of the communica-
tion with the DSO’s operator is handled via mobile
phones or tablet computers using the Distribution Man-
agement System (DMS) service, which also relies on the
mobile network. If cellular network coverage is missing,
the contractor remains unaware of how to proceed. In
addition, some DSOs utilize a work management system
that locates their team with the Global Positioning Sys-
tem (GPS) to help with the task allocation. [22]
Some of the above-mentioned communication meth-
ods are secured by using services from two different mo-
bile network operators. However, in many cases mobile

Heidi Krohns-Välimäki, Joonas Säe, Jussi Haapanen, Pekka Verho and Jukka Lempiäinen
network operators share the same masts. Thus, a power
blackout at one mast location results in the unavailability
of more than one mobile network operator’s service
availability in that particular area. In addition, it is ex-
pected that, e.g., in Sweden the total energy consumption
of mobile networks will increase by 20 percent, from 108
TWh in 2015 to 132 TWh in 2021 [23]. Thus, as the
need for electricity in mobile networks continues to in-
crease, it is even more important to improve the recovery
process of the electricity supply to these networks in dis-
aster scenarios.
The functionality of mobile networks depends on the
availability of electricity networks. When there is a pow-
er blackout, the mobile network is not able to provide any
coverage without any backup power. However, e.g., in
Finland, the mobile networks should still continue to op-
erate, because FICORA has issued a regulation [11] stip-
ulating that mobile network base station sites should have
backup power for three hours in the event of a disturb-
ance in the electricity network. This is usually imple-
mented with backup batteries, since, e.g., the availability
of renewable energy devices, such as solar panels and
wind turbines, is a rare sight at base station sites in Fin-
land, mostly because of their low efficiency rate. Thus,
base stations commonly rely on battery backup power
during electricity disturbances.
The backhaul connections in mobile networks, i.e., the
connections from the mobile operators’ core network to
the base station sites, are mostly implemented with fiber
connections. These connections also rely on the electrici-
ty network in order to function. The devices in the back-
haul transmission lines usually have a longer backup
power reserve than the base stations, at least from six to
twelve hours [11]. The most critical sites are equipped
with aggregates to enable operation for longer periods of
time, together with ready-made contracts with different
companies to deliver more fuel to these sites when need-
ed.
III. Existing Situation Awareness Systems
for Major Disturbances
At present, in disturbances, the DSO creates the
awareness of the disturbance, mainly on the basis of
DMS and SCADA, which show the outage situation of an
electricity network. In addition, the DSO utilizes a Work
Management System (WMS), which reveals the situation
of repairers and resources. In most cases, the DSO de-
cides the fixing order on the basis of the locations of cus-
tomers with high consumption or the faults that cause the
most trouble with electricity supply [2]. The present
sources of situation awareness in electricity supply dis-
turbances were compared in a previous study [3]. In this
study, the comparison was extended to include the
sources of situation awareness in mobile network disturb-
ances.
Fig. 1. A view of the DMS service.
In Finland, most of the DSOs display information
about outages on their web pages, e.g., on transformer-
level maps. In addition, some DSOs offer DMS services
(Fig. 1) to their contractors and to local fire and rescue
services in Finland. These services give access to the
DMS view for the authority during disturbance scenarios.
A common factor for all of these systems is that there are
only a few bidirectional functions on these systems and
they are not usually personalized to different user groups.
At present, mobile network operators rarely utilize these
systems. [2], [3]
There are some Situation Awareness (SA) systems
available for electricity supply disturbances. Some of
them are designed for common emergency situations and
some especially for disturbances of the electricity supply.
In Germany, there are a few situation awareness systems
that have been developed for disturbances. One DSO has
developed a system which delivers information about
outages to the authorities. The system filters the needed
information about planned and unplanned outages from
the network control system. This information is transmit-
ted to the rescue coordination centers via email. The data
from the email can be integrated into the systems of the
rescue coordination centers. In addition, municipalities
receive information about outages via an SMS which
includes the phone number of the DSO. [24]
In Canada, the Multi-Agency Situational Awareness
System (MASAS) has been developed for exchanging
emergency management incident-relevant information
between multiple stakeholders. The system has been de-
signed for exchanging information in non-ordinary situa-
tions, e.g., in a flood season. The system is based on a
map where information about weather, earthquakes, fires
and electricity outages can be presented. The MASAS
can be used for sharing information about disturbances of
the electricity supply even though it is not designed spe-
cifically for that. [25], [26]

Heidi Krohns-Välimäki, Joonas Säe, Jussi Haapanen, Pekka Verho and Jukka Lempiäinen
Fig. 2. An example of a disturbance visualization from FICORA’s
service for severe and very severe disruptions to mobile networks.
Generally, the DSO does not know the locations of
mobile network base stations. In Finland, some DSOs
cooperate with their mobile network operators so that
they have information about the location of the most sig-
nificant base stations.
Nowadays in Finland, different mobile network opera-
tors provide their own services for informing subscribers
about disturbances of their own network. There are three
main mobile network operators in Finland, which have
their own infrastructure, and correspondingly there are
three different services for informing the customers. The
level of accuracy differs greatly in terms of how precise-
ly, e.g., any disturbance is visualized on a map. FICORA
has set minimum requirements for this [27], but even
more accurate information can be given. For example,
operators can show coverage outages even on a single
base station level. In addition, FICORA has a web service
which combines the disturbance information of different
operators. An example of this kind of disturbance visuali-
zation is shown in Fig. 2. The information is usually pre-
sented at the municipality level, as can be seen from the
figure. However, it is generated only after severe or very
severe disruptions to the network and shows only the
rough area where the disturbance affects the coverage of
the mobile network.
One mobile operator in Finland shows the mobile net-
work service problems in considerable detail, together
with the expected coverage area of the outage. This is
more accurate than is required by FICORA, but illustrates
the disturbance situations quite well.
In the United Kingdom, e.g., one operator offers a ser-
vice that can show the coverage areas and some unex-
pected issues or planned maintenance on a map. Howev-
er, the problems are shown on the map only after a spe-
cific area is searched, and even after an area has been
specified, the problems are shown with symbols on the
map without a clear influence area. Thus, only rough es-
timates of the affected coverage areas are shown. Another
operator in the UK has a similar kind of service, but ra-
ther than the problem areas being shown on a map, the
problems are only listed without specific information on
the locations on the map. In Australia, a similar kind of
approach is presented as in the UK. In their service, after
an address has been defined, a map shows the specific
area with the symbols of the base station towers. These
symbols also represent whether the service is OK, there is
some planned work or there is some live outage at a spe-
cific base station site. Moreover, the map only shows the
symbols when an address is defined, and thus the service
status map does not show the status of any other regions
without a new address being searched for.
The mobile network operators receive fault infor-
mation from the base stations directly to the system.
These include, among others, information about any
problems related to the functionality of the equipment or
warnings about service- or transmission-related misbe-
havior. Thus, operators should know whether base station
site equipment is not able to access an electricity supply
and is forced to utilize the backup power. Additionally,
the mobile network operators in Finland have some
agreements with the electricity companies to receive in-
formation about the status of electricity networks. This
helps in following the operational status of electricity
networks, but a direct combination of the relations be-
tween these networks is not available.
Mobile network operators are also prepared for major
disturbances. Cooperation with electricity companies is
important to coordinate the distribution of backup power
to critical areas. However, there is no common system,
e.g., a common map service, to show disturbances of both
networks that is available for this purpose. The mobile
network operators also follow weather forecasts in order
to prepare for possible disaster scenarios caused by
storms or other extreme weather phenomena.
In Finland, State Security Networks Ltd. has devel-
oped a situation awareness system, KRIVAT, that com-
bines information from different stakeholders such as
DSOs and telecommunication operators. They offer a
map-based view that presents disturbances of electricity
networks and mobile networks. However, the system
does not present accurate coverage areas of mobile net-
works. In addition, the service includes a discussion fo-
rum for all stakeholders and with meteorology. The main
difference from other existing services is that in addition
to a situation awareness system they offer a secured tele-
communication connection to their customers.
One form of preparedness for major disturbances is a
real-life exercise in cooperation with electricity compa-
nies and the authorities. Thus, mobile network operators
practice in advance the situations in which major disturb-
ances could happen. This improves their ability to react
to these events and helps to speed up the recovery pro-
cess in times of actual disaster scenarios.
IV. The Method for Information Exchange
in Disturbances
In this study, a new method was developed to improve
information exchange between stakeholders in electricity
and mobile network disturbance cases. This method is

Heidi Krohns-Välimäki, Joonas Säe, Jussi Haapanen, Pekka Verho and Jukka Lempiäinen
based on a concept of a situation awareness system that
benefits all stakeholders. [1]-[5]. The method is tested
with a developed demonstration of a situation awareness
system that specifically combines the information from
both the electricity and mobile network. The demonstra-
tion illustrates how the exchange of information between
stakeholders could be executed by using the situation
awareness system.
IV.1. A demonstration of a situation awareness system
The developed demonstration illustrates disturbances
of electricity and mobile networks in a web-based user
interface. In addition, it illustrates customers who are
heavily dependent on the electricity or mobile network,
the so-called critical customers. The critical customers
can be, e.g., patients who need special healthcare, elderly
people or critical infrastructure sites such as water pump-
ing stations. Information about critical customers is
stored in a manually updated database which users can
update by themselves. The structure of the system is pre-
sented in Fig. 3.
The demonstration combines information from multi-
ple DSOs and mobile network operators as seen from
Fig. 3. This information can be combined with infor-
mation about weather conditions, e.g. lightning strikes,
the status of fire and rescue service tasks and traffic re-
port. The main users (customers) are distribution system
operators and mobile operators. In addition, municipali-
ties, authorities and fire and rescue services can benefit
from the system. The demonstration can be personalized
for different organizations.
Fig. 3. A diagram of the demonstration.
IV.2. The user interface of the demonstration
The demonstration presents combined information
from both electricity and mobile networks on a map. The
user interface of the demonstration consists of a map part
to which different information layers can be added and an
event log where the amount of the electricity network
outages can be seen with one view (Fig 4).
Fig. 5 shows a closer view of the user interface (the
map has been stripped away from the figure because of a
non-disclosure agreement). The gray light bulb symbol
indicates the transformer station which has an outage and
the red polygon indicates the lack of mobile network
coverage. In addition, mobile network base stations have
their own symbol. The color of the base station symbol
shows whether the base station does not have electricity
or if it is running on batteries. It is marked with a blue
symbol when the situation is normal. If a base station has
to rely on batteries, the color of the symbol is yellow, and
if it does not have any electricity the color of the symbol
is red.
Fig. 4. The user interface of the demonstration.

Heidi Krohns-Välimäki, Joonas Säe, Jussi Haapanen, Pekka Verho and Jukka Lempiäinen
Fig. 5. Detailed view of the user interface during a disturbance.
V. The Implementation of the Demonstra-
tion
V.1. Electricity network
The electricity network part of the situation awareness
system is based on existing systems and methods used by
the DSOs to inform customers about outages and mainte-
nances. The main source of the information is the DMS.
The DMS maintains the distribution network state and
signals related systems whenever a change of state oc-
curs. Currently, this method is utilized by the DSOs in
order to provide an outage information web page to cus-
tomers. The web page shows the current state of the net-
work, information on when outages started and the ap-
proximate ending time of these outages. This is also used
for providing an SMS service in which the DSO informs
its users about future maintenance and possible outages
as soon as the information about them has been con-
firmed. When a change of state happens, the DMS gener-
ates outage information data about the current state of the
network. The data contain important information about
the outage, such as the start time, the end time and the
type and a description of each outage. These data are sent
to the situation awareness system using the Simple Object
Access Protocol (SOAP) or by sending the data as an
Extensible Markup Language (XML) formatted file. The
data are sent over Hypertext Transfer Protocol Secure
(HTTPS). If the data are sent using the SOAP, the DMS
implements a SOAP client that connects to the SOAP
server implemented by the situation awareness system.
The DMS pushes the changes to the situation awareness
system whenever a change of state occurs. If a simple file
transfer is used, the situation awareness system polls the
server changes in the file.
The DMS generates outage information on two differ-
ent levels; a transformer level and a customer level. The
transformer-level outage information contains the outage
information and a list of affected transformers. The in-
formation is generic and cannot be utilized to identify any
single customer unless the customer’s transformer code is
known. The customer-level outage information contains
the same outage information as the transformer-level out-
age information. It also contains more information about
the outage, such as a list of affected customers’ identifi-
cation numbers, the certainty of the outage and the state
of the outage, meaning whether it is a new outage or re-
curring outage or the supply is temporarily restored.
These data can be used to identify a single customer.
Once the data are received, the system saves the data
into a relational database (such as MySQL or Post-
greSQL). As the data are sent on two different levels (the
transformer and the customer level) the data are first
parsed and combined together. Each outage has a unique
identifier that can be used to combine the two levels of
outage information together.
Users connect to the system with a web-based user in-
terface. The user interface works on all modern browsers.
Once a user connects to the system the user requests data
from it. The outage information which the user is inter-
ested in is sent to the user on the basis of previously set
organizational information and user settings. The data
that are received are further parsed on the user's browser
and displayed to the user. The data can be further filtered
by the user in the browser-based user interface. The user
interface keeps on polling the server for changes in the
network in order to keep the user interface up to date.
V.2. Mobile network
The implementation of the mobile network part of the
system was based on the existing infrastructure of a mo-
bile network operator and accurate configuration data
available for a certain area in Finland. The individual
coverage areas were accurately simulated with a mobile
network simulation tool in which all the necessary con-
figuration parameters had been taken into account. These
included base station locations, antenna heights, antenna
directions, antenna tilting levels, antenna models and
their gains, transmission powers and any additional loss-
es, as well as the frequencies used for GSM and the Uni-
versal Mobile Telecommunications System (UMTS), i.e.,
the second-generation (2G) and the third-generation (3G)
cellular networks. In addition, the simulations required
information about the elevation data of the area in the
form of Digital Elevation Maps (DEMs), together with
the type of environment the area had. The environment is
taken into account with different morphographic correc-
tions, which cause different attenuations for the propagat-
ing signal.
The simulations then used the Okumura-Hata [28] path
loss model to calculate the final coverage areas for every
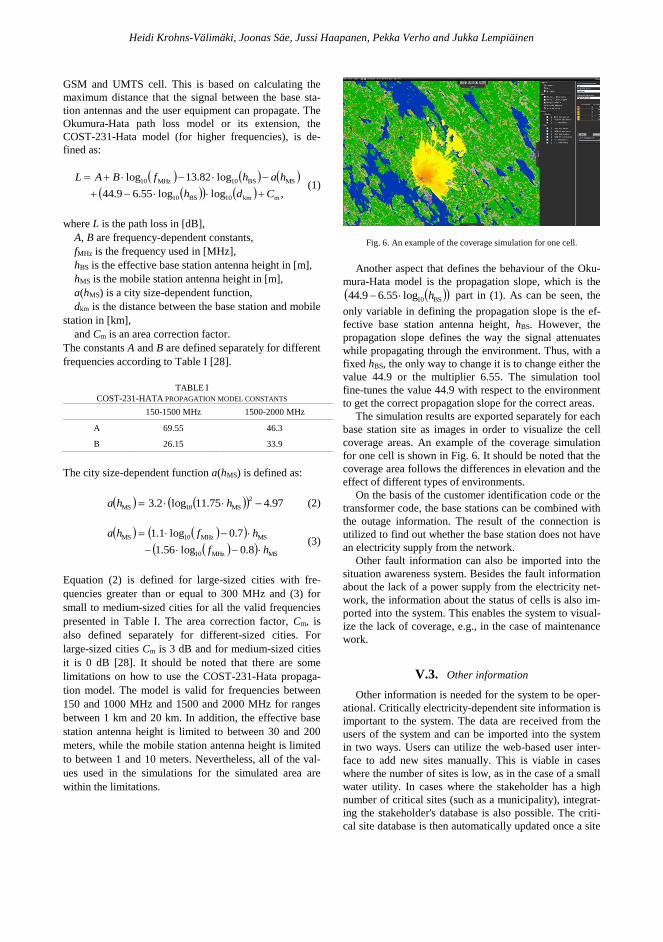
Heidi Krohns-Välimäki, Joonas Säe, Jussi Haapanen, Pekka Verho and Jukka Lempiäinen
GSM and UMTS cell. This is based on calculating the
maximum distance that the signal between the base sta-
tion antennas and the user equipment can propagate. The
Okumura-Hata path loss model or its extension, the
COST-231-Hata model (for higher frequencies), is de-
fined as:
,loglog55.69.44
log82.13log
mkm10BS10
MSBS10MHz10
Cdh
hahfBAL
(1)
where L is the path loss in [dB],
A, B are frequency-dependent constants,
fMHz is the frequency used in [MHz],
hBS is the effective base station antenna height in [m],
hMS is the mobile station antenna height in [m],
a(hMS) is a city size-dependent function,
dkm is the distance between the base station and mobile
station in [km],
and Cm is an area correction factor.
The constants A and B are defined separately for different
frequencies according to Table I [28].
TABLE I
COST-231-HATA PROPAGATION MODEL CONSTANTS
150-1500 MHz 1500-2000 MHz
A 69.55 46.3
B 26.15 33.9
The city size-dependent function a(hMS) is defined as:
97.475.11log2.32
MS10MS hha (2)
MSMHz10
MSMHz10MS
8.0log56.1
7.0log1.1
hf
hfha
(3)
Equation (2) is defined for large-sized cities with fre-
quencies greater than or equal to 300 MHz and (3) for
small to medium-sized cities for all the valid frequencies
presented in Table I. The area correction factor, Cm, is
also defined separately for different-sized cities. For
large-sized cities Cm is 3 dB and for medium-sized cities
it is 0 dB [28]. It should be noted that there are some
limitations on how to use the COST-231-Hata propaga-
tion model. The model is valid for frequencies between
150 and 1000 MHz and 1500 and 2000 MHz for ranges
between 1 km and 20 km. In addition, the effective base
station antenna height is limited to between 30 and 200
meters, while the mobile station antenna height is limited
to between 1 and 10 meters. Nevertheless, all of the val-
ues used in the simulations for the simulated area are
within the limitations.
Fig. 6. An example of the coverage simulation for one cell.
Another aspect that defines the behaviour of the Oku-
mura-Hata model is the propagation slope, which is the
BS10log55.69.44 h part in (1). As can be seen, the
only variable in defining the propagation slope is the ef-
fective base station antenna height, hBS. However, the
propagation slope defines the way the signal attenuates
while propagating through the environment. Thus, with a
fixed hBS, the only way to change it is to change either the
value 44.9 or the multiplier 6.55. The simulation tool
fine-tunes the value 44.9 with respect to the environment
to get the correct propagation slope for the correct areas.
The simulation results are exported separately for each
base station site as images in order to visualize the cell
coverage areas. An example of the coverage simulation
for one cell is shown in Fig. 6. It should be noted that the
coverage area follows the differences in elevation and the
effect of different types of environments.
On the basis of the customer identification code or the
transformer code, the base stations can be combined with
the outage information. The result of the connection is
utilized to find out whether the base station does not have
an electricity supply from the network.
Other fault information can also be imported into the
situation awareness system. Besides the fault information
about the lack of a power supply from the electricity net-
work, the information about the status of cells is also im-
ported into the system. This enables the system to visual-
ize the lack of coverage, e.g., in the case of maintenance
work.
V.3. Other information
Other information is needed for the system to be oper-
ational. Critically electricity-dependent site information is
important to the system. The data are received from the
users of the system and can be imported into the system
in two ways. Users can utilize the web-based user inter-
face to add new sites manually. This is viable in cases
where the number of sites is low, as in the case of a small
water utility. In cases where the stakeholder has a high
number of critical sites (such as a municipality), integrat-
ing the stakeholder's database is also possible. The criti-
cal site database is then automatically updated once a site

Heidi Krohns-Välimäki, Joonas Säe, Jussi Haapanen, Pekka Verho and Jukka Lempiäinen
is added to the stakeholder's own database.
The weather information in the system is fetched from
an interface provided by the Finnish Meteorology Insti-
tute (FMI). FMI provides a Web Feature Service (WFS)
compatible interface for fetching the weather information.
FMI provides forecasts, current weather information and
history information. The data are fetched using Hypertext
Transfer Protocol (HTTP).
The Finnish rescue services provide an interface for
media and other users to get information about the cur-
rent activities of the rescue services. These data are also
fetched from the interface using HTTP.
Furthermore, other information can be implemented
into the system; e.g., the Finnish Transport Agency
(FTA) provides information about the current traffic situ-
ation. These data can be fetched from the SOAP interface
provided by FTA. In addition, the system can be integrat-
ed with DSOs’ work management systems to follow the
location of the repair teams.
VI. The Live Demonstration – Case in Fin-
land
The demonstration was tested in two different cases. In
the previous study the system was tested on the basis of
history data from a disturbance case in Finland that af-
fected both the electricity and mobile networks [1]. In
this study, the system was tested with live operational
networks.
A live version of the demonstration was developed to
test how the SA system could be implemented. The
demonstration combines information from four DSOs and
one mobile network operator. The demonstration presents
the lack of coverage areas in the mobile network and out-
ages of the electricity networks on the transformer level
on a map view. The area that is studied is the operating
area of the chosen DSOs. In addition to mobile network
coverage, the base stations that have faults are also shown
on the map.
The information on the outages is combined with the
information about the location of the critical customers.
Customers can be added to the system on the basis of
their transformer number. The system gives a warning
when a critical customer has an electricity network out-
age.
In order to implement this functionality in (near) real
time, an interface between the mobile network system
and the situation awareness system was developed. In the
system, the mobile network fault information is collected
every 10 minutes from a file that has been generated by
the mobile network operator and sent to the situation
awareness system. The system then extracts the infor-
mation and visualizes the possible changes that have hap-
pened after the previous fault information update. This
enables a near real-time presentation which is still rela-
tively light to compute. The data from the DSOs is col-
lected every five minutes from the DSOs’ web page inter-
face. At present, the outages of the electricity networks
are observed on the transformer level.
The live demonstration was tested for two months in
this study. The disturbances that occurred during the test-
ing time were observed with it. During the testing period
there were no major disturbances to any of the networks.
Smaller outages occurred once or twice per week. Once a
small electricity network outage resulted in just one mo-
bile network base station blackout (Fig. 7). In this case
the outage did not have an effect on mobile network cov-
erage because the other base stations nearby covered the
missing area.
Fig. 7. Outage of electricity network and faulted base station of mobile
network illustrated in the demonstration.
VII. Benefits of the method for situation
awareness system
The combined electricity and mobile network situation
awareness system helps to monitor the electricity and
mobile networks, especially in the event of major dis-
turbances. It improves the restoration process as a result
of the added value from the interoperability of these net-
works. In addition, the resilience of the society during
disturbance situations improves when the authorities have
information as to whether their critical customers or criti-
cal sites lack electricity or mobile service. This infor-
mation can then be utilized to prioritize the restoration
process of the networks for the most critical areas. Thus,
repair teams are able to concentrate more on the most
critical areas, and if the situation changes it will be visi-
ble in the system and changes to the repair order can be
decided fluently and effectively. The improvements in
terms of information exchange and benefits to the system
are illustrated in Table II.
As shown in the case study [1], the situation awareness
system can be utilized to find out the vulnerabilities and

Heidi Krohns-Välimäki, Joonas Säe, Jussi Haapanen, Pekka Verho and Jukka Lempiäinen
the interdependencies of critical infrastructures. This in-
formation can be highly useful when planning an electric-
ity or mobile network. In addition, the information can be
utilized in a restoration planning process. Illustrated situ-
ation awareness improvements help DSOs to plan their
restoration processes more effectively. The repair order
of the electricity network faults can be changed so that
the most important base stations utilized by DSOs’ re-
mote-controlled devices are restored first. In addition, the
fault repair order can take into account the most disturb-
ance-vulnerable electricity consumer sites, which are
important to the resilience of society. This can
also improve DSOs’ network planning by recognizing
existing problematic areas, which could be prevented in
the planning process of new areas. If the DSOs know the
location of the important base stations, they can plan the
network so that those areas are more resilient, e.g., with
ground cabling. Furthermore, the DSOs can consider
changing the communication media in those areas where
mobile network coverage is most vulnerable to disturb-
ances.
TABLE II
SITUATION AWARENESS BENEFITS
One benefit of the system is that the DSOs and the
mobile network operators can find out how their recovery
process is working. They can detect if everything went as
planned. Likewise, they can find out whether the process-
es of the other stakeholders caused the problems or if the
problems were in their own processes.
In addition, the demonstration can extend the DSOs’
work management with the information about repair
teams which do not have mobile network coverage. It can
also be utilized to warn the teams before they move to an
area without coverage or to inform them beforehand
where to proceed when they need to find some coverage.
With the information received from the demonstration,
mobile network operators could plan their backup power
PRESENT WITH SITUATION AWARENESS SYS-
TEM
BENEFITS OF THE SYSTEM
DSOs
customers with high con-
sumption of electricity
customers who are heavily dependent on
electricity
DSOs can take these sites into account when
planning the network or the restoration plan
no or some important base
stations of mobile network
all faulted base stations of mobile network base stations most important to DSOs’ operation
can be detected and secured
inaccurate awareness of mo-
bile network coverage
detailed awareness of mobile network cover-
age
predict the possible disturbances in own network
caused by mobile network
location of repair teams information if repair team does not have
mobile network service
repair team can be informed beforehand where to
proceed when they need to find some coverage
location of remote-controlled
devices
warning if remote-controlled device does not
have mobile network coverage
prediction if this can affect DSOs’ own restora-
tion process
Mobile net-
work opera-
tors
warning if base station does
not have electricity supply
from the electricity network
estimation of the end time of the outage prediction if more backup power is needed
inaccurate information about
the running time of the back-
up power of the base stations
prediction of how long the mobile network
will operate with backup power after the first
outage
mobile network operators can utilize this infor-
mation to renew poorly functional batteries
inaccurate awareness of dis-
turbances of electricity supply
detailed awareness of disturbances of elec-
tricity supply
predict the possibility of disturbance situation in
own network
base stations that are the most
important for mobile network
coverage
base stations that would be most important
to the restoration of the electricity network
mobile network operators can improve their
backup for the most important base stations to
expedite the coverage restoration process of the
mobile networks
no information about critical
customers that are highly
dependent on mobile cover-
age, e.g., home care patients,
retirement homes
which base stations are most important to
the critical customers, e.g., retirement homes
the sites can be taken into account when placing
the backup power
Authorities &
Municipalities
inaccurate awareness of dis-
turbances of electricity net-
work
detailed awareness of disturbances of elec-
tricity supply from one view
authorities and municipalities can improve the
planning of their own duties
inaccurate awareness of mo-
bile network coverage
detailed awareness of mobile network cover-
age
authorities and municipalities can improve the
planning of their own duties
location of customer whose
life is dependent on electricity
supply or mobile network
coverage
warning if critical customer does not have
electricity supply or mobile network cover-
age
prediction of whether residents need to be evac-
uated or otherwise helped
location of own critical sites,
e.g., water pumping stations
warning if critical site does not have electric-
ity supply or mobile network coverage
municipalities can plan which sites need backup
and which can be substituted, e.g., sharing water
among residents instead of providing the backup
to a water pumping station

Heidi Krohns-Välimäki, Joonas Säe, Jussi Haapanen, Pekka Verho and Jukka Lempiäinen
batteries or reserve power more precisely. They can rec-
ognize the base stations that are the most important to the
resilience of the electricity network and improve their
backups. This can expedite the coverage restoration pro-
cess of the mobile networks. Further, the information
about disturbance areas of electricity networks can be
used to find the most vulnerable base stations from the
operators’ own network and increase their backup power
batteries or other reserve power. While cooperating in the
network planning process, DSOs and mobile network
operators can detect the most vulnerable areas for the
operations of both networks and plan the backup power
together.
In the long run, the SA system makes it possible to de-
tect deteriorated mobile network base station backup bat-
teries. The DSOs can use this information to, e.g., plan
their restoration process so that the electricity will be
restored first at those locations. The mobile network op-
erators can utilize this information to renew poorly func-
tional batteries.
The information feed to the system can be processed
further; e.g., when the customer number of the base sta-
tion is known, it is possible to detect if it does not have
electricity feed from the network at the moment. Further,
knowing that the base station is still working means it is
possible to find out that it is working on batteries. In this
case, how long the batteries will work can be determined.
The information can then be saved into the system for
later utilization. DSOs can utilize this information to pre-
dict how long their devices will have a mobile connec-
tion. In addition, the mobile network operators can utilize
this information in the maintenance planning process.
Besides improving the recovery of the electricity and
mobile networks, the system can improve the resilience
of society in disturbances. Municipalities are able to rec-
ognize the customers who have safety phones or safety
buttons in areas which are temporarily lacking mobile
network coverage or an electricity supply. Municipalities
can utilize the information to send help to customers or to
plan their evacuation. The warnings of critical sites help
municipalities to plan the placement of movable reserve
power or to plan whether the site can be substituted, e.g.,
sharing water among residents instead of providing back-
up power to a water pumping station.
For authorities such as the fire and rescue services the
awareness of the disturbance area plays an essential role
for their operation. Thus, they can prepare for an increas-
ing amount of work and summon more officers to duty.
The combination of the information of multiple DSOs
reduces the number of information sources and the work-
load of the authorities. With the situation awareness sys-
tem, the fire and rescue services can increase their help to
the municipalities, e.g., it will improve evacuation plan-
ning together with municipalities.
VIII. Conclusion
In this study, a new method to improve the disturbance
management of electricity and mobile networks was pre-
sented. The method is based on a situation awareness
system which combines the information from both the
electricity and the mobile network. During the study a
demonstration of the system was implemented utilizing
the existing systems. To test the method a live demonstra-
tion was performed in Finland. The demonstration com-
bines information from multiple DSOs and one mobile
network operator.
The main problem with the present situation awareness
systems utilized in disturbances of electricity and mobile
networks is that the interdependencies of different infra-
structures are not taken into account and the information
presented in the system is not further processed as is the
case in the MASAS system [25], [26]. In addition, some
of the systems are still limited to presenting information
from only one stakeholder. This can hamper the restora-
tion process of the networks.
The authorities and the operators of both networks can
benefit from the situation awareness system and not only
the authorities as in the system presented in [24]. The
DSOs and network operators can utilize the system in
restoration planning, e.g., the mobile network operators
can place more backup power at the base stations that are
most important for the operation of the electricity net-
work. In addition, the information from the system can be
utilized to improve the network planning, e.g., DSOs can
ensure the electricity supply for the most important mo-
bile network base stations by ground cabling. For the
authorities the most beneficial functionality is the infor-
mation about the status of the critical sites. With this in-
formation they can focus their actions on the right resi-
dents, e.g., safety phone customers.
There can be problems in adopting the new method if
it depends on a commercial system, where the data are
produced by customers themselves. Some of the existing
systems have had problems acquiring customers because
the variety of the input data is dependent on the number
of customers that produce the data. In that case, the
amount of information received for first users is limited
and the benefits of the system stay low. The best situation
in which to adopt the method is if there is legislation or
regulation that forces the stakeholders to add data to the
system. In that case, the system could utilize all the data
at the same time.
IX. Further Studies
The future research should relate to analyzing the per-
formance of the real-time system and its impact on the
overall time needed to manage disturbance situations.
The testing of the live demonstration will continue fur-
ther. The main goal is to test the demonstration in the
event of a major disturbance that affects multiple electric-
ity networks and mobile networks. In addition, more us-
ers will be added to the system, e.g., DSOs and munici-
palities, for testing purposes.
The future research around this new method should al-

Heidi Krohns-Välimäki, Joonas Säe, Jussi Haapanen, Pekka Verho and Jukka Lempiäinen
so include developing additional algorithms, e.g., auto-
matic warnings on top of the system that has been devel-
oped. In addition, e.g., machine learning algorithms could
highlight interesting information from the operational
networks, especially about the interdependencies between
the networks.
Acknowledgements
The authors would like to thank the Finnish Funding
Agency for Innovation (TEKES) for funding and support-
ing the research work.
References
[1] H. Krohns-Välimäki, J. Haapanen, P. Verho, J. Säe and J. Lempi-
äinen, Combined electricity and mobile network situation aware-
ness system for disturbance management, IEEE PES Innovative
Smart Grid Technologies, Asia 2015 (ISGT ASIA 2015), Novem-
ber 3-6, 2015, Bangkok, Thailand.
http://dx.doi.org/10.1109/ISGT-Asia.2015.7387099
[2] H. Krohns, V. Hälvä, J. Strandén, P. Verho and J. Sarsama,
Demonstration of communication application for major disturb-
ances in the supply of electric power, 23rd International Confer-
ence and Exhibition on Electricity Distribution (CIRED 2015),
June 15-18, 2015, Lyon, France.
[3] H. Krohns-Välimäki, H. Aalto, K. Pylkkänen, J. Strandén, P.
Verho and J. Sarsama, Developing situation awareness in major
disturbances of electricity supply, IEEE PES Innovative Smart
Grid Technologies, Europe 2014 (ISGT EU 2014), October 12-
15, 2014, Istanbul, Turkey.
http://dx.doi.org/10.1109/ISGTEurope.2014.7028847
[4] H. Krohns-Välimäki, J. Strandén, K. Pylkkänen, V. Hälvä, P.
Verho and J. Sarsama, Improving shared situation awareness in
disturbance management, 22nd International Conference and
Exhibition on Electricity Distribution (CIRED 2013), June 10-13,
2013, Stockholm, Sweden.
http://dx.doi.org/10.1049/cp.2013.1112
[5] H. Krohns, V. Hälvä, J. Strandén, P. Verho, J. Sarsama, Demon-
stration of Communication Application for Major Disturbances in
the Supply of Electric Power, International Symposium on The
Electric Power System of the Future – Integrating supergrids
and microgrids (CIGRÉ 2011), September 13-15, 2011, Bologna,
Italy.
[6] J. Strandén, V.-P. Nurmi, P. Verho and M. Marttila, State of
preparedness of Finnish society for major disturbances in distri-
bution of electricity, (2009) International Review of Electrical
Engineering (IREE), vol. 4(2), pp. 211-219.
[7] J. Strandén, H. Krohns-Välimäki, P. Verho, J. Sarsama, V. Hälvä,
Influence of Major Disturbances in Electricity Supply on the Op-
erating Environment of Distribution System Operators: a Case
Study, (2014) International Review of Electrical Engineering
(IREE), vol 9(2), pp. 363-372.
[8] Energy Market Authority, “Summer 2010 storms from point of
view of electricity grid” [“Kesän 2010 myrskyt sähköverkon kan-
nalta” in Finnish]. Report, 306/401/2011, Finland 2011.
[9] Con Edison Media Relations, “Con Edison restores 225,000
customers,” News 1.11.2012. [Online]. Available:
http://www.coned.com/newsroom/news/pr20121101.asp
[10] Union for the Coordination of Transmission of Electricity
(UCTE), “Final Report – System Disturbance on 4 November
2006,” January 2007. [Online]. Available: https://www.entsoe.eu
/fileadmin/user_upload/_library/publications/ce/otherreports/Fina
l-Report-20070130.pdf
[11] FICORA 54 B/2014 M. Regulation on resilience of communica-
tions networks and services. Finnish Communications Regulatory
Authority. 16 p. December 2014. [Online, in Finnish]. Available:
https://www.viestintavirasto.fi/attachments/maaraykset/Viestintav
irasto54B2014M.pdf
[12] G. H. Kjølle, I. B. Utne, O. Gjerde, Risk analysis of critical infra-
structures emphasizing electricity supply and interdependencies,
(2012) Elsevier Reliability Engineering and System Safety, vol.
105(9), pp. 80-89.
http://dx.doi.org/10.1016/j.ress.2012.02.006
[13] S. Horsmanheimo, N. Maskey, L. Tuomimäki, H. Kokkoniemi-
Tarkkanen and P. Savolainen, Evaluation of interdependencies
between mobile communication and electricity distribution net-
works in fault scenarios, IEEE Innovative Smart Grid Technolo-
gies, Asia 2013 (ISGT ASIA 2013), November 10-13, 2013, Ban-
galore, India.
http://dx.doi.org/10.1109/ISGT-Asia.2013.6698771
[14] A. J. Wilson, The use public wireless network technologies for
electricity network telecontrol, (2005) Computing & Control En-
gineering Journal, vol. 16(2), pp. 32-39.
http://dx.doi.org/10.1049/cce:20050206
[15] T. Rigole, K. Vanthournout, G. Deconinck, Interdependencies
between an Electric Power Infrastructure with Distributed Con-
trol, and the Underlying ICT Infrastructure, International Work-
shop on Complex Network and Infrastructure Protection, March
28-29, 2006, Rome, Italy.
[16] S. M. Rinaldi, J. P. Peerenboom and T. K. Kelly, Identifying,
understanding, and analyzing critical infrastructure interdepend-
encies, (2001) IEEE Control Systems, vol. 21(6), pp. 11-25.
http://dx.doi.org/10.1109/37.969131
[17] J. K. Kok, C. J. Warmer, I. G. Kamphuis, PowerMatcher: multia-
gent control in the electricity infrastructure, Proceedings of the
fourth international joint conference on Autonomous agents and
multiagent systems 2005 (AAMAS ’05), July 25-29, 2005,
Utrecht, Netherlands.
http://dx.doi.org/10.1145/1082473.1082807
[18] F. Edström and L. Söder, Impact of remote control failure on
power system restoration time, 2010 IEEE 11th International
Conference on Probabilistic Methods Applied to Power Systems
(PMAPS), June 14-17, 2010, Singapore, Singapore.
http://dx.doi.org/10.1109/PMAPS.2010.5528893
[19] D. P. Bernardon, V. J. Garcia, M. Sperandio, J. L. Russi, E. F. B.
Daza and L. Comassetto, Automatic reestablishment of power
supply in distribution systems using Smart Grid concepts, 2010
IEEE/PES Transmission and Distribution Conference and Expo-
sition: Latin America (T&D-LA), November 8-10, 2010, São Pau-
lo, Brazil.
http://dx.doi.org/10.1109/TDC-LA.2010.5762859
[20] M. Hyvärinen, S. Pettissalo, P. Trygg., K. Malmberg, J. Homlund,
L. Kumpulainen, A comprehensive secondary substation moni-
toring system, 20th International Conference and Exhibition on
Electricity Distribution (CIRED 2009), June 8-11, 2009, Prague,
Czech Republic.
http://dx.doi.org/10.1049/cp.2009.0920
[21] Z. Lipošćak and M. Bošković, Survey of smart metering commu-
nication technologies, 2013 IEEE EUROCON, July 1-4, 2013,
Zagreb, Croatia.
http://dx.doi.org/10.1109/EUROCON.2013.6625160
[22] F. H. M. Salleh, Z. C. Cob, M. Shanmugam and S. S. M. Shariff,
Review on Mobile Workforce Management System for Electricity
Supply Industries, 2nd International Conference on Computer
Science and its Applications (CSA-09), December 10-12, 2009,
Jeju Island, Korea (South).
http://dx.doi.org/10.1109/CSA.2009.5404337
[23] Ericsson (2015). Ericsson Mobility Report. November 2015.
Stockholm: Ericsson. [Online]. Available:
http://www.ericsson.com/res/docs/2015/mobility-report/ericsson-
mobility-report-nov-2015.pdf
[24] A. Schweer, K. Schaum, D. Hollmach, A New grid driven ap-
proach to guarantee reliable communication during power outag-
es, 22nd International Conference and Exhibition on Electricity
Distribution (CIRED 2013), June 10-13, 2013, Stockholm, Swe-
den.
http://dx.doi.org/10.1049/cp.2013.1252

Heidi Krohns-Välimäki, Joonas Säe, Jussi Haapanen, Pekka Verho and Jukka Lempiäinen
[25] J. Pagotto, D. O’Donnell, Canada’s Multi-Agency Situational
Awareness System – Keeping It Simple, 9th International Con-
ference on Information Systems for Crisis Response and Man-
agement (ISCRAM2012), April 22-25, 2012, Vancouver, Canada.
[26] CanOps – Canadian Public Safety Operations Organization,
MASAS - Multi-Agency Situational Awareness System. [Online].
Available: http://www.canops.org/?page=AboutMASAS
[27] FICORA 57 A/2012 M. Regulation on the maintenance of com-
munications network and communications services, procedures
and notifications in the event of faults and disturbances. Finnish
Communications Regulatory Authority. 15 p. January 2012.
[Online]. Available: https://www.viestintavirasto.fi/attachments/
maaraykset/Viestintavirasto57A2012M_EN.pdf
[28] D. Cichon and T. Kümer, Propagation prediction models, In
European Commission (Ed.), Digital mobile radio towards future
generation systems – final report, 4 (COST Action 231, 1999, pp.
115-208).
Authors’ information
1Department of Electrical Engineering, Tampere University of Tech-
nology, 33720 Tampere, Finland. e-mail: [email protected]
2Department of Electronics and Communications Engineering, Tampe-
re University of Technology, 33720 Tampere, Finland. e-mail:
3Wapice Ltd., 33720 Tampere, Finland. e-mail:
4Department of Electrical Engineering, Tampere University of Tech-
nology, 33720 Tampere, Finland. e-mail: [email protected]
5Department of Electronics and Communications Engineering, Tampe-
re University of Technology, 33720 Tampere, Finland. e-mail:
Heidi Krohns-Välimäki was born in
Joensuu, Finland, June 1985. She received her
M.Sc. from the Department of Electrical
Energy Engineering, Tampere University of
Technology, Tampere, Finland, in March
2010.
Since April 2010 she has been a researcher in
the Department of Electrical Engineering at
TUT. Her research interests include situation awareness in major dis-
turbances in the supply of electricity.
Joonas Säe was born in Hyvinkää, Finland,
in 1987. He received both his B.Sc. and M.Sc.
degrees (both with distinction) in signal pro-
cessing and communications engineering
from Tampere University of Technology,
Tampere, Finland, in 2011 and 2012, respec-
tively.
Currently he is working towards the Dr. Tech.
degree. His main interests are radio network planning aspects and the
performance improvements of radio networks in disaster scenarios. He
is a student member of IEEE.
Jussi Haapanen was born in Kirchheim unter
Teck, Germany in 1990. He received his
M.Sc. in 2015 from the Department of Elec-
trical Engineering, Tampere University of
Technology.
Since 2015 he has been working as a re-
searcher at Tampere University of Technolo-
gy. His research interests include information
systems for managing disturbances of electricity and telecommunica-
tion networks.
Pekka Verho was born in Hauho, Finland,
February 1966. He received his M.Sc. and Dr.
of Engineering degrees in electrical engineer-
ing from Tampere University of Technology
in 1991 and 1997 respectively.
He worked as a research engineer at Tampere
University of Technology 1990-1997 and
from 1997 to 2007 as product and research
manager in ABB distribution automation. From 2000 to 2007 he was a
part-time professor at Tampere University of Technology (TUT).
Nowadays he is working as a full-time professor at TUT. His main
areas of interest are asset management and information system applica-
tions for electricity distribution.
Jukka Lempiäinen was born in Helsinki,
Finland, in 1968. He received an M.Sc., Lic.
Tech, Dr. Tech. all in Electrical Engineering,
from Helsinki University of Technology,
Espoo, Finland, in 1993, 1998 and 1999,
respectively. He is a Senior Partner and the
President of European Communications Engi-
neering Ltd. He has altogether more than
twenty years’ experience in GSM based mobile network planning and
consulting. Currently, he is also a part-time Professor of the Telecom-
munications (Radio Network Planning) at Tampere University of
Technology, Finland. He has written two international books about
GSM/GPRS/UMTS cellular radio planning, several international jour-
nal and conference papers and he has three patents. He is URSI Na-
tional Board Member, Finland.

Publication 4
H. Krohns-Välimäki, J. Haapanen, P. Verho, J. Säe, and J. Lempiäinen, “Combinedelectricity and mobile network situation awareness system for disturbance management,”in Proceedings of the IEEE Innovative Smart Grid Technologies - Asia (ISGT ASIA),Bangkok, Thailand, 3.–6. Nov. 2015. DOI: 10.1109/ISGT-Asia.2015.7387099
Copyright c© 2015 IEEE. Reprinted, with permission, from Proceedings of the IEEEInnovative Smart Grid Technologies - Asia (ISGT ASIA).
In reference to IEEE copyrighted material which is used with permission in this thesis, theIEEE does not endorse any of Tampere University of Technology’s products or services. In-ternal or personal use of this material is permitted. If interested in reprinting/republishingIEEE copyrighted material for advertising or promotional purposes or for creatingnew collective works for resale or redistribution, please go to http://www.ieee.org/publications_standards/publications/rights/rights_link.html to learn how toobtain a License from RightsLink.
99


Combined Electricity and Mobile Network Situation Awareness System for Disturbance Management
Heidi Krohns-Välimäki Jussi Haapanen
Pekka Verho Department of Electrical Engineering Tampere University of Technology
Tampere, Finland [email protected]
Joonas Säe Jukka Lempiäinen
Department of Electronics and Communications Engineering
Tampere University of Technology Tampere, Finland [email protected]
Abstract—In this research, a demonstration of a situation awareness system is presented. A real case of the disturbance of the electricity network was illustrated with the demonstration. The state of the remote controlled switches was simulated based on the model of the mobile network coverage and compared with the real state information from the online remote field service provider. The case study confirmed that there are interdependencies between both networks. The main contribution of this research is a new method to improve the disturbance management of electricity and mobile networks and to improve the resilience of the society in disturbances by a combined situation awareness system.
Index Terms—Disturbance, Situation awareness, Co-operation, Mobile network, Remote controlled switch.
I. INTRODUCTION There have been several problems in the information
exchange between organizations in disturbances of electricity supply. Interdependencies between electricity and mobile networks have been noticed. The situation where both electricity and mobile network have an interruption at the same time is complex to manage.
Storms like Pyry and Janika in Finland in 2001, Gudrun 2005 and Per 2006 in Sweden, four storms in the summer of 2010, storms at Christmas of 2011and two storms in autumn of 2013 in Finland caused widespread and long lasting disturbances in the supply of electric power. In those storms, some individual customers were without electricity for a few weeks. In January of 2011 snow load on trees caused widespread disturbances in Finland. In addition to storms that affect the rural area, the hurricane Sandy caused widespread disturbances in Eastern parts of the USA in October of 2012 including some cities. There were e.g. floods that caused outages in Manhattan, New York. [1]-[7]
Many of the long lasting and wide spread disturbances, the so called major disturbances, are induced by storms and other severe weather conditions. However there have also been
major disturbances that have not been especially long lasting but extremely wide spread, like the disturbances in the transmission systems in the USA and Canada in 2003 and in Central Europe in 2006. Both of these caused negative societal consequences. [1]-[7]
Typically, the disturbances caused problems in telecommunication, water supply, animals’ conditions in farms and with the coldness in private houses. The coldness of the houses has even resulted in some evacuations. The problems with telecommunication also affected safety phones and safety buttons. [1]-[7]
Electricity distribution and mobile networks are interdependent. Mobile network base stations require electricity to operate. The base stations should have backup power batteries or other reserve power to maintain the transmission for at least three hours assigned by The Finnish Communications Regulatory Authority (FICORA). However, the electricity disturbance can last longer than the reserve backup power, e.g. because of storms. [8]-[10]
While the electricity network can operate without telecommunications for the operation of the distribution automation (DA) it is necessary. Traditionally most of the communication was done using proprietary communication methods and protocols. Nowadays the mobile network is utilized in multiple ways in distribution networks such as DA and communication with repair groups. [11], [12]
The electricity network is developing towards the Smart Grid, thus the amount of DA devices in the distribution network has increased in recent years. DA devices improve the outage recover times. Previously, a telecommunication link was only established to critical parts of the network such as substations. After a remote connection to substations, the utilization of remote controlled disconnecters started. Nowadays in addition to these devices a connection is also needed for automatic meter reading (AMR). The connection between control center and DA devices is often based on mobile network technologies. Powerline communication
The authors would like to thank the Finnish Funding Agency for Innovation (TEKES) for funding and supporting the research work

(PLC) is also used together with a mobile network (e.g. for AMR meters). These connections also depend on the mobile network as part of the communication link to the control center is implemented using a mobile network. [12], [13]
In addition to remotely controlled devices, Distribution System Operator (DSO) relies on mobile networks to contact and follow repair teams and subcontractors during disturbances. If both actors receive information about these disturbances, their recovery processes could be executed more efficiently.
After the storms in Finland in December 2011 the Finnish Electricity Market act was changed to improve the reliability of the electricity networks. The new addition to the legislation requires DSO to prepare a contingency plan for disturbances. Further, it was added to the legislation that the maximum duration to outage will be six hours in urban areas and 36 hours in rural areas concerning all of the customers from the beginning of 2029. DSOs must prepare development plans to describe how these limits will be achieved and how the electricity supply for the sites that are important to the resilience of the society are ensured. Further, the new legislation requires that the DSOs should participate in the formation of a situational awareness and supply any information relevant to this purpose to the responsible authorities. [14]
This paper presents the demonstration of a situation awareness system that combines information about interruptions of electricity and mobile networks. This system can be utilized to improve the resilience of both networks. Further, a case in which an interruption occurred in both networks has been studied.
II. METHODS A demonstration of inter-organizational situation
awareness system to disturbances of electricity supply has been developed in this research. The developing process has been iterative. The present situation has been studied by literature review and in several cooperative workshops of this research. These results are presented in [1]-[3]. Methods of the usability and user-centered design have been utilized in the design process to improve the demonstration e.g. semi-structured interviews for user needs [14], [15].
In this paper, the main focus is in instrumental case study approach [16]. The case has been simulated with the developed demonstration and compared with the real life case. The results of the comparison were analyzed for studying the capability to utilize the demonstration to improve the restoration process of the electricity networks and mobile networks.
III. THE SOURCES OF THE SITUATION AWARENESS IN DISTURBANCES
Endsley’s theory of the three levelled situation awareness is utilized in design process of the system. The theory defines the situation awareness (SA) as the triad of “perception”, “comprehension” and “projection”. The first level consists of perception of the status, attributes and dynamics relevant elements in the environment of the situation. At the second,
level the comprehension of the situation is formed based on the information received at the first level. At the third level, the perception and comprehension are utilized to form a projection of the future happenings in the situation. [15], [17], [18]
DSO’s situation awareness can be divided into two categories; internal and external (Fig 1). At present, the studies of DSO’s SA are focused internal SA. Thus, the information systems that DSO utilizes are focused to support mainly on that. These systems are SCADA, Distribution Management System (DMS), work management system (WMS) and customer information system (CIS). All of these are designed to support the everyday actions of DSO. [19]-[21]
SCADA collects the status and measurement data from the network. This information is used to control the network. DMS connects data from SCADA and customer information system to map-based user interface. With DMS the overall picture about the network can be seen. It can be used to plan and remake the connections in the network. At disturbance situation DMS is important tool to locate the outages and to get an overall awareness of the situation. In addition, the WMS is an important tool in disturbances, thus it is utilized to locate the repairer teams and to communicate with them. It can be utilized to share tasks and send teams to right places to fix faults. [21]
DSO
DMS
SCADA
WMS
CIS
TSO’s web page
Teleoperator’sweb page
PETO Media
Weather Service
DMS Service
DSO’s web page
SMS
Social Media
Internal SA
External SA
Shared SA
Figure 1. The DSO’s situation awareness.
The external situation awareness of DSO can be divided to the information that DSO delivers to other actors and customers and to the information that DSO receives from others. The main information that DSO needs is the situation of transmission network, because the issues in transmission network can affect the distribution network. Some of the DSOs want to follow the outages of their neighbour DSOs’ networks. By following that information, DSO can predict if storm is coming to their operating area. However, public web pages are the only way to follow the other DSOs. In addition to their systems DSO gets weather forecast and warnings from local meteorological institute. Other information that DSO receives can be e.g. tasks of fire and rescue services. [1]

Some DSOs are co-operating with their local mobile network operators and they may have information about the locations of the important mobile network base stations. In addition, they may follow the coverage information of the mobile network from operator’s public web page. In Finland, the mobile network operators are offering information about their interruptions on a digital map. There are no restrictions about how accurate level the information has to be illustrated, thus some operators are offering information in municipality level while others are offering it in more detailed level. For the purpose of the DSO this information is often too inaccurate.
Some DSOs are maintaining a database about customers that are highly dependent on electricity. However, this information is usually outdated because there are no established practices. [1], [2]
At present, the information that DSO shares to others is focused mainly on their web pages. Most of the DSOs in Finland have an outage map on their web page. Users can utilize the outage map to see which areas the outage affects (in transformer level accuracy), when it has started, when it is estimated to end and how many customers it affects. This information comes from DSO’s DMS. Some DSOs utilizes DMS also to share more detailed information to repairers, subcontractors and fire and rescue services. This so called DMS service was originally designed to share information to subcontractors and it is a direct view to DMS. Technical language is used in the interface and can be difficult to use by the fire and rescue service. In addition, some DSOs have SMS services that send the outage start time, estimated duration and the estimated end time information to the customer. [22], [23]
In Finland, there are three main mobile network operators who have their own infrastructure. Their operating areas are wider than DSO’s, i.e. nationwide. There are multiple DSOs in area of one mobile network operator. The mobile network operators are not offered any additional services i.e. DMS service by DSOs, thus they are relaying on public web pages of DSOs. Consequence of this is that the information that mobile network operators achieve from the disturbances of the electricity network is shattered to multiple systems.
There are some Situation Awareness (SA) systems available for the disturbances of electricity supply. Some of them are designed especially for disturbances of electricity supply and some for common emergency situations. Common for those systems are that they are focused on level 1 and 2 SA and do not process different information to give the projection to future. [20]-[26]
IV. THE DEMONSTRATION OF SITUATION AWARENESS SYSTEM
The problem with present sources of the situation awareness is that the interdependency between electricity and mobile network has not been taken into consideration. None of the systems combines information of the both networks. Furthermore, the devices that are dependent on both networks are not included in present systems. [1], [2]
In this study, the demonstration of a situation awareness system to disturbances of electricity supply has been
developed. This demonstration consists of two parts; 1) first part illustrates the mobile network coverage and base stations, 2) the second part illustrates the information from different actors related in disturbance e.g. fire and rescue services tasks. The demonstration combines information from multiple DSOs and mobile network operators to web based user interface. In addition, information about remote controlled devices can be added to the system. The system structure is presented in Fig. 2.
The main users are distribution system operators and mobile operators. In addition, municipalities, authorities and fire and rescue services can benefit on it. The demonstration can be personalized by organizations.
Web-based user interface
Distribution system
operators
Telecommunication network operators
Rescue services
Finnish meteorology
institute
Finnish transport
agency
Critical sites
database
Distribution system
operators
Rescue services
Telecommunication network operators
Municipalities
Network state information providers Service providers
Manually updated static relational database
Users
Figure 2. The diagram of the demonstration.
This demonstration presents combined information from both networks (Fig. 3). The gray symbol indicates the transformer station which has an outage and the red polygon indicates the lack of mobile network coverage. In addition, mobile network base stations have their own symbol. The color of the base station symbol informs if the base station does not have electricity or if it runs on batteries. It is marked with a blue symbol when the situation is normal. If a base station has to rely on batteries, the color of the symbol is yellow, and if it does not have any electricity supply the color of the symbol is red.
In addition, there is a symbol for the repair team and remote controlled switches. The location information of the repair team can be combined with coverage information to achieve information if the repair team is approaching an area without coverage. Remote controlled switches are presented with a white symbol if they do not have mobile network coverage. Otherwise they have light blue symbols.

Figure 3. A view of the system.
The public authorities can add information about their own critical sites such as people with safety phones to the system. These sites are presented with their own symbols (orange symbol in Fig. 3). The symbol of such critical site will show if there is no electricity or mobile network coverage.
V. THE CASE STUDY - THE REMOTE CONTROLLED SWITCHES
An outage case that occurred in Finland was studied in this research. Information about the case was received from multiple organizations. The DSO provided transformer status information about the area. The mobile network operator provided configuration and status information about the mobile network base stations. An online remote field service provider provided information about the communication link statuses of the switches in the electricity network.
The provided base station configuration data was used to simulate the coverage areas of each base station. The coverage areas have been accurately simulated with a mobile network simulation taking into account all necessary configuration parameters. These parameters include base station locations, antenna heights, antenna directions, antenna tilting, antenna models and their gains, transmission powers and any additional losses as well as the used frequencies for Global System for Mobile Communications (GSM) and Universal Mobile Telecommunications System (UMTS) systems. In addition, Okumura-Hata path loss model was used to calculate the overall signal power loss of the propagated signal from a transmitter to receiver, also taking into account the effect of the elevation differences in the area. The simulation results were exported separately for each base station site as images to visualize the coverage areas.
The base station data has been visualized on the map with the coverage areas and the status information. The mobile network operator provided the information whether the base station was active or not. No information was provided on whether the station is supplied by the network or by the
backup battery. A simple model is used: whenever the nearest transformer is affected by the outage, the base station is being supplied by the backup battery.
In addition third party remote controlled switch statuses were displayed on the map. The status of a switch is either on or off. The switch mainly used the network of the mobile network operator that provided the mobile network data. If the switch is on, the packet loss is 0 %. If the switch is off, the packet loss is 100 %. The modelled coverage areas are used to calculate a modelled status for each switch based on their location in the coverage area. Both the modelled and the actual status are then displayed on the view.
The example of the system’s view is shown in figure 3. The blue symbols present mobile network base stations that are being supplied by the network. The yellow symbols present mobile network base stations that are possibly being supplied by a backup battery. The red symbols present mobile network base stations that are down. The bright blue symbols present remote controlled switch that have a working telecommunication link. Similar white symbols present remote controlled switch without a working telecommunication link. Similar grey symbols present remote switch that are modelled to not have a working telecommunication link but actually have one. The differences in the model and the real state are discussed in the next chapter.
VI. THE RESULTS OF THE CASE STUDY In the studied case, the storm caused interruption to
electricity network. Because of the storm, the interruption in electricity network expanded gradually. The base stations of the mobile network have backup power, thus the interruption did not effect on mobile network and switches immediately. Based on the modelled situation of the mobile network, the first switches (grey symbol in Fig. 4) became unreachable 2 hours earlier than in the real case
When the worst situation occurred in the mobile network, the worst situation from the switch point of view began. There were 103 switches in the studied interruption area. In the worst case 12 switches were unreachable (Fig. 4). This happened approximately 4 hours after the first failure in the electricity network. After this the situation was improving when the base station in south-west of the observed area was restored. However, 9 hours after the beginning of the interruption, more switches started to become unreachable even though the mobile network was already operating in the area. In this case, the dropped switches were located to the edge of the studied area. Approximately 12 hours after the beginning of the interruption all switches were fully functioning.
In the model, the amount of the switches that did not function was bigger than in real case. 63 switches were unreachable in the worst case in the model. In addition, the timing of the worst situation did not match to real case. In the last drop of the switches, the modelled values resembled the real data.
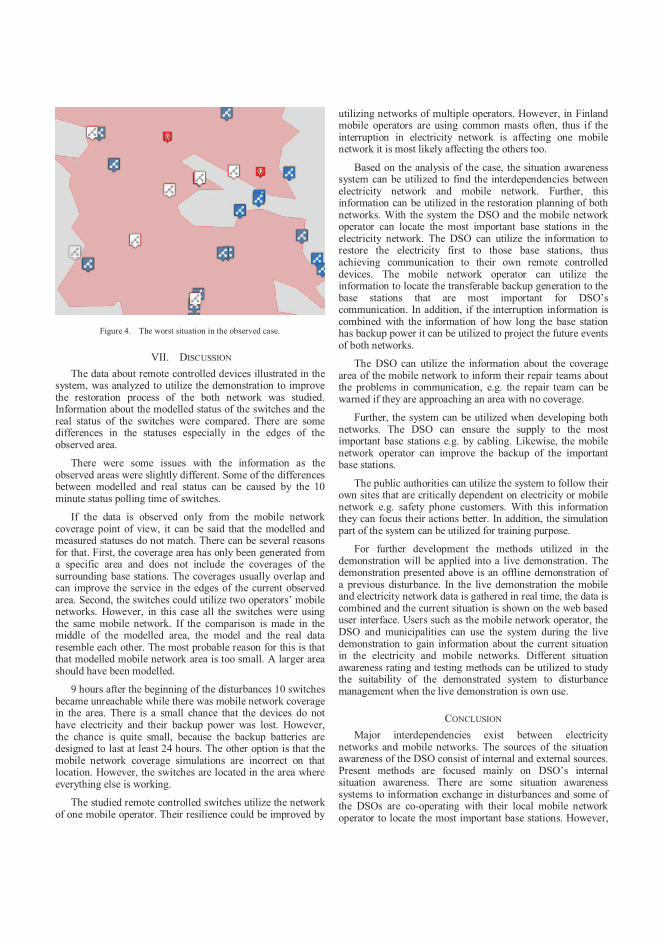
Figure 4. The worst situation in the observed case.
VII. DISCUSSION The data about remote controlled devices illustrated in the
system, was analyzed to utilize the demonstration to improve the restoration process of the both network was studied. Information about the modelled status of the switches and the real status of the switches were compared. There are some differences in the statuses especially in the edges of the observed area.
There were some issues with the information as the observed areas were slightly different. Some of the differences between modelled and real status can be caused by the 10 minute status polling time of switches.
If the data is observed only from the mobile network coverage point of view, it can be said that the modelled and measured statuses do not match. There can be several reasons for that. First, the coverage area has only been generated from a specific area and does not include the coverages of the surrounding base stations. The coverages usually overlap and can improve the service in the edges of the current observed area. Second, the switches could utilize two operators’ mobile networks. However, in this case all the switches were using the same mobile network. If the comparison is made in the middle of the modelled area, the model and the real data resemble each other. The most probable reason for this is that that modelled mobile network area is too small. A larger area should have been modelled.
9 hours after the beginning of the disturbances 10 switches became unreachable while there was mobile network coverage in the area. There is a small chance that the devices do not have electricity and their backup power was lost. However, the chance is quite small, because the backup batteries are designed to last at least 24 hours. The other option is that the mobile network coverage simulations are incorrect on that location. However, the switches are located in the area where everything else is working.
The studied remote controlled switches utilize the network of one mobile operator. Their resilience could be improved by
utilizing networks of multiple operators. However, in Finland mobile operators are using common masts often, thus if the interruption in electricity network is affecting one mobile network it is most likely affecting the others too.
Based on the analysis of the case, the situation awareness system can be utilized to find the interdependencies between electricity network and mobile network. Further, this information can be utilized in the restoration planning of both networks. With the system the DSO and the mobile network operator can locate the most important base stations in the electricity network. The DSO can utilize the information to restore the electricity first to those base stations, thus achieving communication to their own remote controlled devices. The mobile network operator can utilize the information to locate the transferable backup generation to the base stations that are most important for DSO’s communication. In addition, if the interruption information is combined with the information of how long the base station has backup power it can be utilized to project the future events of both networks.
The DSO can utilize the information about the coverage area of the mobile network to inform their repair teams about the problems in communication, e.g. the repair team can be warned if they are approaching an area with no coverage.
Further, the system can be utilized when developing both networks. The DSO can ensure the supply to the most important base stations e.g. by cabling. Likewise, the mobile network operator can improve the backup of the important base stations.
The public authorities can utilize the system to follow their own sites that are critically dependent on electricity or mobile network e.g. safety phone customers. With this information they can focus their actions better. In addition, the simulation part of the system can be utilized for training purpose.
For further development the methods utilized in the demonstration will be applied into a live demonstration. The demonstration presented above is an offline demonstration of a previous disturbance. In the live demonstration the mobile and electricity network data is gathered in real time, the data is combined and the current situation is shown on the web based user interface. Users such as the mobile network operator, the DSO and municipalities can use the system during the live demonstration to gain information about the current situation in the electricity and mobile networks. Different situation awareness rating and testing methods can be utilized to study the suitability of the demonstrated system to disturbance management when the live demonstration is own use.
CONCLUSION Major interdependencies exist between electricity
networks and mobile networks. The sources of the situation awareness of the DSO consist of internal and external sources. Present methods are focused mainly on DSO’s internal situation awareness. There are some situation awareness systems to information exchange in disturbances and some of the DSOs are co-operating with their local mobile network operator to locate the most important base stations. However,

any processed information about the interdependencies of the both networks is not supported. Further, the authorities are using multiple web pages and DMS services to achieve the information about both networks.
In this research, a demonstration of a situation awareness system was developed. This system illustrates the interruptions of electricity and mobile networks on a map. Information about the sites and devices that are dependent on either of these networks e.g. remote controlled switches or elderly residents can be added to map. This information can be utilized to improve the restoration process of the electricity networks or mobile network and to improve the resilience of the society in disturbances.
It was noticed from the analysis of the disturbance case, that the remote controlled switches are highly dependent on the mobile network. In the studied case, some contradiction between the modelled state of the switches and the real state appeared, because the effect on base stations outside the observed area could not be taken into account while modelling the mobile network coverage. Otherwise, the modelled area resembled the real case.
Based on the case it is not possible to make a conclusion how the unreachable switches effected on the restoration process of the electricity network. To make these conclusions, the information of the manually controlled switches would be needed in addition to information how long the manual opening process took.
The demonstrated situation awareness system could help the authorities to plan their actions better, e.g. to evacuate only the residents whose life is dependent on one or both of the networks. In addition, the resilience of the society can be improved by using the demonstration to plan the placement of the backup power.
The DSO and the mobile network operator can utilize the system to improve their restoration process after the situation, e.g. the mobile network operator can improve the backup of the base station which is important to the electricity network. Likewise, the DSO can plan the cabling to ensure the electricity supply to important base stations.
REFERENCES [1] H. Krohns-Välimäki, J. Haapanen, H. Aalto, J. Strandén, P. Verho,
”Demonstration of the Inter-Organizational Situation Awareness System to Major Disturbances,” presented at the 23rd International Conference and Exhibition on Electricity Distribution (CIRED 2015), Lyon, France, 2015
[2] H. Krohns-Välimäki, H. Aalto, K. Pylkkänen, J. Strandén, P. Verho, J. Sarsama, ” Developing Situation Awareness in Major Disturbances of Electricity Supply,” presented at IEEE PES Innovative Smart Grid Technologies, Europe 2014 (ISGT EU), Istanbul, Turkey, 2014
[3] J. Strandén, V.-P. Nurmi, P. Verho, M. Marttila, ”State of preparedness of Finnish Society for Major Disturbance in Distribution of Electricity,” International Review of Electrical Engineering [I.R.E.E.] vol. 4, n. 2, pp. 211-219
[4] Energy Market Authority, “Summer 2010 storms in point of view of electricity grid” [“Kesän 2010 myrskyt sähköverkon kannalta” in Finnish]. Report, 306/401/2011, Finland 2011
[5] Union for the Coordination of Transmission of Electricity (UCTE), “Final Report – System Disturbance on 4 November 2006.”, January 2007. [Online]. Available: http://www.ucte.org/_library/otherreports/Final-Report-20070130.pdf
[6] U.S.-Canada Power System Outage Task Force, “Final Report on the August 14, 2003 Blackout in the United States and Canada: Causes and Recommendation”, U.S. Department of Energy, Report 2004, [Online]. Available: http://energy.gov/sites/prod/files/oeprod/DocumentsandMedia/BlackoutFinal-Web.pdf
[7] S. Horsmanheimo, N. Maskey, L. Tuomimäki, H. Kokkoniemi-Tarkkanen, P. Savolainen, “Evaluation of Interdependencies between Mobile Communication and Electricity Distribution Networks in Fault Scenarios,” presented at IEEE Innovative Smart Grid Technologies – Asia (ISGT Asia), Bangalore, India, 2013
[8] H. Salomäki, “Improving the operational efficiency of fault repairing with partnership management”, Proceedings 22nd International Conference on Electricity Distribution (CIRED 2013)
[9] FICORA 54 A/2012 M. Regulation on resilience of communications networks and services. Finnish Communications Regulatory Authority. 17 p. May 2012. Available: https://www.viestintavirasto. /attachments/ maaraykset/Viestintavirasto54A2012M_EN.pdf
[10] A. Clark and C. Pavlovski, “Wireless networks for the smart energy grid: Application aware networks,” in Proceedings of the International MultiConference of Engineers and Computer Scientists 2010, IMECS 2010, 2010, pp. 1243–1248.
[11] S. Roy, D. Nordell, and S. Venkata, “Lines of communication,” Power and Energy Magazine, IEEE, vol. 9, no. 5, pp. 64–73, Sept 2011.
[12] R.-L. Chen and S. Sabir, “The benefits of implementing distribution automation and system monitoring in the open electricity market,” in Electrical and Computer Engineering, 2011. vol. 2, 2001, pp. 825–830.
[13] The Finnish Electricity Market Act 588/2013 [14] H. R. Bernard “Research Methods in Anthropology – Qualitative and
Quantitative Approaches,” 4th edition, New York: AltaMira Press, 2006, p. 212
[15] M. R. Endsley., D.G. Jones, “Situation Awareness: An approach to User-Centered Design,” 2nd edition. CRC Press pp. 193-218, 2011
[16] G. Grandy, ” Instrumental Case Study”. In Albert J. Mills, G. Durepos, & E. Wiebe (Eds.), Encyclopedia of Case Study Research. (pp. 474-476). Thousand Oaks, CA: SAGE Publications, Inc
[17] M. R. Endsley, “Toward a Theory of Situation Awareness in Dynamic Systems,” Human factors, vol. 37, pp. 32-64, 1995
[18] M. R. Endsley., “Situation Awareness Misconceptions and Misunderstandings,” Journal of Cognitive Engineering and Decision Making, vol. 9, no. 1, pp. 4-32, March 2015
[19] M. R. Endsley., E.S. Connors. “Situation Awareness: State of the Art,” presented at 2008 IEEE Power and Energy Society General Meeting - Conversion and Delivery of Electrical Energy in the 21st Century, Pittsburgh, United State, 2008
[20] M. Panteli, Kirschen D., “Situation awareness in power systems: Theory, challenges and applications,” Electric Power System Research vol 122, May 2015, pp.140-151
[21] J. Northcote-Green, R. Wilson, ”Control and Automation of Electrical Power Distribution Systems,” CRC Press. pp. 31-60, 2006
[22] ] J. Kuru, J. Haikonen, J. Myllymäki, ”Innovative system integration for outage communication” presented at 20th International Conference on Electricity Distribution (CIRED 2009), Prague, Czech Republic, 2009
[23] Elenia Mukana, mobile service. [online] available: http://www.elenia.fi/elenia_mukana
[24] J. Pagotto, D O’Donnell, “Canada’s Multi-Agency Situational Awareness System – Keeping it Simple”, Proceedings of the 9th International ISCRAM Conference, April 2012
[25] A. Schweer, K. Schaum, D. Hollmach, “A New grid driven approach to guarantee reliable communication during power outages”, in Proceedings 22nd International Conference on Electricity Distribution (CIRED 2013), June 2013
[26] Ley B., Pipek V., Reuter C., Wiedenhoefer T., “Supporting Inter-Organizational Situation Assessment in Crisis Management”, Proceedings of the 9th International ISCRAM Conference, April 2012

Publication 5
J. Säe and J. Lempiäinen, “User Guided Energy and Capacity Optimization in UMTSMobile Networks,” in Proceedings of the 25th International Symposium on Personal,Indoor, and Mobile Radio Communication (PIMRC), Washington D.C., USA, 2.–5. Sep.2014. DOI: 10.1109/PIMRC.2014.7136290
Copyright c© 2014 IEEE. Reprinted, with permission, from Proceedings of the 25th Inter-national Symposium on Personal, Indoor, and Mobile Radio Communication (PIMRC).
In reference to IEEE copyrighted material which is used with permission in this thesis, theIEEE does not endorse any of Tampere University of Technology’s products or services. In-ternal or personal use of this material is permitted. If interested in reprinting/republishingIEEE copyrighted material for advertising or promotional purposes or for creatingnew collective works for resale or redistribution, please go to http://www.ieee.org/publications_standards/publications/rights/rights_link.html to learn how toobtain a License from RightsLink.
107


User Guided Energy and Capacity Optimization inUMTS Mobile Networks
Joonas Säe and Jukka LempiäinenDepartment of Electronics and Communications Engineering
Tampere University of Technology (TUT)Tampere, Finland
[email protected], [email protected]
Abstract—The power levels of cellular network UserEquipment (UE) may vary considerably in both the receiver andthe transmitter side, especially in indoor locations. With anindirect guidance method, the users are self-optimizing their UEto a better location with the help of an application. Thus, the userdistribution is weighted more on high quality connection areas,which results in saving the UE batteries and reducing the overallradiation. This power reduction can also be understood as acapacity increase, especially in radio networks based on CodeDivision Multiple Access (CDMA), such as the Universal MobileTelecommunications System (UMTS) technology.
The aim of this paper is to show the possibility and theopportunity to save energy or to increase the capacity in cellularnetworks when the users are indirectly guided to optimize theirUE locations. In this study, energy and capacity optimization isverified for residential indoor users in the measurements wherethe users are served by signals coming from several outdoor BaseStations (BSs) in a typical urban environment. The resultsobtained show that a path loss (PL) improvement of up to 10–25dB can be achieved when the user locations are optimized and thesignals are coming from the outdoor BSs.
Keywords—Indoor, user location, energy, optimization
I. INTRODUCTION
Currently, mobile network users expect a ubiquitous andvery high quality service. However, since the users arefrequently located indoors, one of the most difficult challengesis to offer good coverage and signal quality to these locations.Therefore, implementation of outdoor BSs and separate indoorsystems (indoor BSs) is required in order to cover indoor areas.In both approaches, the typical target is to guarantee apredefined minimum signal power level for a user with a goodsignal quality and data throughput. The distribution of denseoutdoor BSs or, in particular, indoor antenna distribution inindoor systems is required to achieve this minimum powerrequirement at the majority of the indoor locations. As a result,several very high-power signal level locations can also beachieved indoors.
Mobile networks are very densely deployed in urban areas,and BS sites still include several technologies from GlobalSystem for Mobile Communications (GSM) to UMTS andLong Term Evolution (LTE) due to the speech and datathroughput requirements. This automatically yields to high-energy consumption due to the low efficiency of thetransmitters (especially in CDMA) and to the needs of airconditioning requirements. Hence, high radio frequency
radiation results naturally in the substantial amount oftransmitters.
Despite this very dense multi-technology deployment, thedistribution of the received power levels may still vary,especially in indoor locations within a small area of few metersdepending on the BS and UE locations [1]. This is typical for atime and space variant indoor propagation channel, especiallywhen the UE is served by one BS, and when the environment isactive. The received power level deviations are neithermeasured nor reported in residential apartments nor even in theoffices when the indoor coverage is served by several outdoorBSs in an urban area, and when the power levels of interest areclearly better than the coverage threshold.
Typically, radio network planning guidance targets to offerminimally acceptable received power levels everywhere,resulting in higher received power level than needed in severalindoor locations [2]. Similar aspects can be noted when UEsare located in vehicles. Moreover, these high-quality planningguidelines are controversial, because it is expected that the UElocations are homogenously distributed and the users are nottrying to – or do not need to – optimize their terminal location.
If it is assumed that the behavior of mobile users could beinfluenced in indoor or in-vehicle locations, the received powerlevel could be significantly improved by moving the terminalsjust a little. These movements could be guided by somebehavior rules, or by new approaches like Mobile PerformanceGaming (MPG), which would continuously guide the user tolocate his or hers terminal optimally and send statistics e.g. toan operator. The target of the guidance is not to limit themobility, but instead to avoid bad locations, and guide users tobetter connections whenever easily possible.
In case of optimal or even partially optimally locatedindoor terminals, the required energy consumption, as well asthe amount of radiated power, could decrease dramatically.Moreover, the changed user distribution would have impactson channel modeling and to other research areas.
A practical measurement campaign is carried out in atypical residential apartment environment to show the impactof user behavior on the received power levels and thereductions in the required energy consumption. Measurementsare carried out in an urban area in a commercial 3GPPnetworks including several serving BSs. A key target of themeasurements is to show the deviation of the measured signalpower levels above the minimum acceptable power level, thatis values better than a certain threshold. This shows theopportunity to improve the mobile connection with small-scaleterminal movements.
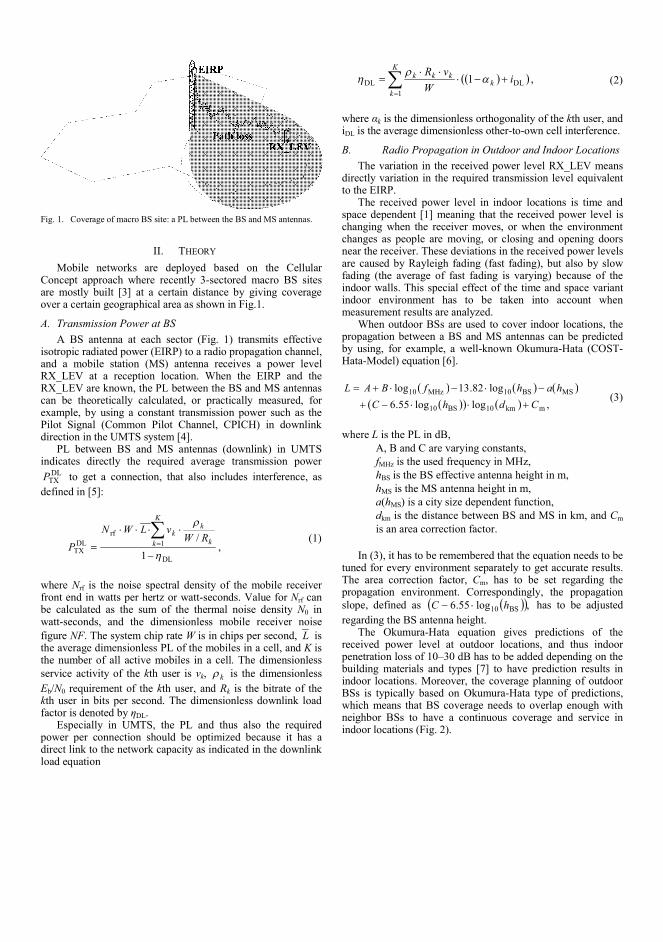
Fig. 1. Coverage of macro BS site: a PL between the BS and MS antennas.
II. THEORY
Mobile networks are deployed based on the CellularConcept approach where recently 3-sectored macro BS sitesare mostly built [3] at a certain distance by giving coverageover a certain geographical area as shown in Fig.1.
A. Transmission Power at BSA BS antenna at each sector (Fig. 1) transmits effective
isotropic radiated power (EIRP) to a radio propagation channel,and a mobile station (MS) antenna receives a power levelRX_LEV at a reception location. When the EIRP and theRX_LEV are known, the PL between the BS and MS antennascan be theoretically calculated, or practically measured, forexample, by using a constant transmission power such as thePilot Signal (Common Pilot Channel, CPICH) in downlinkdirection in the UMTS system [4].
PL between BS and MS antennas (downlink) in UMTSindicates directly the required average transmission power
DLTXP to get a connection, that also includes interference, as
defined in [5]:
,1
/
DL
1rf
DLTX h
r
-
××××
=å=
K
k k
kk RW
vLWNP
(1)
where Nrf is the noise spectral density of the mobile receiverfront end in watts per hertz or watt-seconds. Value for Nrf canbe calculated as the sum of the thermal noise density N0 inwatt-seconds, and the dimensionless mobile receiver noisefigure NF. The system chip rate W is in chips per second, L isthe average dimensionless PL of the mobiles in a cell, and K isthe number of all active mobiles in a cell. The dimensionlessservice activity of the kth user is vk, kr is the dimensionlessEb/N0 requirement of the kth user, and Rk is the bitrate of thekth user in bits per second. The dimensionless downlink loadfactor is denoted by ηDL.
Especially in UMTS, the PL and thus also the requiredpower per connection should be optimized because it has adirect link to the network capacity as indicated in the downlinkload equation
( )( ) ,11
DLDL å=
+-×××
=K
kk
kkk iW
vRa
rh (2)
where αk is the dimensionless orthogonality of the kth user, andiDL is the average dimensionless other-to-own cell interference.
B. Radio Propagation in Outdoor and Indoor LocationsThe variation in the received power level RX_LEV means
directly variation in the required transmission level equivalentto the EIRP.
The received power level in indoor locations is time andspace dependent [1] meaning that the received power level ischanging when the receiver moves, or when the environmentchanges as people are moving, or closing and opening doorsnear the receiver. These deviations in the received power levelsare caused by Rayleigh fading (fast fading), but also by slowfading (the average of fast fading is varying) because of theindoor walls. This special effect of the time and space variantindoor environment has to be taken into account whenmeasurement results are analyzed.
When outdoor BSs are used to cover indoor locations, thepropagation between a BS and MS antennas can be predictedby using, for example, a well-known Okumura-Hata (COST-Hata-Model) equation [6].
( ) ( ) ( )( )( ) ( ) ,loglog55.6
log82.13log
mkm10BS10
MSBS10MHz10
CdhChahfBAL
+××-+
-×-×+=(3)
where L is the PL in dB,A, B and C are varying constants,fMHz is the used frequency in MHz,hBS is the BS effective antenna height in m,hMS is the MS antenna height in m,a(hMS) is a city size dependent function,dkm is the distance between BS and MS in km, and Cmis an area correction factor.
In (3), it has to be remembered that the equation needs to betuned for every environment separately to get accurate results.The area correction factor, Cm, has to be set regarding thepropagation environment. Correspondingly, the propagationslope, defined as ( )( ),log55.6 BS10 hC ×- has to be adjustedregarding the BS antenna height.
The Okumura-Hata equation gives predictions of thereceived power level at outdoor locations, and thus indoorpenetration loss of 10–30 dB has to be added depending on thebuilding materials and types [7] to have prediction results inindoor locations. Moreover, the coverage planning of outdoorBSs is typically based on Okumura-Hata type of predictions,which means that BS coverage needs to overlap enough withneighbor BSs to have a continuous coverage and service inindoor locations (Fig. 2).

Fig. 2. Coverage overlapping of multiple BSs.
C. Multiple Coverage in Cellular Mobile NetworksIn mobile cellular networks, the received power level may
vary also because the signal power is coming from several BSsites, or cells as indicated in Fig. 2. Depending on the exactterminal location, one carrier may be superior compared to theothers. One carrier is offering better received power at onelocation, and other carrier in the next location because of theslow fading, and because of the different materials like glasswindows or concrete through a propagation path between theBS and MS antennas.
In coverage overlapping areas of multiple serving BSs, thetypical radio planning target of location or service probabilityof 90–99% should be well achieved. Moreover, if the coverageplanning criteria is expecting to get 90–99% connectionprobability from one BS, and simultaneously several BSs arecovering the same location as typically in a densely deployedurban areas, the received power level may have much highervalues [3].
III. MEASUREMENT CAMPAIGN
A. Measurement EnvironmentA practical measurement campaign was carried out at one
main location in a normal urban residential apartment indowntown Helsinki, Finland. Thus, indoor locations of typicalresidential users were measured in a high density BS coverageand capacity area. The measurement location as well as themeasurement timing was selected randomly. Two differentcarriers (Network 1, Network 2) were measured.
All measurements represent results in configuration wheresignals propagate to indoor locations from the implementedoutdoor BSs. Network 1 and Network 2 have different networkconfigurations.
Normal commercial non-calibrated mobile terminal wasused in all measurements, and thus absolute values are nothighlighted but relative received power levels are the mostinteresting ones. The data was collected with a help of anapplication that utilizes MPG, which sends the measured datato a server, where it can be accessed.
B. Measurement ScenariosFour different measurement Scenarios were repeated for
Network 1, and only Scenario 1 for Network 2 (Fig. 3represents the blueprints of the measurement apartment and themeasurement areas):
Fig. 3. Measurement Scenarios 1–4 in the apartment.
1. Mobile terminal on different tables around commonareas in the apartment.
2. Mobile terminal at a certain small area of 3–6 mmaximum difference in location. This subarea wasselected based on the measurement Scenario 1.
3. Mobile terminal at a very small area of 1–2 mmaximum difference in location (different parts of atable); this measurement is carried in the subarea ofmeasurement Scenario 2.
4. Mobile terminal is constantly at one location on thetable inside the area of measurement Scenario 3.
All measurements were carried such that the mobileterminal is on a table approximately 50–120 cm from the floor,and in all measurements the mobile is not having a bodycontact but measurement person is able to walk or stay in thesurroundings of the mobile i.e. sitting, standing, or walkingapproximately 3–5 meters around the mobile. Themeasurement Scenario 4 is especially showing variations of thereceived power level due to these environmental changes.
All measurements were carried in the apartment on the firstfloor from the street level.
Measurements are carried in two commercial 3GPPnetworks (Network 1, Network 2) i.e. the mobile terminal ismeasuring received power level from all technologies: GSM,UMTS, and LTE. Measurements are done in IDLE mode i.e.the mobile terminal is not connected to the network, and thusmeasurement happens in the downlink direction where a BStransmits and the mobile terminal receives the signal power. InGSM, the Broadcast Control Channel (BCCH) is measuredbecause it has a constant transmission power in downlinkdirection as well as the Common Pilot Channel (CPICH) has inUMTS technology. In LTE, a reference signal was measured tohave a similar effect of the constant transmission power.
Typically, in 3GPP technologies, 32 neighbor BSs (or cells)can be measured, but only six bests are reported by a mobileterminal [8].
In IDLE mode, mobile terminal measures continuously, andreported samples are averages over certain seconds. Averageswere recorded every 10 s meaning 6 averaged samples perminute, and 60 averaged samples in 10 minutes.
In IDLE mode in 3GPP, a mobile terminal is selecting thetechnology based on radio parameters. One technology canhave priority given by parameter settings. This means thatmobile terminal is staying in the priority technology as long as

the coverage ends, or the coverage is very bad even if othertechnology offers better power level.
In measurements, it was noted that UMTS technology washighlighted i.e. mobile terminal tried to stay in UMTS networkas long as possible due to much better data communicationcompared to GSM technology. At the same time, LTEcoverage was still limited, and thus results of LTE technologyare not significant. Thus, the highest priority and reliability ofmeasurements and results is in UMTS technology.
IV. MEASUREMENT RESULTS AND ENERGY SAVING
In a typical radio network planning, location or serviceprobability of 90% is calculated for a certain coveragethreshold. Fig. 4 shows a cumulative curve of the receivedpower samples in Scenario 1 (Network 1). Fig. 4 shows that90% coverage threshold corresponds to the received powerlevel of –125 dBm. This coverage level does not correspond toa reasonable speech quality in UMTS technology andapproximately corresponds to a maximum throughput level of0.3–1 Mbit/s when Dual Carrier technology is implemented inHSPA, and when only one user is served by one BS.
Fig. 5 shows the obtained results of the measurementScenario 1. In Fig. 5 it can be seen that the received powerlevels vary 25–30 dB for both networks in different parts of theapartment even if 3–7 BS cells are offering indoor coverage atdifferent locations inside of the apartment. It has to behighlighted, that every sample in the results represents the bestreceived power level at each terminal location inside theapartment. Moreover, the terminal had enough time at eachmeasurement point to change to the best serving BS cell. Themean values (µ) of the received power levels for the Networks1 and 2 were µ1 = –108.5 dBm and µ2 = –114 dBm withstandard deviations (σ) of σ1 = 8.46 dB and σ2 = 6.39 dB,respectively.A specific small area of Network 1 was selected (Scenario 2)because the received power level was changing rapidly in thiscertain area. Fig. 6 shows 15 dB variation in the receivedpower level even if the terminal was moved only 3–6 metersbetween the measurement points. The mean signal level wasµ3 = –104 dBm with standard deviation of σ3 = 5.54 dB.Moreover, in Fig. 7, the obtained results show powervariations when the mobile terminal has different locations atone 2 m x 1.5 m size house table (Scenario 3).
Fig. 4. Scenario 1, Network 1: the coverage threshold for 90% locationprobability.
Fig. 5. Scenario 1: the received power levels of two different networks.
Fig. 6. Scenario 2 (Network 1): the smaller measurement area inside themeasurement area in Scenario 1.
Fig. 7. Scenario 3 (Network 1): the very small measurement area inside themeasurement area in Scenario 2.
Despite of only small movements, power level variations ofaround 10 dB can still be noted, while having µ4 = –106 dBmand σ4 = 3 dB.
Finally, the results of measurement Scenario 4 in Fig. 8show the received power level variations of environmentalchanges that happen when the mobile terminal is at oneconstant measurement location (one measurement point ofScenario 3). It can be noted that the received power level vary6–10 dB when the measurement engineer is in the surroundingsof the terminal. This corresponds to a case where the user is athome and reasonably close to the mobile. The mean powerlevel and the corresponding variance of the stationary mobile isµ5 = –111 dBm and σ5 = 3 dB.

Fig. 8. Scenario 4 (Network 1): only one measurement point inside of themeasurement area in Scenario 3.
Fig. 9. Amount of samples from different BSs in Scenario 1.
The results presented in Fig. 5–8 include measurementsamples from 3–7 BSs from Network 1 and Network 2,because the apartment is covered by several BSs as typicallyhappens in an urban area where BSs are implemented denselyto have enough capacity and indoor coverage. Fig. 9 shows thedeviation of the samples between different BSs in Scenario 1.
As a conclusion of Fig. 5–8, it can be noted that thereceived power level may be improved easily 10 dB and evenup to 20–25 dB in downlink direction when the mobileterminal location is optimized in small-scale movements in aresidential apartment. These improvement levels alreadyexclude variation of environment that was 6–10 dB. Moreover,improvement of 10–25 dB at the reception can be used toreduce the transmission power levels to keep constant quality,and simultaneously to increase capacity, to reduce radiation,and to reduce battery consumption of mobile terminals. Finally,similar energy savings happen also in the uplink channel,because propagation channel is reciprocal, and thus thereception level can be improved also at the BS receiving end.
Improvement of the reception power level means alsoimprovement of PL, and capacity increase can be estimated byusing equation (2).
An example calculation using equation (2) with 33 speechusers (Rv = 12.2 kbit/s and Eb/N0 = 6.0 dB), and typical valuesvk = 0.5, αk = 0.7 and i = 0.5 results in load ηDL = 16.7%. Usingthis load value in (1) with receiver noise figure of 7 dB andaverage PL of 150 dB (Scenario 1: RX_LEV = –117dBm,CPICH_TX_Power = 33 dBm), the required transmissionpower is 42.90 dBm (= app. 20W).
When 20 dB PL improvement is considered (RX_LEV =–97 dBm) in (1), the amount of speech users can be increased
up to 150 users (354% increase) still using only power of 34.86dBm (< 4W) but causing load ηDL = 75.9%.
V. CONCLUSIONS AND DISCUSSION
In this paper, it was first introduced the possibility to guideusers to optimize their terminal locations based on theconnection quality. Moreover, this optimization directlyreduces radio energy consumption at the BSs and MSs, andthus reduces costs, increases capacity, saves mobile batteries,and reduces unnecessary radiation. The user behavior atresidential indoor locations was highlighted, and the practicalmeasurement campaign in UMTS network was done to showthe impact of energy reduction in indoor locations.
The obtained results show that the reception level of eachlocation optimized mobile terminal can be increased 10–25 dBwhen short-term environmental changes of 6–10 dB due tomoving persons in apartments are excluded. These kinds ofreception improvements can cause high capacity increase inmobile networks, thus yielding to excessive capacityoptimization and cost savings in the infrastructure. The resultscan also show a way to new possibilities in radio link budgetby presenting a new variable called UE location optimizationgain to account for possible improvements coming fromoptimized UE locations.
Similar results about PL improvements can be found also inother technologies, like in GSM and LTE. In addition, it can benoted that PL improvements might help significantly in disasterscenarios where only part of the BSs are operating, forexample, due to lack of electricity.
ACKNOWLEDGEMENTS
Authors would like to thank the Finnish Funding Agencyfor Innovation, European Communications Engineering Ltdand Greatest Heroes Ltd for funding and supporting theresearch work.
REFERENCES
[1] H. H. Hashemi, “The indoor radio propagation channel”, in Proceedingsof the IEEE, vol. 81, Sep 1993, pp. 943–968.
[2] T. Isotalo, P. Lähdekorpi, and J. Lempiäinen, “HSDPA indoor plan-ning,” in Handbook of HSDPA/HSUPA technology, B. Furht andS. Ahson, Eds. Taylor & Francis Group, 2010, pp. 379–408.
[3] J. Lempiäinen and M. Manninen, Eds., UMTS radio network plan-ning, optimization and QoS management. Kluwer Academic Pub-lishers, 2003.
[4] 3GPP, ” Universal Mobile Telecommunications System (UMTS);Physical channels and mapping of transport channels onto physicalchannels (FDD),” 3rd Generation Partnership Project (3GPP),TS 25.211, 2010.
[5] H. Holma and A. Toskala, “WCDMA for UMTS”, John Wiley & SonsLtd, 2007. 539 p.
[6] D. Cichon and T. Kürner, “Chapter 4. propagation prediction mod-els,” in Digital mobile radio towards future generation systems - finalreport, COST Action 231, Ed. European Commission, 1999, pp. 115–208.
[7] H. Okamoto, K. Kitao, and S. Ichitsubo, “Outdoor-to-indoor propa-gation loss prediction in 800-MHz to 8-GHz band for an urban area,”IEEE Transactions on Vehicular Technology, vol. 58, no. 3, pp. 1059–1067, Mar 2009.
[8] 3GPP, ” Universal Mobile Telecommunications System (UMTS);RRC Protocol Specification,” 3rd Generation Partnership Project(3GPP), TS 25.331, 2001.


Publication 6
J. Säe, S. F. Yunas, and J. Lempiäinen, “Coverage aspects of temporary LAP network,”in Proceedings of the 12th Annual Conference on Wireless On-demand Network Systemsand Services (WONS), Cortina d’Ampezzo, Italy, 20.–22. Jan. 2016.
c© IFIP, 2016. This is the author’s version of the work. It is posted here by permission ofIFIP for your personal use. Not for redistribution. The definitive version was publishedin Proceedings of the 12th Annual Conference on Wireless On-demand Network Systemsand Services (WONS), http://dl.ifip.org/db/conf/wons/wons2016/p100-sae.pdf.
115


Coverage Aspects of Temporary LAP NetworkJoonas Sae, Syed Fahad Yunas, and Jukka LempiainenDepartment of Electronics and Communications Engineering
Tampere University of Technology (TUT)Tampere, Finland
Emails: joonas.sae, syed.yunas, [email protected]
Abstract—This paper studies the coverage aspects of a lowaltitude platform (LAP) system that can form a temporary com-munication network. The system consists of multiple autonomousdrones equipped with dual-band Wi-Fi access points (APs) withad hoc capabilities to form a mesh network. The suitability of theLAP system is evaluated from the coverage point of view withcalculations and simulations. The results show that more dronesare needed to cover (dense) urban than rural environment andthe drone altitude should also be higher in urban areas comparedwith the rural areas.
Index Terms—low-altitude platform, drone, UAV, Wi-Fi, meshnetwork, Ad Hoc, disaster scenarios, temporary network, emer-gency coverage.
I. INTRODUCTION
Cellular networks should maintain their operational statuseven after (mild) disaster scenarios, however, a major prob-lem arises when a key part of the network infrastructure isdestroyed or unavailable. One such problem can be a damagedpower grid or broken power lines (e.g. because of fallen trees)which supply electricity to the base station (BS) sites. The lackof electricity from the network is not a problem at first, sincenowadays many operators around the world have equippedtheir BS sites with backup power. However, this just extendsthe operational time of the mobile network for a couple ofhours after the electricity blackout.
Repair and emergency teams move to disaster (or blackout)areas usually as fast as possible. When they arrive at theseareas, in the best case scenario, the mobile network might stillbe operational for a while with backup power. However, in theworst case, the cellular network might not be operational orthe infrastructure might be damaged to the point that it cannot function.
The emergency teams have usually their own way of com-municating, e.g. through terrestrial trunked radio (TETRA)system, which is commonly used in public safety networks.However, cellular and electricity network repair teams haveno possibility to use these systems. Thus, they have to rely onthe existing network and pre-planned processes on how to startthe repair actions. As a result, this means that there is no wayto communicate between these repair teams and a lot of timeis spent on moving around in the disaster-hit area in order tocontact other teams for prioritizing important or critical areas.
In order to enable the use of conventional user equipment(UEs), like smart phones with Wi-Fi, a new temporary mobilenetwork could be easily formed. There has been a lot ofresearch around high altitude platform (HAP) systems for
providing emergency coverage and recently Google’s projectLoon has brought this subject back on the hot topics offuture networks with their HAP balloons [1]. To compete withGoogle’s project Loon, Facebook has also invested in HAPsystems with their own high-altitude long-endurance planescombined with their Internet.org project [2].
This paper studies the coverage possibilities of a temporarylow altitude platform (LAP) network with the use of drones,or more generally known as unmanned aerial devices (UAVs).The idea of a temporary LAP network is based on a simpledesign principle: a quick and easily deployable communicationinfrastructure for emergency coverage in disaster-hit areaswith relatively low costs and fairly simple maintenance.
In this study, it has been assumed that the temporary LAPnetwork can be deployed such that the operation of LAPdrones is semi-automatic. This means that field teams in thedisaster areas only need to launch a drone, after which thedrone will automatically take off to a predefined altitude fromits take off location and form a mesh network with otherdrones.
The aim of this paper is to study the coverage aspects oftemporary LAP systems as an emergency network for disasterareas, mainly intended for repair teams and as a backupnetwork for rescue teams. Simulations are performed to di-mension the coverage capabilities of different configurations,including the inter-drone distances (IDDs) and the operationaltitude of the drones. The study also investigates the coverageaspects in two different environments: flat rural environmentand (dense) urban environment with the Manhattan grid, i.e.with a dense building layer.
II. RELATED WORK
The suitability of a disaster network has been studied frommany perspectives in the literature. The authors in [3] havepresented the idea of providing emergency broadband coveragewith the utilization of LAPs. Their idea is based on utilizingballoons as the platforms for LAPs, like with the majority ofother authors in the field, and Wi-Fi for the transmission. Asimilar idea is refined in [4], where TETRA and worldwideinteroperability for microwave access (WiMAX) systems werealso tested as the candidates for a temporary wireless network.The authors in [5] have expanded the idea and consideredthe use of drones with Wi-Fi to form resilient networks inorder to communicate to isolated disaster areas. However, theirimplementation involves a moving drone in very low altitudes

and needs to be in the close proximity of any client to collectdata.
In this study, the drone altitudes of few hundred metersare considered together with mesh networking as a base forthe LAP concept. It has the similar kind of idea as presentedin [6], [7]: the use of unmanned aerial vehicles to form atemporal network for a disaster response. However, in [6]the authors are focusing on the localization, navigation andcoordination of these devices and not the possible size ofthe service coverage areas, which could be possible withUAVs. In [7] some service area related aspects are takeninto account, however, the authors have simulated an area of100 m × 100 m with 50 nodes, and a fixed transmission radiusof 20 m. Obviously, this kind of dense drone network wouldnot be realistic in a rural area because the number of dronesto deploy would be huge.
The authors in [8] explain the concept of flying ad hocnetworks (FANETs), which is the ideology utilized in thisstudy. The authors in [9] have also implemented an ex-perimental study utilizing this concept. Although, they haveperformed the study with only two drones, they manage toestablish communication for a distance of 1000 m in betweenthe drones. The altitude of the drones in [9] is set to 10 m, sothe coverage area of one drone is quite limited.
III. LAP CONCEPT
A. Propagation modeling for simulations
In order to simulate wireless communication systems, aproper radio wave propagation model is required. The basicfree space path loss model would suit well with the scenarios,where mostly line-of-sight (LOS) connections are simulated.The initial IDD was calculated with the logarithmic free spacemodel [10]. However, in order to achieve more realistic results,a deterministic propagation model was chosen for the actualsimulations.
The outdoor radio channels are modeled using a deter-ministic radio propagation model called the dominant pathprediction model (DPM) [11]. The DPM model makes the pathloss prediction based on the premise that in most propagationscenarios, there are only one or two paths that contribute 90 %of the total received signal energy, hence the model determinesthe dominant path(s) between a transmitter and receiver forthe received power estimation. As such, the accuracy of theDPM model has been reported to have accuracy similar to (andin some cases better than) the ray tracing models, while thecomputation time is comparable to that of empirical models(e.g. COST-231 Hata model and Walfisch-Ikegami model)[11].
The computation of the path loss in DPM is based on thefollowing equation [11]:
L = 20 log10
(4π
λ
)+10n log10(d)+
k∑
i=0
f(ϕ, i)+Ω+gt (1)
where d is the distance between a transmitter and receiver,n is the path loss exponent, and λ is the wave length. The
Fig. 1: An example of the temporary LAP network concept.
sum of individual interaction losses function,∑k
i=0 f(ϕ, i), isdue to diffraction for each interaction i of all k with ϕ as theangle between the former direction and the new direction ofpropagation. The wave-guiding (tunneling) effect, Ω, considersthe effects of reflections (and scattering). It is empiricallydetermined and described in detail in [11]. Finally, gt is thegain of the transmitting antenna in the receiver’s direction.
The recommended value for the path loss exponent, n,depends on the propagation environment (rural, suburban,urban, indoor) and the height of the transmitter. The authorsin [12] have performed field tests with 2.4 GHz Wi-Fi andcompared the path loss exponent with the existing ones forseveral propagation models. They found that the values for nin LOS range from 2.54 to 2.76. Thus, in this paper the valuewas chosen to be 2.6.
B. Temporary LAP network concept
The LAP concept considered in this study is shown inFig. 1. It consists of utilizing dual band Wi-Fi equippeddrones that will form an ad hoc network with IEEE 802.11family wireless local area network (WLAN) technology uti-lizing 5 GHz frequency band with 40 MHz bandwidth as thebackhaul connection between the disaster area drones (DADs).The actual emergency coverage is then formed with accesspoints (APs) utilizing 2.4 GHz frequency band with 20 MHzbandwidth. In order to connect the emergency network to theInternet, some drones have to be equipped e.g. with a thirdgeneration (3G) or fourth generation (4G) cellular networkmodems. These drones, called the gateway drones (GDs), haveto be placed in between the disaster areas and the unaffectedoperational cellular network area next to it.
IV. SERVICE AREA SIMULATIONS
The coverage aspects of the LAP concept were studiedwith the help of simulations. Different deployment caseswere implemented with the help of simulation software calledWinProp Software Suite with its ProMan tool for simulatingwave propagation and radio network planning. The simulationresults were then visualized with Matlab software.
A. Simulation setup
The rural environment simulations were implemented on a6 km × 6 km flat terrain. The calculation resolution was set at20 m and all other general parameters are presented in Table I.
The maximum inter-drone distances, where the communi-cation should still be possible, were calculated with free space
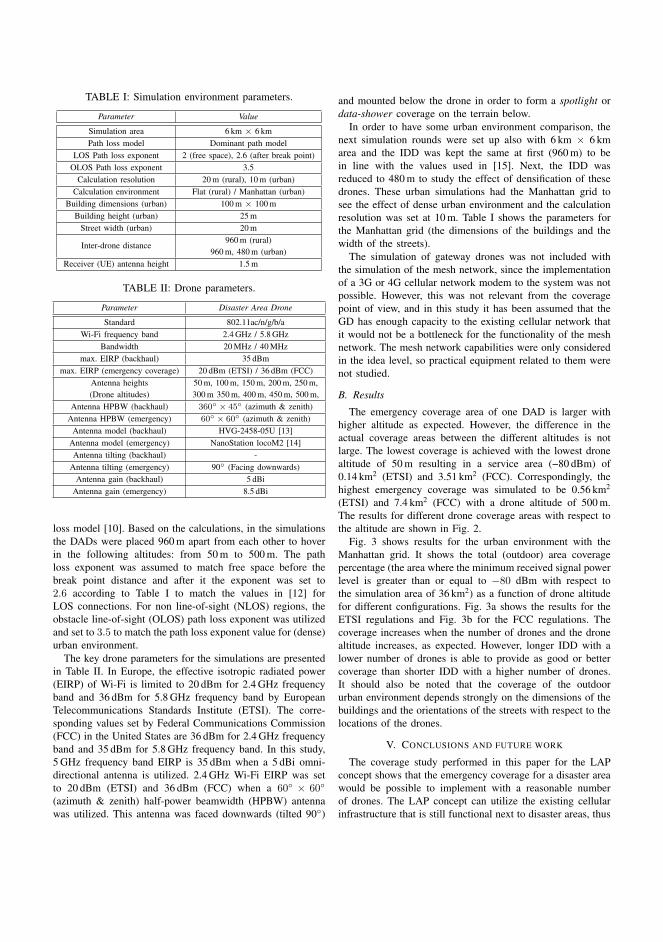
TABLE I: Simulation environment parameters.
Parameter Value
Simulation area 6 km × 6 kmPath loss model Dominant path model
LOS Path loss exponent 2 (free space), 2.6 (after break point)OLOS Path loss exponent 3.5
Calculation resolution 20 m (rural), 10 m (urban)Calculation environment Flat (rural) / Manhattan (urban)
Building dimensions (urban) 100 m × 100 mBuilding height (urban) 25 m
Street width (urban) 20 m
Inter-drone distance960 m (rural)
960 m, 480 m (urban)Receiver (UE) antenna height 1.5 m
TABLE II: Drone parameters.
Parameter Disaster Area Drone
Standard 802.11ac/n/g/b/aWi-Fi frequency band 2.4 GHz / 5.8 GHz
Bandwidth 20 MHz / 40 MHzmax. EIRP (backhaul) 35 dBm
max. EIRP (emergency coverage) 20 dBm (ETSI) / 36 dBm (FCC)Antenna heights 50 m, 100 m, 150 m, 200 m, 250 m,(Drone altitudes) 300 m 350 m, 400 m, 450 m, 500 m,
Antenna HPBW (backhaul) 360 × 45 (azimuth & zenith)Antenna HPBW (emergency) 60 × 60 (azimuth & zenith)
Antenna model (backhaul) HVG-2458-05U [13]Antenna model (emergency) NanoStation locoM2 [14]Antenna tilting (backhaul) -
Antenna tilting (emergency) 90 (Facing downwards)Antenna gain (backhaul) 5 dBi
Antenna gain (emergency) 8.5 dBi
loss model [10]. Based on the calculations, in the simulationsthe DADs were placed 960 m apart from each other to hoverin the following altitudes: from 50 m to 500 m. The pathloss exponent was assumed to match free space before thebreak point distance and after it the exponent was set to2.6 according to Table I to match the values in [12] forLOS connections. For non line-of-sight (NLOS) regions, theobstacle line-of-sight (OLOS) path loss exponent was utilizedand set to 3.5 to match the path loss exponent value for (dense)urban environment.
The key drone parameters for the simulations are presentedin Table II. In Europe, the effective isotropic radiated power(EIRP) of Wi-Fi is limited to 20 dBm for 2.4 GHz frequencyband and 36 dBm for 5.8 GHz frequency band by EuropeanTelecommunications Standards Institute (ETSI). The corre-sponding values set by Federal Communications Commission(FCC) in the United States are 36 dBm for 2.4 GHz frequencyband and 35 dBm for 5.8 GHz frequency band. In this study,5 GHz frequency band EIRP is 35 dBm when a 5 dBi omni-directional antenna is utilized. 2.4 GHz Wi-Fi EIRP was setto 20 dBm (ETSI) and 36 dBm (FCC) when a 60 × 60
(azimuth & zenith) half-power beamwidth (HPBW) antennawas utilized. This antenna was faced downwards (tilted 90)
and mounted below the drone in order to form a spotlight ordata-shower coverage on the terrain below.
In order to have some urban environment comparison, thenext simulation rounds were set up also with 6 km × 6 kmarea and the IDD was kept the same at first (960 m) to bein line with the values used in [15]. Next, the IDD wasreduced to 480 m to study the effect of densification of thesedrones. These urban simulations had the Manhattan grid tosee the effect of dense urban environment and the calculationresolution was set at 10 m. Table I shows the parameters forthe Manhattan grid (the dimensions of the buildings and thewidth of the streets).
The simulation of gateway drones was not included withthe simulation of the mesh network, since the implementationof a 3G or 4G cellular network modem to the system was notpossible. However, this was not relevant from the coveragepoint of view, and in this study it has been assumed that theGD has enough capacity to the existing cellular network thatit would not be a bottleneck for the functionality of the meshnetwork. The mesh network capabilities were only consideredin the idea level, so practical equipment related to them werenot studied.
B. Results
The emergency coverage area of one DAD is larger withhigher altitude as expected. However, the difference in theactual coverage areas between the different altitudes is notlarge. The lowest coverage is achieved with the lowest dronealtitude of 50 m resulting in a service area (−80 dBm) of0.14 km2 (ETSI) and 3.51 km2 (FCC). Correspondingly, thehighest emergency coverage was simulated to be 0.56 km2
(ETSI) and 7.4 km2 (FCC) with a drone altitude of 500 m.The results for different drone coverage areas with respect tothe altitude are shown in Fig. 2.
Fig. 3 shows results for the urban environment with theManhattan grid. It shows the total (outdoor) area coveragepercentage (the area where the minimum received signal powerlevel is greater than or equal to −80 dBm with respect tothe simulation area of 36 km2) as a function of drone altitudefor different configurations. Fig. 3a shows the results for theETSI regulations and Fig. 3b for the FCC regulations. Thecoverage increases when the number of drones and the dronealtitude increases, as expected. However, longer IDD with alower number of drones is able to provide as good or bettercoverage than shorter IDD with a higher number of drones.It should also be noted that the coverage of the outdoorurban environment depends strongly on the dimensions of thebuildings and the orientations of the streets with respect to thelocations of the drones.
V. CONCLUSIONS AND FUTURE WORK
The coverage study performed in this paper for the LAPconcept shows that the emergency coverage for a disaster areawould be possible to implement with a reasonable numberof drones. The LAP concept can utilize the existing cellularinfrastructure that is still functional next to disaster areas, thus

Drone altitude [m]
50 100 150 200 250 300 350 400 450 500
Cover
age
[km
2]
0
1
2
3
4
5
6
7
8
ETSI -70 dBm (max. EIRP +20 dBm)
ETSI -80 dBm (max. EIRP +20 dBm)
FCC -70 dBm (max. EIRP +36 dBm)
FCC -80 dBm (max. EIRP +36 dBm)
Fig. 2: Emergency coverage area of one drone as a functionof drone altitude in rural area.
Drone altitude [m]
50 100 150 200 250 300 350 400 450 500
Urb
an
area c
overed
[%
]
0
20
40
60
80
100
1 Drone (ETSI)
3x3 Grid, 480 m IDD (ETSI)
5x5 Grid, 480 m IDD (ETSI)
7x7 Grid, 480 m IDD (ETSI)
9x9 Grid, 480 m IDD (ETSI)
11x11 Grid, 480 m IDD (ETSI)
3x3 Grid, 960 m IDD (ETSI)
5x5 Grid, 960 m IDD (ETSI)
7x7 Grid, 960 m IDD (ETSI)
(a) Maximum drone EIRP 20 dBm (ETSI).
Drone altitude [m]
50 100 150 200 250 300 350 400 450 500
Urb
an
area c
overed
[%
]
0
20
40
60
80
100
1 Drone (FCC)
3x3 Grid, 480 m IDD (FCC)
5x5 Grid, 480 m IDD (FCC)
7x7 Grid, 480 m IDD (FCC)
9x9 Grid, 480 m IDD (FCC)
11x11 Grid, 480 m IDD (FCC)
3x3 Grid, 960 m IDD (FCC)
5x5 Grid, 960 m IDD (FCC)
7x7 Grid, 960 m IDD (FCC)
(b) Maximum drone EIRP 36 dBm (FCC).
Fig. 3: Dense urban environment outdoor coverage for theManhattan Grid. Coverage limited to −80 dBm.
enabling cost-efficient solution to provide Internet connectionto the disturbance area.
It should be noted that the altitude of the drones does notprovide much gain for coverage, i.e. the coverage area forhigher drone hovering altitudes is not significantly larger inrural environment. As a result, the drone hovering altitudesshould be kept rather low. Therefore, the biggest limiting factorfor larger coverage areas is IDD, but in order to extend it, somehighly directive antennas would be needed.
The flight and hover time of the drones will not be aproblem, since nowadays there exist drones [16] that canstay in the air with a microfilament system providing energyfrom the ground-level up to 150 m for as long as needed.
Thus, the results are implementable at least to 150 m altitude.However, results for the higher altitudes provide insight onhow much coverage could be possible to achieve withoutheight restrictions.
The results of this paper relied on simulation scenariosand their accuracy might not correspond entirely with reallife implementations although the utilized models are ratheraccurate. Thus, the future work on this topic will concentrateon more complex scenarios. The focus will also be on thecapacity aspects, and eventually the target is to implement theproposed system.
ACKNOWLEDGMENT
The authors would like to thank the Finnish funding agencyfor innovation (Tekes) for funding the research work.
REFERENCES
[1] Google, “Loon for all,” October 2015.[2] Internet.org by Facebook, “Connecting the World from the Sky,” 2014.[3] H. Hariyanto, H. Santoso, and A. Widiawan, “Emergency broadband ac-
cess network using low altitude platform,” in Instrumentation, Commu-nications, Information Technology, and Biomedical Engineering (ICICI-BME), 2009 International Conference on, Nov 2009, pp. 1–6.
[4] A. Vilhar, A. Hrovat, T. Javornik, and M. Mohorcic, “Experimentalanalysis of wireless temporary networks deployed by low altitudeplatforms,” in Computer Aided Modeling and Design of CommunicationLinks and Networks (CAMAD), 2013 IEEE 18th International Workshopon, Sept 2013, pp. 238–242.
[5] N. Uchida, M. Kimura, T. Ishida, Y. Shibata, and N. Shiratori, “Eval-uation of Wireless Network Communication by Autonomous FlightWireless Nodes for Resilient Networks,” in Network-Based InformationSystems (NBiS), 2014 17th International Conference on, Sept 2014, pp.180–185.
[6] G. Tuna, T. Mumcu, and K. Gulez, “Design strategies of unmannedaerial vehicle-aided communication for disaster recovery,” in HighCapacity Optical Networks and Enabling Technologies (HONET), 20129th International Conference on, Dec 2012, pp. 115–119.
[7] G. Tuna, B. Nefzi, and G. Conte, “Unmanned aerial vehicle-aidedcommunications system for disaster recovery,” Journal of Network andComputer Applications, vol. 41, no. 0, pp. 27 – 36, 2014.
[8] Ilker Bekmezci, O. K. Sahingoz, and Samil Temel, “Flying Ad-HocNetworks (FANETs): A survey,” Ad Hoc Networks, vol. 11, no. 3, pp.1254 – 1270, 2013.
[9] Y. Gu, M. Zhou, S. Fu, and Y. Wan, “Airborne WiFi networks throughdirectional antennae: An experimental study,” in Wireless Communica-tions and Networking Conference (WCNC), 2015 IEEE, March 2015,pp. 1314–1319.
[10] Study Group 3, “Calculation of free-space attenuation,” ITU-R, Recom-mendation P.525-2, 1994.
[11] “ProMan User’s Manual,” http://awe-communications.com/, AWE Com-munications, [Online; accessed 6-July-2015].
[12] L. Liechty, E. Reifsnider, and G. Durgin, “Developing the Best 2.4 GHzPropagation Model from Active Network Measurements,” in VehicularTechnology Conference, 2007. VTC-2007 Fall. 2007 IEEE 66th, Sept2007, pp. 894–896.
[13] “HyperLink Wireless 2.4/5.8 GHz Omnidirectional antennas,” http://www.l-com.com/multimedia/datasheets/DS HGV-2458-XXU.PDF, L-com, Inc., 2015, [Online; accessed 1-December-2015].
[14] “NanoStation M / NanoStation Loco M Datasheet,” https://dl.ubnt.com/datasheets/nanostationm/nsm ds web.pdf, Ubiquiti Networks, Inc.,2015, [Online; accessed 1-December-2015].
[15] U. Paul, R. Crepaldi, J. Lee, S.-J. Lee, and R. Etkin, “CharacterizingWiFi link performance in open outdoor networks,” in Sensor, Mesh andAd Hoc Communications and Networks (SECON), 2011 8th AnnualIEEE Communications Society Conference on, June 2011, pp. 251–259.
[16] “The Persistent Aerial Reconnaissance and Communications (PARC)vehicle system,” http://cyphyworks.com/robots/parc/, CyPhy Works Inc.,2015, [Online; accessed 1-December-2015].
Publication 7
D. Paudel, J. Säe, and J. Lempiäinen, “Applicability of macro sensor network in disasterscenarios,” in Proceedings of the 4th International Conference on Wireless Communica-tions, Vehicular Technology, Information Theory and Aerospace & Electronic Systems(VITAE), Aalborg, Denmark, 11.–14. May 2014. DOI: 10.1109/VITAE.2014.6934480
Copyright c© 2014 IEEE. Reprinted, with permission, from Proceedings of the 4th Inter-national Conference on Wireless Communications, Vehicular Technology, InformationTheory and Aerospace & Electronic Systems (VITAE).
In reference to IEEE copyrighted material which is used with permission in this thesis, theIEEE does not endorse any of Tampere University of Technology’s products or services. In-ternal or personal use of this material is permitted. If interested in reprinting/republishingIEEE copyrighted material for advertising or promotional purposes or for creatingnew collective works for resale or redistribution, please go to http://www.ieee.org/publications_standards/publications/rights/rights_link.html to learn how toobtain a License from RightsLink.
121


Applicability of Macro Sensor Network in Disaster Scenarios
Dipesh Paudel, Joonas Säe and Jukka LempiäinenDepartment of Electronics and Communications Engineering
Tampere University of TechnologyP.O.Box 553, FI-33101 TAMPERE, FINLAND
[email protected], [email protected], [email protected]
Abstract—The efficient use of communication technologiesduring disaster scenarios is vital for the relief and rescue worksas well as for the disaster affected people. During the disasterscenarios, links between the Radio Access Network (RAN) andthe Core Network (CN) might be broken. If the link between suchaffected nodes can be re-established via node-to-node communi-cation, the data from the users can be transported to the net-work. Thus, this utilization of node-to-node communication canbe a key technological achievement for cellular networks duringsuch scenarios. The aim of this paper is to present the possiblerealization of a macro site node-to-node sensor network function-ality for cellular networks during disaster scenarios. The meritsof 3GPP LTE technology have been utilized in this paper to pre-sent a framework for this node-to-node communication in 3GPPLTE technology.
Keywords—disaster scenarios, LTE, node-to-nodecommunication, WSN.
I. INTRODUCTION
Communication has played a vital role during different dis-aster scenarios from its early development to the present day.Communication techniques have been used for providing earlyinformation about the disaster and during the emergency rescueand relief operation for disaster affected people. Thus, duringcrisis events, communication is critical for disaster manage-ment. The use of wireless communication for the disaster man-agement backs to events surrounding the sinking of “Titanic”in the night of April 13–14, 1912. The radio communicationsystem was vital communicating with nearby ships because ofwhich they changed their course for rescue of the passengersonboard in the “Titanic” [1]. Moreover, the Tsunami of 2004 atIndian Ocean was an alert for the world on the need for effi-cient communication system during an emergency for disastermanagement. Public Land Mobile Network (PLMN) can be aneffective communication technology in the disaster scenarios totransfer the data from the sensors, establish communicationbetween relief teams or with the victims. The Tampere Con-vention, organized by joint effort of UN and ITU in 1998 inTampere, Finland, facilitates the use of telecommunication forhumanitarian aid, removing regulatory barriers and in the useof frequencies [2].
When disaster strikes, various communication links mightbe interrupted and the communication network becomes non-functional. Various research works have been done to provide aprompt communication service to the relief works and peoplein disaster affected areas. Reference [3] presents the Wireless
Sensor Network (WSN) for the disaster management and [4]shows the use of Ad hoc Networks for the rescue operation anddisaster survivor detection. High Altitude Platform (HAP) sys-tem has been proposed in [5] for replacing UMTS coverage indisaster scenarios. However, HAP faces the challenge of sta-tionary allotment of its stations due to wind and the supply ofthe energy. HAP system is expensive as well. The combinationof cellular mobile network and the ad hoc networks leading tothe Multi-hop Cellular Network (MCN) is proposed in [6]which combine the benefits of fixed infrastructure of cellularmobile networks and the flexibility of ad hoc networks. How-ever, MCN does not scale well and it is difficult to provideuninterrupted high bandwidth connectivity to a large number ofusers with these networks [6].
In this paper, it has been focused on a disaster scenario,where the link between the RAN and CN is broken and thustransmission between network elements is affected. For LTEnetwork this is the link between eNodeB and the EvolvedPacket Core (EPC). The possible solution proposed in this pa-per is the realization of surrounded eNodeBs sites as WSNnodes to establish the relay network for transmission purposebetween the affected nodes. The nodes should sense the disas-ter scenario and switch to sensor mode. The communicationbetween these nodes is at the macro level and thus is termed asmacro sensor network. This functionality can be realized as a“Safety Mode” and the communication blackout can be elimi-nated and transmission network can be re-established. The es-tablished link can provide limited services such as SMS,speech or limited data services. Thus, by utilizing the pre-existing infrastructure of 3GPP technology, an effective com-munication can be achieved during disaster scenarios.
II. THEORY
For the efficient node-to-node communication, the occur-rence of interference from other sources should be analyzed.This section introduces the theory behind the node-to-nodecommunication. It is assumed that the eNodeB antennas areorganized into three sector sites and the network layout is clo-ver-leaf.
A. Frequency Reuse PatternReference [7] shows the frequency reuse scheme where the
available frequency band is divided into several sub-bands. Aset of frequencies are allocated for cell edge users in a cell withfull downlink transmission power. Users in the inner cell areserved with reduced power. The frequency reuse pattern for the

node-to-node communication is realized such that the reusedpattern proposed for the cell edge users in [7] is used for thecommunication between the antennas as shown in Fig. 1.
Fig. 1. Frequency Reuse Pattern.
The reuse pattern in Fig. 1 can now be used for the node-to-node communication during the disaster scenarios. The thickcolor boundary line shows the size of a single cluster. The re-used cells are organized such that the interference from thecells with same frequency is minimized.
B. Inter-cell InterferenceThe effective use of resources in a cellular system can high-
ly enhance the capacity of the system. In a cellular networkemploying frequency reuse across different cells, inter-cellinterference occurs when neighboring cells use the same fre-quency band for communication. Reference [8] and [9] show ageneral approach of frequency reuse for inter-cell interferencereduction. As shown in Fig. 2, transmitter T1 transmits a signalto its desired receiver R1. At the same time transmitter T2 alsotransmits a signal. Then, R1 receive a signal from T1 as well asfrom T2. At the receiver R1, the signals from T1 and T2 aresuperimposed and the signal from T2 is interference for R1.Moreover, higher interference leads to low Signal to Interfer-ence and Noise Ratio (SINR) value which finally implies lowquality of the wanted signal.
Fig. 2. Radio Communication System.
In order to calculate the inter-cell interference, the follow-ing equations are needed. First, the SINR is defined as
,ncellintracellinter
r
PPPP
SINR++
=--
(1)
where Pr is the received power, Pinter-cell is the other-cell in-terference power, Pintra-cell is the inner-cell interference powerand Pn is the noise power.
The signal power S of the desired transmitted signal re-ceived by the receiver can be calculated as
,rtdtd PLGGPS -++= (2)
where Ptd is the transmitted power, Gtd is the antenna gainof the transmitted station, Gr is the antenna gain of the desiredreceiver station and PL is the path loss. The interference powerof the neighbor co-channels received at the same receiver canbe calculated as
.rdtiti PLGGPI -++= (3)
Here Pti is the transmit power from interfering station, Gti isthe antenna gain of interfering transmit station, Grd is the an-tenna gain of the desired receiver station measured at the angleof arrival of the interfering station.
C. Path lossThe proposed node-to-node communication is at the macro
site layer, i.e. the base station antennas are at towers, and thusthe assumption is that the antennas have Line-of-Sight (LOS)visibility between each other and the Fresnel zone is free.Hence, free space path loss model can be utilized to predict thesignal strength at the receiver. The equation can be expressedas
( ) ( ) ( )10 10dB 32.45 20 log 20 log ,PL D f= + × + × (4)
where D is the distance in km and f is the frequency inMHz. Free space path loss model predicts that the receivedpower declines as a function of the distance between the trans-mitter and the receiver.
D. Wireless sensor networkThe role of WSN can be vital for the disaster management
during the disaster scenarios. WSN can be used for objecttracking, monitoring and transmitting environmental infor-mation and for object detection as well. The sensor node sendsits data to the sink or the fusion center, which is responsible forprocessing and extracting the sensor data. This delivery of datafrom the node to the sink may follow multiple-hops. In thispaper, the functionality of sensing and the multi-hop routingapproach of WSN are used to deliver the data to the desireddestination, which can be from an eNodeB to the EPC, or viceversa. Moreover, the sensor network which is ad hoc in nature

has the capability of minimum dependence on network plan-ning and the capability of nodes to self-organize and self-configure without the involvement of the central controller.Hence, an operational ad hoc network should cope with thedynamic restructuring of the link. Thus, in ad hoc network, twodifferent nodes can communicate with each other via otherintermediate nodes.
The topology management is a key issue in WSN. Refer-ence [10] states the topology management procedure includingthe topology discovery algorithms. In this paper, the WSN thatis formed during disaster scenarios consists of a various num-ber of sensor nodes communicating over the wireless links us-ing a fixed network infrastructure. Thus, the routing protocolfor WSN has to ensure a reliable multi-hop communication.References [11–13] describe various routing protocols whichcan be used in WSN, but this study is not limited to a specificrouting protocol.
III. EXAMPLE SCENARIOS
The example scenarios are based on the frequency reusescheme designed for the node-to-node communication duringdisaster scenarios in rural areas but are not limited to them. Theresults were calculated for the 800 MHz bandwidth.
Fig. 3. Frequency reuse pattern with 1. tier of interfering nodes.
Fig. 3 shows the frequency reuse pattern with the first tierof interfering nodes. This study considers only the first tier ofinterfering nodes, since they are causing the majority of theinterference. The cells with the frequency reuse of frequencynumber 1 are shown by dark grey color. Node A is the trans-mitting node, B is the receiving node and nodes C, D, E, F, Gand H are the interfering nodes. The effective gain of thetransmitting, receiving and the interfering antennas are includ-ed in the calculation. The angle of reception of the signal at thereceiver antenna varies according to the location and the trans-mission from the interfering nodes. The inter-site distance(ISD) between neighbor eNodeBs is assumed to be equal. Thecarrier power and the interference power is calculated from the
transmit power, the gain of the antennas and the path loss be-tween them. Then, the SINR value is calculated.
The capacity of the resulting node-to-node link is deter-mined from the calculated SINR values. The bandwidth scala-bility of the LTE network is utilized for the frequency reuseplanning and for the capacity analysis.
IV. RESULTS
LTE technology with OFDMA radio access scheme is se-lected for the downlink transmission. This study considersOFDMA for both uplink and downlink in node-to-node trans-missions. OFDMA yields to a frequency structure which di-vides the data over a number of sub-carriers. The spacing be-tween two sub-carriers is fixed at 15 kHz. One Resource Block(RB) has 12 sub-carriers in frequency and 14 continuous sym-bols in time. Thus, one RB is 180 kHz in frequency and 1ms intime. The bandwidth scalability property of LTE allows 1.25,2.5, 5, 10, 15, 20 MHz frequency band to provide the service.Fig. 1 shows the reuse pattern with 7 different frequencies in atransmission cluster. In this paper, it is assumed that each fre-quency band assigned is 2.5 MHz from the total of 20 MHzLTE band. Thus, 17.5 MHz is assigned for the node-to-nodecommunication and remaining 2.5 is assigned for the users.These frequencies can be utilized both in the uplink and down-link directions. User band of 2.5 MHz is reused in every cellbased on 1/1 reuse concept assuming high quality scheduler inLTE technology. Correspondingly, if 1.25 MHz is used, 8.75MHz could be reserved for transmission and 11.25 MHz for theusers.
The SINR was calculated with (1)–(4) and the resultingSINR equals to 5.92 dB. Table I shows that the calculatedSINR values are the same because the ratio between the carrierpower and the interference power is approximately the samefor different inter-site distances. Comparing these result valueswith the recommended value of SINR presented in [14], it canbe noted that the implementation of QPSK modulation tech-nique with 3/4 or 4/5 coding rate is possible.
TABLE ISINR VALUES FOR DIFFERENT ISD.
Inter-site Distance (m) 2000 3000 6000SINR (dB) 5.920 5.919 5.917
3GPP specification TS 36.213 specifies the MCS and TBSfor LTE. Reference [15] gives the mapping between MCS In-dex, Modulation Order and the TBS Index. The antenna ofLTE assigns the MCS Index and the RB on the basis of CQIfor the downlink transmission. This CQI value depends uponthe SINR. Reference [15] also specifies the mapping betweenTBS index, the number of RB and the corresponding TBS val-ue. From this mapping, the possible peak data rate that QPSKcan provide, based on the calculated SNIR value, was deter-mined to be 1864 kbps. Moreover, the peak rate of 3728 kbpscan be achieved for 2x2 MIMO, and 7456 kbps for 4x4 MIMOsystems.

V. OPERATIONAL FRAMEWORK
The framework has been developed for the various eventsassociated with the node-to-node communication during thedisaster scenarios. These events include the detection of thedisaster scenarios by the nodes, the events related to the estab-lishment of the path between the nodes and the events thatshould be triggered from the CN.
A. Disaster Detection and Link EstablishmentIn this paper, the disaster scenario corresponds to a situa-
tion where the link between the eNodeB and the CN is broken.This corresponds to situations, where the link is physicallybroken, but it can also be considered in situations where thelogical connection is temporarily unavailable.
Fig. 4 shows the flow chart for the detection of the disasterscenario. When the link between the eNodeB and the EPC isbroken, eNodeB should detect this event and then it shouldswitch its functionality to macro sensor mode. In macro sensormode, eNodeB should work with LTE functionality as well aswith sensor node functionality. With this functionality, nodeshould detect the disaster events, should perform route estab-lishment with neighbor node and should act as relay hop.
Fig. 4. Node-to-node communication flow chart.
The link establishment procedure uses an efficient protocolto establish the link with the most preferred neighbor node. Anode sends the discovery message (hello message) to theneighbor nodes. The receiver can reply with the positive ornegative response. If the response is positive, then in the replymessage, the QOS information is also sent to the transmittingnode. The receiver node can be the node with the active link orwith the inactive link with the EPC. If the receiving node hasactive link to EPC, then this is the final hop. Otherwise, thisnode searches for another neighbor node with active link toEPC. All the route information can be stored in the cache ineach node.
B. Events from CNThe sensor mode functionality is activated at the nodes
which are affected by the disaster. But to transport the datafrom such nodes to the CN, certain number of eNodeBs withthe active link to the CN should also be initialized with thesensor network functionality.
Fig. 5. EPC events.
Fig. 5 shows the operation and maintenance entity of EPCthat should detect this fault situation and should locate thenodes in the geographical areas. Then, EPC should send acommand to the unaffected nodes in the vicinity of the disasterarea to enable the sensor mode functionality. These nodes atthe vicinity will act as nodes between the EPC and the affectednodes to facilitate the delivery of the data to and from the net-work.
C. Network RestorationThe maintenance of the network can re-establish a commu-
nication link between the affected eNodeBs with the EPC.Then, the repaired node should act as a last hop for providingthe relay function to the EPC. Once, role of the repaired nodein the node-to-node communication is over, it can notify EPCand should switch back to the normal state.
VI. CONCLUSIONS AND FUTURE WORK
This paper presented the new functionality of node-to-nodecommunication to facilitate the communication during the dis-aster scenarios. To enable the node-to-node communicationduring the link outage of RAN and CN, the realization of LTEradio network as a macro sensor network is proposed to main-tain the communication.
The results presented in this paper show that a node-to-node communication can be established in LTE during the dis-aster scenarios. Furthermore, this type of backup node-to-nodecommunication would be strongly limited in UMTS due to thefrequency constrains. Correspondingly, node-to-node approachcould be implemented in GSM with reduced capacity also dueto frequency constrains.
The device-to-device communication is considered as thekey technology for the future evolution of the LTE technology.The study of proximity-detection functionality for device-to-device communication is shown in [16–17]. Further, the LTE-Advanced has introduced the concept of Relay Nodes for theefficient heterogeneous network planning. The Relay Node is

connected to the Donor eNodeB via radio interface [18]. Thefuture work should take these approaches into account.
The node-to-node communication for the cellular networkhas opened a new research area in the field of communication.The SON technology is also required to implement the sensormode functionality, and thus even extends this new researcharea. The complexity and bottle neck from the volume of datagenerated by the users to the node-to-node communicationshould also be studied. The use of maximum ratio combiningor the switched combining can be a good research area to studythe signal reception through two different antenna links.
ACKNOWLEDGMENT
The authors would like to thank the Finnish Funding Agen-cy for Innovation and the European Communications Engineer-ing for funding and supporting the research work.
REFERENCES
[1] Jean Finton, “The story of Titanic”, Maryland Science Center, 2005.[2] Tampere Convention, “Tampere Convention on the Provision of Tele-
communication Resources for Disaster Mitigation and Relief Opera-tions”, Tampere, 1998.
[3] H. Kaur, R.S. Sawhney, N. Komal, “Wireless Sensor Networks forDisaster Management”, International Journal of Advanced Research inComputer Engineering & Technology, Vol. 1, pp. 129-134, July 2012.
[4] N. Ahmad, N. Riaz, M. Hussain, “Ad hoc wireless Sensor NetworkArchitecture for Disaster Survivor Detection”, International journal ofAdvanced Science and Technology, Vol. 34, pp. 9-16, September, 2011.
[5] P. Lähdekorpi, T. Isotalo, K. Kylä-Liuhala & J. Lempiäinen, “Replacingterrestrial UMTS coverage by HAP in disaster scenarios”, Wireless Con-ference (EW), 2010.
[6] Ananthapadmanabha R., B. S. Manoj & C. Siva Ram Murthy, ” Mul-ti.hop Cellular Networks: The Architecture and Routing Protocols”, 12thIEEE International Symposium on Personal, Indoor and Mobile RadioCommunications, vol. 2, pp. G-78 - G-82, 2001.
[7] F. Xiangning, C. Si, Z. Xiaodong, “An inter-cell interference Coordina-tion Technique based on users ratio and Multi-Level Frequency Alloca-tions”, Wireless Communications, Networking and Mobile Computing,2007.
[8] R1-050507,” Soft Frequency Reuse Scheme for UTRAN LTE”, Huawei.3GPP TSG RAN WG1 Meeting 41, Athens, Greece, May 2005.
[9] Y. Xiang, J. Luo, C. Hartmann, “Inter-cell Interference Mitigationthrough Flexible Resource Reuse in OFDMA based CommunicationNetworks”, 13th European Wireless Conference, April 2007.
[10] S. Misra, I. Woungang, S.C. Misra, “Guide to Wireless Sensor Net-works”, Springer, 2009
[11] D. Ganesan, R. Govindan, S. Shenker, D. Estrin, “Highly - Resilient,Energy - Efficient Multipath Routing in Wireless Sensor Networks”,Mobile Computing and Communications Review, Vol. 1, Number 2,2001.
[12] H. Kumar, H. Arora, RK Singla, “Simulation Analysis of OptimizedLink State Routing Protocol in Wireless Sensor Networks”, EmergingTrends in Networks and Computer Communications (ETNCC), 22-24April 2011.
[13] J. Kulik, W. R. Heinzelman and H. Balakrishnan, “Negotiation-BasedProtocols for disseminating Information in Wireless Sensor Networks”,ACM/IEEE international conference on Mobile computing and network-ing, August 1999.
[14] Stefania Sesia, Issam Toufik, Matthew Baker, “LTE the UMTS LongTerm Evolution FROM THEORY TO PRACTICE”, John Wiley andSons, 2009.
[15] 3rd Generation Partnership Project, Technical Specification Group Ra-dio Access Network, “Evolved Universal Terrestrial Radio Access (E-UTRA); Physical layer procedures”, Release 11, 3GPP TS 36.213, V11.40, 2013.
[16] Xingqin Lin, Jeffrey G. Andrews, Amitava Ghosh, Rapeepat Ratasuk,“An Overview on 3GPP Device-to-Device Proximity Services”, submit-ted to IEEE Communications Magazine, September 2013.
[17] “LTE Release 12 –Taking Another Step Toward The Networked Socie-ty”, Ericsson White Paper, January 2013.
[18] “LTE-Advanced, The advanced LTE toolbox for more efficient deliveryof better user experience”, Technical White Paper, Nokia Siemens Net-works, 2011.

ISBN 978-952-15-3932-9ISSN 1459-2045
Tampereen teknillinen yliopisto PL 52733101 Tampere
Tampere University of TechnologyP.O.B. 527FI-33101 Tampere, Finland