Embed Size (px)
Citation preview

102:3414-3432, 2009. First published Oct 7, 2009; doi:10.1152/jn.00086.2009 J NeurophysiolKeith P. Purpura Jonathan D. Victor, Ferenc Mechler, Ifije Ohiorhenuan, Anita M. Schmid and
You might find this additional information useful...
49 articles, 18 of which you can access free at: This article cites http://jn.physiology.org/cgi/content/full/102/6/3414#BIBL
including high-resolution figures, can be found at: Updated information and services http://jn.physiology.org/cgi/content/full/102/6/3414
can be found at: Journal of Neurophysiologyabout Additional material and information http://www.the-aps.org/publications/jn
This information is current as of January 2, 2010 .
http://www.the-aps.org/.American Physiological Society. ISSN: 0022-3077, ESSN: 1522-1598. Visit our website at (monthly) by the American Physiological Society, 9650 Rockville Pike, Bethesda MD 20814-3991. Copyright © 2005 by the
publishes original articles on the function of the nervous system. It is published 12 times a yearJournal of Neurophysiology
on January 2, 2010 jn.physiology.org
Dow
nloaded from

Laminar and Orientation-Dependent Characteristics of Spatial Nonlinearities:Implications for the Computational Architecture of Visual Cortex
Jonathan D. Victor, Ferenc Mechler, Ifije Ohiorhenuan, Anita M. Schmid, and Keith P. PurpuraDepartment of Neurology and Neuroscience, Weill Cornell Medical College, New York, New York
Submitted 29 January 2009; accepted in final form 30 September 2009
Victor JD, Mechler F, Ohiorhenuan I, Schmid AM, Purpura KP.Laminar and orientation-dependent characteristics of spatial nonlin-earities: implications for the computational architecture of visualcortex. J Neurophysiol 102: 3414–3432, 2009. First published Octo-ber 7, 2009; doi:10.1152/jn.00086.2009. A full understanding of thecomputations performed in primary visual cortex is an important yetelusive goal. Receptive field models consisting of cascades of linearfilters and static nonlinearities may be adequate to account for re-sponses to simple stimuli such as gratings and random checkerboards,but their predictions of responses to complex stimuli such as naturalscenes are only approximately correct. It is unclear whether thesediscrepancies are limited to quantitative inaccuracies that reflectwell-recognized mechanisms such as response normalization, gaincontrols, and cross-orientation suppression or, alternatively, implyadditional qualitative features of the underlying computations. Toaddress this question, we examined responses of V1 and V2 neuronsin the monkey and area 17 neurons in the cat to two-dimensionalHermite functions (TDHs). TDHs are intermediate in complexitybetween traditional analytic stimuli and natural scenes and havemathematical properties that facilitate their use to test candidatemodels. By exploiting these properties, along with the laminar orga-nization of V1, we identify qualitative aspects of neural computationsbeyond those anticipated from the above-cited model framework.Specifically, we find that V1 neurons receive signals from orientation-selective mechanisms that are highly nonlinear: they are sensitive tophase correlations, not just spatial frequency content. That is, thebehavior of V1 neurons departs from that of linear–nonlinear cascadeswith standard modulatory mechanisms in a qualitative manner: evenrelatively simple stimuli evoke responses that imply complex spatialnonlinearities. The presence of these findings in the input layerssuggests that these nonlinearities act in a feedback fashion.
I N T R O D U C T I O N
Understanding the behavior of neurons in primary visualcortex (V1) is important both as a first step in understandingcentral visual processing and also because of V1’s status as amodel system for understanding cortical computation in gen-eral. Ideally, one might hope to encapsulate this understandingin a predictively accurate yet concise mathematical model ofindividual neural responses to arbitrary visual stimuli. Al-though progress toward this goal has been made, attainment iselusive (Olshausen and Field 2004).
There is general agreement on a starting framework—a“new standard model” (Rust et al. 2005). This model takes theclassical model of an oriented linear filter followed by a simplenonlinearity as a building block, combines these linear–non-linear (“LN”) cascades in parallel, and adds modulatory mech-anisms: gain controls, including normalizations (Albrecht and
Geisler 1991; Geisler and Albrecht 1992; Heeger 1992, 1993)and cross-orientation interactions (Allison et al. 2001; Bonds1989; Carandini et al. 1998; Durand et al. 2007; Freeman et al.2002). However, models of this structure provide an incom-plete account (e.g., 50% of the variance is explained; Davidand Gallant 2005) of the responses of V1 neurons to complex,natural stimuli (see also (Felsen et al. 2005; Touryan et al.2005; reviewed in Carandini et al. 2005).
It is not clear whether the shortcomings of current modelsmerely reflect quantitative errors that would be corrected byimproving the parametric account of known modulatory mech-anisms or, alternatively, whether important qualitative aspectsof the computations carried out by V1 remain to be identified.This is an important question—at the heart of understandingthe design principles of cortical visual processing. Addressingit directly, however, is difficult: one would need to model themodulatory influences at a sufficient level of detail so that onecould specify how each would respond to arbitrary images. Todo this would require measurement of a multitude of parame-ters for each modulatory mechanism (e.g., its spatial-frequencytuning, orientation tuning, localization, and dynamics) on acell-by-cell basis, all within the confines of the practical limitsof single-unit recording.
Recognizing the importance of the problem but the impracti-cality of this direct approach, we developed an alternative exper-imental strategy that focuses on the identification of qualitativebehaviors that distinguish classes of models, rather than detailedparametric modeling. This is an analog of a familiar idea: re-sponses to sinusoidal stimuli allow one to detect the presence ofnonlinear behavior, without having to model the linear behavior.Here, rather than attempt to measure modulatory influences, weuse a stimulus class that effectively neutralizes them. This allowsus to ask whether a cascade model accounts for what remains. Ifit does not, then we can conclude that a computational element ismissing from the modulated-cascade picture and begin to charac-terize the missing component.
As described in the following text, we find that something ismissing and this missing component indicates that V1 extractsorientation not just by spatial frequency content, but also byphase correlations, i.e., spatial correlations of order three andabove. (The term “phase correlation” is synonymous withspatial correlations of order three and above. This is becausethird- and higher-order spatial correlations correspond to cor-relations across multiple Fourier components, whereas second-order correlations reflect the power of individual Fourier com-ponents, independent of their relative phase.) Moreover, wefind that these orientation signals are available to modulate thebehavior of neurons at the V1 input, suggesting the presence ofnonlinear feedback from orientation-tuned neurons.
Address for reprint requests and other correspondence: J. D. Victor, Depart-ment of Neurology and Neuroscience, Weill Cornell Medical College, 1300York Avenue, New York, NY 10065 (E-mail: [email protected]).
J Neurophysiol 102: 3414–3432, 2009.First published October 7, 2009; doi:10.1152/jn.00086.2009.
3414 0022-3077/09 $8.00 Copyright © 2009 The American Physiological Society www.jn.org
on January 2, 2010 jn.physiology.org
Dow
nloaded from
Background: two-dimensional Hermite functions
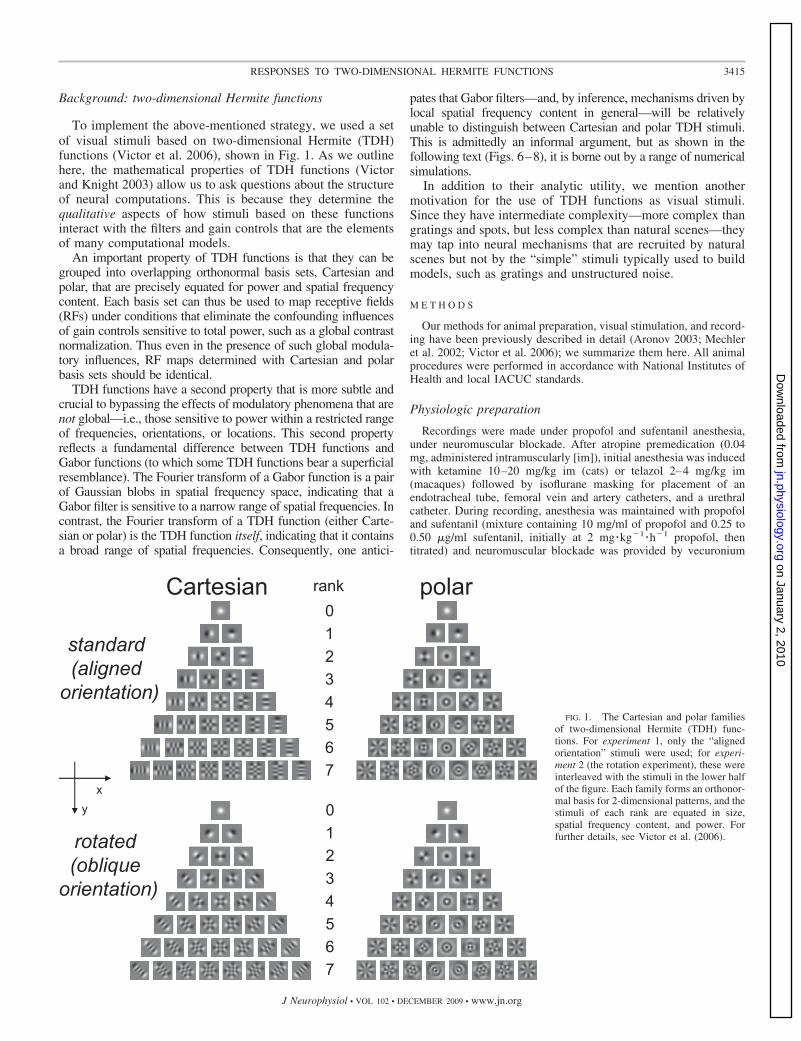
To implement the above-mentioned strategy, we used a setof visual stimuli based on two-dimensional Hermite (TDH)functions (Victor et al. 2006), shown in Fig. 1. As we outlinehere, the mathematical properties of TDH functions (Victorand Knight 2003) allow us to ask questions about the structureof neural computations. This is because they determine thequalitative aspects of how stimuli based on these functionsinteract with the filters and gain controls that are the elementsof many computational models.
An important property of TDH functions is that they can begrouped into overlapping orthonormal basis sets, Cartesian andpolar, that are precisely equated for power and spatial frequencycontent. Each basis set can thus be used to map receptive fields(RFs) under conditions that eliminate the confounding influencesof gain controls sensitive to total power, such as a global contrastnormalization. Thus even in the presence of such global modula-tory influences, RF maps determined with Cartesian and polarbasis sets should be identical.
TDH functions have a second property that is more subtle andcrucial to bypassing the effects of modulatory phenomena that arenot global—i.e., those sensitive to power within a restricted rangeof frequencies, orientations, or locations. This second propertyreflects a fundamental difference between TDH functions andGabor functions (to which some TDH functions bear a superficialresemblance). The Fourier transform of a Gabor function is a pairof Gaussian blobs in spatial frequency space, indicating that aGabor filter is sensitive to a narrow range of spatial frequencies. Incontrast, the Fourier transform of a TDH function (either Carte-sian or polar) is the TDH function itself, indicating that it containsa broad range of spatial frequencies. Consequently, one antici-
pates that Gabor filters—and, by inference, mechanisms driven bylocal spatial frequency content in general—will be relativelyunable to distinguish between Cartesian and polar TDH stimuli.This is admittedly an informal argument, but as shown in thefollowing text (Figs. 6–8), it is borne out by a range of numericalsimulations.
In addition to their analytic utility, we mention anothermotivation for the use of TDH functions as visual stimuli.Since they have intermediate complexity—more complex thangratings and spots, but less complex than natural scenes—theymay tap into neural mechanisms that are recruited by naturalscenes but not by the “simple” stimuli typically used to buildmodels, such as gratings and unstructured noise.
M E T H O D S
Our methods for animal preparation, visual stimulation, and record-ing have been previously described in detail (Aronov 2003; Mechleret al. 2002; Victor et al. 2006); we summarize them here. All animalprocedures were performed in accordance with National Institutes ofHealth and local IACUC standards.
Physiologic preparation
Recordings were made under propofol and sufentanil anesthesia,under neuromuscular blockade. After atropine premedication (0.04mg, administered intramuscularly [im]), initial anesthesia was inducedwith ketamine 10–20 mg/kg im (cats) or telazol 2–4 mg/kg im(macaques) followed by isoflurane masking for placement of anendotracheal tube, femoral vein and artery catheters, and a urethralcatheter. During recording, anesthesia was maintained with propofoland sufentanil (mixture containing 10 mg/ml of propofol and 0.25 to0.50 �g/ml sufentanil, initially at 2 mg �kg�1 �h�1 propofol, thentitrated) and neuromuscular blockade was provided by vecuronium
standard(alignedorientation)
rotated(obliqueorientation)
Cartesian polarrank
0
234567
1
xy
0
234567
1
FIG. 1. The Cartesian and polar familiesof two-dimensional Hermite (TDH) func-tions. For experiment 1, only the “alignedorientation” stimuli were used; for experi-ment 2 (the rotation experiment), these wereinterleaved with the stimuli in the lower halfof the figure. Each family forms an orthonor-mal basis for 2-dimensional patterns, and thestimuli of each rank are equated in size,spatial frequency content, and power. Forfurther details, see Victor et al. (2006).
3415RESPONSES TO TWO-DIMENSIONAL HERMITE FUNCTIONS
J Neurophysiol • VOL 102 • DECEMBER 2009 • www.jn.org
on January 2, 2010 jn.physiology.org
Dow
nloaded from

0.25 mg/kg intravenous (iv) bolus, 0.25 mg �kg�1 �h�1 iv. Heart rateand rhythm, arterial blood pressure, body temperature, end-expiratoryPCO2, arterial oxygen saturation, urine output, and electroencephalo-grams were monitored during the course of the experiment. Animalmaintenance included intravenous fluids (lactated Ringer solutionwith 5% glucose, 2–3 ml �kg�1 �h�1), administration of supplementalO2 every 6 h, antibiotics (procaine penicillin G 75,000 U/kg im duringsurgery, gentamicin 5 mg/kg im daily if evidence of infection),application of 0.5% bupivicaine to wounds, and ocular instillation ofatropine 1% and flurbiprofen 2.5% (and, for cats, Neo-Synephrine eyedrops 10% to retract the nictitating membranes), dexamethasone (1mg/kg im daily), and periodic cleaning of the contact lenses. Withthese measures, the preparation remained physiologically stable for 2or 3 days (cats) and 4 or 5 days (macaques).
Recording
A craniotomy was placed near P3, L1 (cats) or P15, L14 (ma-caques). For six macaques, an array of three tetrodes (Thomas Re-cording, Giessen, Germany), each coated with 1,1�-dioctadecyl-3,3,3�,3�-tetramethylindocarbocyanine perchlorate (DiI, MolecularProbes, Eugene, OR) to aid subsequent localization of their tracks,was inserted through a small durotomy. The tetrodes were in a “T”configuration: two tetrodes about 600 �m apart, placed just behindand parallel to the presumptive V1/V2 border, and a third tetrode1,000 to 3,000 �m anteriorly, targeting V1 or V2. [For the twomacaques and three cats reported in Victor et al. (2006), only onetetrode was used, targeting V1 or area 17.]
Each tetrode was advanced until spiking activity from one or moreunits was encountered. Regions of the RFs were hand-mapped andthen centered on the display of a Sony GDM-F500 19-in. monitor(displaying a 1,024 � 768 raster at 100 Hz, 35 cd/m2), typically at adistance of 114 cm. Real-time spike-sorting software (DatawaveTechnologies) was then engaged to provide TTL pulses correspondingto the spikes of tentatively identified single units and to allow rapid,qualitative characterization of ocular dominance and grating re-sponses via hand-controlled and computer-generated stimuli.
Single-unit isolation
A single PC controlled the visual stimulus, logged discriminatedevent pulses corresponding to the single units tentatively identified byon-line cluster-cutting, and provided timing pulses for a Datawavespike sorting system that recorded spike event waveforms (32 samplesat 0.04-ms resolution) for off-line analysis. Off-line spike sorting wasperformed with an in-house Matlab implementation (Reich 2000) ofthe methods of Fee et al. (1996)) and Sahani et al. (1998). All the datain the following text are derived from these off-line spike sorts.
Usually, each tetrode yielded two to four simultaneously recordedneurons whose spikes were well isolated (signal-to-noise �2:1 andusually �3:1, distinctive shape via on-line spike sorting) and whosespike shapes across the tetrode were reliably discriminated. With theT-shaped recording geometry and the tetrode separations used, nosingle unit was detected by more than one of the tetrodes. Neuronsrecorded by different tetrodes usually had overlapping RFs (in V1and/or V2) and often had similar orientation preferences.
Among the multiple spikes simultaneously recorded, one well-isolated spike on one tetrode was selected as the “target” neuron. Weused the responses from these additional nontarget units for theexperiments described in the following text, provided that theirorientation tuning agreed with that of the target unit within 11.25° andtheir RFs were largely overlapping.
Quantitative characterization of tuning to gratings
As described in the following text, tuning properties were deter-mined for a target neuron and two-dimensional Hermite stimuli were
positioned and proportioned accordingly for the subsequent experi-ments. At approximately one third of recording sites, we repeated thequantitative characterizations for a second neuron with a differentorientation preference on the same tetrode or a neuron on a secondtetrode with a displaced RF, so it too could also serve as a “target”neuron.
Beginning with parameters determined by an initial hand charac-terization, computer-controlled stimulation paradigms were used tocharacterize the target neuron quantitatively with sine gratings. Ori-entation tuning was determined by the mean response (F0) and thefundamental modulated response (F1) to drifting gratings at orienta-tions spaced in steps of 22.5° (or, for narrowly tuned units, 11.25°),presented at a contrast c � (Lmax � Lmin)/(Lmax � Lmin) of 0.5 or 1.0,with spatial and temporal frequency determined by the initial assess-ment. Following this, we sequentially determined spatial frequencytuning, temporal tuning, and the contrast response function, with eachsuccessive run replacing a parameter from the hand characterizationby one determined quantitatively. F1/F0 ratios quoted in the followingtext were determined from the response to a grating stimulus whoseparameters were optimized in this fashion.
The position of the classical receptive field (cRF) of the targetneuron was then determined from the poststimulus histograms(PSTHs) of the response to slowly moving bars. The size of theclassical RF was determined from responses to a drifting grating (allparameters optimized) presented in discs of increasing diameter andannuli with a large outer diameter and decreasing inner diameters. Theeffective diameter D of the RF of the target neuron (used to determinethe size of the TDH patterns) was taken to be the smallest innerdiameter of an annulus that did not produce a response that wassignificantly (2SE) different from the spontaneous activity. The set ofannuli was chosen so that D was determined to within 0.5° or, forsmaller RFs, �0.25°. For further details on determining RF size andposition, see Victor et al. (2006).
Two-dimensional Hermite functions
STIMULI. Following characterization and alignment of one or moretarget neurons, we recorded responses to patches whose spatial con-trast was determined by a two-dimensional Hermite function (TDH)(see Fig. 1). TDH functions consist of a Gaussian envelope, exp[�(x2 �y2)/4�2], multiplied by a polynomial in the coordinates (x,y). We usedtwo families of TDH functions, Cartesian and polar. For the Cartesianfunctions, the multiplying polynomial is of the form X(x)Y(y), so theresulting TDH has zero-crossings and lobes parallel and perpendicularto the x-axis. For the polar functions, the multiplying polynomial is ofthe form R(r)cos(��) or R(r)sin(��), so the resulting TDH haszero-crossings and lobes that are circular or radial. Each set (Cartesianand polar) of TDH functions forms a hierarchy of successively morecomplex patterns. At the nth rank (n � 0, 1, 2, . . .), there are n � 1functions, each characterized by a polynomial of degree n. The zerothrank TDH is an ordinary Gaussian; we used TDHs of rank n � 7.
We set the spatial scale parameter � of the Gaussian envelope at � �D/10, where D was the diameter of the classical receptive field (cRF) ofthe target neuron as determined by responses to disks and annuli con-taining the optimal drifting grating. In these experiments, � had thefollowing ranges (in deg): cat area 17, 0.2 to 0.7 (mean 0.39); macaqueV1, 0.08 to 0.5 (mean 0.20); macaque V2, 0.1 to 0.6 (mean 0.25).
By choosing � in this fashion, stimuli had one, two, or threeoscillations within a region of space that covered the cRF and waswell matched to sample (in the Nyquist sense) the typical receptivefields of cortical simple cells (Ringach 2002), which have two or threelobes. The contrast profiles of the lowest-rank stimuli lay within thecRF, but the contrast profiles of the higher-rank stimuli (by design)extended beyond the cRF. Each of the TDH patterns has the same totalpower [��� f(x,y) �2dxdy]. Contrast was scaled by a common factor forall stimuli so that the maximum contrast across all TDH stimuli was
3416 VICTOR, MECHLER, OHIORHENUAN, SCHMID, AND PURPURA
J Neurophysiol • VOL 102 • DECEMBER 2009 • www.jn.org
on January 2, 2010 jn.physiology.org
Dow
nloaded from
1. See Victor et al. (2006) for further details on the rationale for thischoice and the properties of the Hermite functions.
The above-cited procedures served to standardize the position andsize of the TDH stimuli. There is an unavoidable measurement errorin the determination of cRF position, size, and orientation of the targetneuron. In addition, the other simultaneously recorded neurons oftenhad somewhat different RF parameters. However, we note that theanalysis procedure and our conclusions do not depend on an exactalignment or sizing and this theoretical robustness is confirmed by thenumerical simulations below (Figs. 6–8).
We carried out two kinds of experiments. In the first experiment (asin Victor et al. 2006), we measured responses to Cartesian and polarstimuli, as shown in the top portion of Fig. 1, with the x-axis alignedto the preferred orientation. This experiment was carried out in all 149units. Stimuli were presented both with the polarity as shown in Fig.1, and with inverted-contrast polarity. Ranks 0 to 7 (as shown in Fig.1) constituted 144 stimuli (36 Cartesian stimuli, 36 polar stimuli, andtheir contrast-inverses). With the addition of four “blank” stimuli(mean luminance), in which the contrast was held at zero, and removalof rank-0 and rank-1 duplicates between Cartesian and polar stimuli,this amounted to 142 stimuli. Each stimulus was presented for 250 ms,followed by 250 ms of mean luminance, in randomized order (tominimize the effects of gradual changes in responsiveness or residualeye movements), for 8 to 16 blocks.
In the second experiment, we presented the TDH stimuli as de-scribed earlier and also after rotating them by 45° (bottom portion ofFig. 1). This experiment was carried out in 59 units (12 cat, 47macaque). For the two macaques and three cats reported in Victor etal. (2006), aligned and oblique stimuli were presented in sequentialblocks (12 cat units, 9 macaque units). For the remaining six ma-caques (38 units), stimuli were presented in interleaved blocks.Randomization and timing were the same as in the first experiment.
Note that when the Cartesian TDH stimuli are presented in thestandard orientation, their elongated regions and zero crossings areparallel or perpendicular to the preferred orientation. However, whenthey are presented after a 45° rotation, their contours are all oblique tothe preferred orientation. Rotation of the polar TDH stimuli has a verydifferent kind of effect: some polar TDH stimuli are rotationallyinvariant and, for many others, rotation turns one polar TDH stimulusinto another one.
ANALYSIS. Responses to two-dimensional Hermite functions areanalyzed as detailed in Victor et al. (2006)) and are summarized here.The analysis has two stages: first, characterization of a neuron’sresponses to a single TDH family (Cartesian or polar) and, second,comparison of these characterizations across the two families.
To characterize the response to a single TDH family, we model theresponse as the sum of three components: a maintained discharge Rm,a linear component, whose spatial sensitivity is described by L(x,y),and a full-wave-rectifying component, whose spatial sensitivity isdescribed by E(x,y). That is, the response to an arbitrary stimulus S ismodeled as
R�S � Rm � �S�x,yL�x,ydxdy
� ��S�x,yE�x,ydxdy� (1)
We emphasize at the outset that we are not advancing Eq. 1 as areasonable model for cortical computations in general, but simply asa way to summarize and compare responses to different kinds of TDHstimuli, so that we can draw inferences from this characterization.There are two reasons that Eq. 1 is useful for this purpose. First, forthe stimuli used here, the characterization is effectively complete—itfully specifies the responses to one TDH basis set and accounts for allof the explainable variance (see comment following Eq. 2). Addition-ally, it explicitly predicts the responses to another TDH basis set. Thisfollows from the fact that the Cartesian and polar TDH basis sets haveexactly the same span and each is presented in two contrast polarities.
Second, as we will see below, the characterization afforded by Eq. 1is only minimally affected by normalization mechanisms, gain con-trols, and orientation-specific interactions that are appended to cas-cade models (Albrecht and Geisler 1991; Allison et al. 2001; Bonds1989; Carandini et al. 1998; Durand et al. 2007; Freeman et al. 2002;Geisler and Albrecht 1992; Heeger 1992, 1993). This is not true forgeneral basis sets, but it is true for the TDH stimuli because of theirspecial spectral characteristics.
As previously discussed (Victor et al. 2006), Eq. 1 formalizes amodel that is related to a standard linear–nonlinear (LN) cascade. Thisformulation allows for separate linear (L) and nonlinear pathways (E)with arbitrary spatial filters, but requires a specific form (full-waverectification) for the nonlinearity. We mention that using a model-fitting procedure that relaxes the latter constraint (the maximallyinformative-dimension procedure; Sharpee et al. 2004) leads to verysimilar findings (Sharpee and Victor 2009), indicating that the as-sumption about the form of the nonlinearity is not responsible for thefindings we describe below. However, as shown in the SupplementalMaterials of Sharpee and Victor (2009), the present approach has theadvantage that it is more robust.
Because the TDH functions within each family (Cartesian andpolar) constitute an orthonormal basis, we can use a reverse-correla-tion approach (Ringach et al. 1997) to estimate the quantities L and Eof Eq. 1. The procedure is as follows: for each TDH stimulus fk(x,y)(here, k is a generic index across all basis functions within onefamily), we first determine a scalar response measure R( fk), byaveraging the spike rate in the first 250 ms following stimulus onset.[In Victor et al. (2006), we showed that other choices of the responsemeasure, such as the ON-transient, the OFF-response, the OFF-transient,or the first principal component, led to similar results and also that thetime course of the response to Cartesian and polar TDH functions wassimilar.] Next, to separate the contributions of L and E, responses toeach stimulus fk(x,y) and its contrast-inverse �fk(x,y) are combined byaddition and subtraction
Lk � R�fk � R��fk�/2
�Ek� � �R�fk � R��fk�/2 �Rm (2)
The quantities Lk and Ek represent the projections of L and E ontofk(x,y). This simple transformation from responses to filter coefficientsimplies that the model of Eq. 1, constructed from one basis set,accounts for all of the explainable variance of the responses to thatbasis set. The reason is that each pair of filter coefficients Lk and Ek
is derived from sums and differences of average responses to aseparate pair of stimuli, fk(x,y) and its contrast-inverse �fk(x,y). Thusthe average responses to each of those stimuli can be reconstructedfrom sums and differences of Lk and Ek (and the mean rate Rm). SeeVictor et al. (2006) for a discussion of this point.
The filters L and E (e.g., Fig. 2) can be reconstructed by summingthese projections
L�x,y � �k
Lkfk�x,y
E(x,y)��k
Ekfk(x,y) (3)
Note that Eq. 2 does not determine the sign of the projection Ek;either Ek � �� Ek � or Ek � �� Ek � will result in a profile that leads to thesame responses to fk and �fk. For illustration of the profile E, we choosethis sign to maximize the similarity of E to L. For quantitative analysis,we choose measures that are independent of this sign. See Victor et al.(2006) for further details. We use Lcart and Ecart to denote the profilesestimated from the responses to the Cartesian stimuli and Lpolar and Epolar
to denote the profiles estimated from the responses to the polar stimuli.We display these estimated profiles as maps. Figure 2 shows examplesfor real neurons; Fig. 6 shows examples for model neurons.
In interpreting these maps, it is important to recognize that theyrepresent projections of the receptive fields into the spaces spanned by
3417RESPONSES TO TWO-DIMENSIONAL HERMITE FUNCTIONS
J Neurophysiol • VOL 102 • DECEMBER 2009 • www.jn.org
on January 2, 2010 jn.physiology.org
Dow
nloaded from

the 36 basis functions. In a manner exactly analogous to the estimationof receptive field profiles from random checkerboard or gratingstimuli, projection of the RF onto a finite basis set is expected to differfrom the true RF, even for a strictly linear system, because the basisset is finite. For example, RFs estimated from random checkerboardshave sharp edges at the pixel boundaries and RFs estimated fromresponses to a limited number of gratings have substantial ringing(Ringach 2002). Analogously, RFs estimated from a finite TDH basisare also distorted – they tend to be somewhat larger than the true RFs,and have modest ringing (see for example the numerical simulations,Fig. 6). For these reasons, we base our conclusions not on visualinspection of the RFs, but on quantitative comparisons between theCartesian and polar RF estimates. Since the Cartesian and polar TDHfunctions span precisely the same subspace, the distorting effects ofsubspace projection cannot contribute to differences between theestimated RFs.
INDICES. The second stage of the analysis consisted of comparingRF profiles estimated from each family of stimuli (Cartesian andpolar). If a neuron’s responses were accurately described by linear–static nonlinear cascade—or, if the deviations from such a cascade donot materially affect the characterization provided by Eq. 1—then
either basis set should identify the same set of filters. That is, wewould expect Lcart � Lpolar and Ecart � Epolar.
This prediction can fail in two ways: Cartesian and polar filters maydiffer in shape or size (magnitude). To quantify these differences, wetherefore use two indices (as in Victor et al. 2006). For shape, we usean index similar to a spatial correlation function
Ishape ���Lcart�x,yLpolar�x,ydxdy
�Lcart��Lpolar�(4)
For size (i.e., the overall preference for Cartesian vs. polar stimuli),we use an index that compares response magnitudes
Ic�p ���Lcart�2 � �Ecart�2 � ��Lpolar�2 � �Epolar�2
�Lcart�2 � �Ecart �2 � �Lpolar�2 � �Epolar�2 (5)
In the preceding equations
�Lcart�2 � ���Lcart�x, y�2dxdy (6)
and similarly for Lpolar, Ecart, and Epolar.Ishape ranges between �1 and 1, where 1 indicates that Cartesian
and polar filters have the same shape, 0 indicates that they are
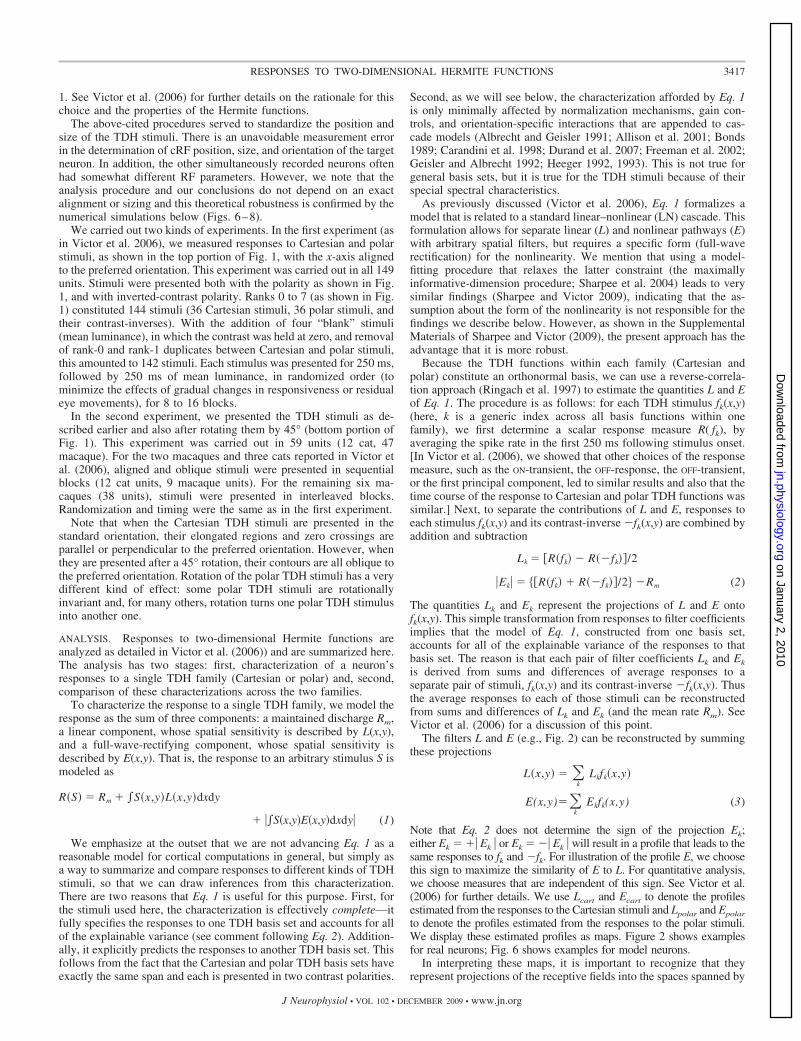
FIG. 2. Poststimulus histograms (PSTHs)and inferred sensitivity profiles for three ma-caque V1 Layer 4 neurons. Stimuli consistedof TDH functions (left, Cartesian stimuli;right, polar stimuli), each presented for 250ms and followed by 250 ms of mean illumi-nation. In each pair of histograms, the tophistogram is the response to the stimulusshown in Fig. 1 and the bottom histogram isthe response to the contrast-inverse of thatstimulus. The four pseudocolor maps (sensi-tivity profiles) represent the spatial filtersLcart, Ecart, Lpolar, and Epolar of Eq. 1. PSTHscale bar: 150 impulses/s (A), 150 impulses/s(B), and 100 impulses/s (C). Range forpseudocolor maps of sensitivity profiles:�14 impulses/s (A), �16 impulses/s (B), and�12 impulses/s (C). Maps of sensitivity pro-files span 5.4° (A), 5.4° (B), and 4.8° (C).Stimuli were each presented 16 times.
3418 VICTOR, MECHLER, OHIORHENUAN, SCHMID, AND PURPURA
J Neurophysiol • VOL 102 • DECEMBER 2009 • www.jn.org
on January 2, 2010 jn.physiology.org
Dow
nloaded from
uncorrelated, and �1 indicates that they are equal and opposite. Thesize index Ic�p is 0 if Cartesian and polar stimuli lead to responses ofthe same size, 1 for a neuron that responds only to Cartesian stimuli,and �1 for a neuron that responds only to polar stimuli. For the LNcascade neuron, Ishape � 1 and Ic�p � 0; departures from these valuesindicate departures from the cascade model predictions that Lcart �Lpolar and Ecart � Epolar.
For the second experiment (in which stimuli are presented alignedto the preferred orientation and also oblique to it), we calculate theabove-cited indices for both stimulus orientations and distinguishthem by superscripts: i.e., Ishape
aligned, Ishapeoblique, Ic�p
aligned, and Ic�poblique. We also
determine the effect of stimulus orientation (aligned Cartesian vs.oblique Cartesian) on filter shape
Ishapealigned_vs_oblique �
��Lcartaligned�x,yLcart
oblique�x,ydxdy
�Lcartaligned��Lcart
oblique�(7)
with Ishapealigned_vs_oblique � 1 if Lcart
aligned and Lcartoblique have the same shape.
(We consider only Cartesian responses for this measure, since chang-ing orientation leaves many of the polar stimuli invariant or merelypermutes them.)
Raw estimates of the indices Ishape and Ic�p were determined bysubstituting the profile estimates of Eq. 3 into the Eqs. 4 to 7. ForIshape, the null hypothesis is that there is no shape change; accord-ingly, P values are quoted with respect to deviations from 1. For Ic�p,the null hypothesis is that the sizes of the quantities compared in theirnumerators are equal; accordingly, P values are quoted with respect todeviations from 0. To compensate for the tendency of measurementerror (response variability) to move these indices away from theirnull-hypothesis values, the raw (“plugin”) estimates were debiased viathe jackknife (Efron 1982), with each replicate run considered a singleobservation. The jackknife procedure also yielded the quoted P valuesand confidence limits. The statistical calculations for Ishape werecarried out following a Fisher transformation to normalize theirdistribution (Sharpee and Victor 2009; Victor et al. 2006). Corre-lations quoted are Pearson’s r and significance values are two-tailed. All calculations were performed in Matlab (The Math-Works, Natick, MA).
We emphasize that our motivation for the use of Eq. 1—and theindices derived from it—is to draw inferences about cortical compu-tations, based on neural responses to TDH stimuli. Although we usethe model to generate null hypotheses concerning the values of theindices, we do not intend to suggest that it is a model of corticalneuronal responses: it is evidently missing important elements such asresponse normalizations (Albrecht and Geisler 1991; Geisler andAlbrecht 1992; Heeger 1992, 1993) and cross-orientation interactions(Allison et al. 2001; Bonds 1989; Carandini et al. 1998; Durand et al.2007; Freeman et al. 2002). However, as shown below, the presenceof these mechanisms does not detract from our ability to drawinferences concerning these indices, since they induce only minimaldependence of the fitted filters in Eq. 1 on the choice of basis set. Thefundamental reason for this relates to mathematical properties of theTDH functions—each contains a wide and overlapping range oforientations and spatial frequencies; thus even gain controls andinteractions tuned to particular spatial frequencies or orientations aresurprisingly insensitive to the Cartesian versus polar distinction.
Visual stimulus generation
Control signals for the cathode ray tube display were provided bya separate PC-hosted system optimized for OpenGL (NVidia Ge-Force3 chipset) programmed in Delphi. [For the two macaques andthree cats reported in Victor et al. (2006), bar and grating stimuli weregenerated by a PC-hosted VSG2/5 (8 Mb).] For presentation, TDHstimuli were discretized as limited by the display resolution. Thistypically meant �64 � 64 display pixels across the stimulus, with
each display pixel subtending about 1 min. At the edge of each patch,stimulus contrast was reduced to �1/256 of its peak value.
Intensity linearization was separately performed for each displaycontroller via Visualization Science Group (VSG, Burlington, MA)software or in-house software of comparable function.
Histology
After all recordings, lesions were made by current passage (typi-cally 3 �A � 5 s, electrode negative) at three locations along eachtetrode track, bracketing the recording sites. The animal was sacrificedand perfused with 4% paraformaldehyde solution in phosphate-buff-ered saline. Fluorescence microscopy of histologically unstained40-�m cryostatic sections was used to capture the DiI trace of thetrack. Light microscopy of the same sections after Nissl staining(Hevner and Wong-Riley 1990) was used to define laminar organiza-tion and locate the lesions.
Numerical simulations
We carried out numerical simulations to determine the effect ofgain controls and orientation-specific interactions on the characteriza-tion provided by Eqs. 2 and 3. Each simulation was carried out for 50model neurons. Model neurons (see Fig. 6) had a Gabor spatialsensitivity profile G(x,y) whose parameters (Gaussian envelope, sinu-soidal carrier) were determined by independent draws from the fol-lowing distributions: envelope center position along each axis wasdrawn from a Gaussian with SD �; envelope 1/e radius was drawnfrom a log-normal with geometric mean of � and SD covering a factorof 1.25; envelope aspect ratio was drawn from a log-normal withgeometric mean 1.5 and SD covering a factor of 1.25; envelopeorientation was drawn from a Gaussian with SD /16 (11.25°) aroundthe horizontal; carrier spatial frequency was drawn from a log-normalwith geometric mean 0.3 cycles per 1/e radius and SD covering afactor of 1.5; carrier orientation was drawn from a Gaussian with SD/16 around the envelope orientation; carrier spatial phase was drawnfrom a uniform distribution in [0, 2]. This resulted in receptive fieldsthat typically had one, two, or three lobes (rarely four), comparable towhat is seen in V1 (Ringach 2002), with an orientation and center-position scatter similar to that of the receptive fields inferred for therecorded neurons (see Fig. 6). All Gaussian envelopes integrated tounity.
To model the generation of a normalization signal, we created asimilar collection of 120 Gabor profiles Gi
aux(x,y) (i � 1, . . . , 120). Inthe basic model, the parameter distributions matched those used forthe model neuron, except that envelope orientation of neurons in theauxiliary pool was random. As described in RESULTS, we also createdpopulations in which the distribution of locations and orientation ofthe auxiliary neurons were modified, to simulate different kinds ofnormalizations and cross-orientation interactions.
To determine the response of the model neuron with receptive fieldprofile G(x,y) to a TDH stimulus S, we first convolved S with G andthen applied a nonlinearity N. This yielded a “raw” response for themodel neuron to the stimulus S, prior to any interactions between themodel neuron and the pool of auxiliary neurons
g�S � N��S�x,yG�x,ydxdy� (8)
Similarly, convolution of each auxiliary profile Giaux(x,y) with S
yielded its “raw” response
giaux�S � N��S�x,yGi
aux�x,ydxdy� (9)
N was a half-wave rectifier N(u) � max (u, 0) in most simulations; wealso used a more nearly full-wave asymmetric rectifier N(u) � [|u| �max (u, 0)]/2 and an exponential nonlinearity N(u) � eu.
3419RESPONSES TO TWO-DIMENSIONAL HERMITE FUNCTIONS
J Neurophysiol • VOL 102 • DECEMBER 2009 • www.jn.org
on January 2, 2010 jn.physiology.org
Dow
nloaded from

Next, the raw responses of a randomly chosen pool of naux auxiliaryneurons were combined to create a signal z(S) to provide normaliza-tion or cross-orientation interactions
z�S �1
naux�
i�poolNauxgi
aux�S� (10)
Following Heeger (1993), Naux was a half-squarer Naux(u) �[max (u/u0, 0)]2, but we also used full-squaring, half-wave rectifica-tion, and full-wave rectification. Here, u0 is the root-mean-squaredraw response size across all TDH stimuli; this choice means that thequantities acted on by Naux are on the order of 1. Pool sizes rangingfrom naux � 1 to naux � 120 were considered.
Finally, the modeled response R(S) to stimulus S was determiningby allowing the pooled signal z(S) to interact with the raw responseg(S) in a divisive fashion (Heeger 1993)
R�S �g�S
1 � cz�S(11)
The constant c was chosen by first identifying a value c0 for which theinteraction in Eq. 11 typically attenuated the responses by a factor of2 , and then using c � c0/2, c � c0, c � 2c0, and c � 3c0, to providea range of normalization and interaction strengths, up to a fourfoldattenuation (c � 3c0). Along with the divisive interaction specified byEq. 11, we also simulated models with a subtractive interaction
R�S � max g�S �cz�S, 0� (12)
Note that the overall architecture of the model is feedforward(Albrecht and Geisler 1991) rather than feedback (Heeger 1993) andwe do not consider response dynamics (cf. Heeger 1993). We do thissimply to focus on the effects of various spatial configurations for theinteractions, not to imply that feedback is absent. Thus in contrast tothe feedforward model of Albrecht and Geisler (1991), the auxiliarypool contains oriented units. We elaborate on these issues in theDISCUSSION.
For each instance of the model (spatial configuration of the auxiliarypool, nonlinearity shape N, pool size naux, interaction strength c, anddivisive vs. subtractive interaction), simulated responses R(S) were cal-culated for each TDH stimulus S � fk and its negative S � �fk. Fromthese responses [R( fk) and R(�fk), and with Rm � 0, corresponding to theabsence of a maintained discharge], Eqs. 2 to 5 were used to determineL- and E-filters and the various indices. Note that these simulations didnot include response variability. Thus jackknife debiasing to compensatefor response variability was applied to the neural data (and not to thesimulations) so that the comparison between simulations and neural datawould be a fair one.
R E S U L T S
We present results from a total of 149 single units in 11preparations (70 V1 units in 8 macaques, 45 V2 units in 3 ofthese animals, 34 area 17 units in 3 cats). All recordings werewithin 5° of the area centralis (cats) or fovea (macaques). Thispopulation consists of all spike-sorted units that had stablefiring rates over the experimental period and had responses toTDH stimuli that could be reliably distinguished from thebackground, and includes five units that did not respondreliably to gratings (so their tuning functions and F1/F0 ratioscould not be determined). Approximately 20% of isolatedneurons could not be driven by TDH stimuli and they areexcluded from this analysis. A portion of these results (51units: all 34 cat units and 17 of the V1 macaque units) havebeen previously reported (Sharpee et al. 2006; Victor andMechler 2006; Victor et al. 2006).
As described earlier, the overall goal of this study was toidentify and characterize nonlinear mechanisms in V1 thatqualitatively differ from the behaviors expected from a LNcascade with modulatory influences. Our strategy to do thiswas to map RFs with two stimulus sets: the Cartesian and polarTDH functions. Since these functions are matched in contrastand spatial frequency content and constitute separate basis setswith identical spans, neurons that conform to the cascademodel will yield identical RF maps. As reported previously(Sharpee et al. 2006; Victor and Mechler 2006; Victor et al.2006), this expectation does not hold: RF maps constructedfrom the two basis sets often differ dramatically in shape andsensitivity.
In experiment 1, we extend this analysis to a much largerdata set, to determine the laminar location of neurons thatmanifest these nonlinearities.
Then, we consider the effects of response normalizationsand cross-orientation interactions. Since such mechanisms canbe sensitive to power within a particular range of spatialfrequencies and orientations, they might (in principle) lead todifferent RF maps with the two stimulus sets. However, as oursimulations show, these mechanisms cannot account for thelarge changes in apparent RF maps seen in experiment 1.
Experiment 2 determines what kinds of visual feature lead tothe differences in apparent RF maps obtained from Cartesianand polar stimuli. We focus on two kinds of differencesbetween the Cartesian and polar TDH stimuli. One distinctionis that they differ as classes. That is, apparent differences in RFshape might be due to mechanisms sensitive to features genericto one class but not the other—such as curved contours, whichare present in most of the polar TDHs but none of the CartesianTDHs; or orthogonal contours, which are present in many ofthe Cartesian TDHs but none of the polar ones. Another kindof difference relates to characteristics specific to individualTDH stimuli—for example, the presence of an elongatedcontour at a specific orientation. Operationally, we can distin-guish between these possibilities by comparing responses toCartesian stimuli at two different orientations. We find that thismanipulation alters the apparent RF profile, thus implying thatthe crucial feature is the orientation of individual contours, notthe Cartesian versus polar distinction per se.
Experiment 1: prevalence and location of neurons sensitiveto phase correlations
This experiment was carried out on all 149 single units. Wefirst present example responses and then a population sum-mary.
EXAMPLE RESPONSES. Figure 2 shows example responses froma cluster of three macaque V1 neurons that were histologicallylocalized to Layer 4b/4c. Unit 5106s was a nondirectionalcomplex cell (F1/F0 � 0.16). For Cartesian stimuli (Fig. 2A,left), responses were almost entirely confined to the “Gabor-like” stimuli consisting of uninterrupted contrast bands alignedto its orientation preference (the stimuli along the right side ofthe array of Cartesian responses). In most cases, responseswere similar when contrast was inverted (top and bottomhistograms for each response block), but for some stimuli (e.g.,the last stimulus in the third row), they were strikingly differ-ent: an ON response for one polarity and an OFF response for the
3420 VICTOR, MECHLER, OHIORHENUAN, SCHMID, AND PURPURA
J Neurophysiol • VOL 102 • DECEMBER 2009 • www.jn.org
on January 2, 2010 jn.physiology.org
Dow
nloaded from
inverted polarity. Correspondingly, the RF maps inferred fromthese responses (see METHODS) consisted of Gabor-like profiles(Fig. 2A, middle, left two patches), with somewhat more powerin the rectified pathway (Ecart) than the linear pathway (Lcart).The observation that the response is primarily but not exclu-sively carried by the rectified pathway is consistent with a cellthat is mostly complex (ON– OFF), but not exclusively so (seeVictor et al. 2006 for further discussion of this). For polar TDHresponses (Fig. 2A, right), responses also showed a mixture ofsymmetrical and asymmetrical responses to stimuli and theircontrast-inverses. However, the responses to the polar stimuli,overall, were only about half as large as the responses toCartesian ones. Consequently, the sensitivity profiles Lpolar andEpolar (Fig. 2A, middle, right two patches) had a lower ampli-tude than that of Lcart and Ecart. This difference is quantified bythe index Ic�p (Eq. 5), which in this cell is 0.50 � 0.06. It issignificantly positive (P � 0.01), corresponding to the evidentoverall preference for Cartesian stimuli. However, the shapesof the inferred profiles are nearly identical: the shape indexIshape (Eq. 4) is 0.96 � 0.03. In sum, when studied with eitherfamily of TDH stimuli, this cell’s responses are well describedby a Gabor-like filter followed by partial rectification. Cru-cially, however, the responses to Cartesian stimuli are substan-tially larger than responses to polar stimuli.
The neuron in Fig. 2B, unit 5106t, recorded simultaneouslywith the neuron of Fig. 2A, had a different behavior: the shapesof the receptive field profiles inferred from the two stimulussets were nearly identical (Ishape: 0.96 � 0.02) and the overallsize of the response to Cartesian and polar stimuli were equal(Ic�p: 0.03 � 0.05). This unit shared the same orientationpreference as that of the unit of Fig. 2A, but was directionallybiased and more simple-like (F1/F0 � 1.0). In keeping with itshigher F1/F0 ratio, most of the cell’s TDH responses werestrongly dependent on stimulus contrast polarity. Also in keep-ing with simple-like behavior, the overall sizes of the L- andE-filters were similar, corresponding to half-wave rectification(see Eq. 1 and Victor et al. 2006).
The neuron in Fig. 2C, unit 5107s, was recorded 100microns further below the cortical surface. This cell wasoriented and nondirectional and had an intermediate F1/F0 ratioof 0.5. It responded to a greater number of TDH stimuli thanthe previous units and the responses were nearly identical forthe two contrast polarities. Consequently, its sensitivity profiles(Fig. 2C, middle) were dominated by the nonlinear (E) pathwayand did not resemble Gabor patches as closely as the units ofFig. 2, A and B. Moreover, the shapes of the sensitivity profilesLcart and Lpolar differed: the shape index Ishape deviated sub-stantially from unity (0.55 � 0.22, P � 0.05). Inspection ofLcart and Lpolar show that the main change in RF shape is thatthe antagonistic regions were more evident in Lpolar than that inLcart. For this neuron, the overall sensitivity to Cartesian andpolar stimuli were equal (Ic�p: 0.08 � 0.08).
In sum, we have examined the responses of three nearbyLayer 4 neurons to the matched TDH basis sets. One neuron(Fig. 2B) had responses that fully conformed to the expecta-tions of a linear–static nonlinear cascade, consisting of aGabor-like spatial filter followed by partial rectification. Theother two units did not: the unit of Fig. 2A responded prefer-entially to Cartesian stimuli (Ic�p � 0) and the unit of Fig. 2Chad a sensitivity profile whose shape changed (Ishape � 0.5),depending on whether Cartesian or polar stimuli were used to
assay it. [Additional examples of individual-unit responses,including many units outside of Layer 4, are presented in thefollowing text (Figs. 9–11) and also in Sharpee and Victor(2009) and Victor et al. (2006).]
POPULATION SUMMARY. To motivate our approach to populationanalysis, we consider the findings in Fig. 2 in more detail.Intuitively, one might expect that deviations from the predictionsof the LN cascade are not so surprising, since the cascade modelomits mechanisms such as cross-orientation suppression (Allisonet al. 2001; Bonds 1989; Carandini et al. 1998; Durand et al. 2007;Freeman et al. 2002). These and similar mechanisms might beexpected to alter the responses to one basis set or the other. Forexample, the greater sensitivity of the unit in Fig. 2A to Cartesianversus polar stimuli could arise from suppression of responses tostimuli that contain Fourier components that deviate from itspreferred orientation; only the Cartesian basis set has stimuli thatcontain just the preferred orientation—the right-hand side of theCartesian stimulus pyramid. For the polar stimuli, any stimuluswith a Fourier component at the preferred orientation also con-tains a Fourier component at a nonpreferred orientation, thussuppressing its response. The net result would be that the apparentsensitivity to Cartesian stimuli would be larger, since only theCartesian set has stimuli that contain just the preferred orientation.However, this intuition is not supported by quantitative analysis(see Figs. 6–8 in the following text). As we will see later, despitethe presence of visually apparent oriented features in some of theTDH stimuli, all TDH stimuli are, in fact, broadband in orienta-tion and spatial frequency. Because of this, mechanisms that areselective for the orientation of Fourier components are surpris-ingly unselective for one basis set versus the other.
This property of the TDH stimuli has the practical conse-quence that the two indices, Ishape, which quantifies apparentchanges in RF shape, and Ic�p, which quantifies sensitivitydifferences, remain useful for the analysis of responses toCartesian and polar TDH responses, even in the presence ofnormalizations and cross-orientation interactions. In the fol-lowing text we describe the behavior of these indices in ourdata set and then consider their behavior in a range of models.Although we present only indices based on the ON-response,the findings we describe were substantially unchanged forindices Ishape and Ic�p based on other choices of a responsemeasure, such as the size of the transient response (first 100ms), the size of the OFF-response, or the size of the firstprincipal component (as shown in Victor et al. 2006 for asubset of these data).
Change in the shape of the sensitivity profile. The index Ishape(Eq. 4) captures how the effective shape of the sensitivity profileof a single neuron depends on the basis set. To characterize thisdependence across the population, we report the fraction ofneurons that exhibited a dependence (i.e., neurons with Ishape � 1at some significance level) and the typical extent of this depen-dence, as quantified by the mean, median, and SD of Ishape acrossall neurons. Because of its relevance to circuitry, we focus on thedifference between Layer 4 neurons and neurons in other layers.
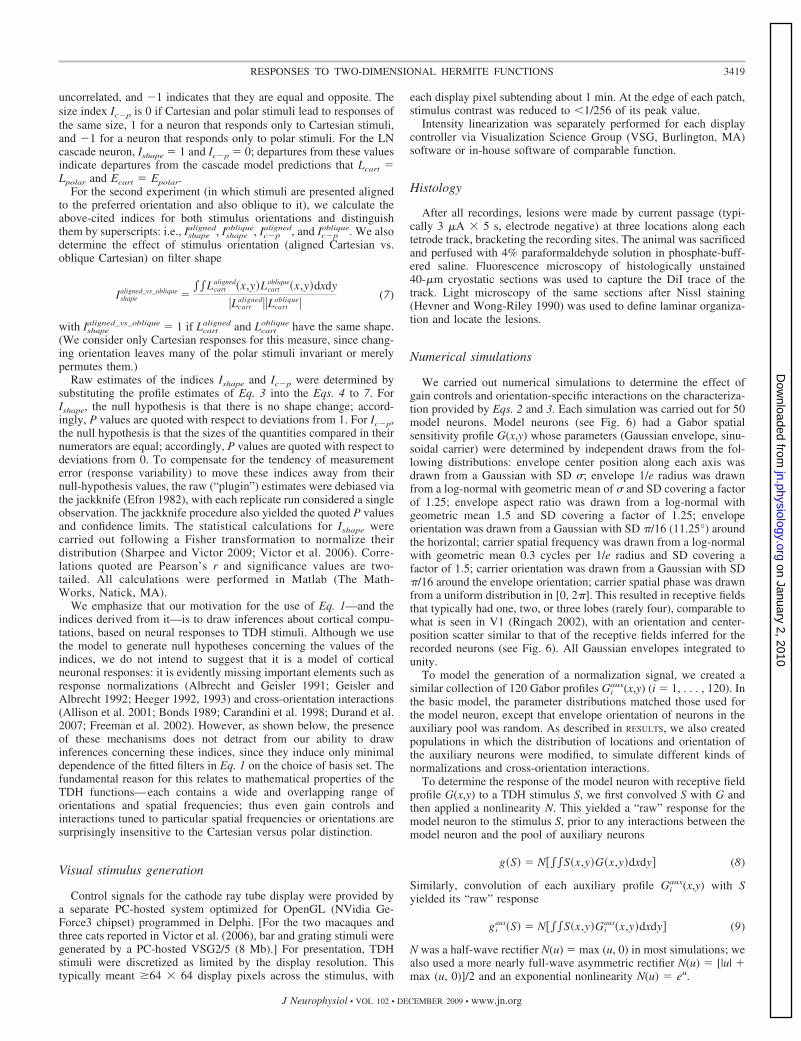
Most units (41/70) in macaque V1 (Fig. 3, left column)showed a significant shape change between Cartesian and polarbasis sets: for 11 units, Ishape � 1 at 0.01 � P � 0.05; for 30units, Ishape � 1 at P � 0.01. This behavior was present in alllayers, but it was more prevalent in the upper and lower layers(27/37 units) than in Layer 4 (14/33 units; Layer 4 vs. non-
3421RESPONSES TO TWO-DIMENSIONAL HERMITE FUNCTIONS
J Neurophysiol • VOL 102 • DECEMBER 2009 • www.jn.org
on January 2, 2010 jn.physiology.org
Dow
nloaded from
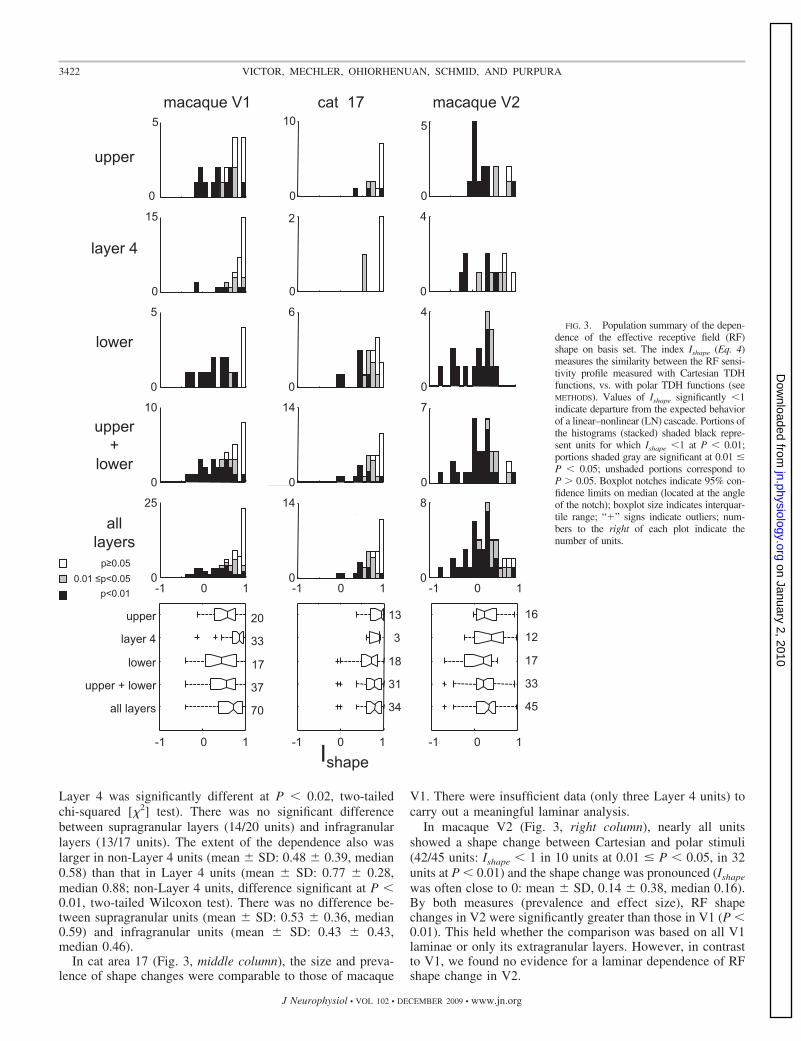
Layer 4 was significantly different at P � 0.02, two-tailedchi-squared [�2] test). There was no significant differencebetween supragranular layers (14/20 units) and infragranularlayers (13/17 units). The extent of the dependence also waslarger in non-Layer 4 units (mean � SD: 0.48 � 0.39, median0.58) than that in Layer 4 units (mean � SD: 0.77 � 0.28,median 0.88; non-Layer 4 units, difference significant at P �0.01, two-tailed Wilcoxon test). There was no difference be-tween supragranular units (mean � SD: 0.53 � 0.36, median0.59) and infragranular units (mean � SD: 0.43 � 0.43,median 0.46).
In cat area 17 (Fig. 3, middle column), the size and preva-lence of shape changes were comparable to those of macaque
V1. There were insufficient data (only three Layer 4 units) tocarry out a meaningful laminar analysis.
In macaque V2 (Fig. 3, right column), nearly all unitsshowed a shape change between Cartesian and polar stimuli(42/45 units: Ishape � 1 in 10 units at 0.01 � P � 0.05, in 32units at P � 0.01) and the shape change was pronounced (Ishape
was often close to 0: mean � SD, 0.14 � 0.38, median 0.16).By both measures (prevalence and effect size), RF shapechanges in V2 were significantly greater than those in V1 (P �0.01). This held whether the comparison was based on all V1laminae or only its extragranular layers. However, in contrastto V1, we found no evidence for a laminar dependence of RFshape change in V2.
layer 4
lower
upper
upper +
lower
all layers
70
37
17
33
20
45
33
17
12
16
34
31
18
3
13
0
25
0
8
0
14
0
10
0
7
0
14
0
5
0
5
0
10
0
15
0
4
0
2
0
5
0
4
0
6
2V euqacam1V euqacam cat 17
-1 0 1 -1 0 1 -1 0 1
all layers
upper + lower
lower
layer 4
upper
-1 0 1 -1 0 1 -1 0 1Ishape
p≥0.050.01 ≤p<0.05
p<0.01
FIG. 3. Population summary of the depen-dence of the effective receptive field (RF)shape on basis set. The index Ishape (Eq. 4)measures the similarity between the RF sensi-tivity profile measured with Cartesian TDHfunctions, vs. with polar TDH functions (seeMETHODS). Values of Ishape significantly �1indicate departure from the expected behaviorof a linear–nonlinear (LN) cascade. Portions ofthe histograms (stacked) shaded black repre-sent units for which Ishape �1 at P � 0.01;portions shaded gray are significant at 0.01 �P � 0.05; unshaded portions correspond toP � 0.05. Boxplot notches indicate 95% con-fidence limits on median (located at the angleof the notch); boxplot size indicates interquar-tile range; “�” signs indicate outliers; num-bers to the right of each plot indicate thenumber of units.
3422 VICTOR, MECHLER, OHIORHENUAN, SCHMID, AND PURPURA
J Neurophysiol • VOL 102 • DECEMBER 2009 • www.jn.org
on January 2, 2010 jn.physiology.org
Dow
nloaded from
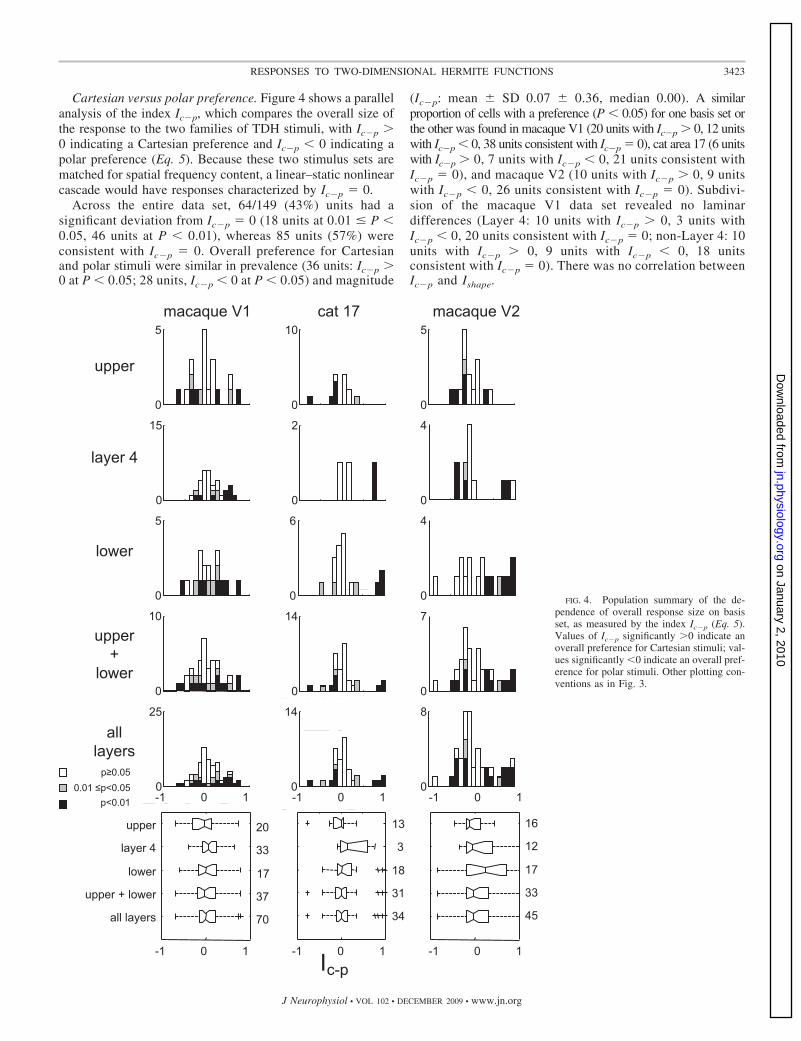
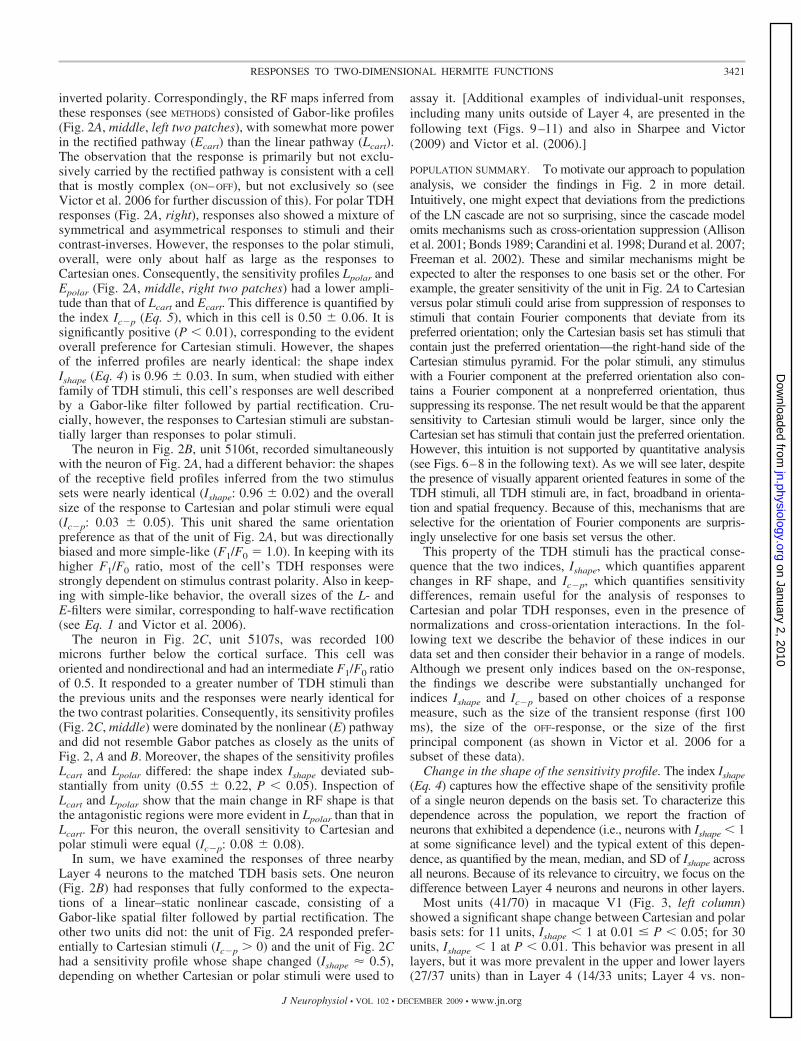
Cartesian versus polar preference. Figure 4 shows a parallelanalysis of the index Ic�p, which compares the overall size ofthe response to the two families of TDH stimuli, with Ic�p �0 indicating a Cartesian preference and Ic�p � 0 indicating apolar preference (Eq. 5). Because these two stimulus sets arematched for spatial frequency content, a linear–static nonlinearcascade would have responses characterized by Ic�p � 0.
Across the entire data set, 64/149 (43%) units had asignificant deviation from Ic�p � 0 (18 units at 0.01 � P �0.05, 46 units at P � 0.01), whereas 85 units (57%) wereconsistent with Ic�p � 0. Overall preference for Cartesianand polar stimuli were similar in prevalence (36 units: Ic�p �0 at P � 0.05; 28 units, Ic�p � 0 at P � 0.05) and magnitude
(Ic�p: mean � SD 0.07 � 0.36, median 0.00). A similarproportion of cells with a preference (P � 0.05) for one basis set orthe other was found in macaque V1 (20 units with Ic�p � 0, 12 unitswith Ic�p � 0, 38 units consistent with Ic�p � 0), cat area 17 (6 unitswith Ic�p � 0, 7 units with Ic�p � 0, 21 units consistent withIc�p � 0), and macaque V2 (10 units with Ic�p � 0, 9 unitswith Ic�p � 0, 26 units consistent with Ic�p � 0). Subdivi-sion of the macaque V1 data set revealed no laminardifferences (Layer 4: 10 units with Ic�p � 0, 3 units withIc�p � 0, 20 units consistent with Ic�p � 0; non-Layer 4: 10units with Ic�p � 0, 9 units with Ic�p � 0, 18 unitsconsistent with Ic�p � 0). There was no correlation betweenIc�p and Ishape.
0
5
4
0
0
4
0
7
0
8
0
15
0
5
0
5
0
10
0
25
0
10
0
2
0
6
0
14
0
14
layer 4
lower
upper
upper +
lower
all layers
2V euqacam1V euqacam cat 17
-1 0 1 -1 0 1 -1 0 1
70
37
17
33
20
45
33
17
12
16
34
31
18
3
13
all layers
upper + lower
lower
layer 4
upper
-1 0 1 -1 0 1 -1 0 1Ic-p
p≥0.050.01 ≤p<0.05
p<0.01
FIG. 4. Population summary of the de-pendence of overall response size on basisset, as measured by the index Ic�p (Eq. 5).Values of Ic�p significantly �0 indicate anoverall preference for Cartesian stimuli; val-ues significantly �0 indicate an overall pref-erence for polar stimuli. Other plotting con-ventions as in Fig. 3.
3423RESPONSES TO TWO-DIMENSIONAL HERMITE FUNCTIONS
J Neurophysiol • VOL 102 • DECEMBER 2009 • www.jn.org
on January 2, 2010 jn.physiology.org
Dow
nloaded from

Correlation with simple versus complex behavior. The dis-tinction between simple and complex behavior is one of thefundamental emergent properties of striate cortex. Its genesisappears closely related to the balance between thalamic andintrinsic cortical inputs, although the extent to which thisdistinction is a categorical one governed by hierarchical anat-omy (Hubel and Wiesel 1962, 1968; Skottun et al. 1991)—versus a continuum of behaviors governed by intrinsic corticalcircuitry (Chance et al. 1999; Priebe et al. 2004; Tao et al.2004)—remains the subject of debate (Abbott and Chance2002). Recognizing that there is no consensus on how thisdistinction is best quantified (Kagan et al. 2002), we use theF1/F0 ratio because it is readily quantified and captures thegeneral tendency toward linear spatial summation (F1/F0 large)and ON– OFF behavior (F1/F0 near 0).
In macaque V1, we found (Fig. 5, top left) that the simpleversus complex distinction correlated with the dependence ofsensitivity profile shape on basis set (Ishape). This correlationwas statistically significant in a categorical analysis, in whichcomplex cells are operationally defined by F1/F0 � 1 (shapechange in 35/50 complex cells and 6/15 simple cells, P � 0.05,�2), and in a continuum analysis (correlation between Ishape andF1/F0 across all cells was r � 0.34, P � 0.01, n � 65). Thiscorrelation did not account for the finding that shape changesin V1 were more prominent outside of the input layer (Fig. 3).That is, the laminar differences persisted when the analysis wasrestricted to the 50 complex cells in macaque V1 (8/19 com-plex cells in Layer 4 with Ishape � 1, 22/31 complex cells notin Layer 4, P � 0.01 by �2). For the 15 simple cells, the trendwas in the same direction (3/10 simple cells in Layer 4 withIshape � 1, 4/5 simple cells not in Layer 4, P � 0.1 by �2).
A correlation between Ishape and the simple-versus-complexdistinction was found in cat area 17 (r � 0.25, P � 0.15, n �34) and macaque V2 (r � 0.29, P � 0.07, n � 40). The sizeof the correlation was similar to that seen in macaque V1, butdid not reach statistical significance, likely because of thefewer number of units available for analysis.
In contrast to the behavior of Ishape, there was no correlationbetween the Cartesian versus polar preference (Ic�p) and the
F1/F0 ratio (Fig. 5, second row: all � r � � 0.15 and P � 0.3),or between the number of units for which Ic�p � 0, and thesimple-versus-complex categorical distinction (P � 0.3 formacaque V1, cat area 17, and macaque V2).
Numerical simulations: gain controls and orientation-specific interactions
Here we show that normalizations driven by overall contrast(Geisler and Albrecht 1992; Heeger 1992, 1993) or interactionstuned to particular orientations (Allison et al. 2001; Bonds 1989;Carandini et al. 1998; Durand et al. 2007; Freeman et al. 2002)have only a minimal impact on our analysis and are thus unlikelyto account for our findings. Our strategy is to carry out numericalsimulations on several families of models that incorporate thesemechanisms, to calculate RF maps from their responses just as forthe recorded neurons, and to compare the behavior of the resultingindices Ishape and Ic�p with the above-cited findings.
We created a basic model neuron with a Gabor-shaped sensi-tivity profile, followed by half-wave rectification (METHODS, Eq.8). We allowed the response of the model neuron to beinfluenced by a signal derived from the combined output of apopulation of similar auxiliary Gabor neurons (Eqs. 10 and 11).We then applied the same RF analysis procedures to the modelneuron’s responses to TDH functions as we applied to therecorded neurons. By varying the spatial parameters of thepopulation of neurons that contributed to the modulatory sig-nal, we determined the effect of multiple kinds of responsenormalizations and orientation-specific interactions.
The large profiles above each 2 � 2 map set in Fig. 6 are theRF sensitivity profiles G(x,y) of a sample of simulated Gaborneurons in the absence of any normalization (see METHODS fordetails). The 2 � 2 map sets below each large profile are thesensitivity profiles that are obtained by our analysis procedure,Eqs. 2 and 3, in the presence of a normalization circuit. Here, thenormalization pool consisted of Naux � 120 randomly orientedneurons and the divisive normalization constant was c0 � 36 (Eq.11). As can be seen from the figure, the inferred shapes of theCartesian and polar linear filters, Lcart and Lpolar, are very nearly
2V euqacam1V euqacam cat 17
F1/F0
Ishape 0
1
-1
Ic-p 0
1
-120 1 20 120 1
FIG. 5. Relationship of characteristics ofTDH responses to the F1/F0 ratio. First row:dependence of sensitivity profile L on basisset (Ishape, Eq. 4). Second row: Cartesian vs.polar preference (Ic�p, Eq. 5).
3424 VICTOR, MECHLER, OHIORHENUAN, SCHMID, AND PURPURA
J Neurophysiol • VOL 102 • DECEMBER 2009 • www.jn.org
on January 2, 2010 jn.physiology.org
Dow
nloaded from
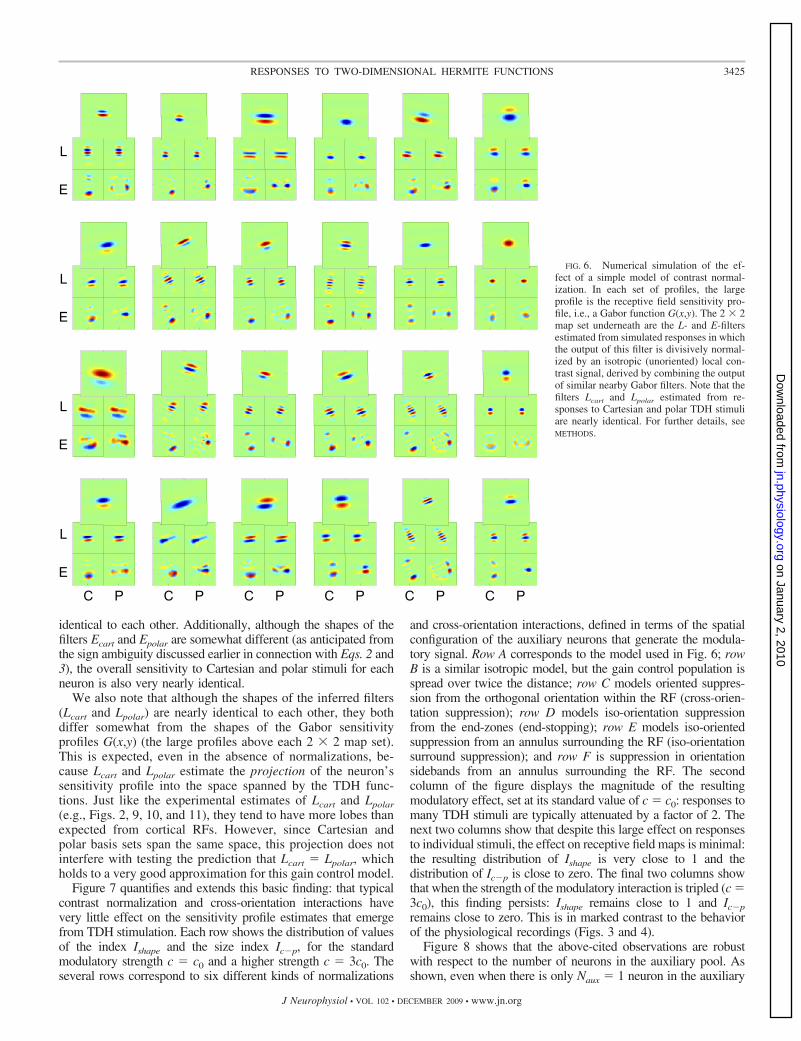
identical to each other. Additionally, although the shapes of thefilters Ecart and Epolar are somewhat different (as anticipated fromthe sign ambiguity discussed earlier in connection with Eqs. 2 and3), the overall sensitivity to Cartesian and polar stimuli for eachneuron is also very nearly identical.
We also note that although the shapes of the inferred filters(Lcart and Lpolar) are nearly identical to each other, they bothdiffer somewhat from the shapes of the Gabor sensitivityprofiles G(x,y) (the large profiles above each 2 � 2 map set).This is expected, even in the absence of normalizations, be-cause Lcart and Lpolar estimate the projection of the neuron’ssensitivity profile into the space spanned by the TDH func-tions. Just like the experimental estimates of Lcart and Lpolar(e.g., Figs. 2, 9, 10, and 11), they tend to have more lobes thanexpected from cortical RFs. However, since Cartesian andpolar basis sets span the same space, this projection does notinterfere with testing the prediction that Lcart � Lpolar, whichholds to a very good approximation for this gain control model.
Figure 7 quantifies and extends this basic finding: that typicalcontrast normalization and cross-orientation interactions havevery little effect on the sensitivity profile estimates that emergefrom TDH stimulation. Each row shows the distribution of valuesof the index Ishape and the size index Ic�p, for the standardmodulatory strength c � c0 and a higher strength c � 3c0. Theseveral rows correspond to six different kinds of normalizations
and cross-orientation interactions, defined in terms of the spatialconfiguration of the auxiliary neurons that generate the modula-tory signal. Row A corresponds to the model used in Fig. 6; rowB is a similar isotropic model, but the gain control population isspread over twice the distance; row C models oriented suppres-sion from the orthogonal orientation within the RF (cross-orien-tation suppression); row D models iso-orientation suppressionfrom the end-zones (end-stopping); row E models iso-orientedsuppression from an annulus surrounding the RF (iso-orientationsurround suppression); and row F is suppression in orientationsidebands from an annulus surrounding the RF. The secondcolumn of the figure displays the magnitude of the resultingmodulatory effect, set at its standard value of c � c0: responses tomany TDH stimuli are typically attenuated by a factor of 2. Thenext two columns show that despite this large effect on responsesto individual stimuli, the effect on receptive field maps is minimal:the resulting distribution of Ishape is very close to 1 and thedistribution of Ic�p is close to zero. The final two columns showthat when the strength of the modulatory interaction is tripled (c �3c0), this finding persists: Ishape remains close to 1 and Ic�premains close to zero. This is in marked contrast to the behaviorof the physiological recordings (Figs. 3 and 4).
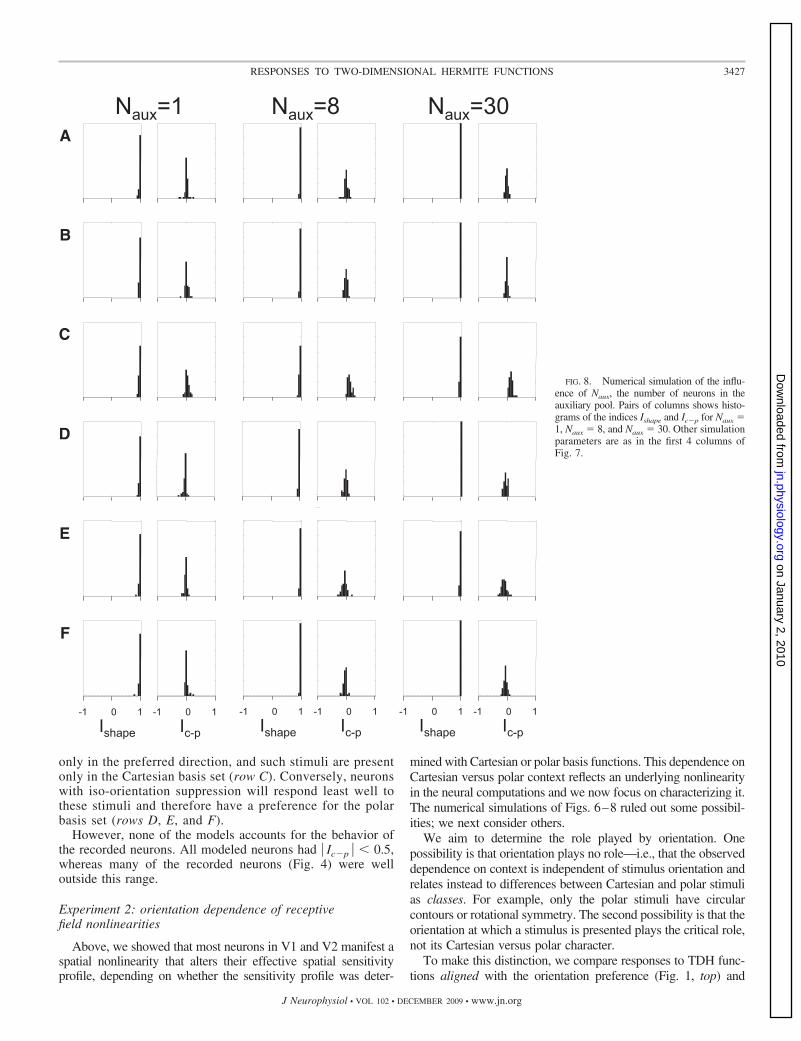
Figure 8 shows that the above-cited observations are robustwith respect to the number of neurons in the auxiliary pool. Asshown, even when there is only Naux � 1 neuron in the auxiliary
L
E
L
E
L
E
L
E
C P C P C P C P C P C P
FIG. 6. Numerical simulation of the ef-fect of a simple model of contrast normal-ization. In each set of profiles, the largeprofile is the receptive field sensitivity pro-file, i.e., a Gabor function G(x,y). The 2 � 2map set underneath are the L- and E-filtersestimated from simulated responses in whichthe output of this filter is divisively normal-ized by an isotropic (unoriented) local con-trast signal, derived by combining the outputof similar nearby Gabor filters. Note that thefilters Lcart and Lpolar estimated from re-sponses to Cartesian and polar TDH stimuliare nearly identical. For further details, seeMETHODS.
3425RESPONSES TO TWO-DIMENSIONAL HERMITE FUNCTIONS
J Neurophysiol • VOL 102 • DECEMBER 2009 • www.jn.org
on January 2, 2010 jn.physiology.org
Dow
nloaded from

pool, the basic finding of Fig. 7 persists: the effective RF shapeidentified by Cartesian or polar stimuli is virtually unchanged andthe sensitivity to Cartesian and polar stimuli is very nearly iden-tical. Even in this extreme case, the behavior of these modelneurons—Ishape is nearly always �0.9—departs substantiallyfrom what was seen in the recorded neurons (Fig. 3).
The findings summarized in Figs. 7 and 8 were also seenwith many other variations of the model (see METHODS fordetails), including 1) removal of the jitter of the distribution oforientations; 2) other kinds of nonlinearities for the individualneurons (asymmetric rectification and exponential); 3) otherkinds of nonlinearities that pooled the auxiliary neurons’ sig-nals (squaring, half-wave, and full-wave rectification; see com-ments following Eq. 10); and 4) subtractive (Eq. 12), ratherthan divisive (Eq. 11), normalization. None of these modelsaccounts for the apparent RF shape changes seen in the
recorded neurons: nearly all model neurons had Ishape � 0.9,but many of the recorded neurons had Ishape � 0.50 (Fig. 3).
Although none of the model configurations led to substantialdifferences in apparent RF shape, some led to modest differencesin sensitivity to Cartesian and polar stimulus sets (as quantified bythe size index Ic�p). For example, models that featured suppres-sion from the orientation orthogonal to the preferred orientation(Figs. 7 and 8, row C) resulted in Ic�p � 0 (greater sensitivity toCartesian stimuli), qualitatively similar to the behavior seen forthe unit of Fig. 2A. Conversely, models that featured suppressionfrom orientations similar to the preferred orientation (Figs. 7 and8, rows D, E, and F) resulted in Ic�p � 0 (greater sensitivity topolar stimuli). Qualitatively similar behavior was also seen inrecorded neurons (e.g., Fig. 11A). These behaviors make intuitivesense. A neuron with cross-orientation suppression will tend torespond optimally to stimuli that contain elongated regions
c=c0 c=3c0
Ishape Ic-p Ishape Ic-p
E
F
1
B
A
C
D
-1 0 1 -1 0 1 -1 0 1 -1 0 1g(S) 1
R(S
)R
(S)
R(S
)R
(S)
R(S
)
0
1
R(S
)
g(S)
g(S)
g(S)
g(S)
g(S)
FIG. 7. Numerical simulation of the ef-fect of several kinds of normalizations andorientation-specific interactions on RF indi-ces. Characteristics of the auxiliary neuronsthat provide the normalization or interactionsignal are as follows: A: randomly oriented,coextensive with the target neuron RF (cen-ter SD identical to RF envelope parameter�). B: randomly oriented, more widely dis-tributed than the target neuron RF (centerSD 2�). C: as in A, but orthogonal orienta-tions (SD 11.25°) to the modeled neuron.D: as in A, but same orientation as themodeled neuron and positioned, on average�� away from its center (oriented end-zoneinhibition) along the axis of RF orientation.E: as in A, but centers within a radius of �excluded, and same orientation as modeledneuron (iso-orientation suppression from thenonclassical RF). F: as in E, but orientationsdiffer from the modeled neuron by �30°(side-band suppression from the nonclassicalRF). The 1st column shows examples ofspecific neurons simulated, with the mod-eled neuron’s sensitivity profile in pseudo-color and typical auxiliary neurons dia-grammed by the 1/e level curves of theirenvelopes. (For clarity, only 8 auxiliary re-ceptive fields are diagrammed; Naux � 120were used in each simulation.) The 2nd col-umn is a scattergram of the raw responses ofthe model neurons to each TDH stimulus[g(S), Eq. 8] and its response following nor-malization [R(S), Eq. 11], for Cartesian stim-uli (filled) and polar stimuli (empty) for c �c0, indicating that the normalization had alarge effect on response size. The remaining2 pairs of columns are histograms of theindices Ishape and Ic�p, for the standard nor-malization strength c � c0 (columns 3 and 4)and c � 3c0 (columns 5 and 6). Note that thebin width used in this figure (0.05) is half ofthe bin width used in Figs. 3 and 4 becausethe distributions of the indices derived fromsimulations are tightly clustered.
3426 VICTOR, MECHLER, OHIORHENUAN, SCHMID, AND PURPURA
J Neurophysiol • VOL 102 • DECEMBER 2009 • www.jn.org
on January 2, 2010 jn.physiology.org
Dow
nloaded from
only in the preferred direction, and such stimuli are presentonly in the Cartesian basis set (row C). Conversely, neuronswith iso-orientation suppression will respond least well tothese stimuli and therefore have a preference for the polarbasis set (rows D, E, and F).
However, none of the models accounts for the behavior ofthe recorded neurons. All modeled neurons had � Ic�p � � 0.5,whereas many of the recorded neurons (Fig. 4) were welloutside this range.
Experiment 2: orientation dependence of receptivefield nonlinearities
Above, we showed that most neurons in V1 and V2 manifest aspatial nonlinearity that alters their effective spatial sensitivityprofile, depending on whether the sensitivity profile was deter-
mined with Cartesian or polar basis functions. This dependence onCartesian versus polar context reflects an underlying nonlinearityin the neural computations and we now focus on characterizing it.The numerical simulations of Figs. 6–8 ruled out some possibil-ities; we next consider others.
We aim to determine the role played by orientation. Onepossibility is that orientation plays no role—i.e., that the observeddependence on context is independent of stimulus orientation andrelates instead to differences between Cartesian and polar stimulias classes. For example, only the polar stimuli have circularcontours or rotational symmetry. The second possibility is that theorientation at which a stimulus is presented plays the critical role,not its Cartesian versus polar character.
To make this distinction, we compare responses to TDH func-tions aligned with the orientation preference (Fig. 1, top) and
Naux=1 Naux=8 Naux=30A
B
C
D
E
F
-1 0 1 -1 0 1 -1 0 1 -1 0 1-1 0 1 -1 0 1
Ishape Ic-p Ishape Ic-pIshape Ic-p
FIG. 8. Numerical simulation of the influ-ence of Naux, the number of neurons in theauxiliary pool. Pairs of columns shows histo-grams of the indices Ishape and Ic�p for Naux �1, Naux � 8, and Naux � 30. Other simulationparameters are as in the first 4 columns ofFig. 7.
3427RESPONSES TO TWO-DIMENSIONAL HERMITE FUNCTIONS
J Neurophysiol • VOL 102 • DECEMBER 2009 • www.jn.org
on January 2, 2010 jn.physiology.org
Dow
nloaded from

responses to TDH functions rotated 45° so that their contours areoblique (Fig. 1, bottom). This manipulation does not influenceattributes that are intrinsic to the Cartesian patterns, but markedlyinfluences the orientations that they contain. We find that contourorientation, not the Cartesian versus polar distinction per se, is thecrucial factor. Since we have shown earlier that orientation signalsderived from spatial frequency content (extracted via pools ofrandomly positioned Gabor functions) cannot drive the substantialdifference in the receptive fields identified by Cartesian and polarstimuli, we conclude that orientation must be extracted by aqualitatively different mechanism, such as nonlinearities that aresensitive to specific phase correlations (i.e., spatial correlations oforder three and above).
These experiments were carried out in 59 of the units studiedin experiment 1 (29 macaque V1 units, 12 cat area 17 units, 18macaque V2 units). As with experiment 1, we first presentsome example responses and then a population summary.
EXAMPLE RESPONSES. Figure 9 shows a unit recorded in Layer4b of macaque V1. In keeping with its simple-like (F1/F0 � 1.5)behavior, responses to most TDH stimuli were dependent on thestimulus polarity. For the TDH stimuli that were aligned to thepreferred orientation (Fig. 9A), responses were generally larger forthe Cartesian stimuli than those for the polar ones. The oppositewas true for TDH stimuli that were oblique to the preferredorientation (Fig. 9B): responses to polar stimuli were large; re-sponses to Cartesian stimuli were small or nonexistent. Thisobservation is borne out by the index Ic�p (Eq. 5) of Cartesianversus polar preference: for aligned stimuli, there was a significantpreference for Cartesian stimuli (Ic�p
aligned: 0.23 � 0.08, P � 0.05),whereas for oblique stimuli the preference was strongly in theopposite direction (Ic�p
oblique: �0.50 � 0.12, P � 0.01]). For thisunit, there was no significant change in RF shape; neither Ishape
aligned
nor Ishapeoblique differed significantly from 1.
The unit of Fig. 10, recorded in Layer 4 of macaque V2,showed a behavior that contrasts in several respects to the V1 unitin Fig. 10. It had complex-like behavior (F1/F0 � 0.1) and verysimilar responses to TDH functions of either polarity. It had atmost a modest preference for Cartesian TDH functions (Ic�p
aligned:0.36 � 0.80; Ic�p
oblique: �0.05 � 0.44, neither significantly differentfrom 0). However, this unit showed a substantial change in the shapeof its sensitivity profile when the oblique Cartesian set was presented(Ishape
aligned: 0.12 � 0.43; Ishapeoblique: 0.31 � 0.14, both P � 0.05).
Sensitivity profiles are shown for three more units in Fig. 11.The unit of Fig. 11A is a V1 Layer 4 simple-like (F1/F0 � 1.1) unit.This unit had a mild preference for polar stimuli under alignedconditions (Ic�p
aligned: �0.21 � 0.08, P � 0.05; Ic�poblique: �0.12 � 0.08,
P � 0.05) and no significant shape changes for either orientation.The two units of Fig. 11, B and C were recorded simultaneouslyand shared the same orientation preference, but one (55031s, Fig.11B) was simple-like (F1/F0 � 1.2) and directionally biased; theother (55031t, Fig. 11C) was complex-like (F1/F0 � 0.5) and notdirectionally biased. Their responses to TDH functions hadsimilar characteristics. For both units, responses were pri-marily polarity-independent for aligned and oblique stimuli,as seen by the larger contribution of the even-order pathway(E-filters) compared with the linear pathway (L-filters).Neither unit had a substantial preference for Cartesian orpolar stimuli in either orientation (Ic�p
aligned and Ic�poblique not
significantly different from 0). For the unit of Fig. 11B,there was a modest but statistically significant shape changefor both aligned and oblique stimuli (Ishape
aligned: 0.77 � 0.10;Ishapeoblique: 0.80 � 0.08, both P � 0.05). For the unit of Fig.
11C, a similar degree of shape change was present foraligned and oblique stimuli, but this was statistically signif-icant only for aligned stimuli (Ishape
aligned: 0.40 � 0.13, P �0.05; Ishape
oblique: 0.83 � 0.15, P � 0.05).
Cartesian polar
L
E
obliqueB
L
E
5201s
Aaligned
FIG. 9. PSTHs and inferred sensitivityprofiles for a macaque V1 Layer 4 neuron,obtained from TDH functions aligned (A)and oblique (B) to the preferred orientation.PSTH scale bar: 75 impulses/s; range forpseudocolor maps of filters: �5 impulses/s.The long arm of the superimposed “L” indi-cates the x-axis of the stimulus; the short armindicates the y-axis. Maps of sensitivity pro-files span 4.0°. Other plotting conventions asin Fig. 2.
3428 VICTOR, MECHLER, OHIORHENUAN, SCHMID, AND PURPURA
J Neurophysiol • VOL 102 • DECEMBER 2009 • www.jn.org
on January 2, 2010 jn.physiology.org
Dow
nloaded from

POPULATION SUMMARY. The several examples above illustratethe substantial diversity we observe in the characteristics of neuralresponses to TDH functions. For many neurons, the apparent RFshape depends on whether it is assayed with Cartesian or polarfunctions. For another set of neurons, partially overlapping withthe first set, there is an overall response preference for Cartesianor polar functions. These phenomena—both of which representdepartures from the expected behavior of a linear–static nonlinearfilter or an LN cascade modulated by gain controls such asdivisive normalization or cross-orientation suppression—may bepresent, independently, for TDH stimuli aligned to the preferredorientation or oblique to it.
To focus on the question of interest—whether the nonlinearitythat underlies the difference in apparent RF shape for Cartesianand polar stimuli is orientation sensitive—we make three com-
parisons of estimated RF shape: Cartesian versus polar estimatesfor aligned stimuli (Ishape
aligned), Cartesian versus polar estimatesfor oblique stimuli (Ishape
oblique), and Cartesian estimates foraligned and oblique stimuli (Ishape
aligned_vs_oblique). (We do notcompare estimates from polar stimuli for the two rotations, sincemany aligned and oblique polar stimuli are identical.)
Results are shown in Fig. 12. The difference between thesensitivity profile measured with the two orientations ofCartesian stimuli (Ishape
aligned_vs_oblique) is more marked than thedifference between Cartesian and polar stimuli (Ishape
aligned or Ishapeoblique).
This difference is highly significant in V1 and area 17 (P � 0.01)and there is a trend in the same direction in V2. Since changingorientation of the elongated contours (but retaining their “Carte-sian” character) has a greater effect than removing them alto-gether, the nonlinearity that drives the change in apparent recep-
Boblique
L
E
5435u
Aaligned L
E
Cartesian polar
FIG. 10. PSTHs and inferred sensitivityprofiles for a macaque V2 Layer 4 neuron,obtained from TDH functions aligned (A)and oblique (B) to the preferred orientation.PSTH scale bar: 50 impulses/s; range forpseudocolor maps of filters: �10 impulses/s.Maps of sensitivity profiles span 4.8°. Otherplotting conventions as in Fig. 9.
5563s
ACartesian polar
L
E
L
E
aligned
oblique
5531s
BCartesian polar
L
E
L
E
5531t
CCartesian polar
L
E
L
E
FIG. 11. Inferred sensitivity profiles for 3macaque V1 neurons (A: layer 4; B andC: Layers 2/3) in response to aligned andoblique TDH functions. Range for pseudo-color maps of filters: �10 impulses/s (A),�24 impulses/s (B), and �5 impulses/s (C).Maps of sensitivity profiles span 1.6° (A),2.4° (B), and 2.4° (C). Other plotting con-ventions as in Fig. 9.
3429RESPONSES TO TWO-DIMENSIONAL HERMITE FUNCTIONS
J Neurophysiol • VOL 102 • DECEMBER 2009 • www.jn.org
on January 2, 2010 jn.physiology.org
Dow
nloaded from

tive field shape is sensitive to the orientation of the Cartesianstimuli, rather than to the Cartesian versus polar distinction per se.
We note that the range of shape changes is similar foraligned and oblique conditions and, on a neuron-by-neuronbasis, the correlation between them is strong in macaque (V1:r � 0.79, P � 0.001, n � 29; V2: r � 0.52, P � 0.03, n � 18),with a similar trend in a smaller number of cat area 17 units(r � 0.28, P � 0.4, n � 12). Thus if a neuron has a discrepancybetween the sensitivity profiles for aligned Cartesian and polarTDH stimuli, then it will have a discrepancy of similar mag-nitude when studied with oblique stimuli, but the nature of theshape change typically differs.
We also did not find any difference between the overall sizes of theresponses to aligned and oblique Cartesian stimuli. Such a differencemight have been generated by a tuned cross-orientation suppressiondriven selectively by aligned or oblique Cartesian stimuli.
Finally, we mention that our finding (that orientation mattersmore than the Cartesian vs. polar distinction) is not in contradic-
tion to previous findings (Gallant et al. 1996; Hegde and VanEssen 2003; Mahon and De Valois 2001) concerning preferenceof visual neurons for Cartesian and polar gratings. Despite theirsuperficial resemblance, TDH stimuli differ from the Cartesianand polar gratings used in those studies in an important way—TDH stimuli are matched for various low-level characteristics, asis required for our goal of testing models; this was not the case forthe stimuli used in the earlier studies.
D I S C U S S I O N
The goal of this study was to further the understanding of thecomputations performed in primary visual cortex. To this end, weidentified qualitative behavior that major classes of models musthave in response to specific stimuli and tested whether this kind ofbehavior is present in V1 and V2 of macaque monkeys and area17 of the cat. As described in the INTRODUCTION, our approach usessingle-unit responses to stimuli based on TDH functions. Becauseof the way that the mathematical properties of TDH functionsinteract with typical building blocks of computational models, wecan bypass stages of processing sensitive to luminance and con-trast, to examine nonlinear mechanisms of spatial integrationarising in local cortical circuits.
In our initial study with TDH stimuli (Victor et al. 2006), weshowed that they elicited behavior that was qualitatively incon-sistent with simple cascade models—that is, the apparent shape ofthe linear filter in the LN cascade depended on which basis set isused for the characterization. Subsequently (Sharpee and Victor2009), we characterized this behavior as a contextual modulationand showed that the effect of this modulation was to change thestrength of inputs from oriented subunits. This raises two furtherquestions: 1) Which cells show this contextual modulation?2) What stimulus features—and therefore what kinds of mecha-nisms—drive it? Here, we address these questions.
To determine which cells show this contextual modulation,we carried out a laminar analysis of the responses. Thisanalysis showed that the contextual effect is present throughoutV1, more prominently in the supragranular layers and infra-granular layers than in Layer 4. Moreover, we found that thecontextual effect is larger in V2 than that in V1 (Figs. 3 and 4).The progression of increasing contextual effect from V1 inputlayer to V1 intrinsic circuitry to V2 suggests that it is intrinsicto the goal of processing, not a “side effect” of early visualprocessing that is to be removed at later stages.
As a first step in identifying the mechanisms that modulate RFstructure in the various TDH contexts, we considered modulatorymechanisms that have already been identified. These include gaincontrols driven by local contrast and/or spatial frequency content(Albright and Stoner 2002; Cavanaugh et al. 2002; Freeman et al.2001; Ohzawa et al. 1985; Reid et al. 1992; Sceniak et al. 1999)and modulatory mechanisms sensitive to stimulus power in par-ticular locations and/or at particular orientations (Albrecht andGeisler 1991; Allison et al. 2001; Bonds 1989; Carandini et al.1998; Durand et al. 2007; Freeman et al. 2002; Geisler andAlbrecht 1992; Heeger 1992, 1993).
To assess the possible roles of these mechanisms, we carriedout several series of simulations, summarized in Figs. 6–8. Wefound virtually no influence of modulatory mechanisms on theapparent shape of cascade-model filters when assayed withCartesian versus polar TDH functions (i.e., Ishape remains near1), and only a modest influence on the relative sensitivity to the
Ishapeoblique
Ishapealigned
Ishapealigned-vs-oblique
-1 0 1
all
macaque V2
macaque V1+ cat 17
macaque V1
cat 17
*
** **
** **
** ***59
18
41
29
12
FIG. 12. Comparison of changes in the sensitivity profile for Cartesian vs.polar stimuli of a single orientation (Ishape
aligned and Ishapeoblique, Eq. 4, horizontal and
oblique hatched symbols), and Cartesian stimuli in 2 different orientations(Ishape
aligned_vs_oblique, Eq. 7, open symbols). Within each set of boxplots, signifi-cance levels (2-tailed paired t-test) are indicated by **P � 0.01 and *0.05 �P � 0.01. Other boxplot conventions as in Fig. 3.
3430 VICTOR, MECHLER, OHIORHENUAN, SCHMID, AND PURPURA
J Neurophysiol • VOL 102 • DECEMBER 2009 • www.jn.org
on January 2, 2010 jn.physiology.org
Dow
nloaded from
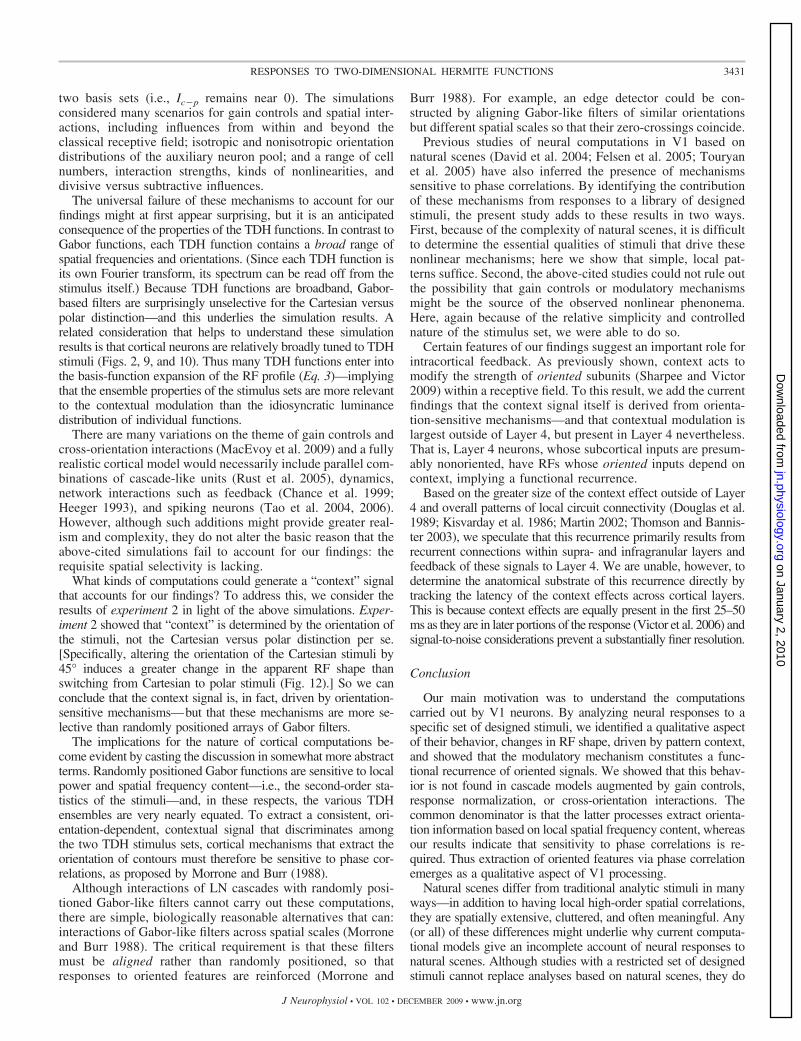
two basis sets (i.e., Ic�p remains near 0). The simulationsconsidered many scenarios for gain controls and spatial inter-actions, including influences from within and beyond theclassical receptive field; isotropic and nonisotropic orientationdistributions of the auxiliary neuron pool; and a range of cellnumbers, interaction strengths, kinds of nonlinearities, anddivisive versus subtractive influences.
The universal failure of these mechanisms to account for ourfindings might at first appear surprising, but it is an anticipatedconsequence of the properties of the TDH functions. In contrast toGabor functions, each TDH function contains a broad range ofspatial frequencies and orientations. (Since each TDH function isits own Fourier transform, its spectrum can be read off from thestimulus itself.) Because TDH functions are broadband, Gabor-based filters are surprisingly unselective for the Cartesian versuspolar distinction—and this underlies the simulation results. Arelated consideration that helps to understand these simulationresults is that cortical neurons are relatively broadly tuned to TDHstimuli (Figs. 2, 9, and 10). Thus many TDH functions enter intothe basis-function expansion of the RF profile (Eq. 3)—implyingthat the ensemble properties of the stimulus sets are more relevantto the contextual modulation than the idiosyncratic luminancedistribution of individual functions.
There are many variations on the theme of gain controls andcross-orientation interactions (MacEvoy et al. 2009) and a fullyrealistic cortical model would necessarily include parallel com-binations of cascade-like units (Rust et al. 2005), dynamics,network interactions such as feedback (Chance et al. 1999;Heeger 1993), and spiking neurons (Tao et al. 2004, 2006).However, although such additions might provide greater real-ism and complexity, they do not alter the basic reason that theabove-cited simulations fail to account for our findings: therequisite spatial selectivity is lacking.
What kinds of computations could generate a “context” signalthat accounts for our findings? To address this, we consider theresults of experiment 2 in light of the above simulations. Exper-iment 2 showed that “context” is determined by the orientation ofthe stimuli, not the Cartesian versus polar distinction per se.[Specifically, altering the orientation of the Cartesian stimuli by45° induces a greater change in the apparent RF shape thanswitching from Cartesian to polar stimuli (Fig. 12).] So we canconclude that the context signal is, in fact, driven by orientation-sensitive mechanisms—but that these mechanisms are more se-lective than randomly positioned arrays of Gabor filters.
The implications for the nature of cortical computations be-come evident by casting the discussion in somewhat more abstractterms. Randomly positioned Gabor functions are sensitive to localpower and spatial frequency content—i.e., the second-order sta-tistics of the stimuli—and, in these respects, the various TDHensembles are very nearly equated. To extract a consistent, ori-entation-dependent, contextual signal that discriminates amongthe two TDH stimulus sets, cortical mechanisms that extract theorientation of contours must therefore be sensitive to phase cor-relations, as proposed by Morrone and Burr (1988).
Although interactions of LN cascades with randomly posi-tioned Gabor-like filters cannot carry out these computations,there are simple, biologically reasonable alternatives that can:interactions of Gabor-like filters across spatial scales (Morroneand Burr 1988). The critical requirement is that these filtersmust be aligned rather than randomly positioned, so thatresponses to oriented features are reinforced (Morrone and
Burr 1988). For example, an edge detector could be con-structed by aligning Gabor-like filters of similar orientationsbut different spatial scales so that their zero-crossings coincide.
Previous studies of neural computations in V1 based onnatural scenes (David et al. 2004; Felsen et al. 2005; Touryanet al. 2005) have also inferred the presence of mechanismssensitive to phase correlations. By identifying the contributionof these mechanisms from responses to a library of designedstimuli, the present study adds to these results in two ways.First, because of the complexity of natural scenes, it is difficultto determine the essential qualities of stimuli that drive thesenonlinear mechanisms; here we show that simple, local pat-terns suffice. Second, the above-cited studies could not rule outthe possibility that gain controls or modulatory mechanismsmight be the source of the observed nonlinear phenonema.Here, again because of the relative simplicity and controllednature of the stimulus set, we were able to do so.
Certain features of our findings suggest an important role forintracortical feedback. As previously shown, context acts tomodify the strength of oriented subunits (Sharpee and Victor2009) within a receptive field. To this result, we add the currentfindings that the context signal itself is derived from orienta-tion-sensitive mechanisms—and that contextual modulation islargest outside of Layer 4, but present in Layer 4 nevertheless.That is, Layer 4 neurons, whose subcortical inputs are presum-ably nonoriented, have RFs whose oriented inputs depend oncontext, implying a functional recurrence.
Based on the greater size of the context effect outside of Layer4 and overall patterns of local circuit connectivity (Douglas et al.1989; Kisvarday et al. 1986; Martin 2002; Thomson and Bannis-ter 2003), we speculate that this recurrence primarily results fromrecurrent connections within supra- and infragranular layers andfeedback of these signals to Layer 4. We are unable, however, todetermine the anatomical substrate of this recurrence directly bytracking the latency of the context effects across cortical layers.This is because context effects are equally present in the first 25–50ms as they are in later portions of the response (Victor et al. 2006) andsignal-to-noise considerations prevent a substantially finer resolution.
Conclusion
Our main motivation was to understand the computationscarried out by V1 neurons. By analyzing neural responses to aspecific set of designed stimuli, we identified a qualitative aspectof their behavior, changes in RF shape, driven by pattern context,and showed that the modulatory mechanism constitutes a func-tional recurrence of oriented signals. We showed that this behav-ior is not found in cascade models augmented by gain controls,response normalization, or cross-orientation interactions. Thecommon denominator is that the latter processes extract orienta-tion information based on local spatial frequency content, whereasour results indicate that sensitivity to phase correlations is re-quired. Thus extraction of oriented features via phase correlationemerges as a qualitative aspect of V1 processing.
Natural scenes differ from traditional analytic stimuli in manyways—in addition to having local high-order spatial correlations,they are spatially extensive, cluttered, and often meaningful. Any(or all) of these differences might underlie why current computa-tional models give an incomplete account of neural responses tonatural scenes. Although studies with a restricted set of designedstimuli cannot replace analyses based on natural scenes, they do
3431RESPONSES TO TWO-DIMENSIONAL HERMITE FUNCTIONS
J Neurophysiol • VOL 102 • DECEMBER 2009 • www.jn.org
on January 2, 2010 jn.physiology.org
Dow
nloaded from

have an important advantage. As shown here, the use of designedstimuli allowed us to isolate one factor—local spatial correla-tions—and to show that it alone suffices to require an expansionof our notion of what individual neurons do.
A C K N O W L E D G M E N T S
Portions of this material were previously presented at the Society forNeuroscience (Victor et al. 2004; Victor and Mechler 2006).
G R A N T S
This work was supported by National Eye Institute Grant R01 EY-09314 to J.Victor.
R E F E R E N C E S
Abbott LF, Chance FS. Rethinking the taxonomy of visual neurons. NatNeurosci 5: 391–392, 2002.
Albrecht DG, Geisler WS. Motion selectivity and the contrast-responsefunction of simple cells in the visual cortex. Vis Neurosci 7: 531–546, 1991.
Albright TD, Stoner GR. Contextual influences on visual processing. AnnuRev Neurosci 25: 339–379, 2002.
Allison JD, Smith KR, Bonds AB. Temporal-frequency tuning of cross-orienta-tion suppression in the cat striate cortex. Vis Neurosci 18: 941–948, 2001.
Aronov D, Reich DS, Mechler F, Victor JD. Neural coding of spatial phasein V1 of the macaque monkey. J Neurophysiol 89: 3304–3327, 2003.
Bonds AB. Role of inhibition in the specification of orientation selectivity ofcells in the cat striate cortex. Vis Neurosci 2: 41–55, 1989.
Carandini M, Demb JB, Mante V, Tolhurst DJ, Dan Y, Olshausen BA,Gallant JL, Rust NC. Do we know what the early visual system does?J Neurosci 25: 10577–10597, 2005.
Carandini M, Movshon JA, Ferster D. Pattern adaptation and cross-orientationinteractions in the primary visual cortex. Neuropharmacology 37: 501–511, 1998.
Cavanaugh JR, Bair W, Movshon JA. Nature and interaction of signals fromthe receptive field center and surround in macaque V1 neurons. J Neuro-physiol 88: 2530–2546, 2002.
Chance FS, Nelson SB, Abbott LF. Complex cells as cortically amplifiedsimple cells. Nat Neurosci 2: 277–282, 1999.
David SV, Gallant JL. Predicting neuronal responses during natural vision.Network 16: 239–260, 2005.
David SV, Vinje WE, Gallant JL. Natural stimulus statistics alter thereceptive field structure of V1 neurons. J Neurosci 24: 6991–7006, 2004.
Douglas RJ, Martin KAC, Whitteridge D. A canonical microcircuit forneocortex. Neural Comput 1: 480–488, 1989.
Durand S, Freeman TC, Carandini M. Temporal properties of surroundsuppression in cat primary visual cortex. Vis Neurosci 24: 679–690, 2007.
Efron B. The Jackknife, the Bootstrap and Other Resampling Plans. Phila-delphia, PA: Soc. for Industrial and Applied Mathematics, 1982.
Fee MS, Mitra PP, Kleinfeld D. Automatic sorting of multiple unit neuronalsignals in the presence of anisotropic and non-Gaussian variability. J Neu-rosci Methods 69: 175–188, 1996.
Felsen G, Touryan J, Han F, Dan Y. Cortical sensitivity to visual features innatural scenes. PLoS Biol 3: e342, 2005.
Freeman RD, Ohzawa I, Walker G. Beyond the classical receptive field inthe visual cortex. Prog Brain Res 134: 157–170, 2001.
Freeman TC, Durand S, Kiper DC, Carandini M. Suppression withoutinhibition in visual cortex. Neuron 35: 759–771, 2002.
Gallant JL, Connor CE, Rakshit S, Lewis JW, Van Essen DC. Neuralresponses to polar, hyperbolic, and Cartesian gratings in area V4 of themacaque monkey. J Neurophysiol 76: 2718–2739, 1996.
Geisler WS, Albrecht DG. Cortical neurons: isolation of contrast gain control.Vision Res 32: 1409–1410, 1992.
Heeger DJ. Normalization of cell responses in cat striate cortex. Vis Neurosci9: 181–197, 1992.
Heeger DJ. Modeling simple-cell direction selectivity with normalized, half-squared, linear operators. J Neurophysiol 70: 1885–1898, 1993.
Hegde J, Van Essen DC. Strategies of shape representation in macaque visualarea V2. Vis Neurosci 20: 313–328, 2003.
Hevner RF, Wong-Riley MT. Regulation of cytochrome oxidase proteinlevels by functional activity in the macaque monkey visual system. J Neu-rosci 10: 1331–1340, 1990.
Hubel DH, Wiesel TN. Receptive fields, binocular interaction and functionalarchitecture in the cat’s visual cortex. J Physiol 160: 106–154, 1962.
Hubel DH, Wiesel TN. Receptive fields and functional architecture of monkeystriate cortex. J Physiol 195: 215–243, 1968.
Kagan I, Gur M, Snodderly DM. Spatial organization of receptive fields ofV1 neurons of alert monkeys: comparison with responses to gratings.J Neurophysiol 88: 2557–2574, 2002.
Kisvarday ZF, Martin KA, Freund TF, Magloczky Z, Whitteridge D,Somogyi P. Synaptic targets of HRP-filled layer III pyramidal cells in thecat striate cortex. Exp Brain Res 64: 541–552, 1986.
MacEvoy SP, Tucker TR, Fitzpatrick D. A precise form of divisive sup-pression supports population coding in the primary visual cortex. NatNeurosci 12: 637–645, 2009.
Mahon LE, De Valois RL. Cartesian and non-Cartesian responses in LGN,V1, and V2 cells.Vis Neurosci 18: 973–981, 2001.
Martin KA. Microcircuits in visual cortex. Curr Opin Neurobiol 12: 418–425, 2002.Mechler F, Reich DS, Victor JD. Detection and discrimination of relative
spatial phase by V1 neurons. J Neurosci 22: 6129–6157, 2002.Morrone MC, Burr DC. Feature detection in human vision: a phase-depen-
dent energy model. Proc R Soc Lond B Biol Sci 235: 221–245, 1988.Ohzawa I, Sclar G, Freeman RD. Contrast gain control in the cat’s visual
system. J Neurophysiol 54: 651–667, 1985.Olshausen B, Field D. What is the other 85% of V1 doing? In: Problems in
Systems Neuroscience, edited by Sejnowski T, van Hemmen L. Oxford, UK:Oxford Univ. Press, 2004.
Priebe NJ, Mechler F, Carandini M, Ferster D. The contribution of spikethreshold to the dichotomy of cortical simple and complex cells. NatNeurosci 7: 1113–1122, 2004.
Reich DS. Information Encoding by Individual Neurons and Groups of Neuronsin the Primary Visual Cortex (PhD thesis). New York: Rockefeller Univ., 2000.
Reid RC, Victor JD, Shapley RM. Broadband temporal stimuli decrease theintegration time of neurons in cat striate cortex. Vis Neurosci 9: 39–45, 1992.
Ringach DL. Spatial structure and symmetry of simple-cell receptive fields inmacaque primary visual cortex. J Neurophysiol 88: 455–463, 2002.
Ringach DL, Sapiro G, Shapley R. A subspace reverse-correlation techniquefor the study of visual neurons. Vision Res 37: 2455–2464, 1997.
Rust NC, Schwartz O, Movshon JA, Simoncelli EP. Spatiotemporal ele-ments of macaque V1 receptive fields. Neuron 46: 945–956, 2005.
Sahani M, Pezaris JS, Andersen RA. On the separation of signals fromneighboring cells in tetrode recordings. In: Advances in Neural InformationProcessing Systems 10, edited by Jordan MI, Kearns MJ, Solla SA. Cam-bridge, MA: MIT Press, 1998, p. 222–228.
Sceniak MP, Ringach DL, Hawken MJ, Shapley R. Contrast’s effect onspatial summation by macaque V1 neurons. Nat Neurosci 2: 733–739, 1999.
Sharpee T, Rust NC, Bialek W. Analyzing neural responses to natural signals:maximally informative dimensions. Neural Comput 16: 223–250, 2004.
Sharpee TO, Sugihara H, Kurgansky AV, Rebrik SP, Stryker MP, MillerKD. Adaptive filtering enhances information transmission in visual cortex.Nature 439: 936–942, 2006.
Sharpee TO, Victor JD. Contextual modulation of V1 receptive fieldsdepends on their spatial symmetry. J Comput Neurosci 26: 203–218, 2009.
Skottun BC, De Valois RL, Grosof DH, Movshon JA, Albrecht DG, BondsAB. Classifying simple and complex cells on the basis of response modu-lation. Vision Res 31: 1079–1086, 1991.
Tao L, Cai D, McLaughlin DW, Shelley MJ, Shapley R. Orientationselectivity in visual cortex by fluctuation-controlled criticality. Proc NatlAcad Sci USA 103: 12911–12916, 2006.
Tao L, Shelley M, McLaughlin D, Shapley R. An egalitarian network modelfor the emergence of simple and complex cells in visual cortex. Proc NatlAcad Sci USA 101: 366–371, 2004.
Thomson AM, Bannister AP. Interlaminar connections in the neocortex.Cereb Cortex 13: 5–14, 2003.
Touryan J, Felsen G, Dan Y. Spatial structure of complex cell receptive fieldsmeasured with natural images. Neuron 45: 781–791, 2005.
Victor JD, Knight BW. Simultaneously band and space limited functions intwo dimensions, and receptive fields of visual neurons. In: Springer AppliedMathematical Sciences Series, Kaplan E, Marsden J, Sreenivasan KR. NewYork: Springer, 2003, p. 375–420.
Victor JD, Mechler F. Responses of cat and monkey striate cortical neuronsto aligned and oblique two-dimensional Hermite function stimuli. SocNeurosci Abst 436.2, 2006.
Victor JD, Mechler F, Repucci MA, Purpura KP, Knight BW. Responsesof neurons in cat and monkey striate cortex to two-dimensional Hermitefunction stimuli. Soc Neurosci Abst 370.4, 2004.
Victor JD, Mechler F, Repucci MA, Purpura KP, Sharpee T. Responses of V1neurons to two-dimensional Hermite functions. J Neurophysiol 95: 379–400, 2006.
3432 VICTOR, MECHLER, OHIORHENUAN, SCHMID, AND PURPURA
J Neurophysiol • VOL 102 • DECEMBER 2009 • www.jn.org
on January 2, 2010 jn.physiology.org
Dow
nloaded from


![[3.4]_Fiber Nonlinearities](https://img.pdfslide.us/doc/110x75/55cf8e81550346703b92da6f/34fiber-nonlinearities.jpg)