Embed Size (px)
Citation preview
Jon Appelberg
Performance Testing of a NetworkManagement System in ChallengedNetworks
School of Electrical Engineering
Thesis submitted for examination for the degree of Master ofScience in Technology.
Espoo 23.1.2013
Thesis supervisor:
Prof. Raimo Kantola
Thesis instructor:
M.Sc. (Tech.) Ismo Kiiski
A’’ Aalto UniversitySchool of ElectricalEngineering

aalto-yliopistosahkotekniikan korkeakoulu
diplomityontiivistelma
Tekija: Jon Appelberg
Tyon nimi: Performance Testing of a Network Management System inChallenged Networks
Paivamaara: 23.1.2013 Kieli: Englanti Sivumaara: ix+76
Tietoliikenne- ja tietoverkkotekniikan laitos
Professuuri: Tietoverkot Koodi: S-38
Valvoja: Prof. Raimo Kantola
Ohjaaja: DI Ismo Kiiski
Testattaessa sellaisten ohjelmistojen suorituskykya, jotka viestivat tieto-verkoissa, on tarkeaa suorittaa testaus ymparistossa, jossa verkkoliikenteellaon samankaltaiset ominaisuudet kuin ohjelmiston kohdeymparistossa. Verkko-emulaatiota tarvitaan, silla testauksen suorittaminen oikeassa kohdeverkossa onharvoin mahdollista.
Taman diplomityon tavoitteena oli kehittaa usean samanaikaisen kayttajansuorituskykytestausymparisto Tellabs 8000 Intelligent Network Manager -verkkohallintajarjestelman testaukseen haasteellisessa verkossa. Tavoitteena olimyos suunnitella ja suorittaa testisuunnitelma haasteellisiin verkkoihin liittyen.Tama suunnitelma perustui asiakkaiden verkkotopologioihin seka Tellabsinsuosituksiin.
Diplomityohon liittyvat testit antoivat tietoa Tellabs 8000 Intelligent Net-work Manager -verkkohallintajarjestelman suorituskyvysta haasteellisessaverkossa. Tyossa myos kuvataan suorituskykytestauksen, verkkoemulaattorin jatestiympariston suunnitteluvaiheita.
Avainsanat: Verkonhallinta, performanssitestaus, verkkoemulaattori, testi-automaatio

aalto universityschool of electrical engineering
abstract of themaster’s thesis
Author: Jon Appelberg
Title: Performance Testing of a Network Management System in ChallengedNetworks
Date: 23.1.2013 Language: English Number of pages: ix+76
Department of Communications and Networking
Professorship: Data Networks Code: S-38
Supervisor: Prof. Raimo Kantola
Instructor: M.Sc. (Tech.) Ismo Kiiski
When testing the performance of software that relies on network communication,it is crucial to do the testing in an environment which has similar networkcharacteristics as the target environment. Often using real production networksfor testing is not a viable option and network emulation is required.
In this thesis a multiuser performance testing environment has been cre-ated for the Tellabs 8000 Intelligent Network Manager. Also a test plan wascreated and executed based on customer cases and Tellabs recommendations.
The tests related to this thesis gave insight on the performance of the Tellabs8000 Intelligent Network Manager in impaired networks and on the design. Thisthesis also describes the design process of the testing environment and the toolsrelated to the performance testing and network emulation.
Keywords: Network management, performance testing, network emulator, testautomation

iv
Preface
I would like to sincerely thank my Thesis Instructor, M.Sc Ismo Kiiski, for his
encouragement and support during the work of this thesis. I am also grateful for both
the opportunity to write this thesis and for the opportunity to work in the integration
testing team at Tellabs.
I also wish to thank my Supervisor, Prof. Raimo Kantola for his guidance and for caring
about the quality of the thesis.
Many thanks go to my colleagues at Tellabs for their much appreciated input and
suggestions related to the task of writing this thesis. Especially I would like to thank
B.Sc Taneli Riitaoja for reading my thesis and helping me with the coherence of the
text.
Finally I would like to thank M.Sc Ilmo Savolainen and Sami Pyrrö for the support and
guidance related to the testing framework which was used in the work of this thesis.
Espoo 20.5.2013
Jon Appelberg
v
Figures and Tables
Figure 1 Positive Acknowledgements .......................................................................................................... 8
Figure 2 TCP Flow control........................................................................................................................... 9
Figure 3 Typical Tellabs 8000 INM Configuration [11] ............................................................................ 14
Figure 4 Screenshot of Tellabs 8600 Node Simulator Graphical user interface......................................... 16
Figure 5 Tellabs 8000 INM workstation toolbox ....................................................................................... 20
Figure 6 The Tellabs 8630 Access Switch [11] .......................................................................................... 22
Figure 7 Screenshot of the TestMonkey software testing tool ................................................................... 26
Figure 8 The Joinker client program .......................................................................................................... 28
Figure 9 Graphical representation of the network in the virtual environment ............................................ 31
Figure 10: Visualization of the Linux traffic control subsystem for the network emulator ....................... 35
Figure 11: Measurement of bandwidth limitation using the network emulator to emulate a 2/1 Mbit DSL
impairment profile ............................................................................................................................ 38
Figure 12 Measurement of bandwidth limitation using the network emulator to emulate a 100/100 Mbit
LAN connection ............................................................................................................................... 39
Figure 13 Flowchart of the NetSloth server ............................................................................................... 42
Figure 14 Overview of the communication of the test automation components ........................................ 45
Figure 15 Topology “1-standard”, standard case with no impaired links .................................................. 47
Figure 16 Topology “2-mgmt-ws”, one management server and two standard workstations at remote site
behind a challenged link ................................................................................................................... 48
Figure 17 Topology “3-ws”, two standard workstations at remote site behind a challenged link .............. 49
Figure 18 Topology 4-satws, two satellite workstations at remote site behind a challenged link .............. 50
Figure 19 Topology 5-com-node-mgmt-ws; the communications server, one management server and two
standard workstations at remote site behind a challenged link ......................................................... 51
Figure 20 Topology 6-com-node, the communications server and node elements at remote site behind a
challenged link .................................................................................................................................. 52
Figure 21 Topology “7-node”, The node elements at remote site behind a challenged link ...................... 53
Figure 22 SoM and SoA for topology “2-mgmt-ws” ................................................................................. 59
Figure 23 Operation count for topology "2-mgmt-ws" .............................................................................. 60
Figure 24 Operation count per workstation for topology "2-mgmt-ws" .................................................... 61
Figure 25 SoM and SoA for topology "3-ws" ............................................................................................ 62
Figure 26 Operation count for topology "3-ws" ......................................................................................... 63
Figure 27 Operation count per workstation for topology "3-ws" ............................................................... 63
Figure 28 SoM and SoA for topology “4-satws” ....................................................................................... 64
Figure 29 Operation count for topology “4-satws” .................................................................................... 65
Figure 30 Operation count per workstation for topology “4-satws” .......................................................... 66
Figure 31 SoM and SoA for topology "5-com-node-mgmt-ws" ................................................................ 67
Figure 32 Operation count for topology "5-com-node-mgmt-ws" ............................................................. 67
Figure 33 Operation count per workstation for topology "5-com-node-mgmt-ws" ................................... 68

vi
Figure 34 SoM and SoA for topology "6-com-node" ................................................................................. 69
Figure 35 Operation count for topology "6-com-node" ............................................................................. 69
Figure 36 Operation count per workstation for topology "6-com-node" .................................................... 70
Table 1 Measurement of amount of data in Megabytes and packets between the Tellabs 8000 INM
management network components, using standard and satellite workstations ................................. 12
Table 2 Resource allocation for the virtual machines ................................................................................ 30
Table 3 Measured base latencies. Compared between a VMware bridge, the network emulator and a real
LAN. 64byte ICMP packets ............................................................................................................. 37
Table 4 Measured base latencies. Compared between a VMware bridge, the network emulator and a real
LAN. 25000byte ICMP packets ....................................................................................................... 37
Table 5 Multiuser test results with and without the network emulator ...................................................... 40
Table 6 Network impairment profiles ........................................................................................................ 54
Table 7 Results and analysis for the 11 test runs of the unimpaired test case for topology “1-standard” .. 58
vii
Table of Contents
1 Introduction ........................................................................................................................................ 1
2 Software testing .................................................................................................................................. 3
2.1 Performance testing .................................................................................................................... 3
2.2 Network emulation ..................................................................................................................... 4
3 Impact of network impairments .......................................................................................................... 7
3.1 Latency ....................................................................................................................................... 7
3.2 Packet loss, duplication, corruption and reordering .................................................................. 10
3.3 Congestion ................................................................................................................................ 10
3.4 Measurements and observations about the communication in the management network ......... 11
4 Tellabs 8000 Intelligent Network Manager ...................................................................................... 14
4.1 8600 Node Simulator ................................................................................................................ 15
4.2 Database server ......................................................................................................................... 17
4.3 Communication server .............................................................................................................. 17
4.4 Management server ................................................................................................................... 18
4.5 Standard workstation ................................................................................................................ 19
4.6 Satellite workstation ................................................................................................................. 21
4.7 Macro Package ......................................................................................................................... 21
4.8 Tellabs 8600 Managed edge system ......................................................................................... 22
5 Tellabs INM performance testing ..................................................................................................... 23
5.1 Multi-user tests ......................................................................................................................... 23
5.2 Test macros ............................................................................................................................... 24
5.3 TestMonkey .............................................................................................................................. 25
5.4 Virtual machines ....................................................................................................................... 26
5.5 Result database ......................................................................................................................... 27
5.6 Joinker ...................................................................................................................................... 27
6 Design of a test set to measure INM management in an impaired network ...................................... 29
6.1 Architecture of the test environment......................................................................................... 29
6.2 The simulated network ............................................................................................................. 32
6.3 Other possible implementations ................................................................................................ 32
6.4 The network emulator ............................................................................................................... 34

viii
6.5 Measurements of the network emulator .................................................................................... 36
6.5.1 Base latency of network emulator .................................................................................... 36
6.5.2 Bandwidth limitation with the network emulator............................................................. 38
6.5.3 Multiuser test results with network emulator ................................................................... 39
6.6 Automation of test cases ........................................................................................................... 40
6.6.1 NetSloth ........................................................................................................................... 41
6.6.2 AutoQueue ....................................................................................................................... 43
6.7 Planning of the test cases .......................................................................................................... 46
6.7.1 Topologies ....................................................................................................................... 46
6.7.2 Network impairment profiles ........................................................................................... 53
6.8 Final test setup .......................................................................................................................... 54
7 Result from tests ............................................................................................................................... 56
7.1 Result analysis information ...................................................................................................... 56
7.2 Topology “1-standard” ............................................................................................................. 58
7.3 Topology “2-mgmt-ws” ............................................................................................................ 59
7.4 Topology ”3-ws” ...................................................................................................................... 61
7.5 Topology “4-satws” .................................................................................................................. 64
7.6 Topology “5-com-node-mgmt-ws” ........................................................................................... 66
7.7 Topology “6-com-node” ........................................................................................................... 68
7.8 Topology “7-node” ................................................................................................................... 70
7.9 Suggestions for improvement of INM code .............................................................................. 71
8 Summary and conclusions ................................................................................................................ 73
8.1 Future research ......................................................................................................................... 73
9 References ........................................................................................................................................ 75
1
1 Introduction
Modern mobile networks are growing in terms of the amount of data, the amount of
users and the amount of network elements. This growth causes the management
networks to grow larger, more complex and also increases the number of users on the
management network. The operators do not only require high performance, robustness
and reliability from the production network, but also from the management network.
A mobile network of a large telecommunications operator often spans over a large
geographical area. Because all endpoints of the network need to be reachable by the
management network, there is some latency at some links: The speed of light cannot be
surpassed. Also other impairments such as network congestion, packet loss, packet
corruption or packet duplication might degrade the performance of the network.
The Tellabs 8000 Intelligent Network Manager is used for managing networks that
consist of different Tellabs product families, e.g. the 8600 Managed Edge System.
There are operators using the Tellabs 8000 Intelligent Network Manager who already
have over 100 simultaneous users at sites which are spread geographically over a large
area that are often behind slow and relatively unreliable links. Testing the scalability of
the network manager software and performance in different networks should be done in
house so that any issues are noticed before the software is deployed to production
networks.
The purpose of this thesis is to find out what kind of performance degradation the
network management topologies already used by customers might cause to the Tellabs
8000 management network, whether there are alternative topologies for the
management network which could be preferable to customers and whether changes
might be made to the 8000 Intelligent Network Manager to lessen the impact of
impaired management networks. The created test cases and test environment will
provide the basis for later in-house performance testing in challenged networks, so the
test setup should be reliable and maintainable. The testing environment should also be
built in a way that allows other test personnel to add test cases and change parameters of
existing test cases.
2
A lot of work has already been done regarding Tellabs 8000 INM and performance
testing; noteworthy are especially the benchmark test cases and tools created by Ilmo
Savolainen as his master’s thesis with the topic “Benchmark Testing of Network
Management System”. It is known that performance of Tellabs 8000 INM is degraded
in an impaired network, but it has not been thoroughly researched until now. The
interest in the issue has risen now that customers with high load management networks
are interested in increasing the performance in high latency networks. The benchmark
testing tools created in conjunction with Savolainens master’s thesis [1] will be used as
a foundation on which the testing framework described in this thesis will be constructed.
Also the Tellabs 8600 series node simulator created by Mikko Kyllönen as his master’s
thesis will be used to simulate a large amount of 8600 nodes in the testing environment
which is created as a part of this thesis.
The main testing environment used for testing the performance of Tellabs 8000 INM in
an impaired network is built on virtual machines on a VMware ESX. It consists of one
8600 simulator, one Tellabs 8000 communication server, two Tellabs 8000 management
servers and four Tellabs 8000 workstations. The database is a Sybase database running
on a real Windows 2003 server. For emulating the network, with impairments between
all the components of this testing environment, a Linux guest virtual machine will be
used. The Linux guest essentially works as a layer 2 switch, with added functionality
from the Netem kernel module. Netem allows adding emulation of different network
characteristics to the links between computers, in this case the filtering of Netem rules
will be done on layer 3, i.e. IPv4.
The types of impairments on the links will be bundled together as impairment profiles
according to what kind of connections customers might be using in their management
networks. An impairment profile describes the characteristics of the impairments that
are present in a network link. This is done to make the testing closer to the real world
and also to avoid testing unrealistic scenarios. The different impaired links will be used
in different places of the network according to real customer cases and also according to
configurations that Tellabs Oy might suggest to the customer. For example the
management server communicates with the database, the communications servers and
the workstations. It is important to find out which of these links is the most important in
regard to performance.
3
2 Software testing
This chapter briefly explains some theory about the purpose of performance testing and
some testing guidelines. This chapter also contains background information about
network emulators and different tools and methods which can be used for network
emulation.
2.1 Performance testing
For any application, and especially for applications with a user interface, performance is
often an important attribute. Performance of an application will often impact the
usability and the value of the product. The Performance of an application needs to be
measured based on some metric values, for example the amount of operations that can
be completed per hour or how long it takes to process a certain amount of data entries.
[2]
According to Ian Molyneaux [3] automated testing tools are a requirement for effective
performance testing, automated testing tools are especially important for multiuser
testing. Automated testing tools also ensure the repeatability of the test cases.
For a program like the Tellabs 8000 Intelligent Network Manager, which relies heavily
on a user controlling the network manager, the desire is to make the users feel the
application is responsive and reliable. Therefore, we should monitor metrics that
describe the responsiveness of the application and test operations that an operator is
likely to do on a regular basis. We also have to keep in mind that simultaneous users
will have an impact on each other’s perceived performance of the application. The
multiuser test environment created by Ilmo Savolainen for his master’s thesis
Benchmark Testing of Network Management System [1] is designed for the multiuser
performance testing of the Tellabs 8000 INM and will be used as a basis when
designing the test environment and test set related to this thesis. In addition to the
responsiveness and reliability of the program, it is important that the automated tasks in
the network and the monitoring processes also get a good service. This is why it’s also
4
useful to compare the absolute amount of work that can be completed in the
management network during the tests.
2.2 Network emulation
When testing networking hardware or software one should keep in mind that the
product will probably perform differently on different networks. If testing is being done
only on a local area network (LAN), functional problems or degraded performance
might occur on deployment if the product is to be used on a wide area network (WAN).
A local area network is likely to have more bandwidth, less latency and less packet loss.
Creating a real WAN testing environment is expensive, cumbersome and difficult in
terms of varying parameters. To emulate a different kind of network (e.g. WAN) on top
of an existing network (e.g. LAN) a network emulator can be used.
There are several commercial hardware network emulators and software based network
emulators, some only emulate one link and some can emulate networks by
differentiating traffic based on for example the source-destination pairs of Ethernet
ports or IP-addresses. Advantages with hardware network emulators are that they are
easy to set up and there should not be any software-hardware compatibility problems.
Software network emulators on the other hand may be cheaper to deploy (depending on
costs of the host computer and software licensing). To emulate a network on top of a
virtual network, software network emulation is required. [4]
A network emulator works by shaping the network traffic according to the rules defined
by the user. Available parameters differ, but the most common are bandwidth limitation,
latency, packet loss, packet duplication, packet corruption and packet loss. Often a
variance according to a set distribution is available for the parameters.
The two perhaps most popular open source network emulators used today are
Dummynet, which is available for several platforms and based on ipfw, a FreeBSD
firewall, and the Linux Traffic Control subsystem, mainly Netem1 which is a Linux
1 http://www.linuxfoundation.org/collaborate/workgroups/networking/netem
5
kernel component. For my thesis I chose to use the Linux Traffic Control subsystem
together with some additional tools.
The test cases required using a virtual network emulator, because there was a need to
simulate a network with different parameters between different nodes, and several
nodes should be able to share the same network link. As such an additional virtual
machine was needed to work as a router between the Windows hosts. I chose to use a
Linux computer because of administrative reasons (Windows would have required a
license) and in my opinion better networking abilities. I chose to use the Linux Traffic
Control subsystem because its functionality had been tested earlier in house and the fact
that it is native to the Linux kernel gave me an impression of reliability and
performance.
The Linux Traffic Control subsystem is controlled by the tc terminal commands. There
are some open source projects which provide a frontend to the Linux Traffic Control
subsystem, but I decided to create my own instead of trying to customize an existing
one. I wrote a set of tools, dubbed NetSloth, using the ruby programming language and
bash scripts, which allow the parameters of the network emulator to be configured
remotely from the Windows machines using a ruby program, which communicates with
the NetSloth server through TCP. The NetSloth tool chain also logs the states of the
network emulator in tests and collects monitoring data, so the results can be verified
later. The main reason of creating the tool chain was to lessen the chance of human
error while testing. It also allows a new tester to use the environment without any need
to learn the syntax of the tc command.
It is expected for a network emulator to have some additional, unwanted impact on the
traffic of the network. Therefore, testing that the ambient impact of the network
emulator is within acceptable limits is important. The impact of the network emulator is
likely to vary depending on the amount of traffic in the emulated network. One expected
issue is the base latency; there is always some latency introduced from receiving,
processing and sending a packet. This cannot be avoided, but should be accounted for
when looking at the results. Another issue is bandwidth: the network emulator might not
be able to process the traffic fast enough or if the traffic from several links is aggregated
to one network interface then congestion might occur.
6
To test the impact and limits of the network emulator, I used three methods. The
purpose of these assurance tests was to find the limits of the network emulator and
ensure that the planned test cases could give reliable results when run using this
network emulator. The actual results of these assurance tests are presented in section 6.5.
The first assurance test was sending ICMP ping messages through the network emulator.
This was done both during a multiuser performance test run and with the windows
virtual machines idle. For added accuracy, two Linux virtual machines were added to
the network and pinging was done between them. The Linux virtual machines were
bridged each to their own Windows guest machines link: one to the first management
server and the other to the first workstation. The results where compared against a
similar setup where the Linux virtual machines were bridged together directly,
bypassing the network emulator.
The second assurance test was done by using a traffic generator, jperf2 to measure at
which rate data could be sent through the network emulator. This was tested with and
without bandwidth limitations. Windows guests were used for this test.
The third method used was running the actual multiuser test case and studying the
impact of the network emulator without any defined impairments, against the
comparison case, in which no network emulator was used.
2 http://sourceforge.net/projects/jperf/
7
3 Impact of network impairments
In this chapter the theory behind the impact of network impairments is presented.
Because all communication in the Tellabs 8000 INM management network is done
using IP and the recommendation is to use only the TCP protocol, the theory is based on
the impact of the impairments on TCP/IP communication.
3.1 Latency
There are two factors that contribute to the latency in network messaging. Firstly the
time it takes for the signal to pass through the physical medium (e.g. light in an optical
fiber or electric signal in a copper twisted pair cable). The second factor is the
processing and queuing done at the endpoints. In Internet Protocol (IP) based
communication, the messages are sent as blocks of data. The entire block will usually
be read before it is processed, which causes an additional latency which is dependent on
the transmission rate and the size of the block of data.
Separate measurement of the latency caused by signal propagation in a physical
medium and the processing latency is not practical in a real network, especially not
when there is traffic in the network. Measuring the one-way latency of the network is
also cumbersome because it would require very exact synchronizing of the clocks on the
endpoints of the networks. Therefor I will use the widely accepted metric of Round-
Trip-Time (RTT), which is also known as Round-Trip-Delay. Most modern Linux and
Windows operating systems come with a program for measuring the RTT, in both
Linux and Windows this program is called ping. Ping works by sending an Internet
Control Message Protocol (ICMP) [5] Echo message from one network endpoint to the
other, upon receiving the ICMP Echo message, the other network endpoint will reply
with an ICMP Reply message. The computer which sent the ICMP Echo message can
then calculate the RTT by measuring the time it takes from when the ICMP Echo
message was sent until the ICMP Reply message was received.
8
For Tellabs 8000 INM, TCP is used for communication between the communication
servers, management servers, workstations and the database. Communication between
the communication server and network elements can be done also using the UDP
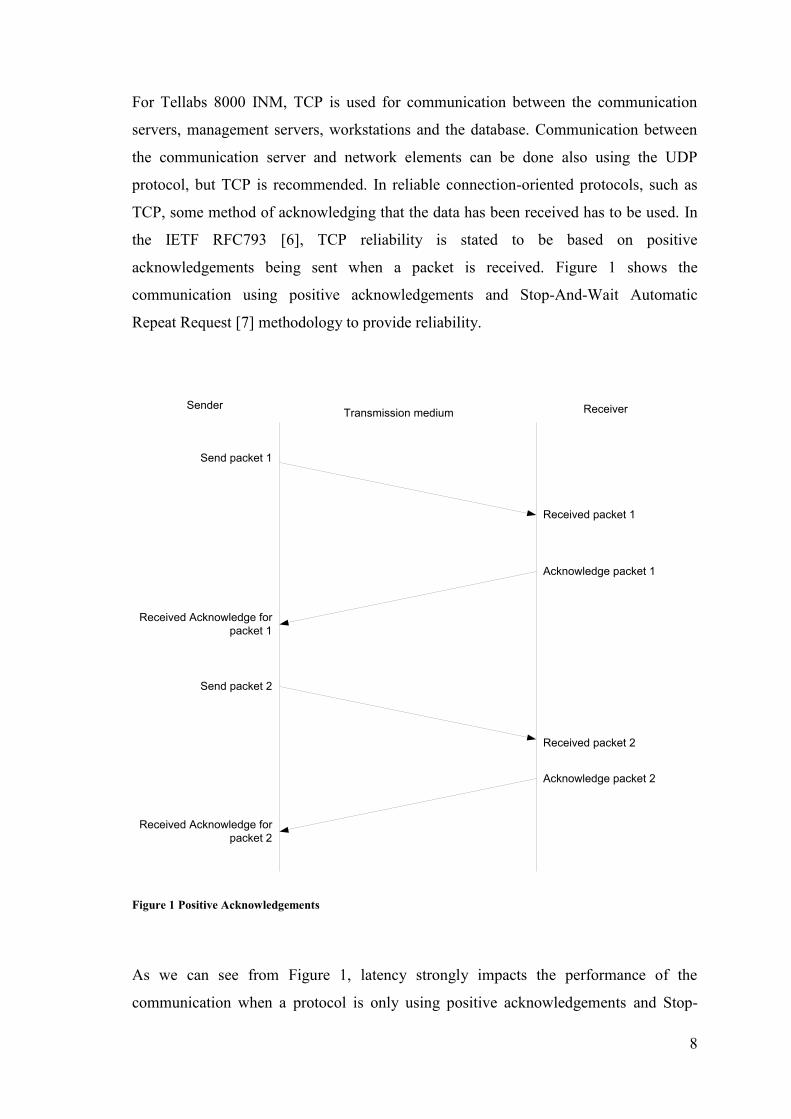
protocol, but TCP is recommended. In reliable connection-oriented protocols, such as
TCP, some method of acknowledging that the data has been received has to be used. In
the IETF RFC793 [6], TCP reliability is stated to be based on positive
acknowledgements being sent when a packet is received. Figure 1 shows the
communication using positive acknowledgements and Stop-And-Wait Automatic
Repeat Request [7] methodology to provide reliability.
Sender Receiver
Send packet 1
Received packet 1
Acknowledge packet 1
Received Acknowledge for packet 1
Send packet 2
Received packet 2
Acknowledge packet 2
Received Acknowledge for packet 2
Transmission medium
Figure 1 Positive Acknowledgements
As we can see from Figure 1, latency strongly impacts the performance of the
communication when a protocol is only using positive acknowledgements and Stop-
9
And-Wait methodology. The time the sender spends waiting for acknowledgements for
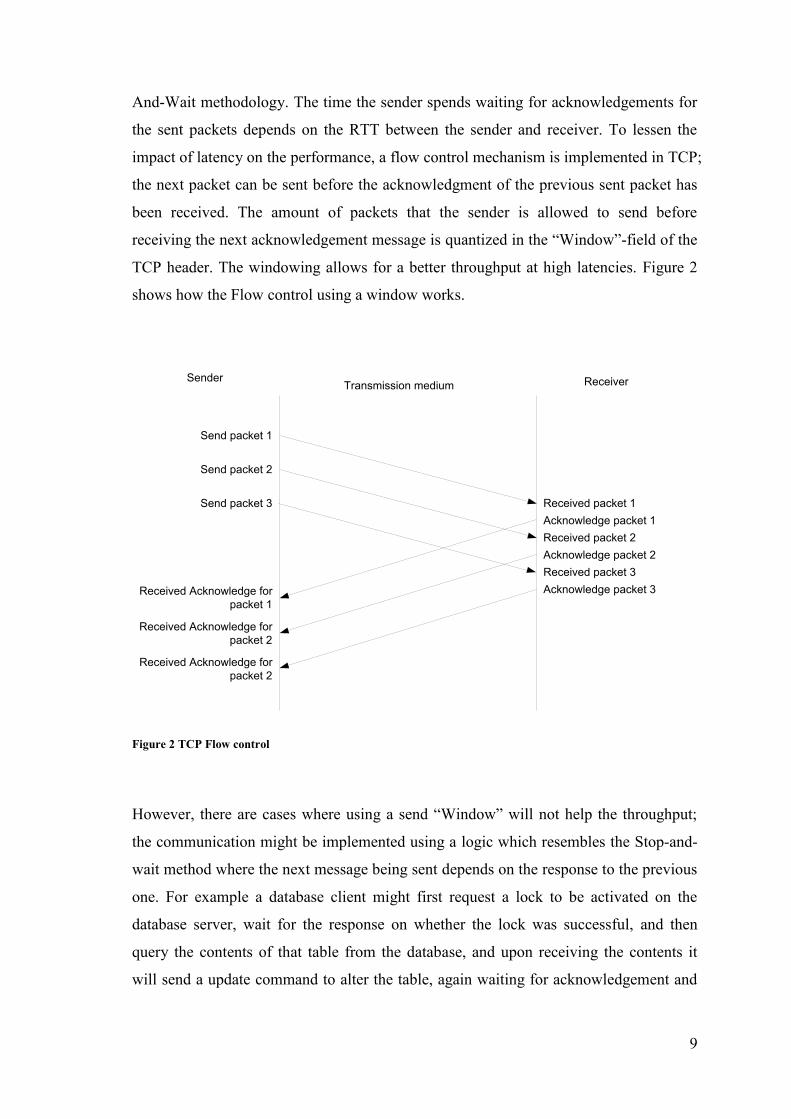
the sent packets depends on the RTT between the sender and receiver. To lessen the
impact of latency on the performance, a flow control mechanism is implemented in TCP;
the next packet can be sent before the acknowledgment of the previous sent packet has
been received. The amount of packets that the sender is allowed to send before
receiving the next acknowledgement message is quantized in the “Window”-field of the
TCP header. The windowing allows for a better throughput at high latencies. Figure 2
shows how the Flow control using a window works.
Sender Receiver
Send packet 1
Received packet 1Acknowledge packet 1
Received Acknowledge for packet 1
Send packet 3
Received packet 2Acknowledge packet 2
Received Acknowledge for packet 2
Transmission medium
Send packet 2
Received packet 3Acknowledge packet 3
Received Acknowledge for packet 2
Figure 2 TCP Flow control
However, there are cases where using a send “Window” will not help the throughput;
the communication might be implemented using a logic which resembles the Stop-and-
wait method where the next message being sent depends on the response to the previous
one. For example a database client might first request a lock to be activated on the
database server, wait for the response on whether the lock was successful, and then
query the contents of that table from the database, and upon receiving the contents it
will send a update command to alter the table, again waiting for acknowledgement and
10
then unlock the database. This kind of communication cannot always be avoided, and
might cause performance issues in a network with high latency. [8]
3.2 Packet loss, duplication, corruption and reordering
Packet loss might occur because of several reasons on a network link, the packet might
be dropped because of congestion, or because of a failed checksum check. The packet
might be lost if the physical signal does not make it through the physical medium.
Packet loss needs to be dealt with in reliable communication protocols, and TCP has
mechanisms for this. Because TCP is recommended for all the communication in the
Tellabs 8000 INM management network, we can make the assumption that packet
corruption and packet loss will all have the same effect on communication in the
Tellabs 8000 INM management network; after a time out interval, the packet will be
resent. For this reason, when modeling impairments on the emulated links in the Tellabs
8000 INM management network, we can use packet loss to emulate the effects of both
packet loss and packet corruption. Additionally, because the TCP protocol is designed
to handle packet duplication and reordering of packets, the effect of these phenomena
should be equal to or smaller than that of packet loss.
Because the TCP protocol deals with packet loss by resending the packet, the only
impact of loss of packets should be the latency caused by first waiting for the timeout to
occur, and then resending the packet. Sudden spikes in latency between packets like this
might however cause performance or even functional issues in the Tellabs 8000 INM
management network components, which is why emulating packet loss might be
beneficial when emulating a realistic network scenario.
3.3 Congestion
Congestion in a network is a situation when packets enter the network at a rate which is
larger than what the rate at which the network can process them. Congestion can also
occur at a single point, e.g. a network interface on an endpoint which cannot process all
11
the packets at the rate which they could be sent or received. [8] Often networking
interfaces utilize buffers, which allow the endpoint to queue the ingoing and outgoing
packets waiting to be processed. The buffers allow the endpoints to tolerate bursts of
networking traffic without the need to drop any packets, but this might add some
latency as packets are waiting in the queue to be processed. [9]
If the bursts are too long, or the desired amount of traffic is constantly higher than the
rate at which the network can process the packets, the congestion control mechanisms
of TCP will take action. The congestion control mechanisms will slow down the rate at
which new packets are sent on an interface, the detection of congestion is based on
measurements of lost packets and changes in the RTT of the packets. Congestion will
cause packet loss, latency and limit the throughput in the network. [10]
3.4 Measurements and observations about the communication in the
management network
To measure the communication in the management network, it was set up in the test
environment so that all traffic passed through the network emulator. No network
impairments where active on the network emulator when measuring the traffic between
the Tellabs 8000 Network management components. The traffic amount in bytes and in
the number of packets between each host was measured using the program ipaudit3
which was installed on the virtual Linux computer which worked as the network
emulator during the tests related to this thesis. The measurements were collected during
a 1 hour multiuser test. In Table 1 I have collected the results from the measurements of
traffic between the hosts in the testing environment used for the tests in this thesis. For
this test I used the standard installations for two of the workstations and the satellite
installations for the remaining two workstations. The first management server is running
without a satellite service and the second one has the satellite service running. I omitted
the measured values for traffic related to the test framework, DNS servers and other
traffic which was not directly relevant to the Tellabs 8000 INM management network.
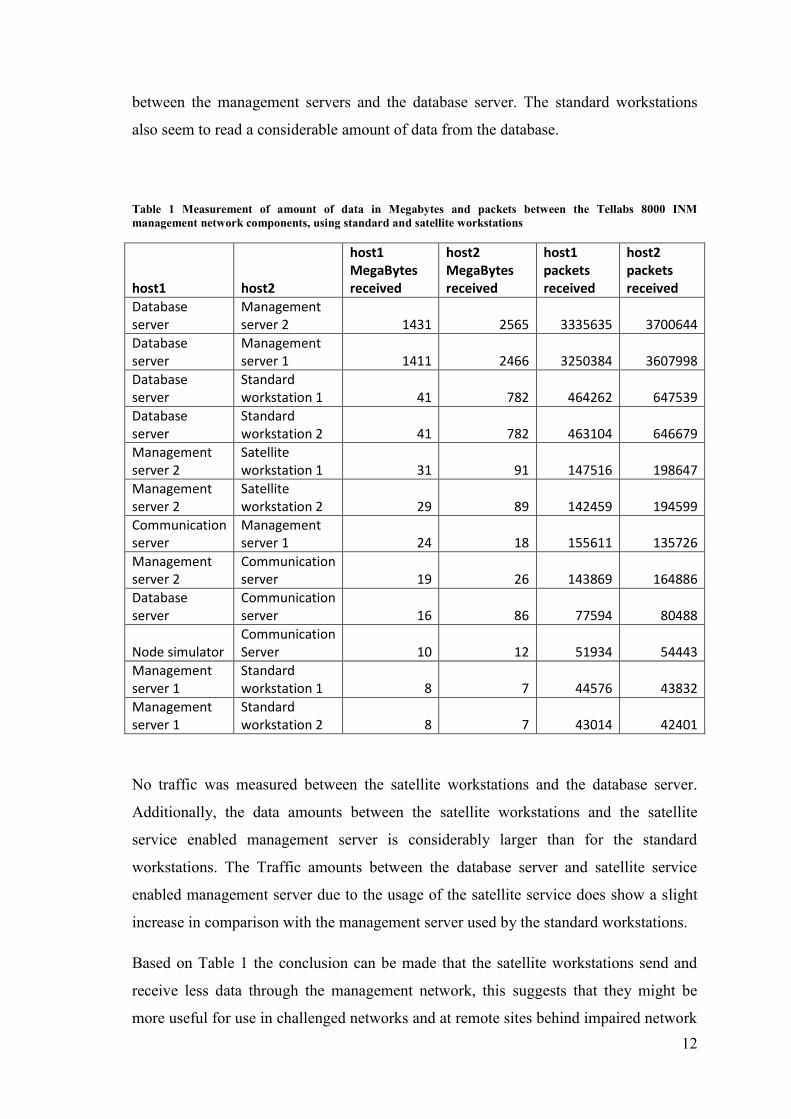
Based on the measurements we can see that the most trafficked links are the ones
3 http://ipaudit.sourceforge.net/documentation/manpages/ipaudit.html
12
between the management servers and the database server. The standard workstations
also seem to read a considerable amount of data from the database.
Table 1 Measurement of amount of data in Megabytes and packets between the Tellabs 8000 INM management network components, using standard and satellite workstations
host1 host2
host1 MegaBytes received
host2 MegaBytes received
host1 packets received
host2 packets received
Database server
Management server 2 1431 2565 3335635 3700644
Database server
Management server 1 1411 2466 3250384 3607998
Database server
Standard workstation 1 41 782 464262 647539
Database server
Standard workstation 2 41 782 463104 646679
Management server 2
Satellite workstation 1 31 91 147516 198647
Management server 2
Satellite workstation 2 29 89 142459 194599
Communication server
Management server 1 24 18 155611 135726
Management server 2
Communication server 19 26 143869 164886
Database server
Communication server 16 86 77594 80488
Node simulator Communication Server 10 12 51934 54443
Management server 1
Standard workstation 1 8 7 44576 43832
Management server 1
Standard workstation 2 8 7 43014 42401
No traffic was measured between the satellite workstations and the database server.
Additionally, the data amounts between the satellite workstations and the satellite
service enabled management server is considerably larger than for the standard
workstations. The Traffic amounts between the database server and satellite service
enabled management server due to the usage of the satellite service does show a slight
increase in comparison with the management server used by the standard workstations.
Based on Table 1 the conclusion can be made that the satellite workstations send and
receive less data through the management network, this suggests that they might be
more useful for use in challenged networks and at remote sites behind impaired network

13
links than the standard workstations. This observation concurs with the
recommendations made by the Tellabs 8000 INM documentation.
14
4 Tellabs 8000 Intelligent Network Manager
In this chapter the Tellabs 8000 Intelligent Network Manager and the components of the
management network are presented. For the tests in this thesis the release SR4.0 of
Tellabs 8000 INM was used, the SR4.0 release is not meant for general availability (GA)
and should be considered less stable than the GA releases. The SR4.0 release was
selected because it was the newest release at the time when testing was started, thus
ensuring that the results from performance tests are relevant to the current versions of
Tellabs 8000 INM.
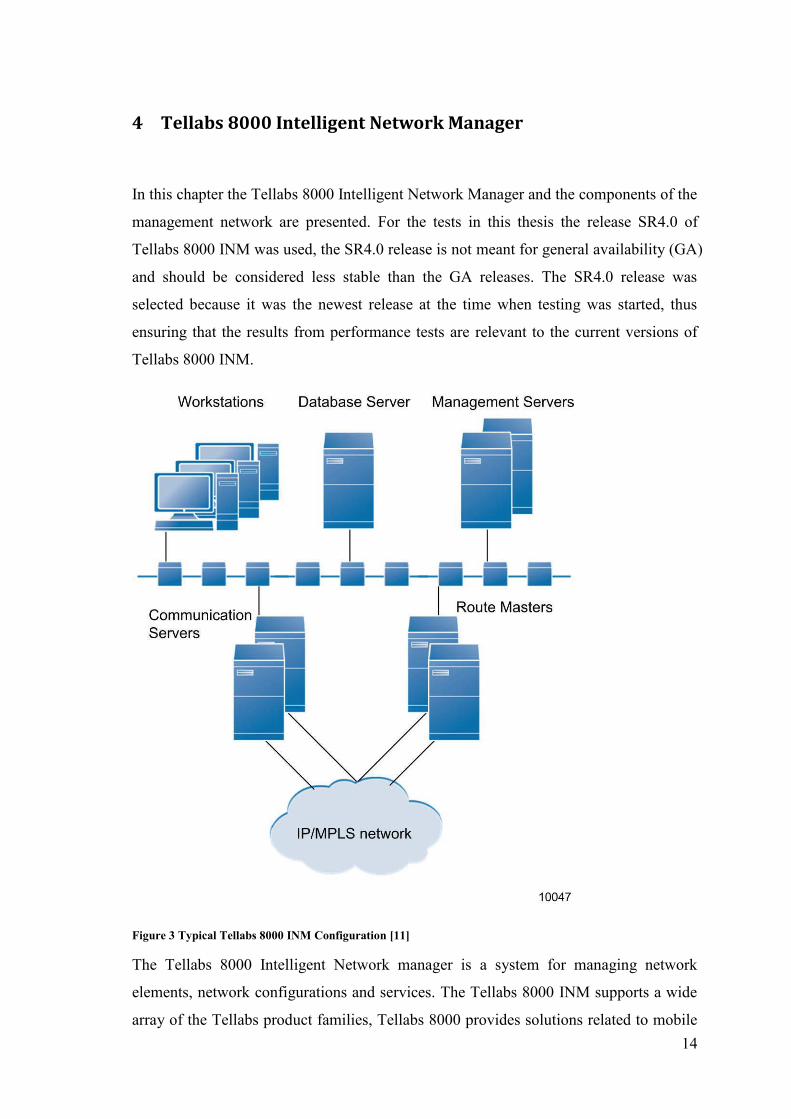
Figure 3 Typical Tellabs 8000 INM Configuration [11]
The Tellabs 8000 Intelligent Network manager is a system for managing network
elements, network configurations and services. The Tellabs 8000 INM supports a wide
array of the Tellabs product families, Tellabs 8000 provides solutions related to mobile

15
backhaul, optical networking and business services. For the scope of this thesis, the
8600 Managed Edge System is the product family which has the main focus out of the
supported product families. A typical Tellabs 8000 INM configuration is seen in Figure
3. Note that the Route Master will not be used in the management network of these tests
and is not within the scope of this thesis.
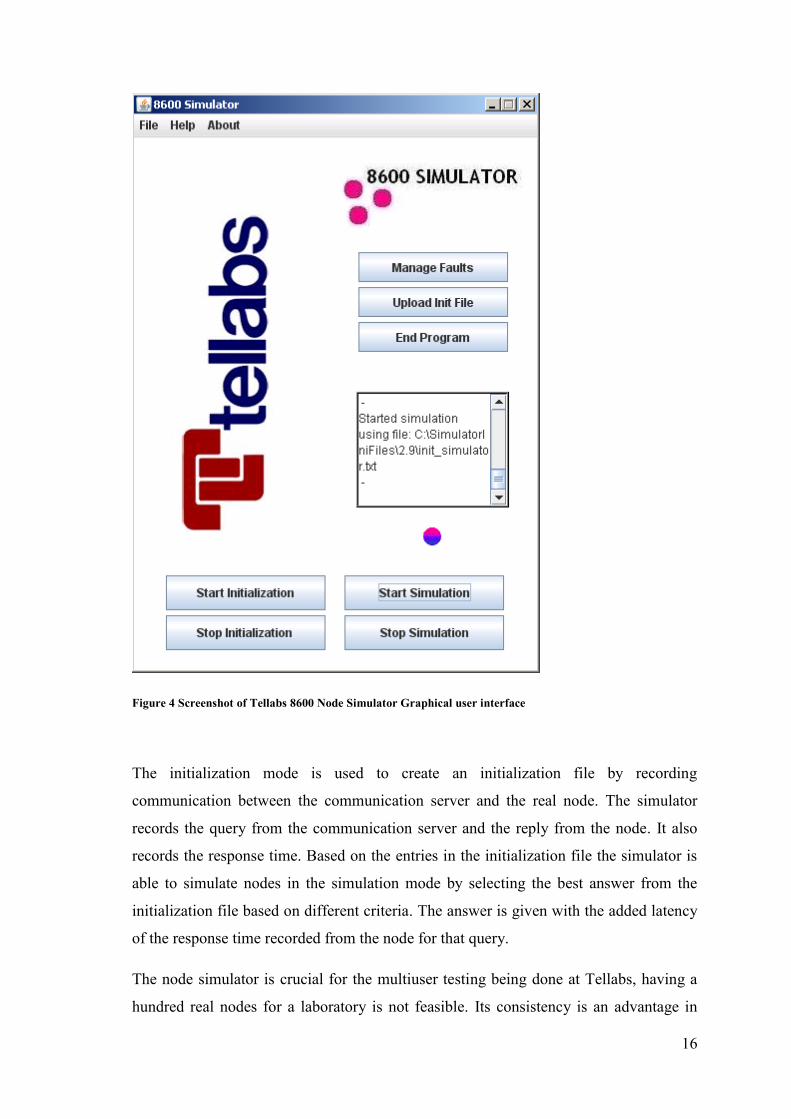
4.1 8600 Node Simulator
The 8600 Node Simulator is not an official part of the Tellabs 8000 Intelligent Network
Manager. It was initially implemented by Mikko Kyllönen in conjunction with his
master’s thesis Designing and Implementing a Router Node Simulator [12]. The
simulator is primarily targeted for automated testing and can simulate thousands of
nodes simultaneously. The simulator, unlike a real Tellabs 8600 network element, is
stateless and mimics the behavior of real nodes based on an initialization file. There are
two modes on the simulator, initialization mode and simulation mode. Figure 4 shows a
screenshot of the graphical user interface of the Tellabs 8600 Node Simulator.
16
Figure 4 Screenshot of Tellabs 8600 Node Simulator Graphical user interface
The initialization mode is used to create an initialization file by recording
communication between the communication server and the real node. The simulator
records the query from the communication server and the reply from the node. It also
records the response time. Based on the entries in the initialization file the simulator is
able to simulate nodes in the simulation mode by selecting the best answer from the
initialization file based on different criteria. The answer is given with the added latency
of the response time recorded from the node for that query.
The node simulator is crucial for the multiuser testing being done at Tellabs, having a
hundred real nodes for a laboratory is not feasible. Its consistency is an advantage in
17
performance testing as it always responds at a response time based on the recorded
value from the real node. Because of the stateless design of the simulator, it does not
need to be reset between tests, unlike real nodes which might be left in an incompatible
state if the test is aborted. [12]
4.2 Database server
A database server is used in the Tellabs 8000 Intelligent Network Manager to store all
the information about inventory and configuration of network elements, which are
managed in the Tellabs 8000 Intelligent Network Manager network. It also stores
performance data and fault information from the network elements. The Tellabs 8000
Intelligent Network Manager has support for Oracle and Sybase database servers. It is
possible to use separate database servers for performance data and configuration data,
but because only one database server can be used for configuration data, it is a likely
bottleneck for performance if it is not fast enough.
Because consistency of the database is an important design factor in the Tellabs 8000
Intelligent Network Manager, many of the operations done in the network will lock
rows in the database until the operation is completed. This might have a strong impact
on performance if a slow database client, e.g. a management server behind a high
latency link blocks the other management servers by keeping a part of the database
locked for a long time. [11]
4.3 Communication server
The communication server communicates with the network elements in the
management network, for example the Tellabs 8600 Managed edge family of nodes.
The node management communication for the 8600 family is based on the Broadband
Management Protocol (BMP) on top of TCP or UDP. TCP communication is preferred,
but the 8600 Node simulator only has support for UDP. The Simple Network
18
Management Protocol (SNMP) can be used for communication with other types of
network elements but this is outside the scope of this thesis.
A management network can have several communication servers. One communication
server will handle the communication of a certain subset of nodes, which are assigned to
what is called an Area in the management network. The communication server is
maintaining the real time clocks of some of the network elements, handling the
performance metrics and fault information messages from the network elements, and
forwarding the management configuration messages from the management server to the
network elements. [11]
4.4 Management server
The management server consists of several service processes which, when grouped
together, contain most of the business logic of the Tellabs 8000. Several management
servers can be used in a Tellabs 8000 INM management network. For the scope of this
thesis, the significant service processes are the EMS service, the VPN Provisioning
Service, the Satellite Service and the Macro Manager Service. The management server
communicates with the communication servers, the workstations and the database. The
management server does not directly communicate with the Tellabs network elements.
The EMS service process is used to configure with the Tellabs 8600 mobile backhaul
network elements, the configuration commands are sent through the appropriate
communication server to the network elements. When doing network element
configurations the management server ensures that the configuration data on the Tellabs
8000 INM database and the configuration on the actual network elements are consistent.
This creates a very likely bottle neck if there are challenges in the network; to ensure
consistency of the configurations parts of the database will likely need to be locked
during the configuration of the network element, latency between the network element
and communication server, the communication server and the management server, and
the management server and the database will all impact how long the database locks are
active. While a part of the database is locked, all other management server processes
which need access to that part of the database will stall the operation while waiting for

19
the unlocking of the database. The VPN Provisioning Service process handles network
provisioning tasks, these tasks put load on the database server connection.
The satellite service serves the Tellabs 8000 Satellite Workstations, essentially the
satellite workstation is run without an object server and the functionality is provided by
the management server instead. A management server can serve both standard and
satellite workstations simultaneously if the satellite service is installed. The Macro
Management service serves the macro applications run on the workstation computers,
this service enables usage of the macro test scripts in the multiuser test cases related to
this thesis. [11]
4.5 Standard workstation
The workstation is the control interface which the operator uses to monitor, configure
and provision a production network, and Tellabs network elements. The workstation is a
set of tools which the operator can use for the tasks related to network management.
Typically the operator will use the provided tools through a graphical user interface.
There is also the option to use the Macro Manager package to create new graphical tools
or automated scripts. The tools provided by the Tellabs 8000 INM for the workstation
computers are reliable and user friendly. Because operators will be using these tools as
their main user interface to network management tasks, it is important for the image of
Tellabs Oy that they give a good impression. If the performance of the network manager
is decreased because of network impairments, the operators will see the effects through
the Workstation computer. This is why the measurements of the performance are done
at the workstation. If decreased performance is measured in macro test scripts, it would
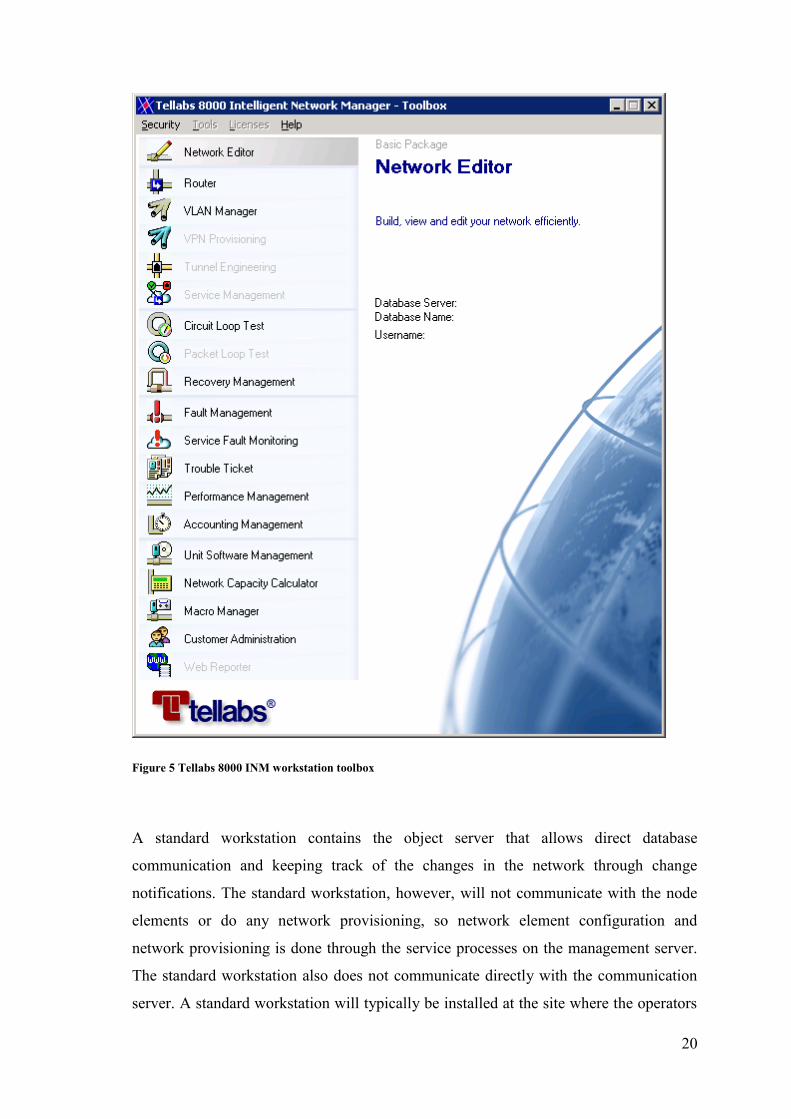
also impact the user experience of the operators. The Tellabs 8000 INM workstation
toolbox is shown in Figure 5
20
Figure 5 Tellabs 8000 INM workstation toolbox
A standard workstation contains the object server that allows direct database
communication and keeping track of the changes in the network through change
notifications. The standard workstation, however, will not communicate with the node
elements or do any network provisioning, so network element configuration and
network provisioning is done through the service processes on the management server.
The standard workstation also does not communicate directly with the communication
server. A standard workstation will typically be installed at the site where the operators
21
are working, often several workstations will be located at one site. It is known that some
Tellabs 8000 INM customers have remote sites with several standard workstations
where the network connection to the main site, containing the management servers,
communication servers and database server, is provided by ADSL connections [13].
Tellabs recommends satellite workstations to be used in situations like this because the
high latency to the database server and management servers is expected to impact
performance of not only the workstations at the remote site behind a challenged network
connection, but also the other components of the Tellabs 8000 INM management
network. [11]
4.6 Satellite workstation
A Satellite Workstation has the exact same user interface as the standard workstation,
but it does not contain an object server. Instead it only communicates with the
management server, even all the database operations are done by the management
server. Because a satellite workstation only communicates with the management server,
and does less processing than a standard workstation, it can be installed on computers
with less computing related resources and on computers which are at a remote site
behind a challenged network connection. Because the satellite workstation does not
communicate directly with the database server, it should cause less performance issues
in a challenged network than a standard workstation. [11]
4.7 Macro Package
The Tellabs 8000 intelligent Network Manager comes with a macro package, which
allows the user to create programs with which network and node management tasks can
be automated. Macros can be created and executed through the Macro Manager tool,
which is available both with a graphical user interface and with a command line based
interface. The macro manager is well integrated with the 8000 Intelligent Network
Manager and can be used to automate most of the tasks an operator might want to do in
an 8600 mobile backhaul network. [11]
22
The macro package is very useful in automated testing; test cases can be created as
macro programs and tests can be run without any need for third party graphical testing
software. The Macro Manager tool, which is based on input through the command line
interface, is easy to control through test management software such as TestMonkey to
create multiuser tests such as the ones created by Savolainen [1]. The programming
language used to create macro programs resembles C++ syntax and allows the writing
of complex programs. This also aids testing because additional functionality, such as
recording operation execution times, can be implemented in the macro programs.
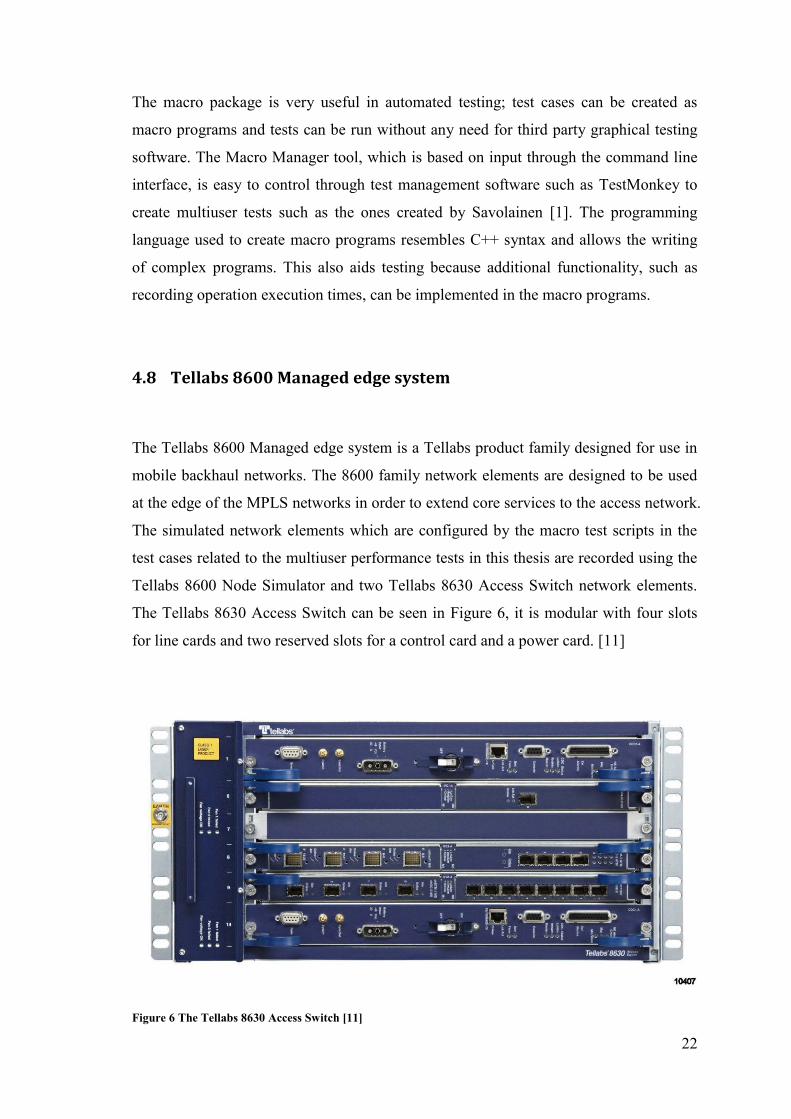
4.8 Tellabs 8600 Managed edge system
The Tellabs 8600 Managed edge system is a Tellabs product family designed for use in
mobile backhaul networks. The 8600 family network elements are designed to be used
at the edge of the MPLS networks in order to extend core services to the access network.
The simulated network elements which are configured by the macro test scripts in the
test cases related to the multiuser performance tests in this thesis are recorded using the
Tellabs 8600 Node Simulator and two Tellabs 8630 Access Switch network elements.
The Tellabs 8630 Access Switch can be seen in Figure 6, it is modular with four slots
for line cards and two reserved slots for a control card and a power card. [11]
Figure 6 The Tellabs 8630 Access Switch [11]
23
5 Tellabs INM performance testing
Automated testing and performance testing has been done at Tellabs for several years to
ensure functionality of the Tellabs 8000 INM. In this chapter the existing tools and
resources which are used in the work of this thesis are presented. Some of the existing
tools were supplemented with new features to enable better interoperability with the
new tools created for the testing environment of this thesis.
5.1 Multi-user tests
Tellabs Oy has dedicated testing resources for performance testing to ensure that the
8000 Intelligent Network Manager works well under the aggregated load created by
several operators monitoring and configuring a production network simultaneously. The
multiuser testing environments and test cases, which are currently in use at Tellabs, are
based on the environment created by Ilmo Savolainen in his master’s thesis Benchmark
testing of Network Management System.
Some of the Multiuser test cases rely on both automated graphical tests and automated
macro test scripts. The graphical tests are implemented using QuickTest Professional by
HP. The automated macro test scripts use the Macro Package of the Tellabs 8000
Intelligent Network Manager. In this thesis I will only concentrate on the automated
macro test scripts. The exclusion of the graphical test scripts was based on both the fact
that graphical test scripts would have required more resources than was available, in this
case computer hardware and QuickTest Professional licenses, but also because the focal
point of this thesis is on the performance of the Tellabs 8000 Intelligent Network
Manager in a challenged network. There is minimal difference in communication
between the components of the management network related to the input method of the
commands.
In the multiuser test cases based on automated macro scripts one user is being simulated
by one macro script. There are several test macros suitable for multiuser testing
available at Tellabs, most of which have been designed by Ilmo Savolainen. Each macro
24
script simulates a user creating a configuration in the network and then removing the
configuration. Related to the result gathering an operation in the test scripts is defined
as a task the user would do through the Tellabs 8000 workstation GUI, an operation
could for example be adding a certain type of interface to a network element. Short wait
times are integrated in the macro scripts between operations to simulate human behavior.
Because every macro first does a configuration task and then restores the original state,
the macro scripts can be looped for a larger sample size and longer test runs. The macro
scripts replicate configuration tasks that are an approximation of what operators might
do on a daily basis. There are both network element management and network
management operations present in the macro scripts.
5.2 Test macros
The macro test-scripts are written in the macro language of the Tellabs 8000 Macro
Package. The test scripts are designed so that one macro represents one operator
modifying configurations on the network. Each macro test-script first creates a
configuration and then reverses the configuration. This allows looping of the test scripts
during the test for a bigger sample size and more accurate results. The separate macro
test-scripts are in no purposeful way synchronized during the test, which means that
there might be situations where several macros happen to synchronize during the test
because of locking of certain parts of the database. Situations where macro test-scripts
happen to synchronize according to certain patterns might have an impact on the results,
which should be considered when analyzing the results.
There are five different macro scripts being used in the testing related to this thesis.
Four of the macro test-scripts do both network element configuration and network
provisioning, one macro test-script does only network element configuration. The
macro test-scripts for network provisioning each use two simulated network elements.
These are first configured and the provisioning is then done using the simulated network
elements as endpoints. The macro test-script, which only does network element
configuration, uses only one node. To add more load to the management network in
these tests, each macro script is being run on several simultaneous sessions of the macro
25
manager using different simulated network elements. In the test cases related to this
thesis, each macro test script is running on 8 simultaneous sessions.
Each macro script records the time used for each Tellabs 8000 INM related
configuration operation into a temporary file on the workstations hard drive. These
recorded execution times are the base of the performance results which are crucial for
the performance analysis of the management network.
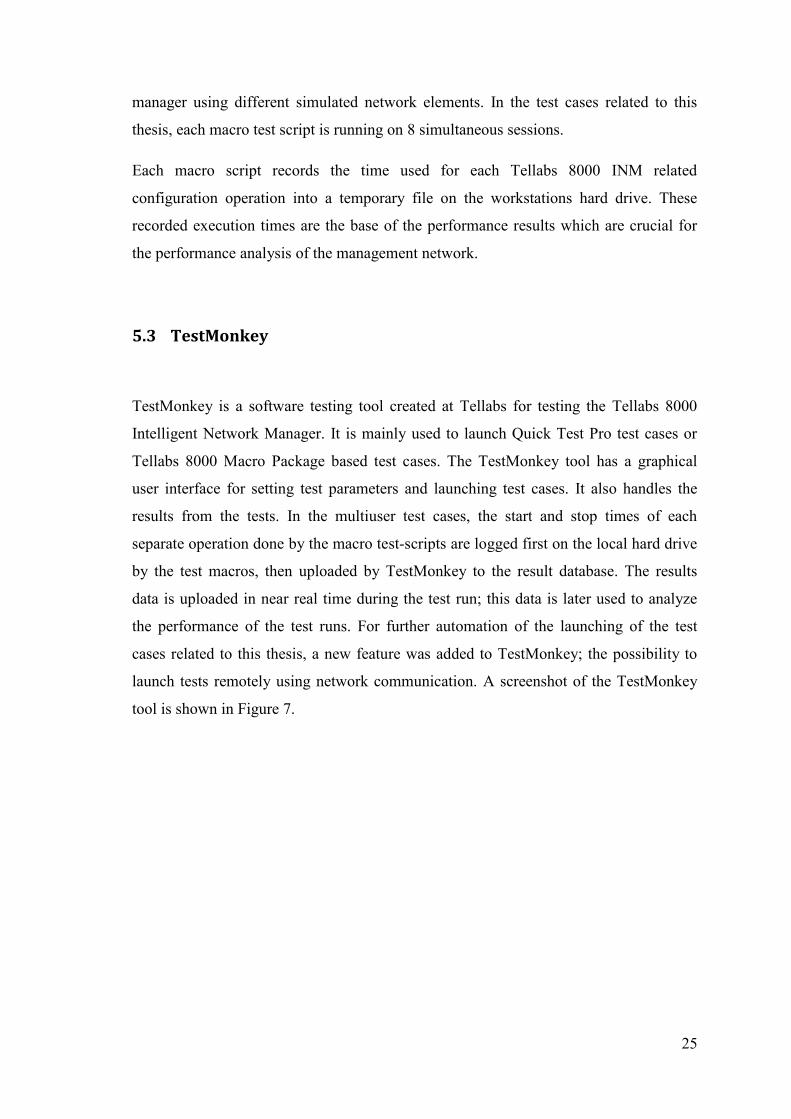
5.3 TestMonkey
TestMonkey is a software testing tool created at Tellabs for testing the Tellabs 8000
Intelligent Network Manager. It is mainly used to launch Quick Test Pro test cases or
Tellabs 8000 Macro Package based test cases. The TestMonkey tool has a graphical
user interface for setting test parameters and launching test cases. It also handles the
results from the tests. In the multiuser test cases, the start and stop times of each
separate operation done by the macro test-scripts are logged first on the local hard drive
by the test macros, then uploaded by TestMonkey to the result database. The results
data is uploaded in near real time during the test run; this data is later used to analyze
the performance of the test runs. For further automation of the launching of the test
cases related to this thesis, a new feature was added to TestMonkey; the possibility to
launch tests remotely using network communication. A screenshot of the TestMonkey
tool is shown in Figure 7.
26
Figure 7 Screenshot of the TestMonkey software testing tool
For the multiuser test cases, one workstation computer is assigned the role of Director
computer. The TestMonkey instance running on the Director computer will contact the
other workstations and launch the appropriate test scripts remotely. The computers and
test scripts are defined in each test case.
5.4 Virtual machines
Virtual machines have many advantages over physical computers for test environments,
a new computer can quickly be set up and the actual processing resources can be
allocated according to the requirements of the testing setup. For the virtualization of
computers in the multiuser tests related to this thesis, VMware solutions were used. The
Tellabs 8000 INM can be installed without any custom settings on this kind of virtual
machines.
The Tellabs 8000 INM also has session support for usage with Citrix solutions. The
Citrix solutions are being used for some Tellabs 8000 INM multiuser testing
environments to provide desktop virtualization for running several Tellabs 8000 server
or workstation instances on one physical computer.
27
5.5 Result database
A lot of metrics and data are gathered when running a test case. During one hour
multiuser test in the environment used for the testing related to this thesis, without any
network impairments active, approximately 10 megabytes of data is recorded to the
results database. The database server is running on a Linux server in the Tellabs Oy
LAN. In addition to the database, the server has a result analysis tool which can be
accessed through a web-interface. The results analysis tool can calculate different
comparable metric values based on the execution times of operations in test cases. The
results analysis tool can access the execution times directly from the database and eases
the evaluation of performance of the tested network manager configurations. For the
results presented in this thesis the results analysis tool will mainly be used for providing
the processed results metrics. For some of the results being presented there is however a
need to use either the raw execution times recorded in the database, or using the values
given by the results analysis tool as preprocessed data for further calculations.
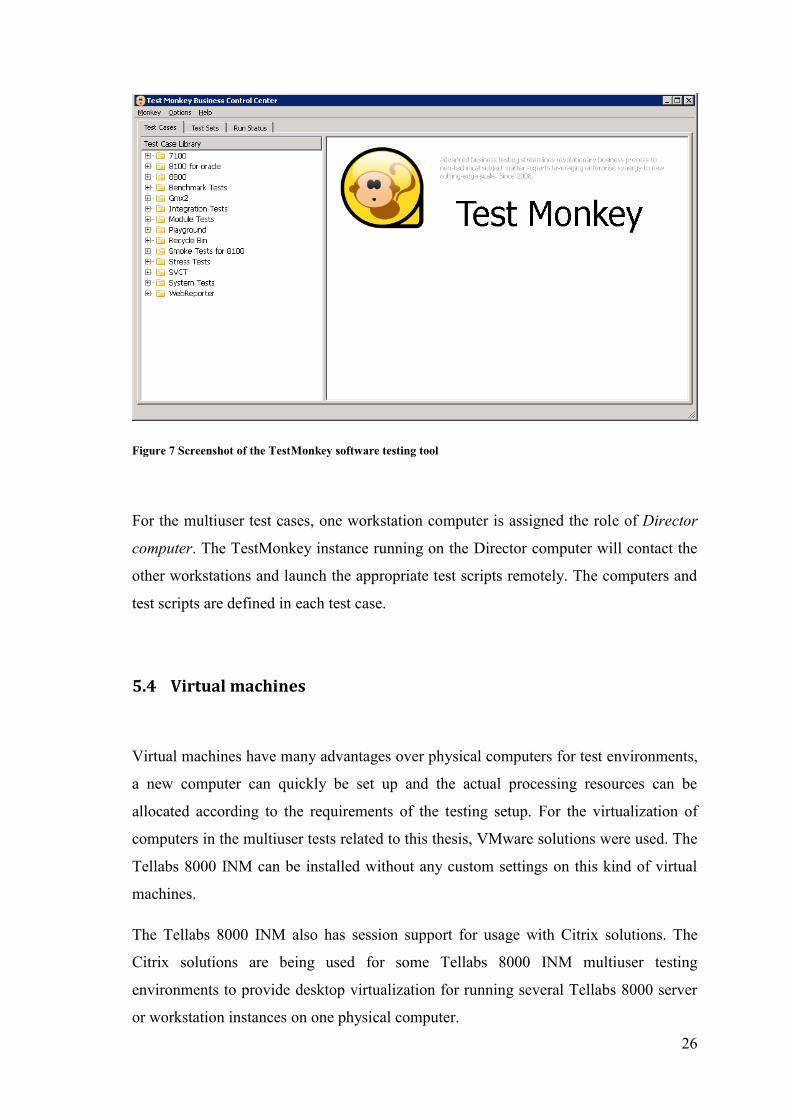
5.6 Joinker
The Joinkee server and Joinker client, shown in Figure 8, are tools created at the Tellabs
integration testing team to automate configuration of testing environments. The Joinkee
server runs on the computers of the testing environment as a background process,
waiting for configuration commands which are sent by the Joinker client. The
commands are sent as Microsoft Windows batch files4 which are compressed using the
DEFLATE compressed Data Format [14]. The Joink packages are encoded using the
Base64 data encoding method [15] for sending over a TCP socket from the Joinker
client to the Joinkee server. The compressed package which is sent by the Joinker client
can contain other files in addition to the executable Microsoft Windows batch files, this
allows execution of complex tasks as the package can contain additional executable
files which then can be started from the included batch file. The purpose of the Joinker
4 http://www.microsoft.com/resources/documentation/windows/xp/all/proddocs/en-us/batch.mspx
28
programs is to minimize the amount of manual labor required to prepare the testing
environment for a test case and also lessen the risk of human error.
Figure 8 The Joinker client program
29
6 Design of a test set to measure INM management in an
impaired network
This chapter describes the design process of the testing environment and the test plan
for the Tellabs 8000 INM performance tests in a challenged network. Also the final test
environment and test plan are presented in this chapter. In software testing the planning
of a balanced and sufficiently comprehensive test set is important; if the test is not
planned well then the results might be unreliable or the test cases may produce results
which cannot be compared as was intended.
6.1 Architecture of the test environment
The test environment used for these performance tests is based on the test environment
created by Ilmo Savolainen for his master’s thesis. The environment consists of a
network of virtual machines running on a VMware ESX server5. The virtual machines
in the network are running the Microsoft Windows 2003 R2 operating system for the
Tellabs 8000 INM servers and Microsoft Windows XP SP3 for the Tellabs 8000 INM
workstations. In addition there is the 8600 node simulator running on Microsoft
Windows XP. The resources for the virtual machines have been distributed as shown in
Table 2. Some of the computers have a variable amount of processing resources, the
lower limit is the required amount of CPU resources; the virtual machine is guaranteed
to receive this amount of CPU time. The upper limit is the maximum amount the virtual
machine is allowed to use. According to the monitoring in the VMware vSphere client,
the resources are adequate.
5 http://www.vmware.com/support/vsphere4/doc/vsp_esx41_vc41_rel_notes.html
30
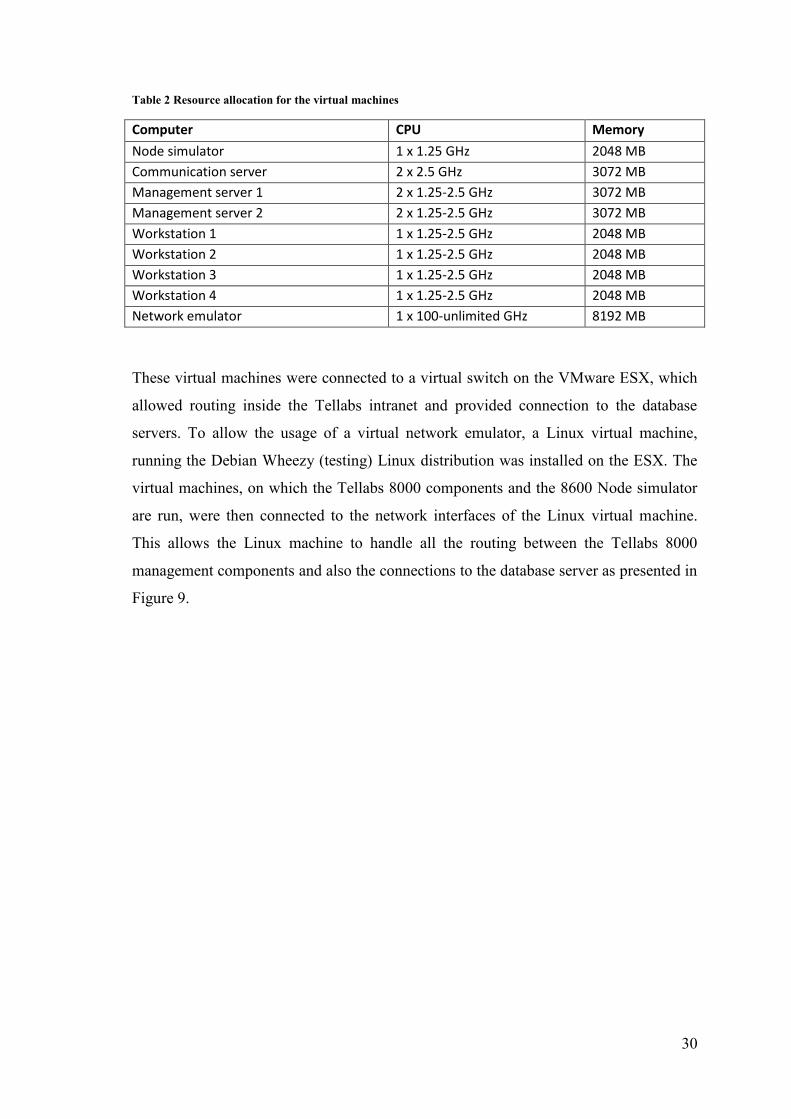
Table 2 Resource allocation for the virtual machines
Computer CPU Memory
Node simulator 1 x 1.25 GHz 2048 MB
Communication server 2 x 2.5 GHz 3072 MB
Management server 1 2 x 1.25-2.5 GHz 3072 MB
Management server 2 2 x 1.25-2.5 GHz 3072 MB
Workstation 1 1 x 1.25-2.5 GHz 2048 MB
Workstation 2 1 x 1.25-2.5 GHz 2048 MB
Workstation 3 1 x 1.25-2.5 GHz 2048 MB
Workstation 4 1 x 1.25-2.5 GHz 2048 MB
Network emulator 1 x 100-unlimited GHz 8192 MB
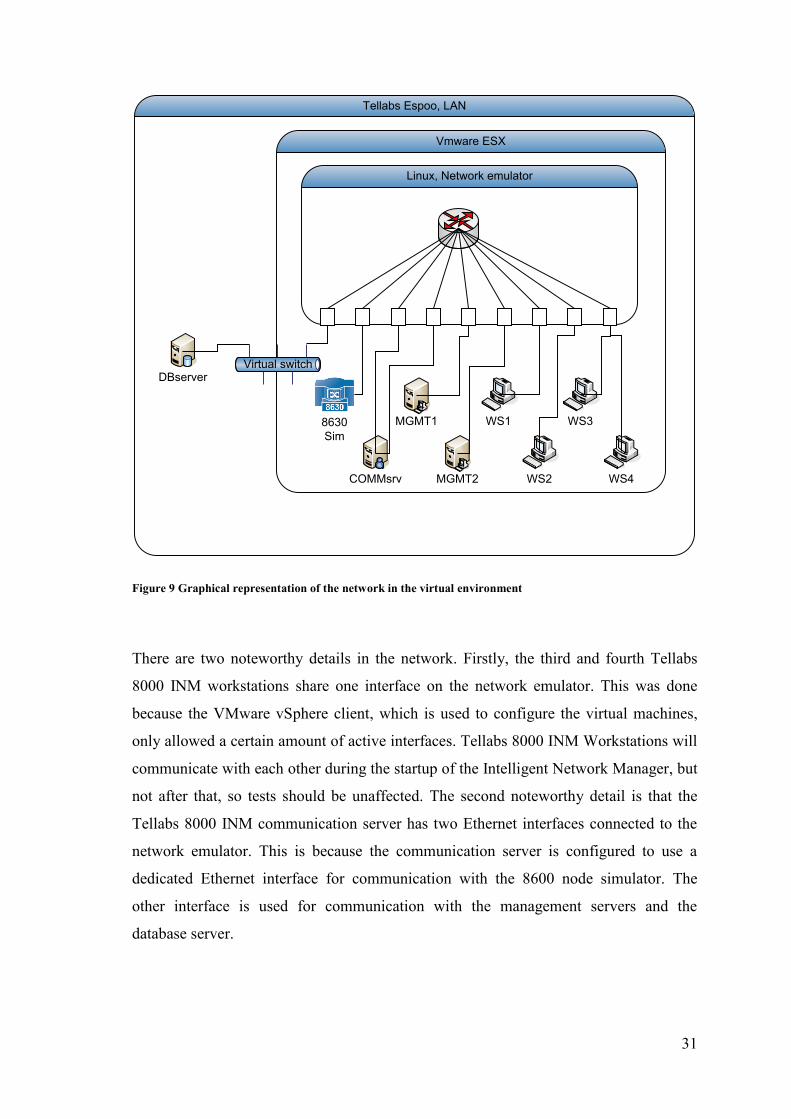
These virtual machines were connected to a virtual switch on the VMware ESX, which
allowed routing inside the Tellabs intranet and provided connection to the database
servers. To allow the usage of a virtual network emulator, a Linux virtual machine,
running the Debian Wheezy (testing) Linux distribution was installed on the ESX. The
virtual machines, on which the Tellabs 8000 components and the 8600 Node simulator
are run, were then connected to the network interfaces of the Linux virtual machine.
This allows the Linux machine to handle all the routing between the Tellabs 8000
management components and also the connections to the database server as presented in
Figure 9.
31
Vmware ESX
Virtual switch
Tellabs Espoo, LAN
WS1
WS2
WS3
WS4
MGMT1
MGMT2
DBserver
COMMsrv
Linux, Network emulator
8630 Sim
Figure 9 Graphical representation of the network in the virtual environment
There are two noteworthy details in the network. Firstly, the third and fourth Tellabs
8000 INM workstations share one interface on the network emulator. This was done
because the VMware vSphere client, which is used to configure the virtual machines,
only allowed a certain amount of active interfaces. Tellabs 8000 INM Workstations will
communicate with each other during the startup of the Intelligent Network Manager, but
not after that, so tests should be unaffected. The second noteworthy detail is that the
Tellabs 8000 INM communication server has two Ethernet interfaces connected to the
network emulator. This is because the communication server is configured to use a
dedicated Ethernet interface for communication with the 8600 node simulator. The
other interface is used for communication with the management servers and the
database server.
32
6.2 The simulated network
The Tellabs 8000 management network is used for provisioning and network element
configuration of the actual networks which may consist of thousands of Tellabs network
elements from different product families. The size of the network has an impact on the
performance of certain operations in the management network, especially for some of
the database operations. That is why the simulated network in the multiuser tests has
more network elements than the Tellabs 8600 Network Simulator is set up to simulate.
The database which is used in the multiuser tests has a total of 62085 network elements,
out of which 21039 are from the Tellabs 8600 Managed Edge System product family.
The database is based on a customer network, to which more network elements have
been added. From a performance testing aspect having the network elements in the
database equals to having them in an actual network, as long as no configurations are
being done to them and the performance monitoring service is disabled.
6.3 Other possible implementations
This environment could have been implemented using physical computers; one for each
Tellabs 8000 INM network management endpoint and one for the network emulator.
Using physical computers however would have been cumbersome because of higher
probability of failing hardware, requirement of space in the equipment room, time
required to set up the environment and justifying the binding of processing resources to
one single-purpose testing environment. The resources for the virtual environment
already existed, were proven reliable and can be allocated in a way that allows the
resources to be used for other testing environments also. If the infrastructure for the
virtual machines had not been available, using physical computers might have been a
viable option.
One option would have been a networking setup where all traffic would be routed
outside the ESX server to a hardware network emulator. This would have been
accomplished using VLAN connections. I however chose to not use this method for
several reasons. Firstly, I did not want to add the risk of fluctuating network

33
performance caused by sharing networking resources with the rest of the office.
Secondly, all the networking equipment would have been under IT-administration,
testing methods such as packet sniffing and Ethernet interfaces in promiscuous mode
might have been disallowed. This would have allowed using a commercial network
emulator, but it would have been borrowed from another department, which would have
caused scheduling problems.
Even when I had made the decision to use a network emulator running on a virtual
machine on the VMware ESX, I could have used other tools than the Linux Networking
Subsystem. In chapter 2.2 I described different solutions for implementing a software
network emulator. The requirements on the network emulator in this environment where
so specific that modifications to the other network emulation solutions would had been
required in order to implement all the needed features.
34
6.4 The network emulator
The network emulator is based on a virtual machine running the Debian distribution of
Linux. The tools required to create a network emulator on Linux are available in most
recent Linux distributions. Debian was selected mainly because of my familiarity with
the distribution from before. There was some additional work caused by the fact that the
network emulator is running on a virtual machine. Network bridges are implemented in
the Linux kernel and would have allowed a simpler alternative to routing the network
packets. However my initial tests showed problems on the ESX server when enabling
network bridges on the Linux virtual machine. To ensure the safety of the intranet, the
IT administration requested that no bridges should be used on the virtual Linux
computer running on the ESX server.
Because network bridges could not be used, the network emulator needed to be created
using routing instead. The problem that arose was that the virtual machines relied on
DHCP for address resolution. Local static addressing could not be used because of the
need to contact the database server and the results database. Because the DHCP
protocol relies on the Media Access Control (MAC) address when requesting an address,
additional tools were required for forwarding the DHCP communication to the DHCP
server in the Tellabs intranet. The tools used were bcrelay and parprouted. Because
bcrelay and parprouted create network messages and use CPU resources they are only
used during the startup of the Windows virtual machines. Both are always disabled
when actual tests are running. The bcrelay and parprouted programs are available in the
Debian packet repositories. When the Windows virtual machines have received IP-
addresses, the routing can be done by the Linux kernel6.
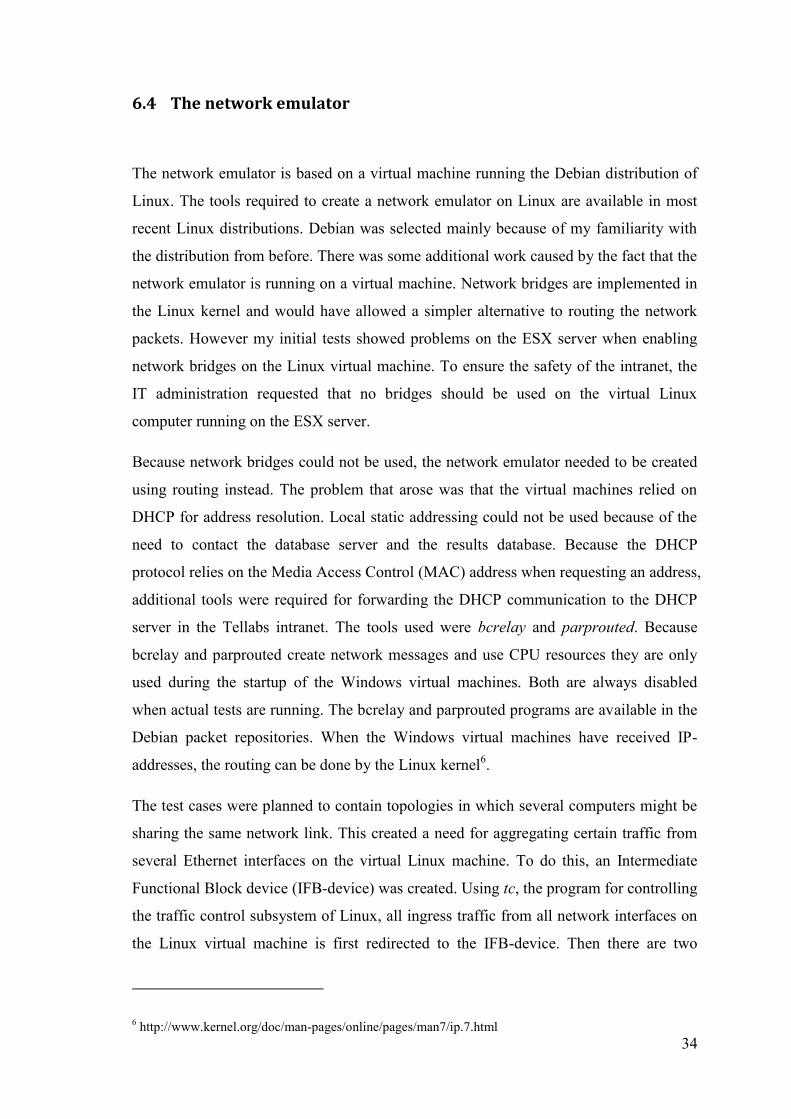
The test cases were planned to contain topologies in which several computers might be
sharing the same network link. This created a need for aggregating certain traffic from
several Ethernet interfaces on the virtual Linux machine. To do this, an Intermediate
Functional Block device (IFB-device) was created. Using tc, the program for controlling
the traffic control subsystem of Linux, all ingress traffic from all network interfaces on
the Linux virtual machine is first redirected to the IFB-device. Then there are two
6 http://www.kernel.org/doc/man-pages/online/pages/man7/ip.7.html
35
classes of traffic added to the IFB device, representing the uplink and downlink of the
impaired network link. Filter rules are created based on matching the source and the
destination IP-addresses. Traffic destined between the two sites is assigned to the
classes representing the impaired network link. Traffic with both endpoints within one
site uses the unimpaired root class of the IFB device. Figure 10 shows a visualization of
the configuration of the Linux traffic control subsystem which is used for the network
emulator.
In
ETH1
Out In
ETH2
Out In
ETH3
Out In
ETH4
Out
In
ETH5
Out In
ETH6
Out In
ETH7
Out In
ETH8
Out
IFB (Intermediate Functional Block Device)
HTB Class 1:2
Link from right to left site according to impairment
profile.Shapes traffic to
configured maximum rate
Filtering of traffic to HTB Class 1:1, 1:2 or root. Based on source/destination IP addresses.
HTB Class 1:1
Link from left to right site according to impairment
profile.Shapes traffic to
configured maximum rate
NetEm qdisc, handle 11
Adds latency and packet loss according to configured values
NetEm qdisc, handle 21
Adds latency and packet loss according to configured values
HTB root Class
Link for traffic within a site
Does not add any impairments to the traffic
Mirroring of ingress traffic to IFB device
Routing by the Linux kernel
Figure 10: Visualization of the Linux traffic control subsystem for the network emulator
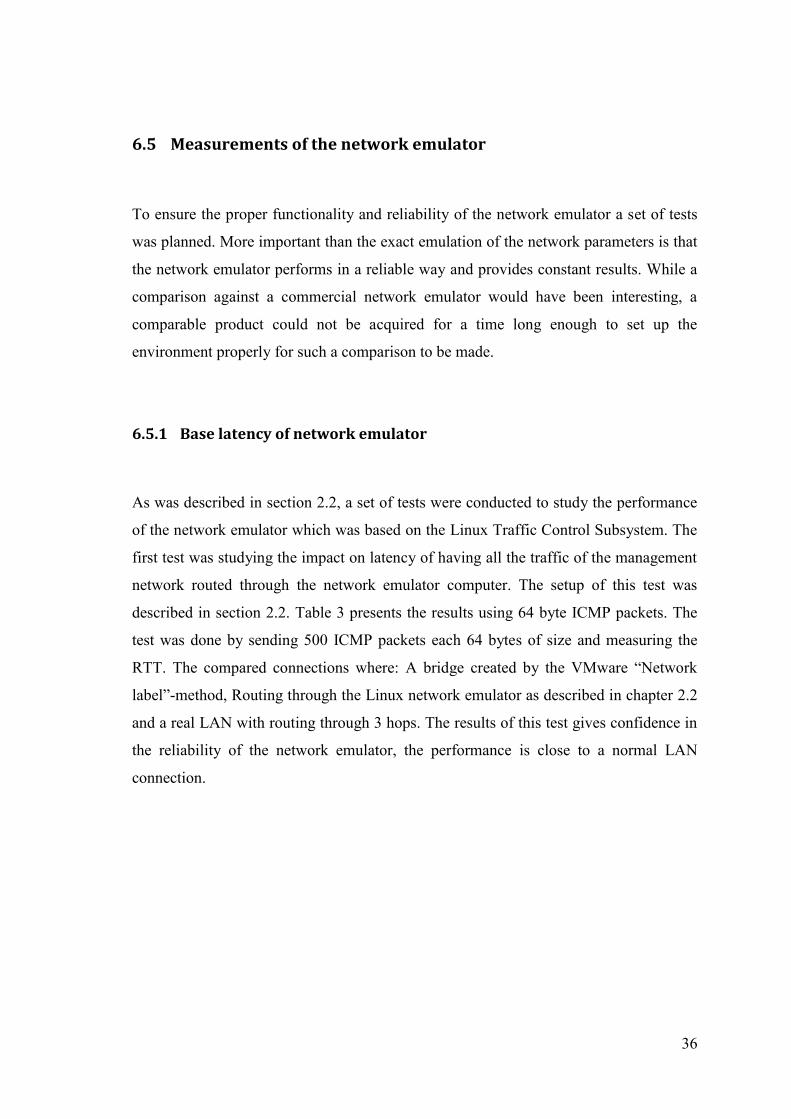
36
6.5 Measurements of the network emulator
To ensure the proper functionality and reliability of the network emulator a set of tests
was planned. More important than the exact emulation of the network parameters is that
the network emulator performs in a reliable way and provides constant results. While a
comparison against a commercial network emulator would have been interesting, a
comparable product could not be acquired for a time long enough to set up the
environment properly for such a comparison to be made.
6.5.1 Base latency of network emulator
As was described in section 2.2, a set of tests were conducted to study the performance
of the network emulator which was based on the Linux Traffic Control Subsystem. The
first test was studying the impact on latency of having all the traffic of the management
network routed through the network emulator computer. The setup of this test was
described in section 2.2. Table 3 presents the results using 64 byte ICMP packets. The
test was done by sending 500 ICMP packets each 64 bytes of size and measuring the
RTT. The compared connections where: A bridge created by the VMware “Network
label”-method, Routing through the Linux network emulator as described in chapter 2.2
and a real LAN with routing through 3 hops. The results of this test gives confidence in
the reliability of the network emulator, the performance is close to a normal LAN
connection.
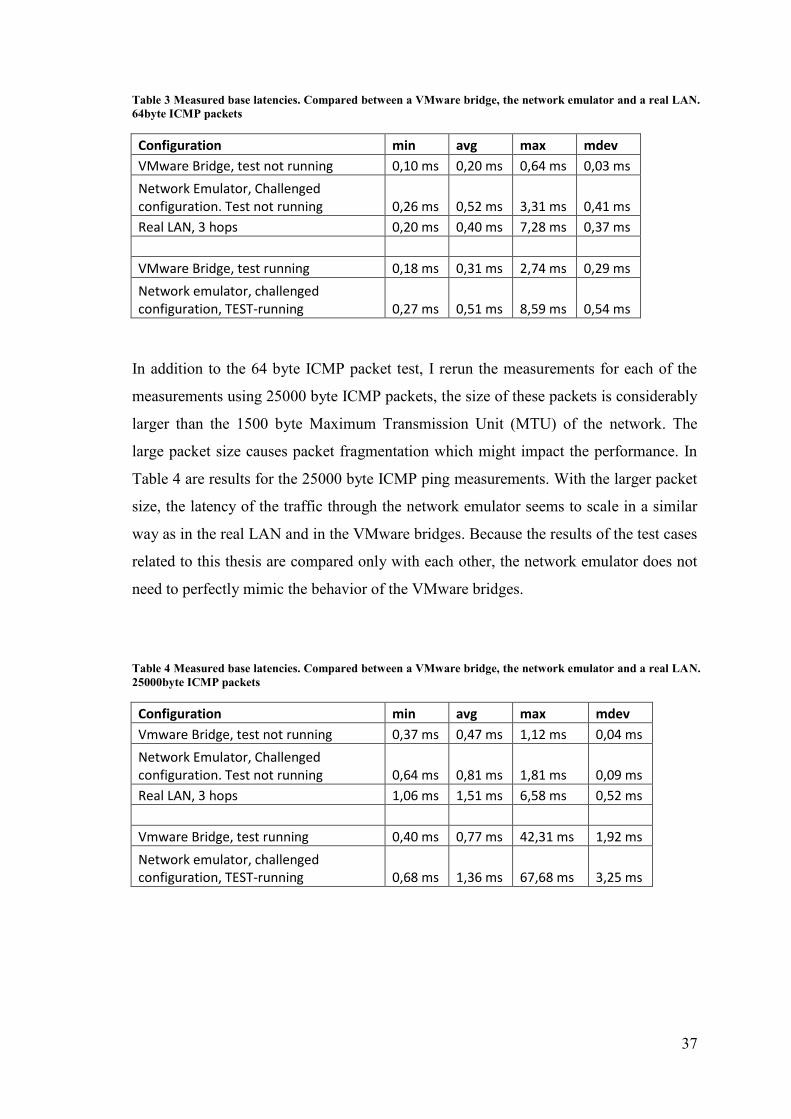
37
Table 3 Measured base latencies. Compared between a VMware bridge, the network emulator and a real LAN. 64byte ICMP packets
Configuration min avg max mdev
VMware Bridge, test not running 0,10 ms 0,20 ms 0,64 ms 0,03 ms
Network Emulator, Challenged configuration. Test not running 0,26 ms 0,52 ms 3,31 ms 0,41 ms
Real LAN, 3 hops 0,20 ms 0,40 ms 7,28 ms 0,37 ms
VMware Bridge, test running 0,18 ms 0,31 ms 2,74 ms 0,29 ms
Network emulator, challenged configuration, TEST-running 0,27 ms 0,51 ms 8,59 ms 0,54 ms
In addition to the 64 byte ICMP packet test, I rerun the measurements for each of the
measurements using 25000 byte ICMP packets, the size of these packets is considerably
larger than the 1500 byte Maximum Transmission Unit (MTU) of the network. The
large packet size causes packet fragmentation which might impact the performance. In
Table 4 are results for the 25000 byte ICMP ping measurements. With the larger packet
size, the latency of the traffic through the network emulator seems to scale in a similar
way as in the real LAN and in the VMware bridges. Because the results of the test cases
related to this thesis are compared only with each other, the network emulator does not
need to perfectly mimic the behavior of the VMware bridges.
Table 4 Measured base latencies. Compared between a VMware bridge, the network emulator and a real LAN. 25000byte ICMP packets
Configuration min avg max mdev
Vmware Bridge, test not running 0,37 ms 0,47 ms 1,12 ms 0,04 ms
Network Emulator, Challenged configuration. Test not running 0,64 ms 0,81 ms 1,81 ms 0,09 ms
Real LAN, 3 hops 1,06 ms 1,51 ms 6,58 ms 0,52 ms
Vmware Bridge, test running 0,40 ms 0,77 ms 42,31 ms 1,92 ms
Network emulator, challenged configuration, TEST-running 0,68 ms 1,36 ms 67,68 ms 3,25 ms
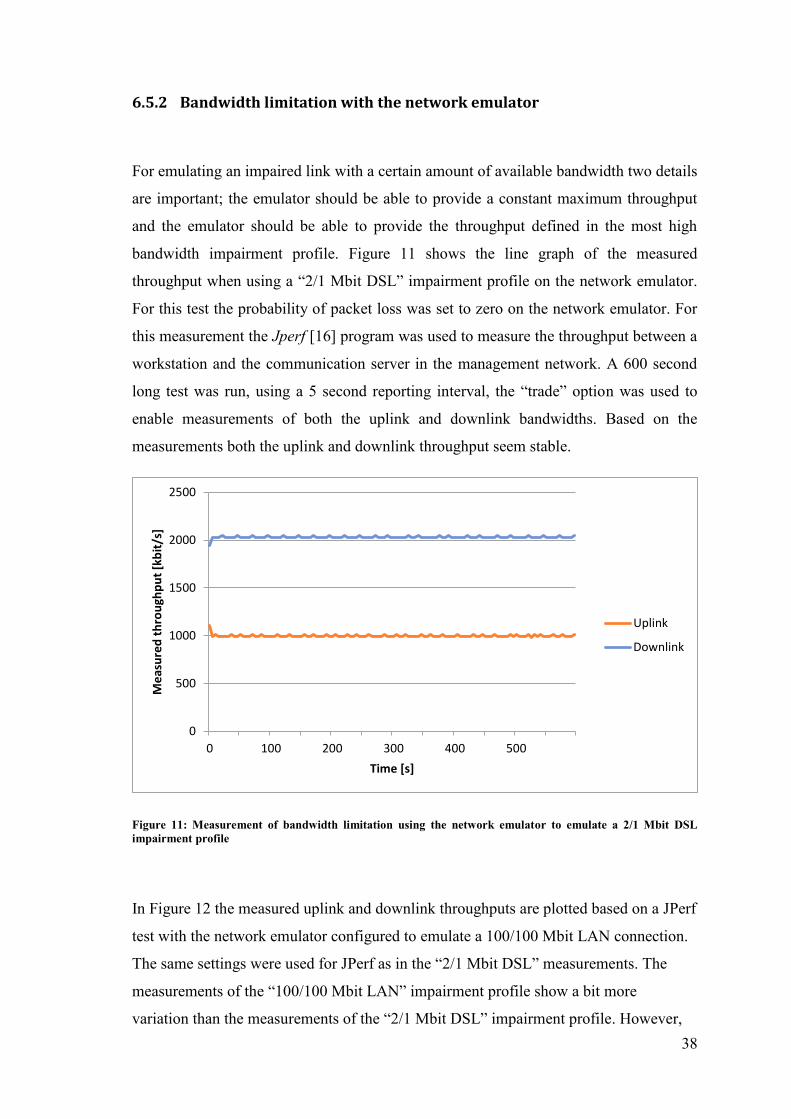
38
6.5.2 Bandwidth limitation with the network emulator
For emulating an impaired link with a certain amount of available bandwidth two details
are important; the emulator should be able to provide a constant maximum throughput
and the emulator should be able to provide the throughput defined in the most high
bandwidth impairment profile. Figure 11 shows the line graph of the measured
throughput when using a “2/1 Mbit DSL” impairment profile on the network emulator.
For this test the probability of packet loss was set to zero on the network emulator. For
this measurement the Jperf [16] program was used to measure the throughput between a
workstation and the communication server in the management network. A 600 second
long test was run, using a 5 second reporting interval, the “trade” option was used to
enable measurements of both the uplink and downlink bandwidths. Based on the
measurements both the uplink and downlink throughput seem stable.
Figure 11: Measurement of bandwidth limitation using the network emulator to emulate a 2/1 Mbit DSL impairment profile
In Figure 12 the measured uplink and downlink throughputs are plotted based on a JPerf
test with the network emulator configured to emulate a 100/100 Mbit LAN connection.
The same settings were used for JPerf as in the “2/1 Mbit DSL” measurements. The
measurements of the “100/100 Mbit LAN” impairment profile show a bit more
variation than the measurements of the “2/1 Mbit DSL” impairment profile. However,
0
500
1000
1500
2000
2500
0 100 200 300 400 500
Me
asu
red
th
rou
ghp
ut
[kb
it/s
]
Time [s]
Uplink
Downlink
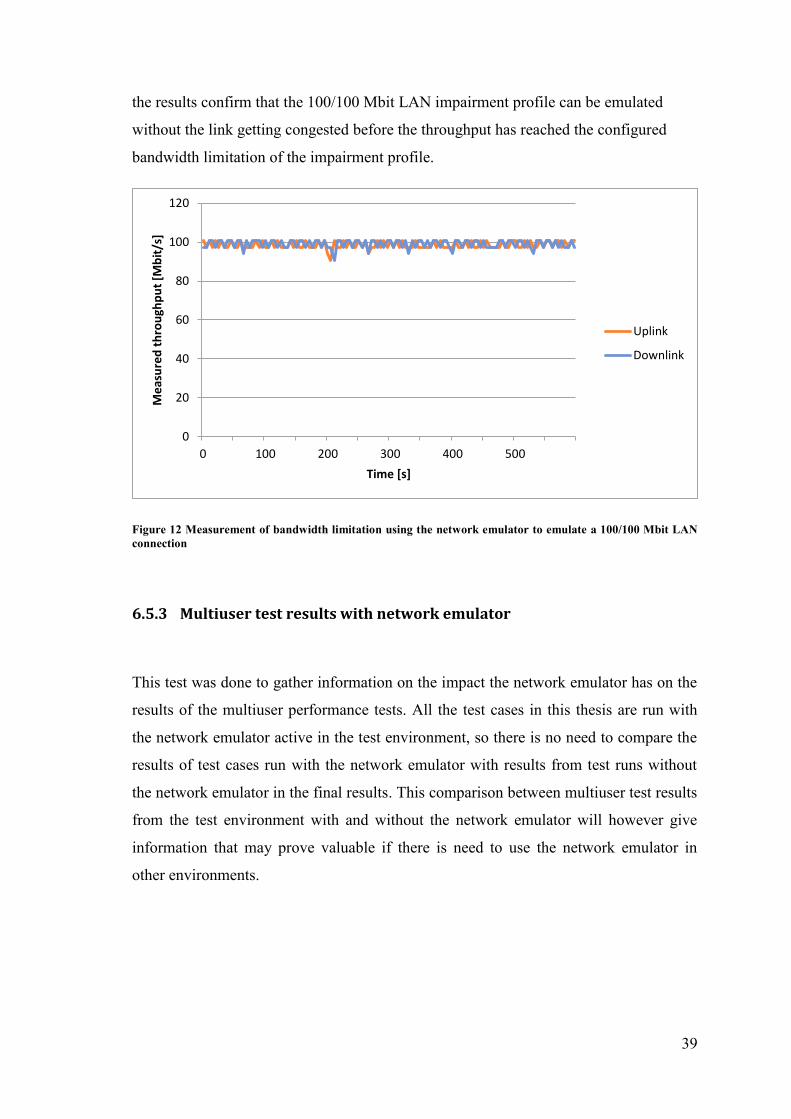
39
the results confirm that the 100/100 Mbit LAN impairment profile can be emulated
without the link getting congested before the throughput has reached the configured
bandwidth limitation of the impairment profile.
Figure 12 Measurement of bandwidth limitation using the network emulator to emulate a 100/100 Mbit LAN connection
6.5.3 Multiuser test results with network emulator
This test was done to gather information on the impact the network emulator has on the
results of the multiuser performance tests. All the test cases in this thesis are run with
the network emulator active in the test environment, so there is no need to compare the
results of test cases run with the network emulator with results from test runs without
the network emulator in the final results. This comparison between multiuser test results
from the test environment with and without the network emulator will however give
information that may prove valuable if there is need to use the network emulator in
other environments.
0
20
40
60
80
100
120
0 100 200 300 400 500
Me
asu
red
th
rou
ghp
ut
[Mb
it/s
]
Time [s]
Uplink
Downlink
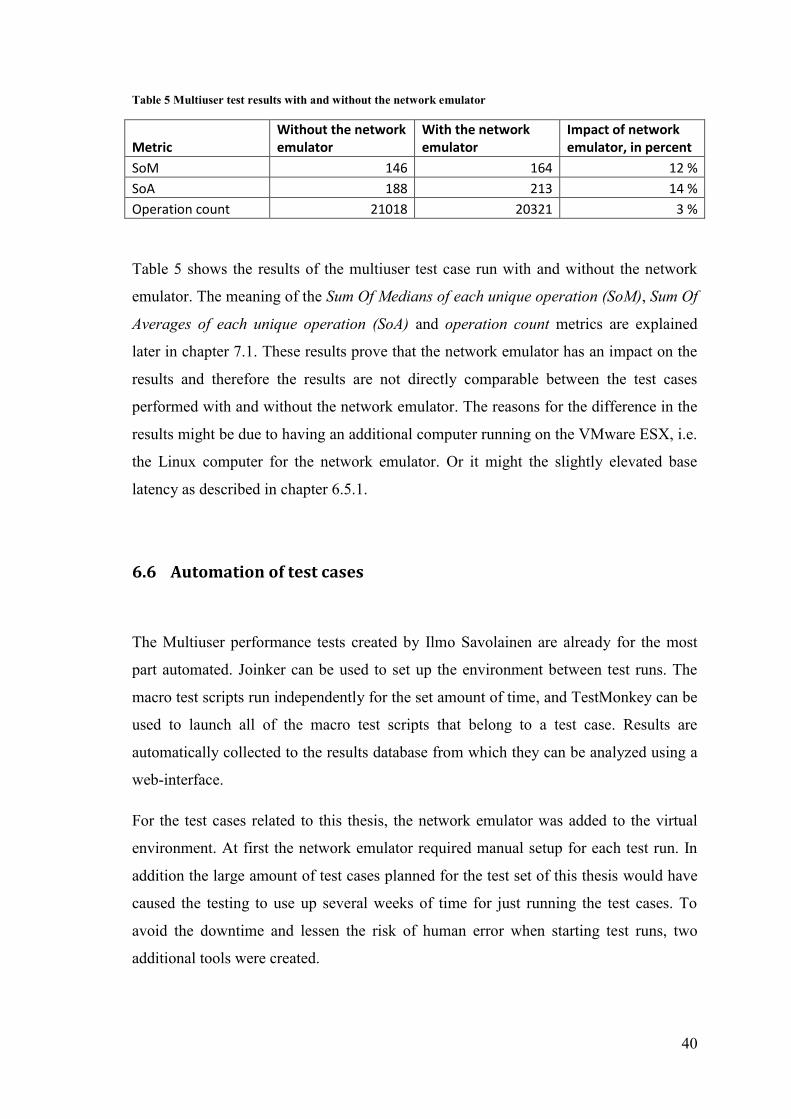
40
Table 5 Multiuser test results with and without the network emulator
Metric Without the network emulator
With the network emulator
Impact of network emulator, in percent
SoM 146 164 12 %
SoA 188 213 14 %
Operation count 21018 20321 3 %
Table 5 shows the results of the multiuser test case run with and without the network
emulator. The meaning of the Sum Of Medians of each unique operation (SoM), Sum Of
Averages of each unique operation (SoA) and operation count metrics are explained
later in chapter 7.1. These results prove that the network emulator has an impact on the
results and therefore the results are not directly comparable between the test cases
performed with and without the network emulator. The reasons for the difference in the
results might be due to having an additional computer running on the VMware ESX, i.e.
the Linux computer for the network emulator. Or it might the slightly elevated base
latency as described in chapter 6.5.1.
6.6 Automation of test cases
The Multiuser performance tests created by Ilmo Savolainen are already for the most
part automated. Joinker can be used to set up the environment between test runs. The
macro test scripts run independently for the set amount of time, and TestMonkey can be
used to launch all of the macro test scripts that belong to a test case. Results are
automatically collected to the results database from which they can be analyzed using a
web-interface.
For the test cases related to this thesis, the network emulator was added to the virtual
environment. At first the network emulator required manual setup for each test run. In
addition the large amount of test cases planned for the test set of this thesis would have
caused the testing to use up several weeks of time for just running the test cases. To
avoid the downtime and lessen the risk of human error when starting test runs, two
additional tools were created.
41
6.6.1 NetSloth
NetSloth is a program I wrote to ease the configuration of the network emulator in the
testing environment of this thesis. NetSloth is written in ruby and is built on a client-
server type of management interface. The NetSloth server runs on the network emulator
and sets up the network emulation configurations defined in messages sent over the
network using the TCP protocol. The actual configurations are then done by Linux shell
scripts, which control the Linux Network Subsystem. The NetSloth client is a simple
ruby program with a command line interface, which allows the user to select the
network emulation configuration from given presets. The commands are sent to the
NetSloth server over a TCP/IP connection.
The NetSloth server and client can also be used to start monitoring on the network
emulator. For the test cases related to this thesis, a program called ipaudit was used to
monitor the amount of data and packets that are sent between the computers in the
network. The addition of further monitoring tools is a trivial task, but all monitoring
adds some load on the resources of the network emulator. I chose not to implement any
additional monitoring to ensure that the performance of the network emulator would not
fluctuate because of the possible additional load on processing resources.
The basic functionality of the NetSloth server is illustrated in Figure 13. In the initial
state the NetSloth server is listening for signals, the signals are received through a TCP
socket and may originate from the NetSloth client or the AutoQueue program. There are
three different types of messages supported, all of which cause a specific task to be
executed on the NetSloth server. The server is using a single thread, so while the server
is configuring the network emulator based on a received message, no other messages
can be accepted. The messages are sent as ASCII messages over the TCP connection
and may contain parameters separated by the character “-“ which is used as a sentinel
value in the messaging.
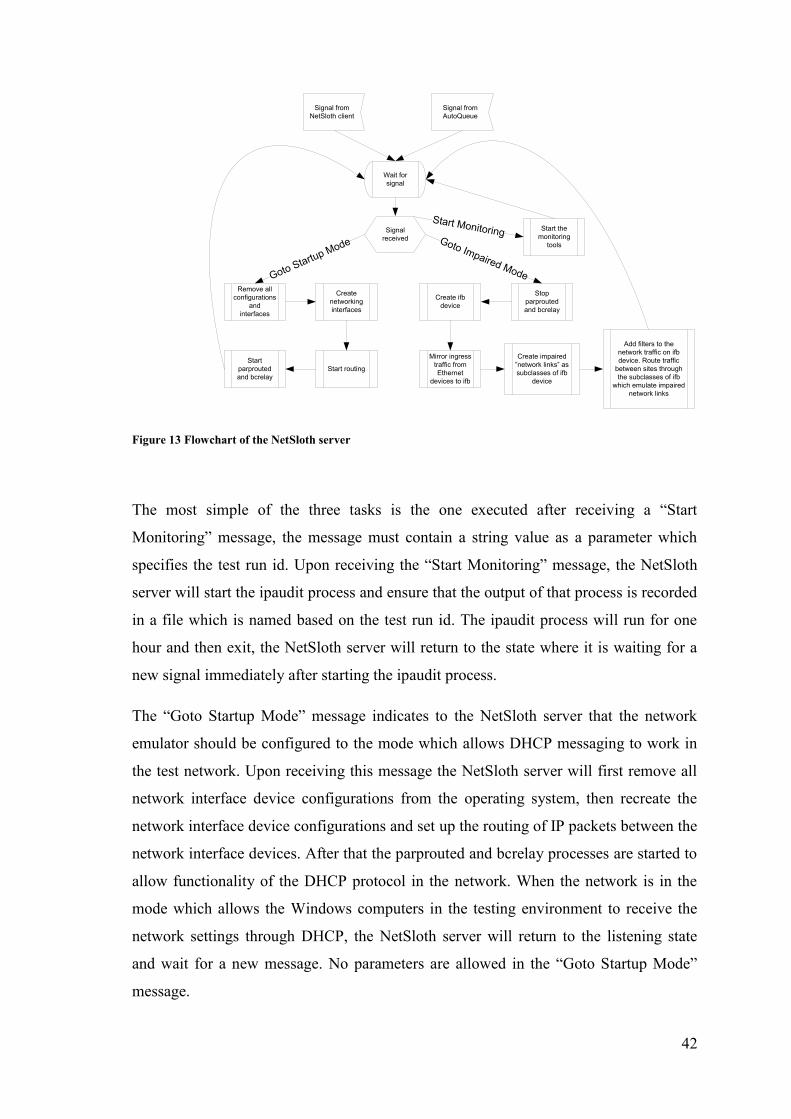
42
Wait for signal
Remove all configurations
and interfaces
Create networking interfaces
Start routingStart
parprouted and bcrelay
Signal received
Goto Startup Mode
Stop parprouted and bcrelay
Mirror ingress traffic from Ethernet
devices to ifb
Create impaired ”network links” as subclasses of ifb
device
Add filters to the network traffic on ifb device. Route traffic
between sites through the subclasses of ifb
which emulate impaired network links
Create ifb device
Signal from AutoQueue
Signal from NetSloth client
Goto Impaired Mode
Start the monitoring
tools
Start Monitoring
Figure 13 Flowchart of the NetSloth server
The most simple of the three tasks is the one executed after receiving a “Start
Monitoring” message, the message must contain a string value as a parameter which
specifies the test run id. Upon receiving the “Start Monitoring” message, the NetSloth
server will start the ipaudit process and ensure that the output of that process is recorded
in a file which is named based on the test run id. The ipaudit process will run for one
hour and then exit, the NetSloth server will return to the state where it is waiting for a
new signal immediately after starting the ipaudit process.
The “Goto Startup Mode” message indicates to the NetSloth server that the network
emulator should be configured to the mode which allows DHCP messaging to work in
the test network. Upon receiving this message the NetSloth server will first remove all
network interface device configurations from the operating system, then recreate the
network interface device configurations and set up the routing of IP packets between the
network interface devices. After that the parprouted and bcrelay processes are started to
allow functionality of the DHCP protocol in the network. When the network is in the
mode which allows the Windows computers in the testing environment to receive the
network settings through DHCP, the NetSloth server will return to the listening state
and wait for a new message. No parameters are allowed in the “Goto Startup Mode”
message.

43
The “Goto Impaired Mode” will cause the NetSloth server to do the tasks related to
setting up the configuration of the network emulator which is used during the test run.
The message must contain the topology id and the network impairment id as separate
string values. Upon receiving the “Goto Impaired Mode” message the NetSloth server
will close the parprouted and bcrelay processes if they are running, then create the IFB
device and mirror all the ingress traffic from each network interface device to the IFB
device. The NetSloth server will then create the emulated impaired network links based
on the impairment profile which was given as a parameter in the “Goto Impaired Mode”
message. The NetSloth server then creates network traffic filters based on the topology
given as a parameter of the “Goto Impaired Mode” message. Then, based on the filters,
the traffic will be routed through the emulated uplink traffic class, the emulated
downlink traffic class or just pass through the unimpaired root IFB traffic class.
6.6.2 AutoQueue
AutoQueue is another program I wrote for this testing environment. Its purpose is to
automate all the remaining parts of the testing, i.e. setting up the testing environment,
launching the test cases based on a list of planned tests and parameters, and labeling the
test runs in the results database to ease the analysis of results. AutoQueue is written in
ruby and uses a client-server type of management interface. A planning requirement of
this tool was that it should communicate with the existing tools, instead of replacing
them. AutoQueue communicates with Joinker, TestMonkey and NetSloth to automate
the running of test cases.
Support for Joinker-messaging was done by analyzing the source code of the Joinker
client and mimicking the communication behavior described earlier between Joinker
and Joinkee. AutoQueue uses Joinker-messaging to: restart the Windows computers of
the test environment, restart the Sybase database server, load the database from a
database dump and start Tellabs 8000 INM servers and workstations.
The communication between AutoQueue and TestMonkey for starting test runs required
some minor changes to TestMonkey, these changes where implemented by the
developer of TestMonkey, Sami Pyrrö. The network messaging used for starting tests
was planned in a generic way, which allows the AutoQueue-tool to be used in other

44
environments and test cases also. The network messaging for informing AutoQueue
about test completion was done by executing a very simple AutoQueue client from the
test script. The AutoQueue client only sends a message to the AutoQueue server, which
indicates that the test is completed.
The network communication between NetSloth and the network emulator for
configuring the network emulator was implemented by integrating the code from the
NetSloth client to the AutoQueue server. Because both NetSloth and AutoQueue are
running on the same server, there was the option to combine them to one program, or to
use another inter-process-communication method instead of TCP-sockets. I, however,
chose to keep them separate to allow both tools to be used independently. This was
done because there was some interest of using AutoQueue without NetSloth in another
testing environment.
Figure 14 shows the communication between the test automation components in the test
environment. The green lines denote Joinker messaging. When using AutoQueue all of
the essential Joinker-messaging is initiated automatically by the AutoQueue program,
but the manual Joinker client may still be used. Joinker messaging is used to restart the
Windows computers and the database service on the database server, load the database
from a dump file and to start the Tellabs 8000 INM components. The blue lines denote
TestMonkey messaging. AutoQueue will first contact TestMonkey on the Director
computer, the TestMonkey instance on the Director computer will then launch the test
case and assign test scripts to the other workstations. The yellow lines denote the results
gathering of the test, each TestMonkey instance will upload the recorded operation
execution times to the results database. The red line denotes the messaging between
AutoQueue and NetSloth, this messaging is related to the configuration of the network
emulator.
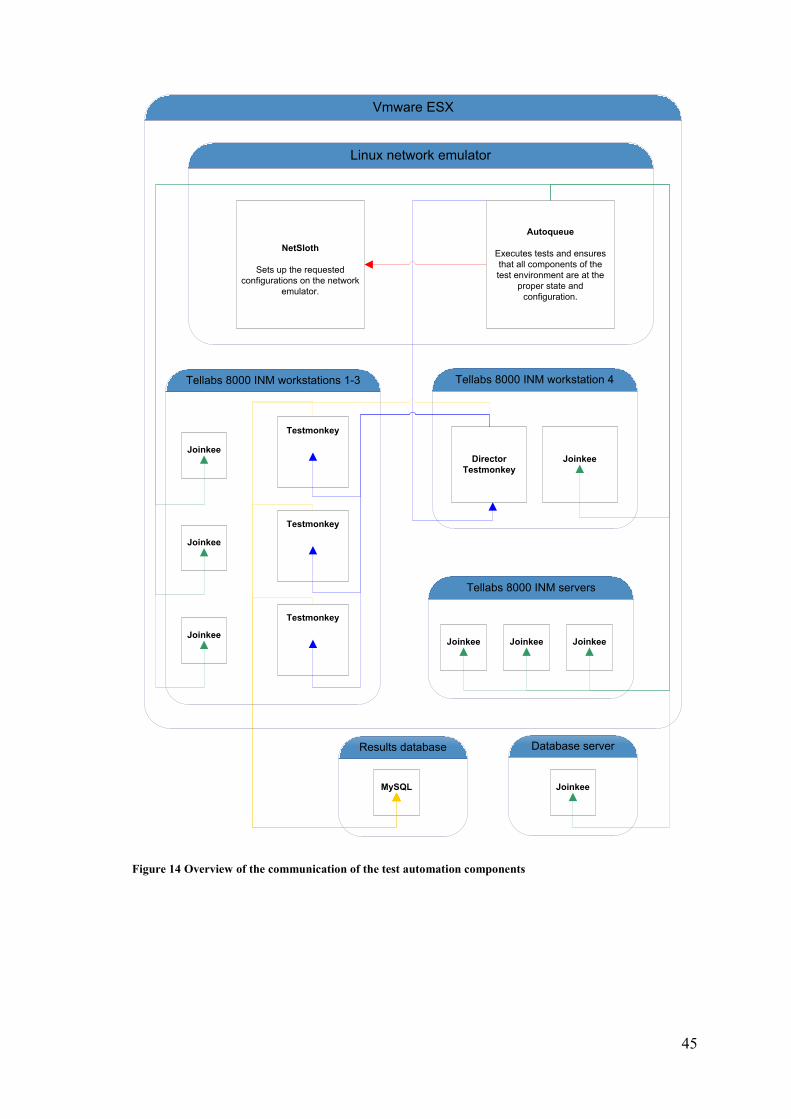
45
MySQL
Linux network emulator
Vmware ESX
Tellabs 8000 INM workstation 4
Joinkee
Tellabs 8000 INM servers
Joinkee Joinkee Joinkee
Tellabs 8000 INM workstations 1-3
Joinkee
Joinkee
Joinkee
Testmonkey
Testmonkey
Testmonkey
NetSloth
Sets up the requested configurations on the network
emulator.
Database server
Joinkee
Autoqueue
Executes tests and ensures that all components of the test environment are at the
proper state and configuration.
Results database
Director Testmonkey
Figure 14 Overview of the communication of the test automation components
46
6.7 Planning of the test cases
As a base for the test cases are the Multi user test created by Ilmo Savolainen in his
master thesis “Benchmark testing of Network Management System”. 40 users will be
simulated by executing 10 macro test scripts on each of the four Tellabs 8000 INM
workstation computers. The reason for selecting 40 users instead of 50, which has
become a standard amount in many of the multiuser test environments at Tellabs, is that
there are 5 unique macro test scripts and 4 Tellabs 8000 INM workstation computers in
this network. Because the results will also be analyzed by comparing the performance
of the separate workstation computers, they should all be executing the same test scripts.
More than 50 simultaneous test script macros have not been tested in this testing
environment and I did not want to expand the user amount in addition to the network
impairments which were introduced for this testing. 40 simultaneous test macro scripts
equals to two simultaneous instances of each unique macro script on each workstation.
Each test case is a unique combination of a simulated network topology in which the
network is split in two separate sites and a network link impairment profile. There are
seven planned test topologies and four planned network impairment profiles. Because
each test case is run twice to ensure consistency of the results, this adds up to 56 test
runs. While it is likely that some of the planned test cases will have such bad
performance that no reliable numeric performance results can be collected, they might
still provide valuable information about the behavior of the Tellabs 8000 INM in
challenged networks.
6.7.1 Topologies
There are seven network topologies planned for the test tests in this environment. The
topologies are selected based on expectations on how customers might build the
management network, all of the topologies however are not recommended
configurations.
The first topology, named “1-standard”, shown in Figure 15, is a reference case where
all Tellabs 8000 INM management network components are at the same site, all
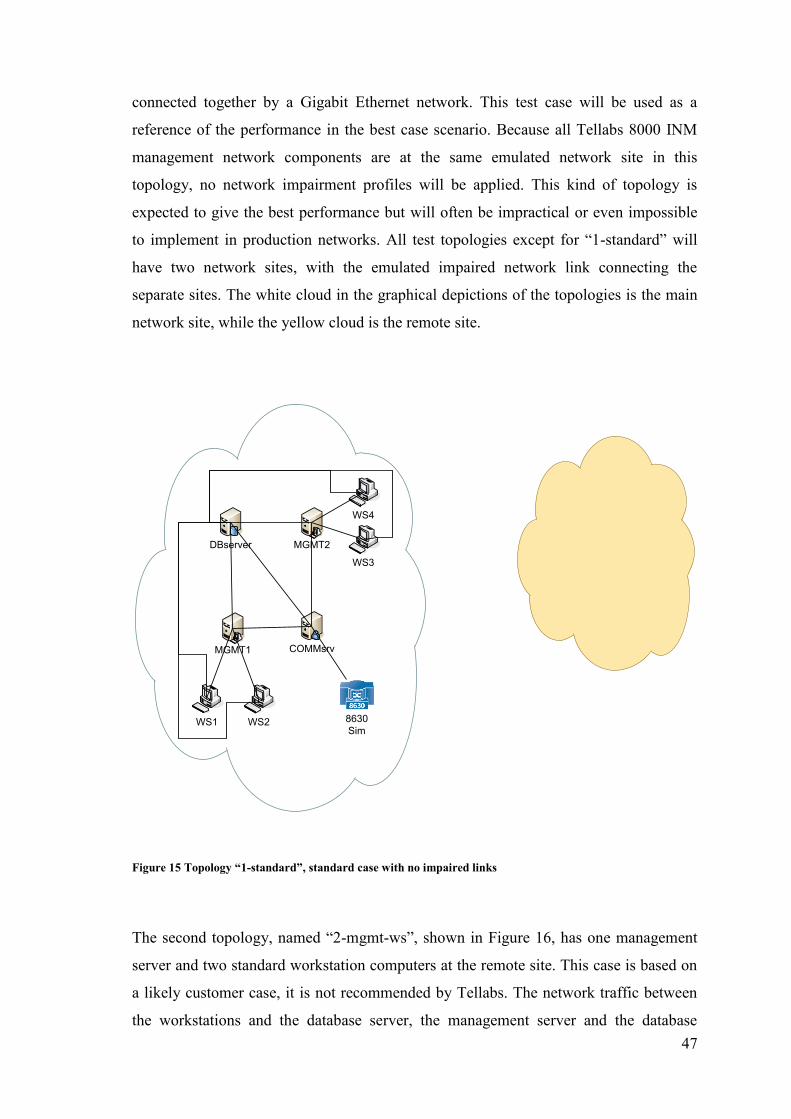
47
connected together by a Gigabit Ethernet network. This test case will be used as a
reference of the performance in the best case scenario. Because all Tellabs 8000 INM
management network components are at the same emulated network site in this
topology, no network impairment profiles will be applied. This kind of topology is
expected to give the best performance but will often be impractical or even impossible
to implement in production networks. All test topologies except for “1-standard” will
have two network sites, with the emulated impaired network link connecting the
separate sites. The white cloud in the graphical depictions of the topologies is the main
network site, while the yellow cloud is the remote site.
WS1 WS2
WS3
WS4
MGMT1
MGMT2DBserver
COMMsrv
8630 Sim
Figure 15 Topology “1-standard”, standard case with no impaired links
The second topology, named “2-mgmt-ws”, shown in Figure 16, has one management
server and two standard workstation computers at the remote site. This case is based on
a likely customer case, it is not recommended by Tellabs. The network traffic between
the workstations and the database server, the management server and the database
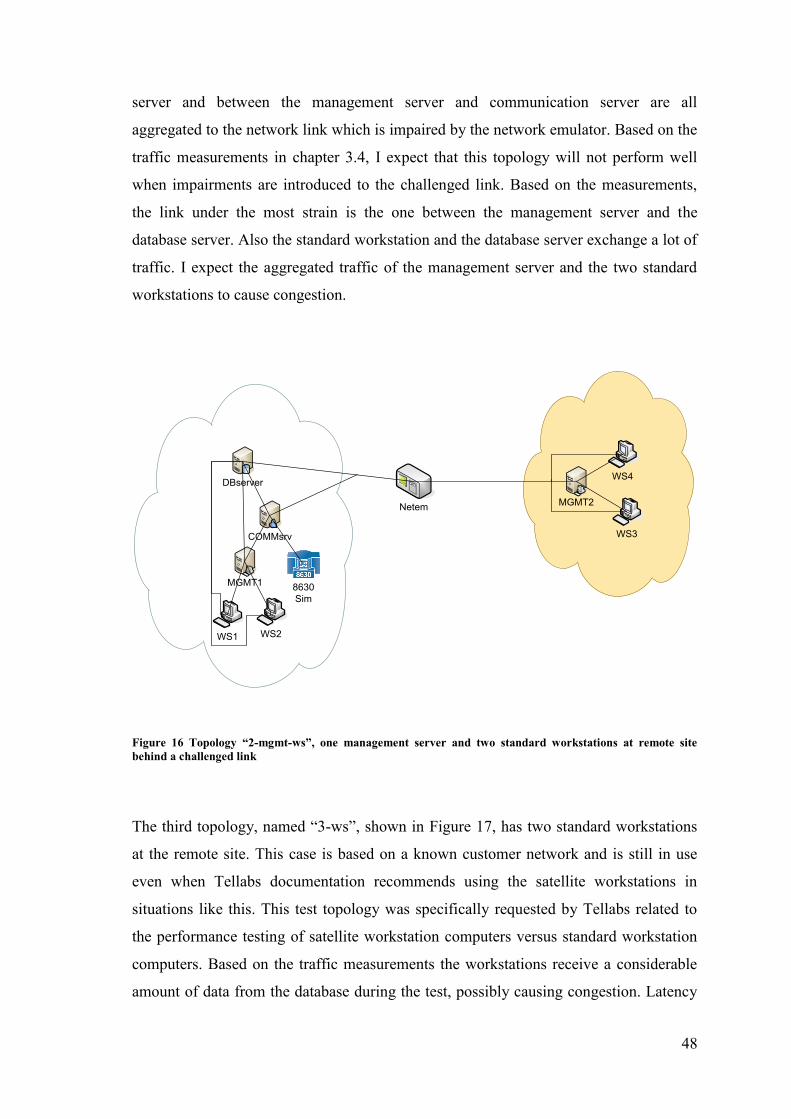
48
server and between the management server and communication server are all
aggregated to the network link which is impaired by the network emulator. Based on the
traffic measurements in chapter 3.4, I expect that this topology will not perform well
when impairments are introduced to the challenged link. Based on the measurements,
the link under the most strain is the one between the management server and the
database server. Also the standard workstation and the database server exchange a lot of
traffic. I expect the aggregated traffic of the management server and the two standard
workstations to cause congestion.
Netem
WS1 WS2
WS3
WS4
MGMT1
MGMT2
DBserver
COMMsrv
8630 Sim
Figure 16 Topology “2-mgmt-ws”, one management server and two standard workstations at remote site behind a challenged link
The third topology, named “3-ws”, shown in Figure 17, has two standard workstations
at the remote site. This case is based on a known customer network and is still in use
even when Tellabs documentation recommends using the satellite workstations in
situations like this. This test topology was specifically requested by Tellabs related to
the performance testing of satellite workstation computers versus standard workstation
computers. Based on the traffic measurements the workstations receive a considerable
amount of data from the database during the test, possibly causing congestion. Latency
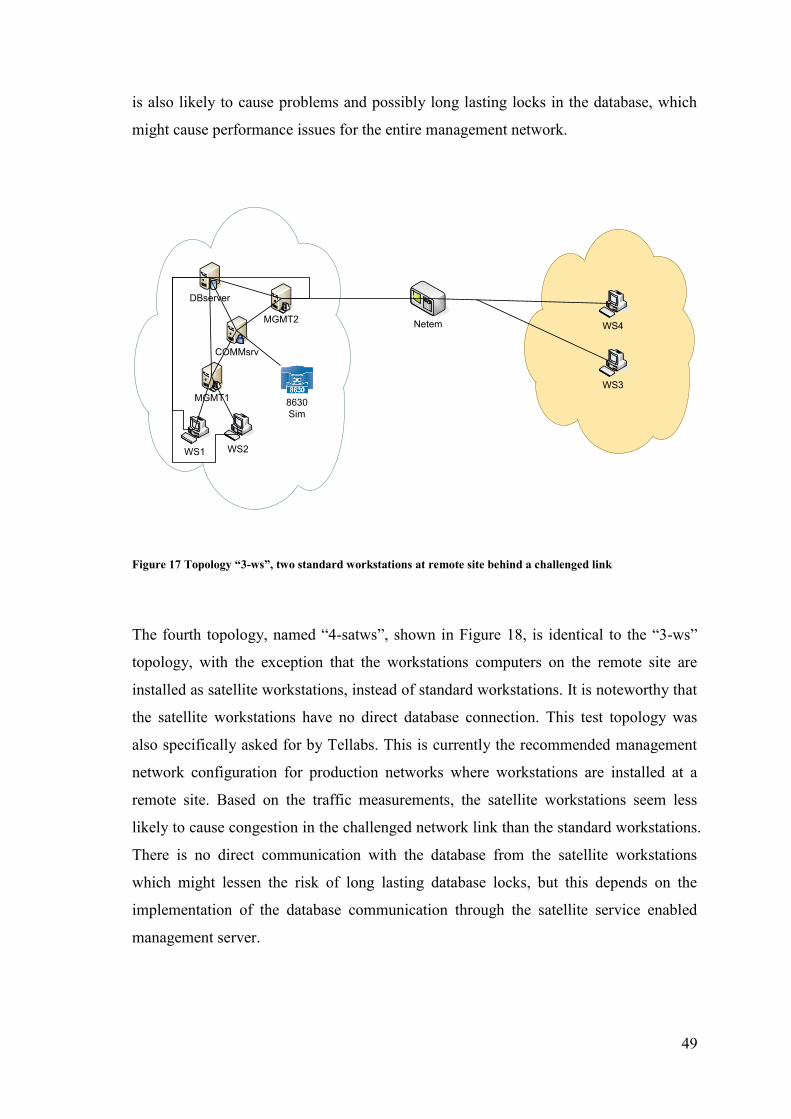
49
is also likely to cause problems and possibly long lasting locks in the database, which
might cause performance issues for the entire management network.
Netem
WS1 WS2
WS3
WS4
MGMT1
MGMT2
DBserver
COMMsrv
8630 Sim
Figure 17 Topology “3-ws”, two standard workstations at remote site behind a challenged link
The fourth topology, named “4-satws”, shown in Figure 18, is identical to the “3-ws”
topology, with the exception that the workstations computers on the remote site are
installed as satellite workstations, instead of standard workstations. It is noteworthy that
the satellite workstations have no direct database connection. This test topology was
also specifically asked for by Tellabs. This is currently the recommended management
network configuration for production networks where workstations are installed at a
remote site. Based on the traffic measurements, the satellite workstations seem less
likely to cause congestion in the challenged network link than the standard workstations.
There is no direct communication with the database from the satellite workstations
which might lessen the risk of long lasting database locks, but this depends on the
implementation of the database communication through the satellite service enabled
management server.
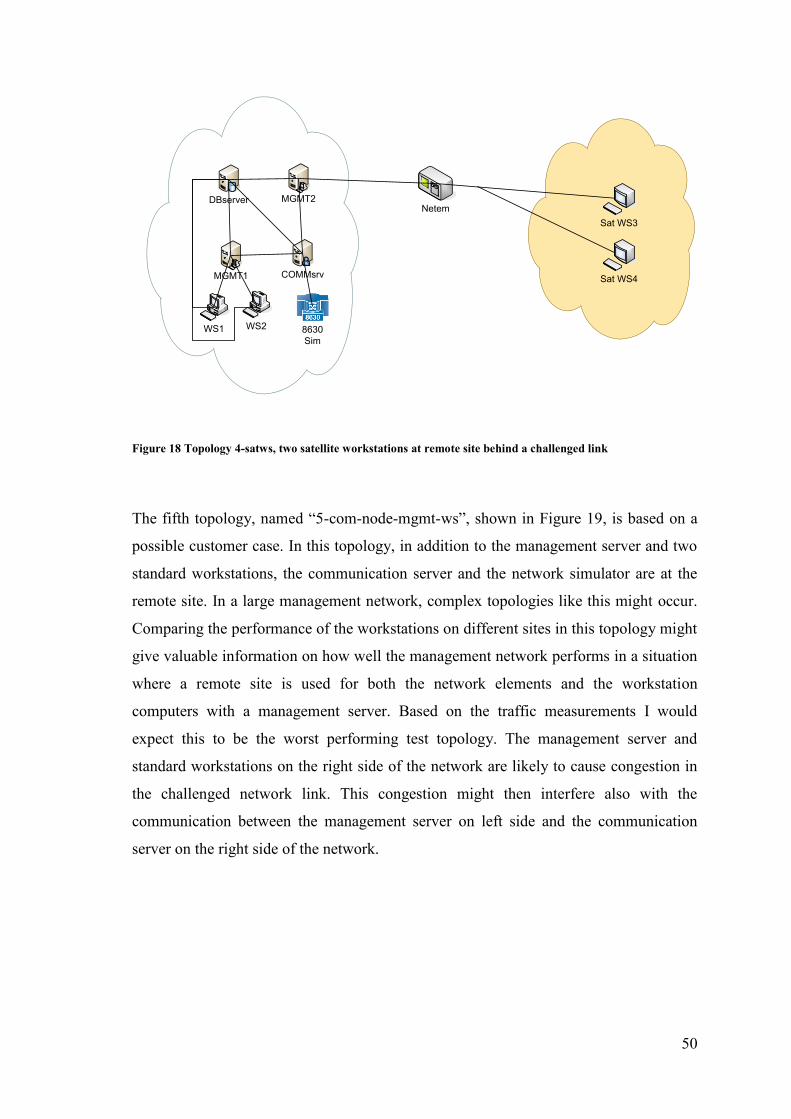
50
Netem
WS1 WS2
MGMT1
MGMT2DBserver
COMMsrv
Sat WS3
Sat WS4
8630 Sim
Figure 18 Topology 4-satws, two satellite workstations at remote site behind a challenged link
The fifth topology, named “5-com-node-mgmt-ws”, shown in Figure 19, is based on a
possible customer case. In this topology, in addition to the management server and two
standard workstations, the communication server and the network simulator are at the
remote site. In a large management network, complex topologies like this might occur.
Comparing the performance of the workstations on different sites in this topology might
give valuable information on how well the management network performs in a situation
where a remote site is used for both the network elements and the workstation
computers with a management server. Based on the traffic measurements I would
expect this to be the worst performing test topology. The management server and
standard workstations on the right side of the network are likely to cause congestion in
the challenged network link. This congestion might then interfere also with the
communication between the management server on left side and the communication
server on the right side of the network.
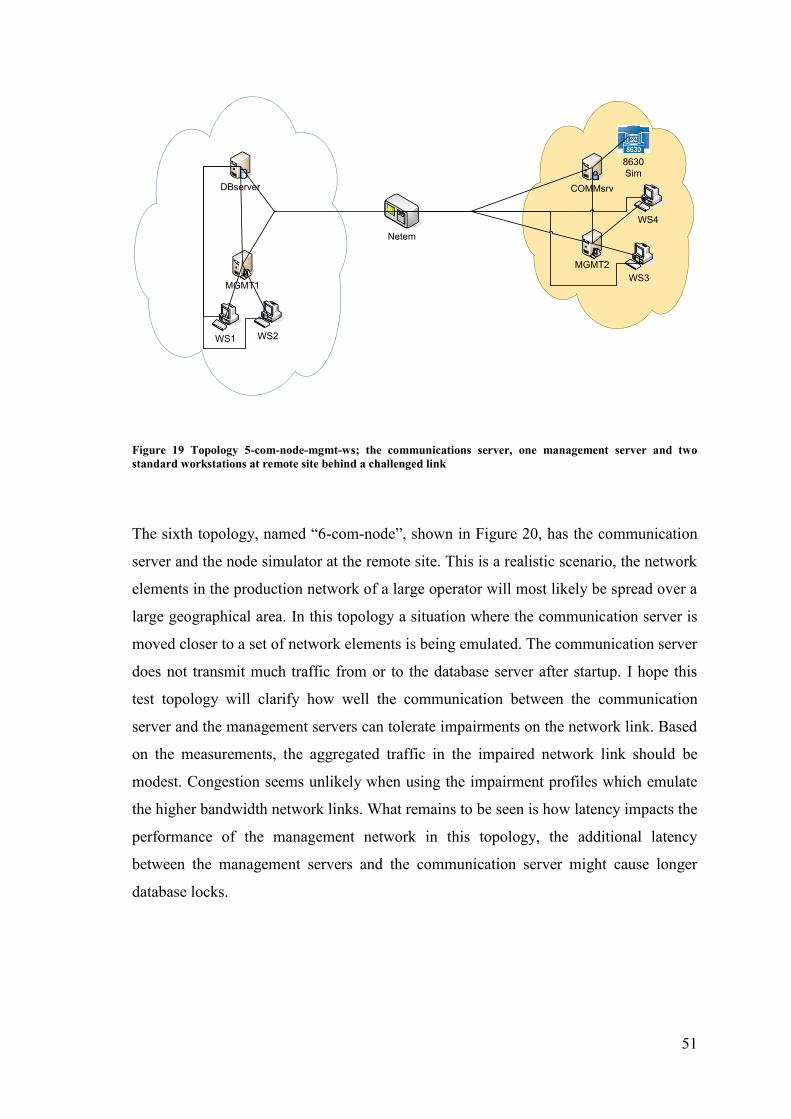
51
Netem
WS1 WS2
WS3
WS4
MGMT1
MGMT2
DBserver COMMsrv
8630 Sim
Figure 19 Topology 5-com-node-mgmt-ws; the communications server, one management server and two standard workstations at remote site behind a challenged link
The sixth topology, named “6-com-node”, shown in Figure 20, has the communication
server and the node simulator at the remote site. This is a realistic scenario, the network
elements in the production network of a large operator will most likely be spread over a
large geographical area. In this topology a situation where the communication server is
moved closer to a set of network elements is being emulated. The communication server
does not transmit much traffic from or to the database server after startup. I hope this
test topology will clarify how well the communication between the communication
server and the management servers can tolerate impairments on the network link. Based
on the measurements, the aggregated traffic in the impaired network link should be
modest. Congestion seems unlikely when using the impairment profiles which emulate
the higher bandwidth network links. What remains to be seen is how latency impacts the
performance of the management network in this topology, the additional latency
between the management servers and the communication server might cause longer
database locks.
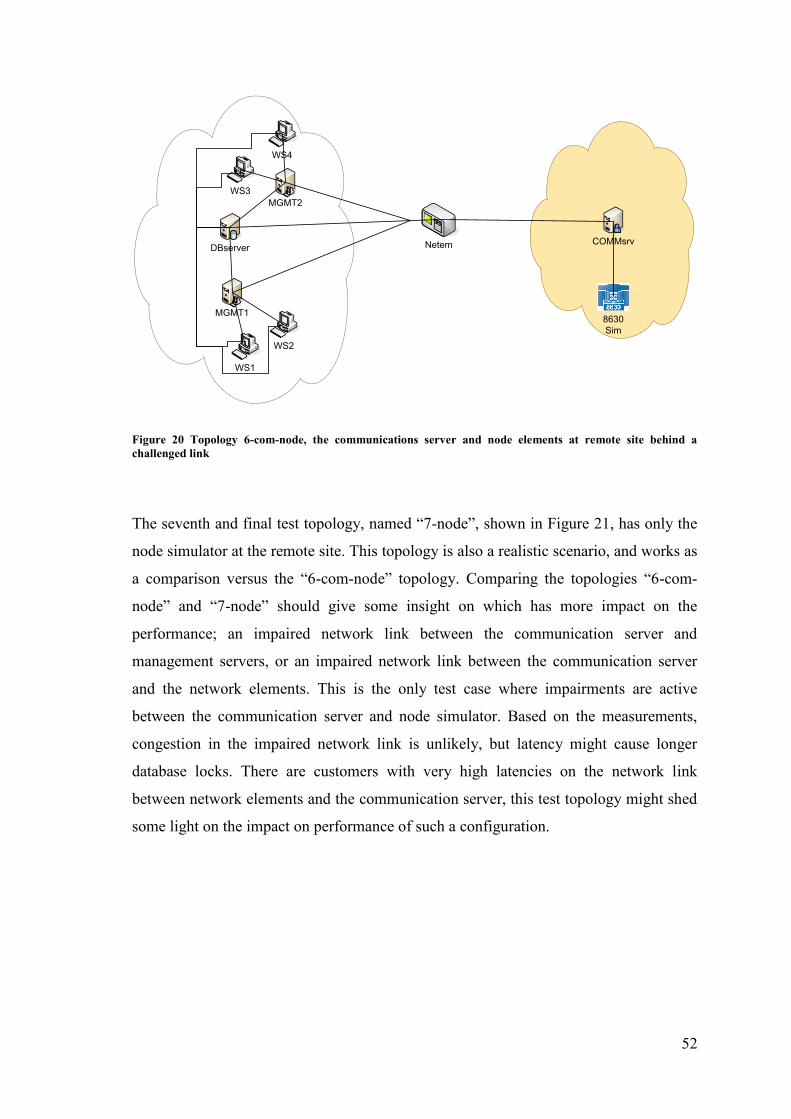
52
Netem
WS1
WS2
WS3
WS4
MGMT1
MGMT2
DBserverCOMMsrv
8630 Sim
Figure 20 Topology 6-com-node, the communications server and node elements at remote site behind a challenged link
The seventh and final test topology, named “7-node”, shown in Figure 21, has only the
node simulator at the remote site. This topology is also a realistic scenario, and works as
a comparison versus the “6-com-node” topology. Comparing the topologies “6-com-
node” and “7-node” should give some insight on which has more impact on the
performance; an impaired network link between the communication server and
management servers, or an impaired network link between the communication server
and the network elements. This is the only test case where impairments are active
between the communication server and node simulator. Based on the measurements,
congestion in the impaired network link is unlikely, but latency might cause longer
database locks. There are customers with very high latencies on the network link
between network elements and the communication server, this test topology might shed
some light on the impact on performance of such a configuration.
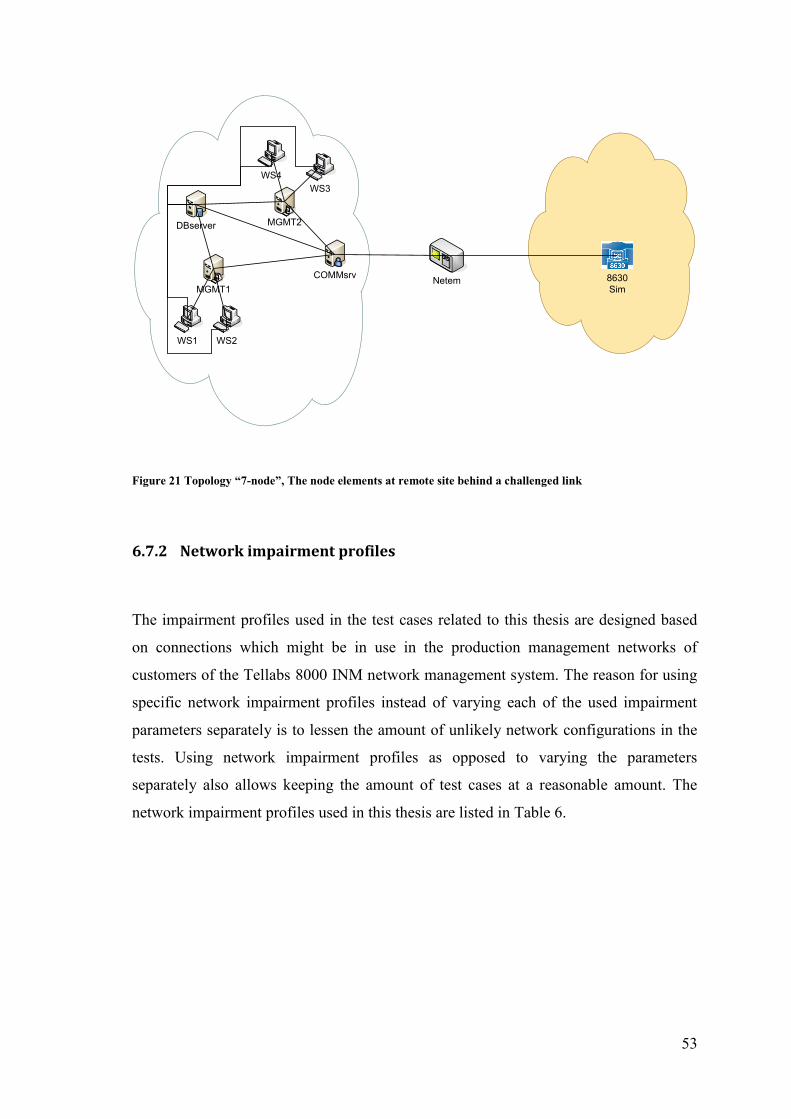
53
Netem
WS1 WS2
WS3WS4
MGMT1
MGMT2DBserver
COMMsrv 8630 Sim
Figure 21 Topology “7-node”, The node elements at remote site behind a challenged link
6.7.2 Network impairment profiles
The impairment profiles used in the test cases related to this thesis are designed based
on connections which might be in use in the production management networks of
customers of the Tellabs 8000 INM network management system. The reason for using
specific network impairment profiles instead of varying each of the used impairment
parameters separately is to lessen the amount of unlikely network configurations in the
tests. Using network impairment profiles as opposed to varying the parameters
separately also allows keeping the amount of test cases at a reasonable amount. The
network impairment profiles used in this thesis are listed in Table 6.

54
Table 6 Network impairment profiles
Impairment profile name
Downlink rate
Uplink rate
RTT latency
Packet loss probability, per link
ISDN 128/128 kbit 128 kbit/s 128 kbit/s 80ms 0.01%
DSL 2/1 Mbit 2048 kbit/s 1024 kbit/s 20ms 0.01%
DSL 10/2 Mbit 10 Mbit/s 2 Mbit/s 10ms 0.001%
LAN 10/10 Mbit 10 Mbit/s 10 Mbit/s 0ms 0.0%
LAN 100/100 Mbit 100 Mbit/s 100 Mbit/s 0ms 0.0%
The most challenged of the impairment profiles is the “ISDN 128/128 kbit” impairment
profile. While a connection like this is unlikely in a customer’s management network,
the performance of the impairment profile might resemble the performance of a setup
where the connection is being shared with other traffic. According to Tellabs internal
documentation [13], there are customer networks which have Tellabs 8000 INM
management network components connected using DSL connections. The same goes
for LAN connections. The reason for omitting the very likely gigabit Ethernet
connection from the list of planned impairment profiles is because a gigabit Ethernet
connection is the fastest connection type this testing environment can achieve. Testing
with a gigabit Ethernet impairment profile would equate to testing without any
challenged network links, this is done in the test topology “1-standard”.
6.8 Final test setup
The final test setup is built using the components described in chapters 5 and 6. The
base is the VMware virtual environment where the virtual machines have been created.
One of the virtual machines is the Linux computer which is running the NetSloth and
AutoQueue programs. The test cases are configured for AutoQueue using Comma
Separated Value (CSV) formatted files and executed automatically. The test topologies
and network impairment profiles for each test case are defined in the CSV-file.
To avoid systematic errors, logging is implemented in the NetSloth program. From the
logs the state of the network emulator during a test run can be verified. The Linux
system logging daemon is also enabled on the network emulator, the system log can be
used to ensure that the Linux Traffic Control Subsystem does not raise any errors during

55
the tests. In addition to the logs, there is active monitoring which helps ensuring that the
test results are valid, for every test run a batch script is run on the director monkey
workstation. The script monitors the latency to each of the Tellabs 8000 management
network component computers, the results are logged and may be used to verify the
configuration by comparing the logged latency values against the base latency of the
used impairment profile.
To verify the reliability of the measurements, the accuracy of the testing setup will be
estimated for the first test topology based on the results of running the same test case 11
times. For verification of the results each test case is run twice. If the results of the two
test runs differ more than the estimated accuracy then the test should be rerun. The
overall reliability of the multiuser tests are outside the scope of this thesis, these
additional verifications are used to avoid any unexpected errors of measurement.
56
7 Result from tests
In this chapter the results from the multiuser performance tests are presented. These
results were of great interest to Tellabs Oy as they answered many of the open questions
related to the topologies in use at customer management networks. The results also
confirmed that the recommended network topologies provide the best performance and
reliability of the management network. The Tellabs 8000 INM is versatile and can be
configured and used in many different ways, these tests use only a certain subset of the
available features. This should be taken into consideration when making any
conclusions based on the results.
7.1 Result analysis information
All the test cases were not usable configurations, some of the test cases even caused
some component to disconnect or fail because of bad performance. Because of the way
the tests were planned, there were two Tellabs 8000 management server computers and
four Tellabs 8000 workstation computers, one failure does not always mean that all test
scripts stop execution. A case where a part of the test scripts stop, but the others
continue execution will impact the different result metrics in different ways. If for
example one management server shuts down during the test, only half of the test scripts
will continue execution. This means that the remaining test scripts will get better
performance in terms of execution times, as the other components of the network, e.g.
the communication server and database server will receive fewer requests than when all
test scripts were running. The sum of executed operations will on the other hand show a
worse performance than what might reflect the reality. Because the macro test scripts
simulate real users with wait times between the operations, having less test scripts
running will mean a smaller sum of operations.
A single metric will not be too useful when analyzing the results; this is caused by the
test topologies, which are planned in such a way that some test script macros are
directly impacted by the challenged network links, while some have no direct
communication over those links. This means that the average operation times, median
57
operation times and the sum of executed operations will all describe the performance
from different aspects. The median is an important factor in terms of usability, as it is
less impacted by rare maximum values. The average better describes the performance
with taking into account the worst case execution times. The total operation count
should be a good metric on the performance of the entire system, but does not give
direct information on usability.
Because there are so many distinctive INM operations being done in each of the
multiuser tests, rather than comparing the performance of each operation separately, a
couple of aggregated values will be presented. The Sum Of Medians of each unique
operation (SoM) is calculated by first calculating the median time for each unique INM
operation, the SoM-value is then the sum of these median values. The Sum Of Averages
of each unique operation (SoA) is calculated in the same way as the SoM, except that
the arithmetic mean of the unique operations is used instead of the median.
The test cases were planned in a way which has each of the four workstations running
the exact same set of macro test scripts. This means comparisons can be made also
between the performance metrics of the workstation computers, which in many cases
are impacted differently by the challenges in the management network.
Because of the large amount of test cases, all test cases cannot be rerun too many times.
Based on the time I had to use for testing in the environment, I chose to run each test
case twice. This is not enough to estimate the accuracy of the measurements separately
for each test case. The results on the successful test runs, i.e. the ones where no Tellabs
8000 INM components disconnected, seemed reliable. Because of the inability to
calculate good estimates of the accuracy of the results of the individual tests cases, the
test cases which could not be run to the end with all macro test scripts running should be
considered unreliable.
It is important to keep in mind that the results presented in this thesis cannot be used for
comparison with any other network management software or tools. For comparison with
any other network management system the test cases should be defined clearly for a fair
comparison. Also computer resources should be standardized between the tests, the
network size standardized and clear testing guidelines written. Caution should be used
also when using the results as recommendations of the topologies and required network
performance. For different networks different sets of features are used and the tasks
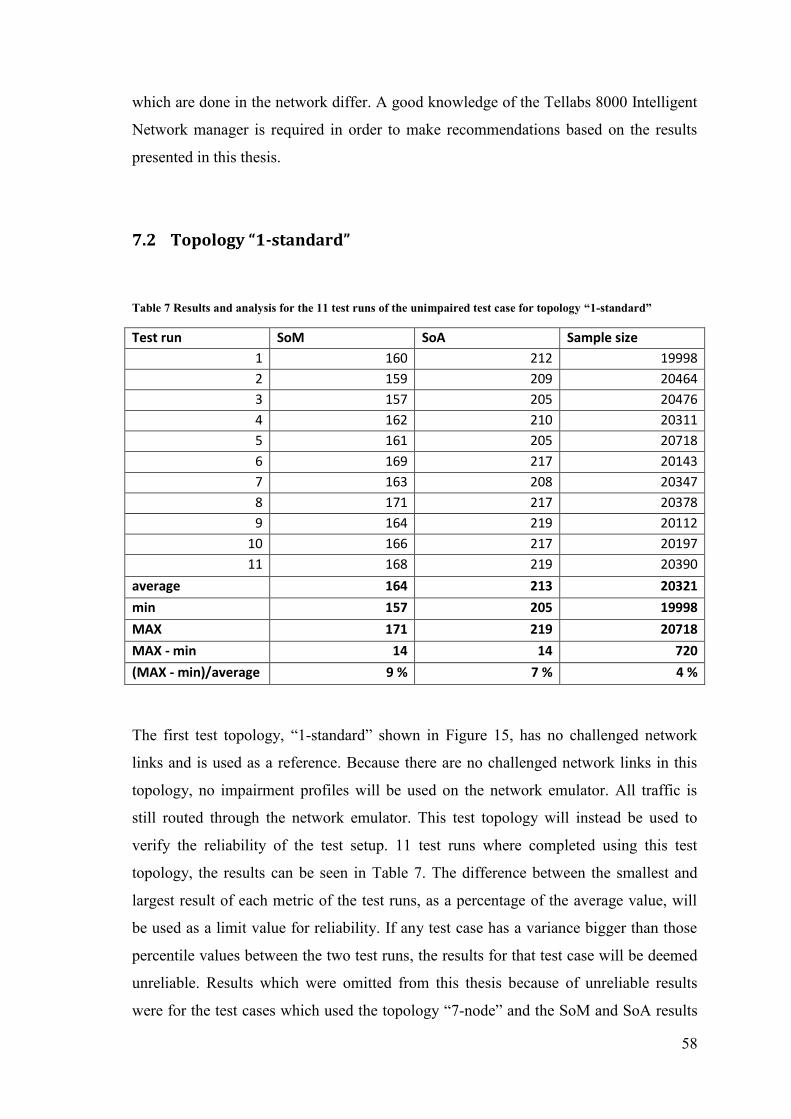
58
which are done in the network differ. A good knowledge of the Tellabs 8000 Intelligent
Network manager is required in order to make recommendations based on the results
presented in this thesis.
7.2 Topology “1-standard”
Table 7 Results and analysis for the 11 test runs of the unimpaired test case for topology “1-standard”
Test run SoM SoA Sample size
1 160 212 19998
2 159 209 20464
3 157 205 20476
4 162 210 20311
5 161 205 20718
6 169 217 20143
7 163 208 20347
8 171 217 20378
9 164 219 20112
10 166 217 20197
11 168 219 20390
average 164 213 20321
min 157 205 19998
MAX 171 219 20718
MAX - min 14 14 720
(MAX - min)/average 9 % 7 % 4 %
The first test topology, “1-standard” shown in Figure 15, has no challenged network
links and is used as a reference. Because there are no challenged network links in this
topology, no impairment profiles will be used on the network emulator. All traffic is
still routed through the network emulator. This test topology will instead be used to
verify the reliability of the test setup. 11 test runs where completed using this test
topology, the results can be seen in Table 7. The difference between the smallest and
largest result of each metric of the test runs, as a percentage of the average value, will
be used as a limit value for reliability. If any test case has a variance bigger than those
percentile values between the two test runs, the results for that test case will be deemed
unreliable. Results which were omitted from this thesis because of unreliable results
were for the test cases which used the topology “7-node” and the SoM and SoA results
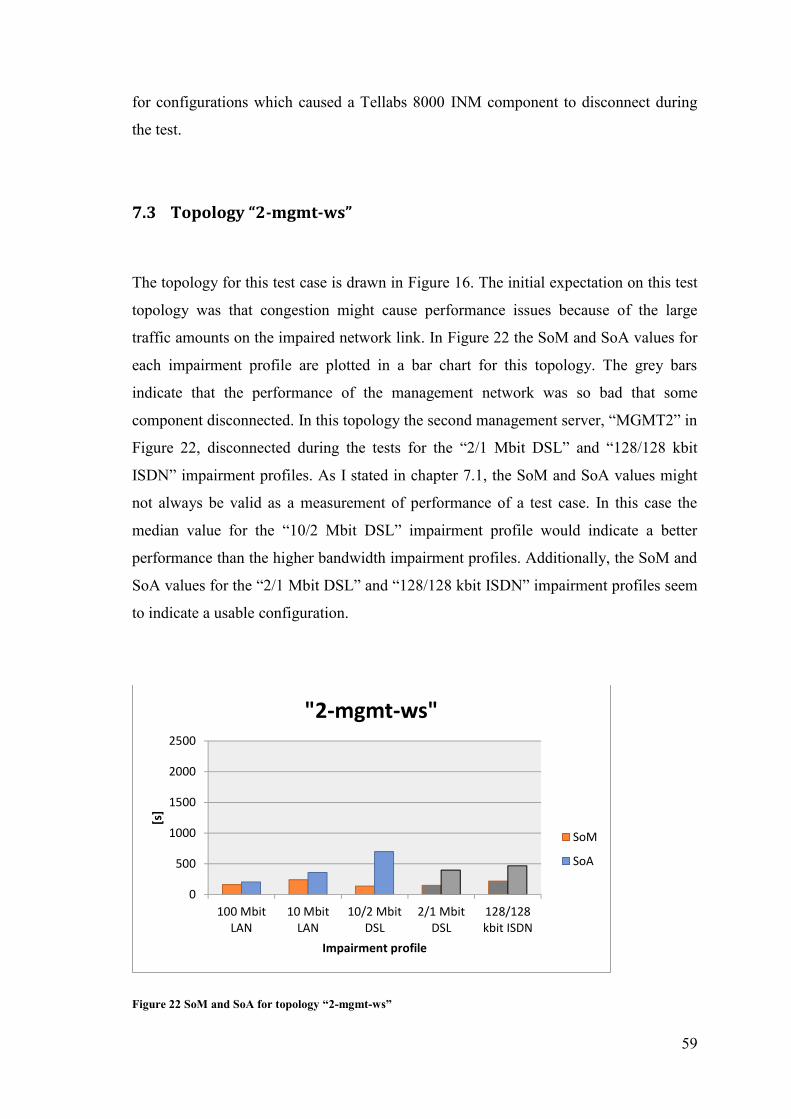
59
for configurations which caused a Tellabs 8000 INM component to disconnect during
the test.
7.3 Topology “2-mgmt-ws”
The topology for this test case is drawn in Figure 16. The initial expectation on this test
topology was that congestion might cause performance issues because of the large
traffic amounts on the impaired network link. In Figure 22 the SoM and SoA values for
each impairment profile are plotted in a bar chart for this topology. The grey bars
indicate that the performance of the management network was so bad that some
component disconnected. In this topology the second management server, “MGMT2” in
Figure 22, disconnected during the tests for the “2/1 Mbit DSL” and “128/128 kbit
ISDN” impairment profiles. As I stated in chapter 7.1, the SoM and SoA values might
not always be valid as a measurement of performance of a test case. In this case the
median value for the “10/2 Mbit DSL” impairment profile would indicate a better
performance than the higher bandwidth impairment profiles. Additionally, the SoM and
SoA values for the “2/1 Mbit DSL” and “128/128 kbit ISDN” impairment profiles seem
to indicate a usable configuration.
Figure 22 SoM and SoA for topology “2-mgmt-ws”
0
500
1000
1500
2000
2500
100 MbitLAN
10 MbitLAN
10/2 MbitDSL
2/1 MbitDSL
128/128kbit ISDN
[s]
Impairment profile
"2-mgmt-ws"
SoM
SoA
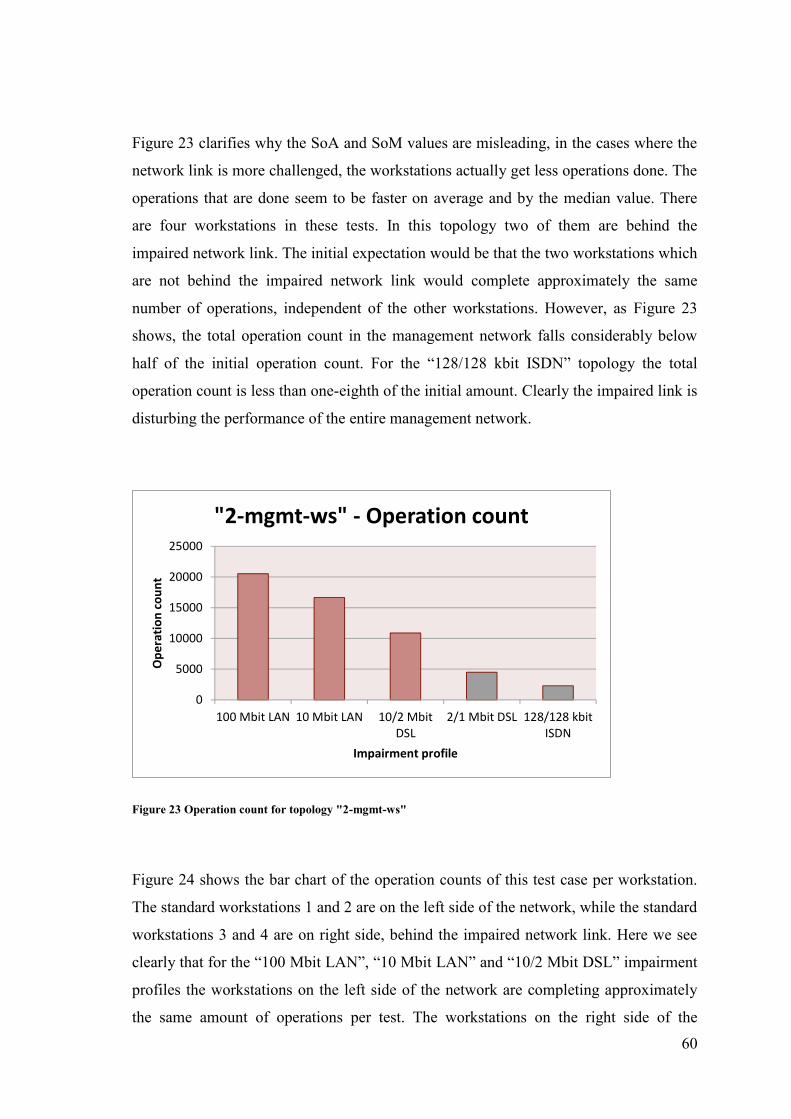
60
Figure 23 clarifies why the SoA and SoM values are misleading, in the cases where the
network link is more challenged, the workstations actually get less operations done. The
operations that are done seem to be faster on average and by the median value. There
are four workstations in these tests. In this topology two of them are behind the
impaired network link. The initial expectation would be that the two workstations which
are not behind the impaired network link would complete approximately the same
number of operations, independent of the other workstations. However, as Figure 23
shows, the total operation count in the management network falls considerably below
half of the initial operation count. For the “128/128 kbit ISDN” topology the total
operation count is less than one-eighth of the initial amount. Clearly the impaired link is
disturbing the performance of the entire management network.
Figure 23 Operation count for topology "2-mgmt-ws"
Figure 24 shows the bar chart of the operation counts of this test case per workstation.
The standard workstations 1 and 2 are on the left side of the network, while the standard
workstations 3 and 4 are on right side, behind the impaired network link. Here we see
clearly that for the “100 Mbit LAN”, “10 Mbit LAN” and “10/2 Mbit DSL” impairment
profiles the workstations on the left side of the network are completing approximately
the same amount of operations per test. The workstations on the right side of the
0
5000
10000
15000
20000
25000
100 Mbit LAN 10 Mbit LAN 10/2 MbitDSL
2/1 Mbit DSL 128/128 kbitISDN
Op
era
tio
n c
ou
nt
Impairment profile
"2-mgmt-ws" - Operation count
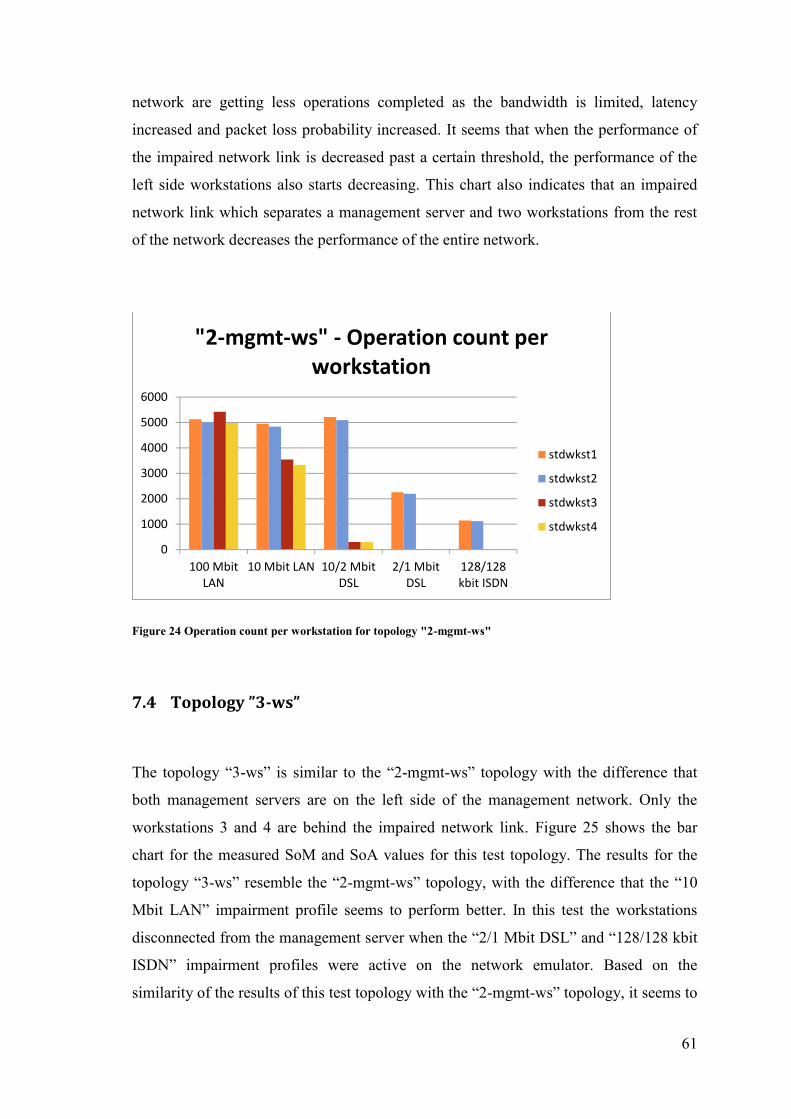
61
network are getting less operations completed as the bandwidth is limited, latency
increased and packet loss probability increased. It seems that when the performance of
the impaired network link is decreased past a certain threshold, the performance of the
left side workstations also starts decreasing. This chart also indicates that an impaired
network link which separates a management server and two workstations from the rest
of the network decreases the performance of the entire network.
Figure 24 Operation count per workstation for topology "2-mgmt-ws"
7.4 Topology ”3-ws”
The topology “3-ws” is similar to the “2-mgmt-ws” topology with the difference that
both management servers are on the left side of the management network. Only the
workstations 3 and 4 are behind the impaired network link. Figure 25 shows the bar
chart for the measured SoM and SoA values for this test topology. The results for the
topology “3-ws” resemble the “2-mgmt-ws” topology, with the difference that the “10
Mbit LAN” impairment profile seems to perform better. In this test the workstations
disconnected from the management server when the “2/1 Mbit DSL” and “128/128 kbit
ISDN” impairment profiles were active on the network emulator. Based on the
similarity of the results of this test topology with the “2-mgmt-ws” topology, it seems to
0
1000
2000
3000
4000
5000
6000
100 MbitLAN
10 Mbit LAN 10/2 MbitDSL
2/1 MbitDSL
128/128kbit ISDN
"2-mgmt-ws" - Operation count per workstation
stdwkst1
stdwkst2
stdwkst3
stdwkst4
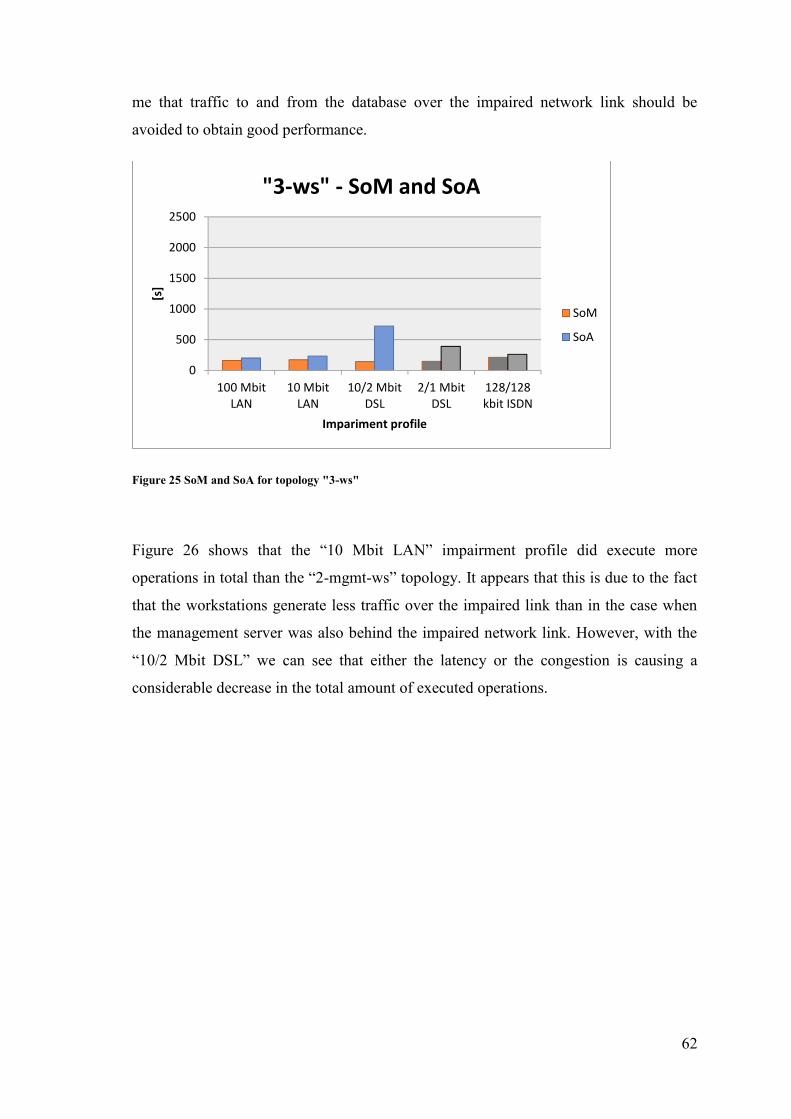
62
me that traffic to and from the database over the impaired network link should be
avoided to obtain good performance.
Figure 25 SoM and SoA for topology "3-ws"
Figure 26 shows that the “10 Mbit LAN” impairment profile did execute more
operations in total than the “2-mgmt-ws” topology. It appears that this is due to the fact
that the workstations generate less traffic over the impaired link than in the case when
the management server was also behind the impaired network link. However, with the
“10/2 Mbit DSL” we can see that either the latency or the congestion is causing a
considerable decrease in the total amount of executed operations.
0
500
1000
1500
2000
2500
100 MbitLAN
10 MbitLAN
10/2 MbitDSL
2/1 MbitDSL
128/128kbit ISDN
[s]
Impariment profile
"3-ws" - SoM and SoA
SoM
SoA
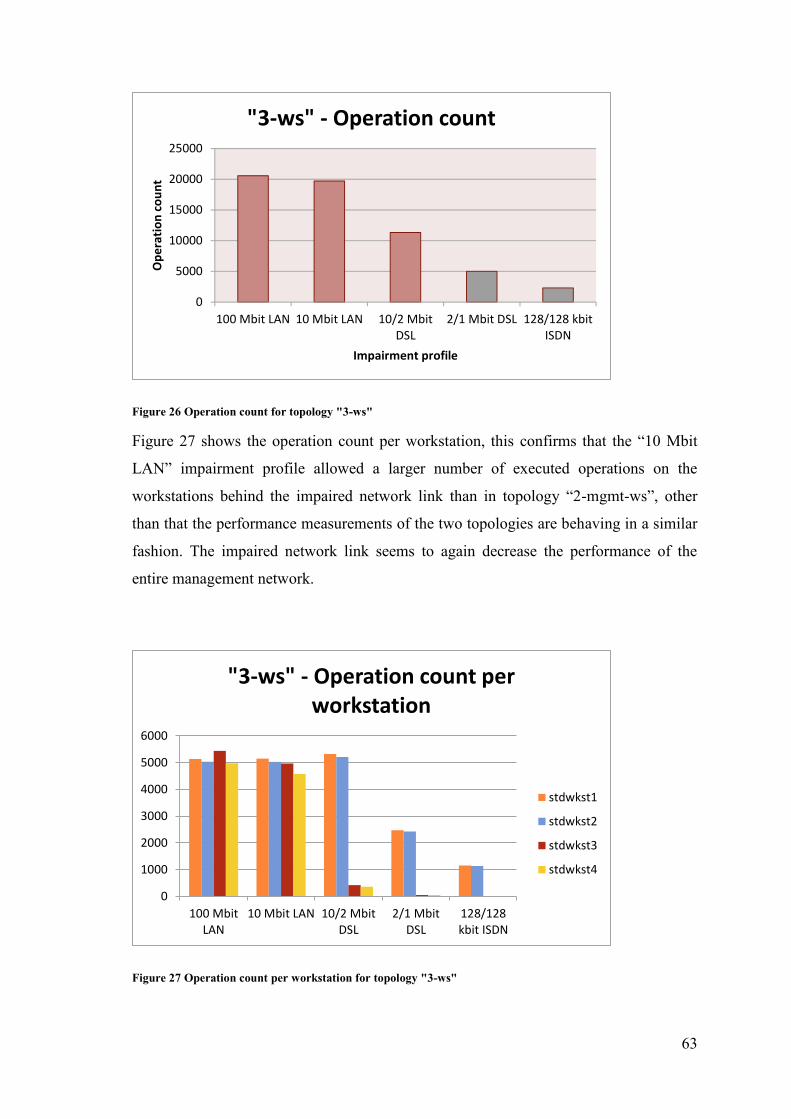
63
Figure 26 Operation count for topology "3-ws"
Figure 27 shows the operation count per workstation, this confirms that the “10 Mbit
LAN” impairment profile allowed a larger number of executed operations on the
workstations behind the impaired network link than in topology “2-mgmt-ws”, other
than that the performance measurements of the two topologies are behaving in a similar
fashion. The impaired network link seems to again decrease the performance of the
entire management network.
Figure 27 Operation count per workstation for topology "3-ws"
0
5000
10000
15000
20000
25000
100 Mbit LAN 10 Mbit LAN 10/2 MbitDSL
2/1 Mbit DSL 128/128 kbitISDN
Op
era
tio
n c
ou
nt
Impairment profile
"3-ws" - Operation count
0
1000
2000
3000
4000
5000
6000
100 MbitLAN
10 Mbit LAN 10/2 MbitDSL
2/1 MbitDSL
128/128kbit ISDN
"3-ws" - Operation count per workstation
stdwkst1
stdwkst2
stdwkst3
stdwkst4
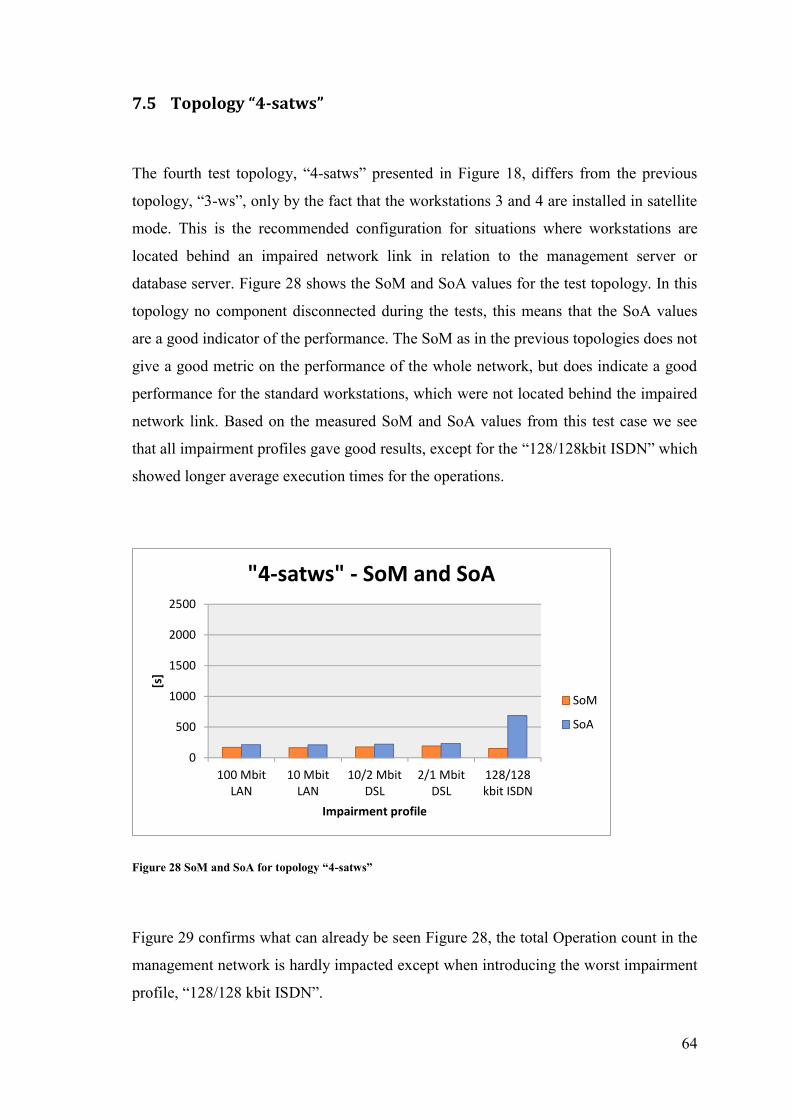
64
7.5 Topology “4-satws”
The fourth test topology, “4-satws” presented in Figure 18, differs from the previous
topology, “3-ws”, only by the fact that the workstations 3 and 4 are installed in satellite
mode. This is the recommended configuration for situations where workstations are
located behind an impaired network link in relation to the management server or
database server. Figure 28 shows the SoM and SoA values for the test topology. In this
topology no component disconnected during the tests, this means that the SoA values
are a good indicator of the performance. The SoM as in the previous topologies does not
give a good metric on the performance of the whole network, but does indicate a good
performance for the standard workstations, which were not located behind the impaired
network link. Based on the measured SoM and SoA values from this test case we see
that all impairment profiles gave good results, except for the “128/128kbit ISDN” which
showed longer average execution times for the operations.
Figure 28 SoM and SoA for topology “4-satws”
Figure 29 confirms what can already be seen Figure 28, the total Operation count in the
management network is hardly impacted except when introducing the worst impairment
profile, “128/128 kbit ISDN”.
0
500
1000
1500
2000
2500
100 MbitLAN
10 MbitLAN
10/2 MbitDSL
2/1 MbitDSL
128/128kbit ISDN
[s]
Impairment profile
"4-satws" - SoM and SoA
SoM
SoA
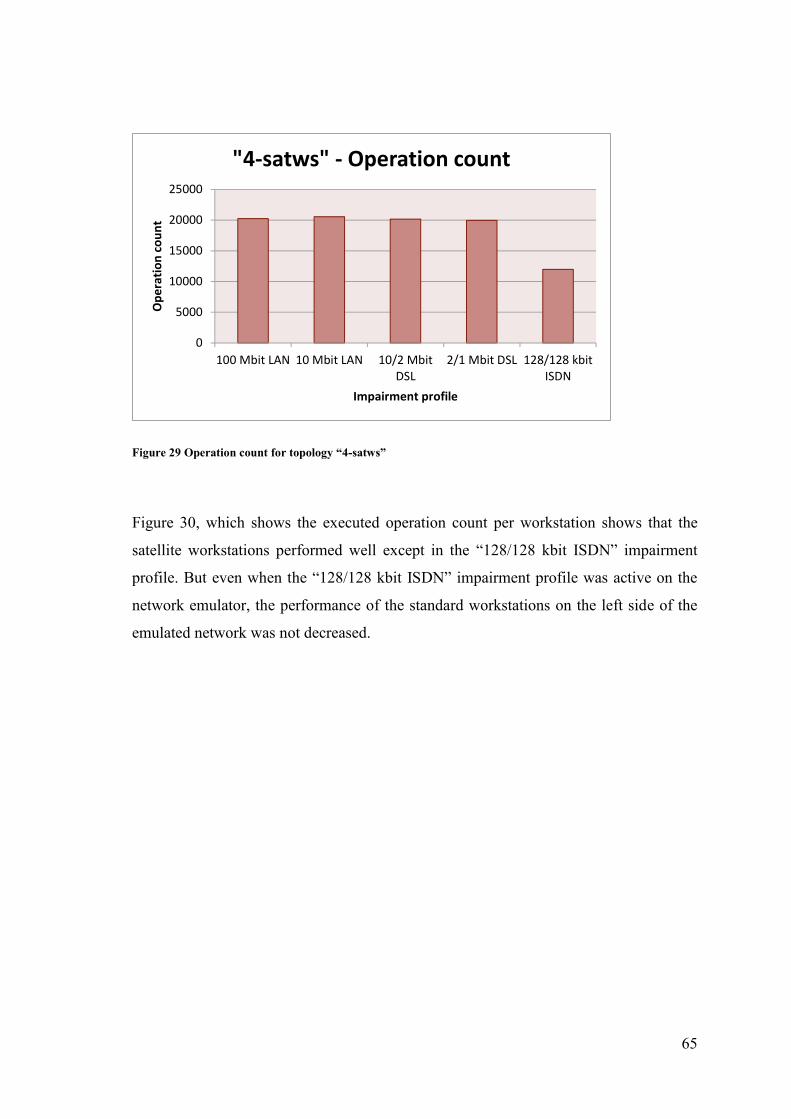
65
Figure 29 Operation count for topology “4-satws”
Figure 30, which shows the executed operation count per workstation shows that the
satellite workstations performed well except in the “128/128 kbit ISDN” impairment
profile. But even when the “128/128 kbit ISDN” impairment profile was active on the
network emulator, the performance of the standard workstations on the left side of the
emulated network was not decreased.
0
5000
10000
15000
20000
25000
100 Mbit LAN 10 Mbit LAN 10/2 MbitDSL
2/1 Mbit DSL 128/128 kbitISDN
Op
era
tio
n c
ou
nt
Impairment profile
"4-satws" - Operation count

66
Figure 30 Operation count per workstation for topology “4-satws”
7.6 Topology “5-com-node-mgmt-ws”
The fifth topology, “5-com-node-mgmt-ws” show in Figure 19, was the topology for
which I predicted the worst performance. The SoM and SoA values, shown in the bar
chart in Figure 31, show a similar performance to the “2-mgmt-ws” test topology. The
“2/1 Mbit DSL” and “128/128 kbit ISDN” impairment profiles both caused the
management server on the right side of the management network to disconnect. The
“128/128 kbit ISDN” impairment profile shows worse SoM and SoA values than the “3-
mgmt-ws” topology, but I will not analyze this impairment profile based on SoM or
SoA values because of the disconnected management server in both tests cases.
0
1000
2000
3000
4000
5000
6000
100 MbitLAN
10 Mbit LAN 10/2 MbitDSL
2/1 MbitDSL
128/128kbit ISDN
"4-satws" - Operation count per workstation
stdwkst1
stdwkst2
satwkst3
satwkst4

67
Figure 31 SoM and SoA for topology "5-com-node-mgmt-ws"
The total operation execution count for the “5-com-node-mgmt-ws” topology also
resembles the results for the topology “2-mgmt-ws”, Figure 32 shows that the impaired
trunk is causing a decrease of performance in the entire management network. Clearly
configurations like this should be avoided.
Figure 32 Operation count for topology "5-com-node-mgmt-ws"
0
500
1000
1500
2000
2500
100 MbitLAN
10 Mbit LAN 10/2 MbitDSL
2/1 MbitDSL
128/128kbit ISDN
[s]
Impairment profile
"5-com-node-mgmt-ws" - SoM and SoA
SoM
SoA
0
5000
10000
15000
20000
25000
100 Mbit LAN 10 Mbit LAN 10/2 MbitDSL
2/1 Mbit DSL 128/128 kbitISDN
Op
era
tio
n c
ou
nt
Impairment profile
"5-com-node-mgmt-ws" - Operation count
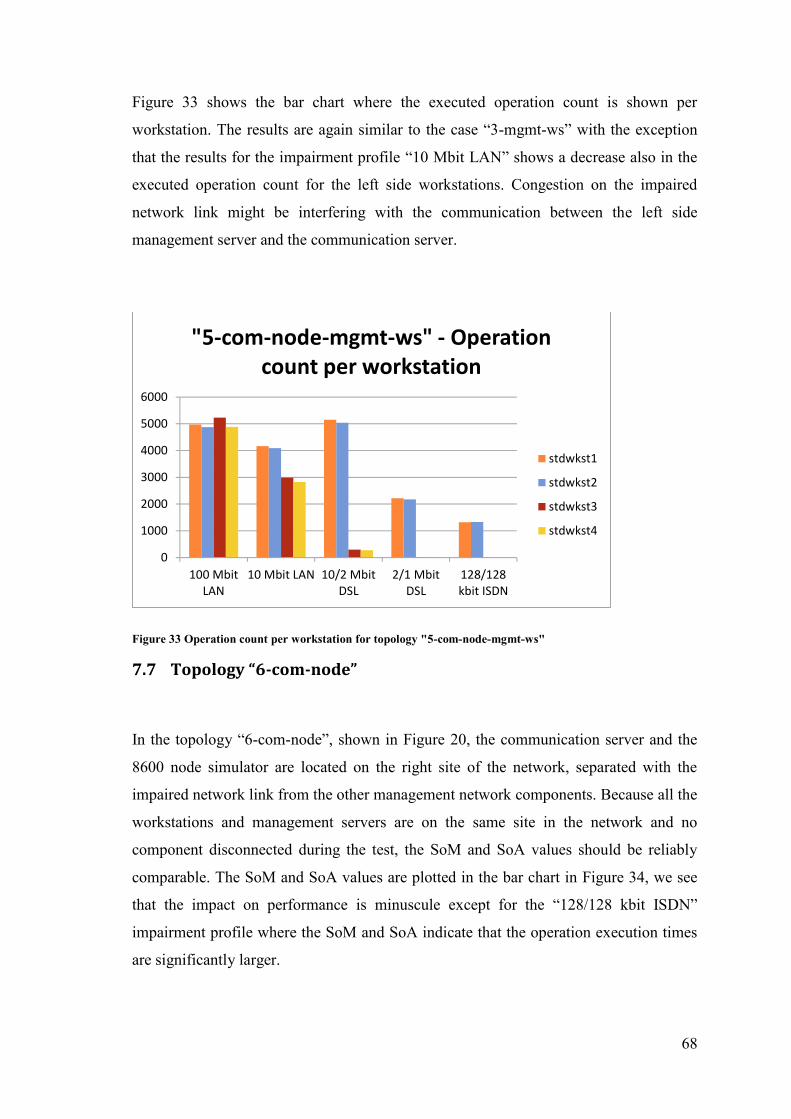
68
Figure 33 shows the bar chart where the executed operation count is shown per
workstation. The results are again similar to the case “3-mgmt-ws” with the exception
that the results for the impairment profile “10 Mbit LAN” shows a decrease also in the
executed operation count for the left side workstations. Congestion on the impaired
network link might be interfering with the communication between the left side
management server and the communication server.
Figure 33 Operation count per workstation for topology "5-com-node-mgmt-ws"
7.7 Topology “6-com-node”
In the topology “6-com-node”, shown in Figure 20, the communication server and the
8600 node simulator are located on the right site of the network, separated with the
impaired network link from the other management network components. Because all the
workstations and management servers are on the same site in the network and no
component disconnected during the test, the SoM and SoA values should be reliably
comparable. The SoM and SoA values are plotted in the bar chart in Figure 34, we see
that the impact on performance is minuscule except for the “128/128 kbit ISDN”
impairment profile where the SoM and SoA indicate that the operation execution times
are significantly larger.
0
1000
2000
3000
4000
5000
6000
100 MbitLAN
10 Mbit LAN 10/2 MbitDSL
2/1 MbitDSL
128/128kbit ISDN
"5-com-node-mgmt-ws" - Operation count per workstation
stdwkst1
stdwkst2
stdwkst3
stdwkst4
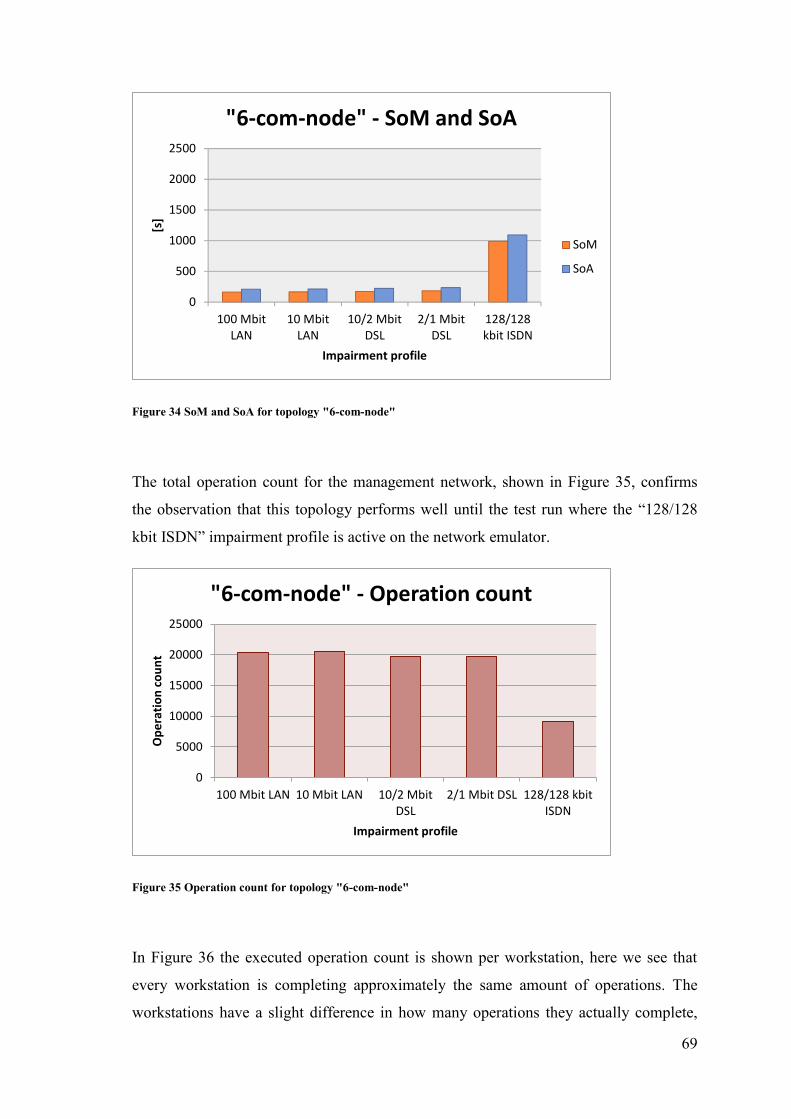
69
Figure 34 SoM and SoA for topology "6-com-node"
The total operation count for the management network, shown in Figure 35, confirms
the observation that this topology performs well until the test run where the “128/128
kbit ISDN” impairment profile is active on the network emulator.
Figure 35 Operation count for topology "6-com-node"
In Figure 36 the executed operation count is shown per workstation, here we see that
every workstation is completing approximately the same amount of operations. The
workstations have a slight difference in how many operations they actually complete,
0
500
1000
1500
2000
2500
100 MbitLAN
10 MbitLAN
10/2 MbitDSL
2/1 MbitDSL
128/128kbit ISDN
[s]
Impairment profile
"6-com-node" - SoM and SoA
SoM
SoA
0
5000
10000
15000
20000
25000
100 Mbit LAN 10 Mbit LAN 10/2 MbitDSL
2/1 Mbit DSL 128/128 kbitISDN
Op
era
tio
n c
ou
nt
Impairment profile
"6-com-node" - Operation count
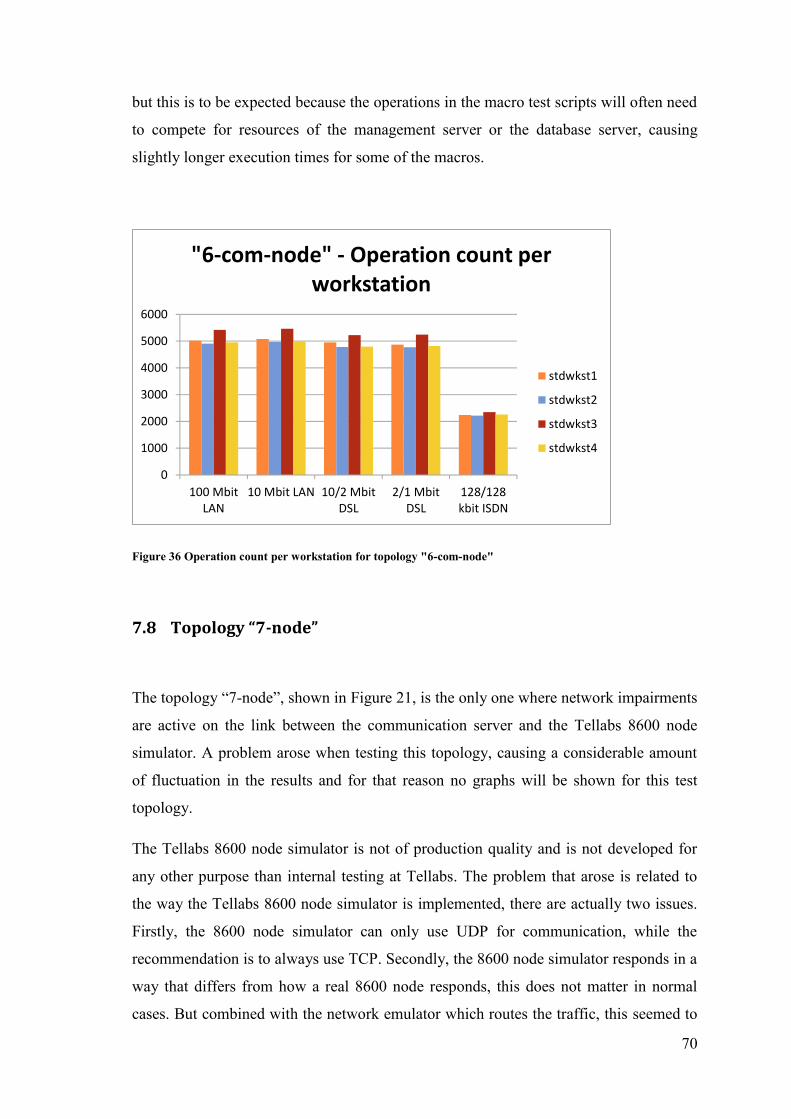
70
but this is to be expected because the operations in the macro test scripts will often need
to compete for resources of the management server or the database server, causing
slightly longer execution times for some of the macros.
Figure 36 Operation count per workstation for topology "6-com-node"
7.8 Topology “7-node”
The topology “7-node”, shown in Figure 21, is the only one where network impairments
are active on the link between the communication server and the Tellabs 8600 node
simulator. A problem arose when testing this topology, causing a considerable amount
of fluctuation in the results and for that reason no graphs will be shown for this test
topology.
The Tellabs 8600 node simulator is not of production quality and is not developed for
any other purpose than internal testing at Tellabs. The problem that arose is related to
the way the Tellabs 8600 node simulator is implemented, there are actually two issues.
Firstly, the 8600 node simulator can only use UDP for communication, while the
recommendation is to always use TCP. Secondly, the 8600 node simulator responds in a
way that differs from how a real 8600 node responds, this does not matter in normal
cases. But combined with the network emulator which routes the traffic, this seemed to
0
1000
2000
3000
4000
5000
6000
100 MbitLAN
10 Mbit LAN 10/2 MbitDSL
2/1 MbitDSL
128/128kbit ISDN
"6-com-node" - Operation count per workstation
stdwkst1
stdwkst2
stdwkst3
stdwkst4
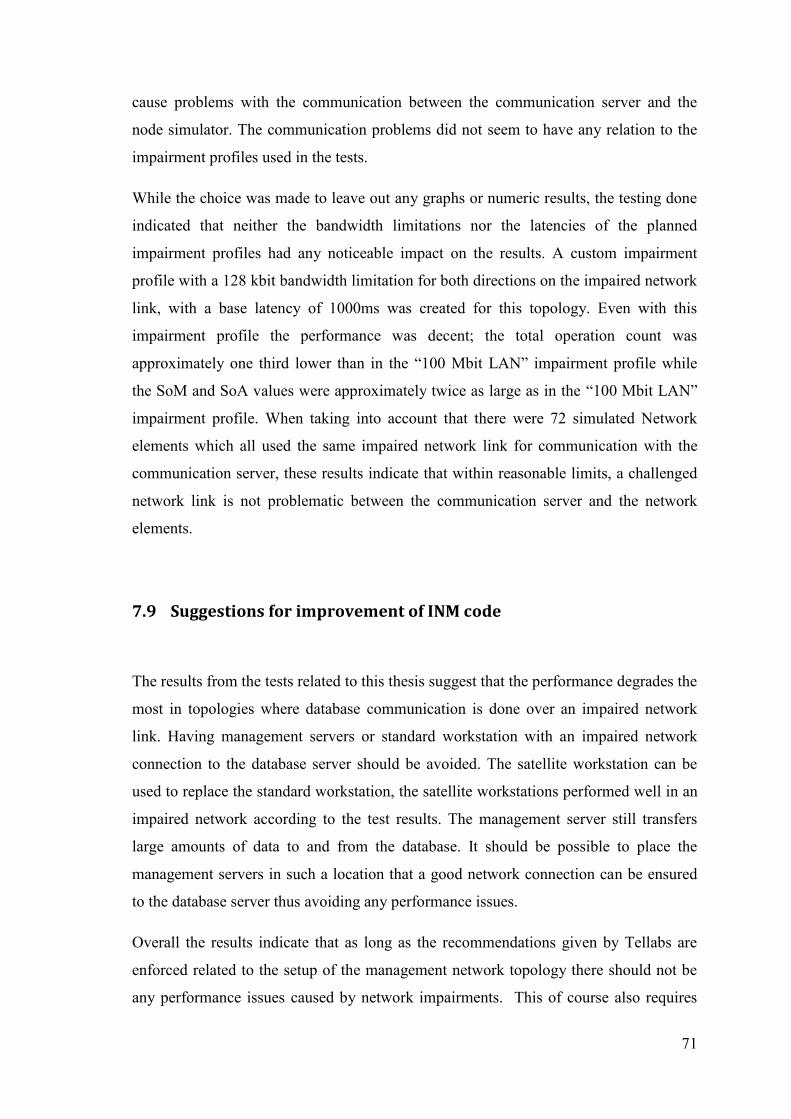
71
cause problems with the communication between the communication server and the
node simulator. The communication problems did not seem to have any relation to the
impairment profiles used in the tests.
While the choice was made to leave out any graphs or numeric results, the testing done
indicated that neither the bandwidth limitations nor the latencies of the planned
impairment profiles had any noticeable impact on the results. A custom impairment
profile with a 128 kbit bandwidth limitation for both directions on the impaired network
link, with a base latency of 1000ms was created for this topology. Even with this
impairment profile the performance was decent; the total operation count was
approximately one third lower than in the “100 Mbit LAN” impairment profile while
the SoM and SoA values were approximately twice as large as in the “100 Mbit LAN”
impairment profile. When taking into account that there were 72 simulated Network
elements which all used the same impaired network link for communication with the
communication server, these results indicate that within reasonable limits, a challenged
network link is not problematic between the communication server and the network
elements.
7.9 Suggestions for improvement of INM code
The results from the tests related to this thesis suggest that the performance degrades the
most in topologies where database communication is done over an impaired network
link. Having management servers or standard workstation with an impaired network
connection to the database server should be avoided. The satellite workstation can be
used to replace the standard workstation, the satellite workstations performed well in an
impaired network according to the test results. The management server still transfers
large amounts of data to and from the database. It should be possible to place the
management servers in such a location that a good network connection can be ensured
to the database server thus avoiding any performance issues.
Overall the results indicate that as long as the recommendations given by Tellabs are
enforced related to the setup of the management network topology there should not be
any performance issues caused by network impairments. This of course also requires

72
that at least ADSL capacity network technologies are used for interconnections in the
management network.
73
8 Summary and conclusions
The work in this thesis consisted of creating the tools and environment for multiuser
performance testing in a challenged network as well as running a set of tests and
analyzing the results. The environment and tools which were created for this became a
complete system for the multiuser tests in challenged networks. The modularity of the
system allows the tools to be used in other testing environments. The testing
environment also supports testing of new test cases with different impairment profiles,
topologies and test scripts.
The test cases were mostly based on requests made by the Tellabs Oy scalability testing
team, so there was a genuine interest in the results. The results provided valuable
information on how the performance of existing customer management networks is
impacted by the network setup. The results also verified that the recommended network
topologies perform well and gave comparable results which can be referred to when
designing management networks.
8.1 Future research
Most of the requests, made by Tellabs Oy, for future work regarding the work done in
this thesis are related to additional test cases and modification of the created tools. The
knowledge of how to use the tools and the environment has been passed on to other
members of the Tellabs integration testing and system testing teams.
A request has been made to port the AutoQueue program to a Microsoft Windows
environment for use in another multiuser performance testing environment. The
AutoQueue program is written in Ruby and should not require much code changes in
order to work on Microsoft windows operating systems. However, the code related to
the Joinker-messaging should be rewritten to better match the messaging done by
Joinker. This would ease the creation of new remotely executable tasks by allowing the
Joinkee server to report whether a task was successful or not, currently the evaluation
on whether a task was successful or not is done by AutoQueue. Also the configurable

74
parameters should be separated to a configuration file; currently they are defined in the
code of AutoQueue. The Linux configuration and the NetSloth program could also be
installed on a physical computer for use in other testing environments as an alternative
to the commercial hardware network emulators.
Several suggested test cases had to be left out of the scope of this thesis. Some were left
out because of lack of resources; they might have required additional virtual computers
or an additional database server. At some time point it is likely that the additional
resources are available and the need to run these test cases can be re-evaluated. Other
suggested test cases were left out because they did not fit in the test plan, they would
have required a different set of test scripts. This would have made them incomparable
with the set of test cases which were selected for this thesis. Finally, some of the
suggested test cases were left out simply because of time limitations.
The test topology “7-node” had a large fluctuation in the results of the multiuser test and
for that reason the numeric results were omitted from this thesis. In my opinion, time
should be allocated for the investigation of the reasons behind this anomaly so that
reliable numeric results could be produced.
The testing environment and set of test cases could be used in the future to test the
performance of upcoming Tellabs 8000 INM test releases or to verify the effect of
changes in the networking code. The testing environment and the results from the test
cases could also be used to provide recommendations on minimum network connection
requirements to the customer documentation. The environment could also be used when
interworking with programmers optimizing the networking code for benchmarking
changes in the code.
75
9 References
[1] I. Savolainen. 2008. Benchmark testing of network management system. M.Sc.
Thesis. Helsinki University of Technology, Espoo.
[2] W. e. Lewis. 2005. Software Testing and Continuous Quality Improvement, 2nd
Edition. Auerbach publications.
[3] I. Molyneaux. 2009. The Art of Application Performance Testing: Help for
Programmers and Quality Assurance. O'Reilly Media, inc.
[4] O. R. Lucas Nussbaum. 2009. A Comparative Study of Network Link Emulators.
In: Proceedings of the 2009 Spring Simulation Multiconference.
[5] J. Postel. 1981. Internet Control Message Protocol. RFC 792.
[6] U. o. S. C. Information Sciences Institute. 1981. Transmission Control Protocol.
RFC 793.
[7] G. Fairhurst and L. Wood. 2002. Advice to link designers on link Automatic
Repeat reQuest (ARQ). RFC 3366.
[8] D. E. Comer. 1995. Internetworking with TCP/IP, Volume I: Principles, protocols,
and architecture. Prentice-Hall, Inc.
[9] F. Halsall. 1995. Data Communications, Computer Networks and Open Systems,
4th Edition. Addison-Wesley Publishing Company.
[10] R. B. D. B. V. Jacobson. 1992. TCP Extensions for High Performance. RFC 1323.
[11] Tellabs® 8000 Intelligent Network Manager SR4.0 System Description.
https://www.portal.tellabs.com/cp/D_1021782/76.8040-70200B.pdf .
[12] M. Kyllönen. 2008. Designing and Implementing a Router Node Simulator for
Network Management Testing. M.Sc. Thesis. Helsinki University of Technology,
Espoo.

76
[13] Tellabs Oy, "Network Scheme".
[14] P. Deutsch. 1996. DEFLATE Compressed Data Format Specification version 1.3.
RFC 1951.
[15] S. Josefsson. 2006. The Base16, Base32, and Base64 Data Encodings. RFC 4648.