Embed Size (px)
Citation preview
Joint Genetic Analysis of Gene Expression Data withInferred Cellular PhenotypesLeopold Parts1*., Oliver Stegle2., John Winn3, Richard Durbin1*
1 Wellcome Trust Sanger Institute, Hinxton, Cambridge, United Kingdom, 2 Max Planck Institutes Tubingen, Tubingen, Germany, 3 Microsoft Research, Cambridge, United
Kingdom
Abstract
Even within a defined cell type, the expression level of a gene differs in individual samples. The effects of genotype,measured factors such as environmental conditions, and their interactions have been explored in recent studies. Methodshave also been developed to identify unmeasured intermediate factors that coherently influence transcript levels ofmultiple genes. Here, we show how to bring these two approaches together and analyse genetic effects in the context ofinferred determinants of gene expression. We use a sparse factor analysis model to infer hidden factors, which we treat asintermediate cellular phenotypes that in turn affect gene expression in a yeast dataset. We find that the inferred phenotypesare associated with locus genotypes and environmental conditions and can explain genetic associations to genes in trans.For the first time, we consider and find interactions between genotype and intermediate phenotypes inferred from geneexpression levels, complementing and extending established results.
Citation: Parts L, Stegle O, Winn J, Durbin R (2011) Joint Genetic Analysis of Gene Expression Data with Inferred Cellular Phenotypes. PLoS Genet 7(1): e1001276.doi:10.1371/journal.pgen.1001276
Editor: John D. Storey, Princeton University, United States of America
Received April 4, 2010; Accepted December 14, 2010; Published January 20, 2011
Copyright: � 2011 Parts et al. This is an open-access article distributed under the terms of the Creative Commons Attribution License, which permitsunrestricted use, distribution, and reproduction in any medium, provided the original author and source are credited.
Funding: This work was supported by the Wellcome Trust (grant number WT077192/Z/05/Z) and the Technical Computing Initiative (Microsoft Research). OSreceived funding from the Volkswagen Foundation. The funders had no role in study design, data collection and analysis, decision to publish, or preparation ofthe manuscript.
Competing Interests: The authors have declared that no competing interests exist.
* E-mail: [email protected] (LP); [email protected] (RD)
. These authors contributed equally to this work.
Introduction
Many interesting traits are heritable, and have a strong genetic
component. In simple cases, such as Mendelian diseases, the
genetic cause can be found with linkage methods, and many trait
genes have been mapped to date [1]. More recently, association
mapping studies have focused on complex traits that include
prevalent human diseases, such as type 2 diabetes, hypertension,
and others. Numerous genome-wide association studies have
corroborated that no single gene explains all or even a large part of
the heritable variability in such traits, and that individual effect
sizes due to common variants are small [2]. Mapping and
understanding the genetic component in complex traits remains
one of the most important challenges in modern genetics.
The effect of a single locus genotype on a global trait has to be
mediated by cellular, tissue, and organ phenotypes. Many of the
variants that have been identified in genome-wide association
studies do not change coding sequences [2], suggesting that the
genetics of gene expression is central to understanding of the
genetic basis of complex traits. Technological advances in recent
years have made it possible to assay transcript levels on a large
scale and treat them as quantitative traits, enabling research into
the genetic makeup of these basic cellular phenotypes [3]. Linkage
studies in segregating yeast strains [4] followed by single [5,6] and
multipopulation experiments [7] in humans have revealed much
about the genetic landscape of gene expression. Transcript levels
have been found to be heritable [4], and individual regions
associated with the expression values have been identified for most
yeast genes in linkage studies [8,9], and up to a third of human
genes in association studies [7,10].
Locus effects in isolation are not sufficient to account for gene
expression variability. Environment and intermediate cellular
phenotypes (e.g. transcription factor or pathway activation) can
and do have large effects on the measured transcript levels [8,11].
To understand the genetics of gene expression, we must therefore
analyse the consequences of genetic variants in the context of these
other factors. Studies in segregating yeast strains have investigated
epistatic interactions [8,12,13], recovering interactions with
genotypes of a few major transcriptional regulators. Large scale
efforts to map functional epistasis between genes are currently
underway with promising initial results [14]. A recent study also
searched for genotype-environment effects, and found many gene
expression levels affected by an interaction between the environ-
ment and the genotype of a major transcriptional regulator [15].
However, much remains to be done in this area. While gene
expression has been used as an intermediate phenotype to study
the genetics of global traits [16,17,18], genetics of gene expression
itself has not been considered jointly with relevant cellular
phenotypes such as pathway or transcription factor activations.
This is an important gap. It is the state of the cell that determines
how genetic variation can effect the gene expression levels, thus a
joint analysis with the intermediate phenotypes is needed to inform
us about the mechanisms involved – a crucial step for
understanding the causes of phenotypic variability.
Despite their importance, the intermediate phenotypes are
usually not measured, thus genetic effects cannot be analysed in
PLoS Genetics | www.plosgenetics.org 1 January 2011 | Volume 7 | Issue 1 | e1001276
their cellular context. Fortunately, statistical approaches have
been developed that allow inferring unmeasured factors which
influence expression levels from expression data alone.
Methods such as principal components analysis [19], network
components analysis [20], surrogate variable analysis [21],
independent components analysis [22], and the PEER frame-
work [10] can be used to determine a set of variables that
explain a part of gene expression variability with (usually) a
linear model. Their application has been shown to increase
power to find expression quantitative trait loci (eQTLs) by
explaining away confounding variation [10,23,21], and to yield
variance components of the expression data that may be
interpretable [10].
Here, we perform a thorough joint genetic analysis of a gene
expression dataset with intermediate phenotypes inferred from
gene expression levels. We revisit the data of Smith and Kruglyak
[15], where the authors looked for gene-environment interactions
affecting gene expression levels in a population of segregating yeast
strains grown in two different carbon sources. First, we use a
variant of a sparse factor analysis model [24,25] to infer
intermediate phenotypes from the gene expression levels
(Figure 1a). Importantly, our method uses prior information to
guide the inference of which factors are affecting which target
genes, as opposed to unsupervised methods (e.g. PEER, SVA,
ICA) that tend to learn broad effects. We use Yeastract [26]
transcription factor binding and KEGG [27] pathway data as
prior information in the model, which allows the inferred
phenotypes to be interpreted as transcription factor and pathway
activations. We then analyse the variation in the learnt activations,
and find that growth condition and segregating locus genotypes
have a strong influence (Figure 1b). Finally, for the first time, we
consider genotype-dependent effects of the inferred intermediate
phenotypes. We find genetic interactions with the inferred
phenotypes that affect gene expression levels (Figure 1c), and
identify regions in the genome that show an excess of these
interactions. We show that many genotype-environment interac-
tions are captured with the estimated intermediate phenotype,
helping to interpret the environmental effect, and generate
plausible, testable hypotheses for the mechanisms of several
determined interactions. We propose that as pathway and
transcription factor target annotations improve, our approach will
produce even more useful intermediate traits that should be
included in analysis and interpretation of high-throughput gene
expression data.
Results
We carried out genetic analysis with inferred intermediate
phenotypes on expression levels of 5,493 genes from 109 yeast
segregants grown in two environmental conditions (Methods,
[15]). We employ a model that combines unobserved intermediate
factors, genotype and expression levels. At the core, this approach
is based on a sparse factor analysis model (Methods) to learn
intermediate phenotypes from expression data (Figure 1a). Briefly,
this bilinear model expresses the gene expression yg,j of gene g for
segregant j as as a sum of weighted contributions from factor
activations fx1,j , . . . ,xK ,jg of K factors and a noise term yg,j :
yg,j~XK
k~1
wg,kxk,jzyg,j : ð1Þ
The factor activations xk,j inferred from (1) are then treated as the
intermediate phenotypes. Prior information about which factors
influence which genes is introduced as a prior on the weights wg,k,
thereby guiding the learning. For example, if gene g is a known
target of transcription factor k, it is more likely that wg,k is large,
while for genes that are not targets, the weight is more likely to be
near-zero.
We considered three alternative types of prior information.
First, we hypothesised the factors to be transcription factor
activation levels, and used data for 167 transcription factors from
Yeastract [26] to assign a prior probability of a factor affecting a
gene expression level (Methods). Second, we hypothesised the
factors to be pathway activations, and used KEGG database
information [27] for 63 pathways for the prior probability of a link
between a pathway activation and a gene. Third, for comparison,
we employed an uninformative prior, where 30 factors were a priori
equally likely to affect all genes. We call the inferred factor
activations Yeastract factors, KEGG factors, and freeform factors,
respectively.
To ensure our findings are not affected by local optima of the
factor inference, we carried out the full analysis on 20 randomly
initialised runs of the factor analysis model for each prior setting.
The prior information on the regulatory influence of factors (e.g.
number of known targets for a transcription factor) influenced the
statistical identifiability of factors and their associations; see Text
S1 for a detailed discussion and validation on simulated data.
Statistical significance of genetic associations and interactions was
determined using a permutation procedure outlined in Methods.
Inferred intermediate phenotypes are genetically orenvironmentally driven
Although the factors were inferred jointly from the expression
data alone, many factor activations were significantly associated
with a locus (SNP) genotype or indicator variable encoding growth
in ethanol or glucose as a carbon source (‘‘environment’’, Tables
S1, S2, S3). Thirty Yeastract factors were associated with a SNP
genotype at false discovery rate (FDR) less than 5% (Methods) and
32 with the environment. Similarly, 9 KEGG factors were
associated with a SNP genotype, and three with the environment
while 27 freeform factors were significantly associated with a SNP
genotype and one with the environment. Some of the genotype
associations were due to pleiotropic effects of single loci, while
others were private to a locus-factor combination (Tables S4, S5,
S6).
Many of these individual associations to Yeastract and KEGG
factors can be interpreted by considering the role of the inferred
factors and functional annotations of genes at associated loci. We
Author Summary
The first step in transmitting heritable information,expressing RNA molecules, is highly regulated anddepends on activations of specific pathways and regula-tory factors. The state of the cell is hard to measure,making it difficult to understand what drives the changesin the gene expression. To close this gap, we apply astatistical model to infer the state of the cell, such asactivations of transcription factors and molecular path-ways, from gene expression data. We demonstrate howthe inferred state helps to explain the effects of variation inthe DNA and environment on the expression trait via bothdirect regulatory effects and interactions with the geneticstate. Such analysis, exploiting inferred intermediatephenotypes, will aid understanding effects of geneticvariability on global traits and will help to interpret thedata from existing and forthcoming large scale studies.
Genetic Analysis with Inferred Phenotypes
PLoS Genetics | www.plosgenetics.org 2 January 2011 | Volume 7 | Issue 1 | e1001276
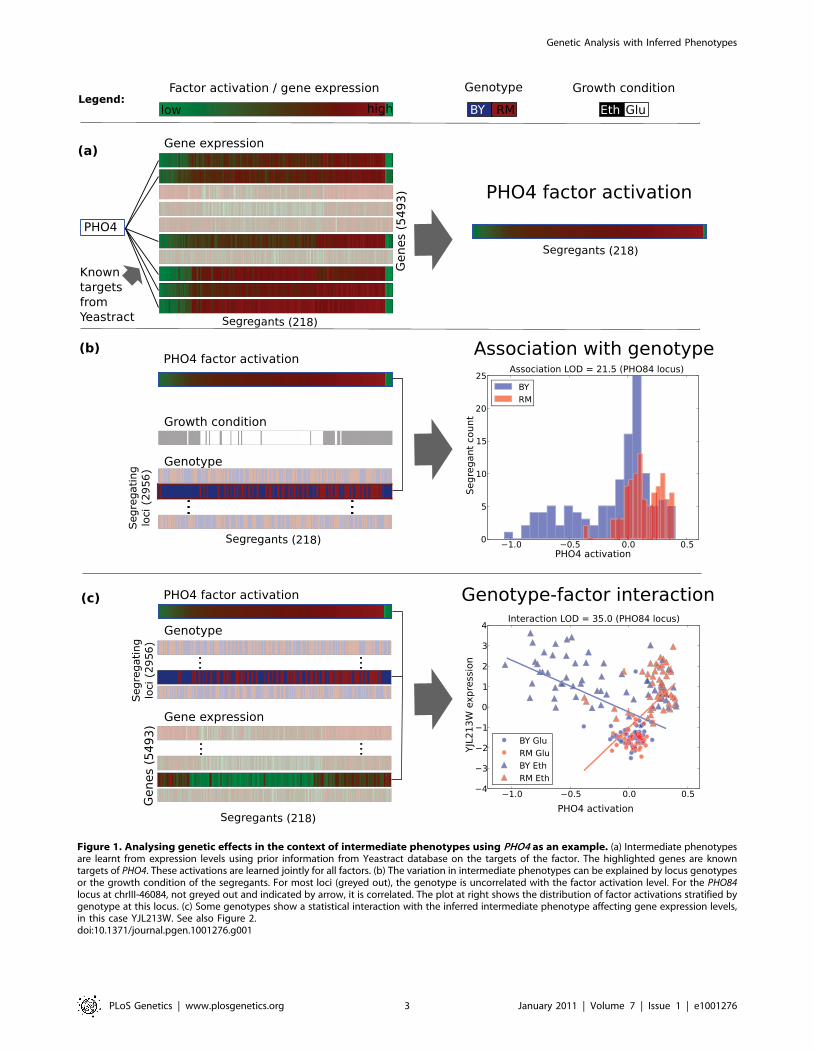
Figure 1. Analysing genetic effects in the context of intermediate phenotypes using PHO4 as an example. (a) Intermediate phenotypesare learnt from expression levels using prior information from Yeastract database on the targets of the factor. The highlighted genes are knowntargets of PHO4. These activations are learned jointly for all factors. (b) The variation in intermediate phenotypes can be explained by locus genotypesor the growth condition of the segregants. For most loci (greyed out), the genotype is uncorrelated with the factor activation level. For the PHO84locus at chrIII-46084, not greyed out and indicated by arrow, it is correlated. The plot at right shows the distribution of factor activations stratified bygenotype at this locus. (c) Some genotypes show a statistical interaction with the inferred intermediate phenotype affecting gene expression levels,in this case YJL213W. See also Figure 2.doi:10.1371/journal.pgen.1001276.g001
Genetic Analysis with Inferred Phenotypes
PLoS Genetics | www.plosgenetics.org 3 January 2011 | Volume 7 | Issue 1 | e1001276
now give some examples to further corroborate the use of factor
activations as intermediate phenotypes. All associations are
significant at 5% FDR, with corresponding Q-values q (minimal
FDR for which the association is significant [28]) and average log-
odds scores L over the 20 randomly initialised runs given
(Methods).
Yeastract factors. Loci associated with Yeastract factor
activations encode genes functionally related to the
corresponding transcription factor (Table S1). The PHO84 (an
inorganic phosphate transporter) locus was associated with the
PHO4 (a major regulator of phosphate-responsive genes)
transcription factor activation (qv0:02,L~17:6). The
association implicates the variation in the transporter and
potentially its efficiency as a determinant for the transciptional
activation of the phosphate-responsive genes through the PHO4
activation. The mechanism of action is likely a switch in
transcriptional response when PHO84, a high affinity phosphate
transporter, is rendered ineffective by a mutation [29].
The SUM1 (transcriptional repressor of middle sporulation-
specific genes) factor activation was associated with the genotype of
the RFM1 (repression factor of middle sporulation) locus
(qv10{5,L~26:4). This is intriguing since RFM1 recruits the
HST1 histone deacetylase to some of the promoters regulated by
SUM1 [30,31], suggesting that genetic variation in the RFM1 gene
indirectly alters the effect of SUM1 on individual genes.
There is also a straightforward eQTL that regulates the HAP1
(heme activation protein) gene expression (qv10{5,L~29:2), as
well as factor activation (qv10{5,L~39:3). This is a cis effect,
since the locus is proximal to the gene, and manifests itself as a
trans eQTL hotspot by affecting expression levels of some of the
170 known HAP1 targets. Twenty eight of the 93 (30%) significant
trans eQTLs are also known targets of HAP1. Our data suggest that
the other 65 may either be previously undiscovered targets of
HAP1, or secondary downstream effects of some of its direct
targets.
The THI2 thiamine metabolism transcription factor activation
was associated with the genotype of the THI5 locus
(qv10{5,L~51:8). This suggests a regulatory role of THI5
upstream of THI2 in thiamine biosynthesis, and shows how our
inference allows generating hypotheses for the function for genes
that are implicated in a cellular pathway, but not annotated with a
specific role.
KEGG factors. Associations to KEGG pathways tend to
capture the effect of a pathway component genotype (Table S2).
For example, the inferred activation of lysine biosynthesis pathway
was associated with the LYS2 locus (qv10{4,L~24:9), and the
activation of galactose metabolism pathway with the locus
containing the FSP2 and YJL216C genes (qv0:05,L~14:4), all
members of the respective pathways. The latter genes are situated
in the subtelomeric regions, known to be a major source of
adaptive variation. Thus, it is plausible that the genotype of the
locus tags the existence or copy number of these genes in the
segregants. We thus hypothesise that genetic background of these
genes directly affects the activation of the corresponding pathways.
Also, the nitrogen metabolism pathway was associated with the
ASP3 (cell-wall L-asparaginase) gene cluster locus genotype.
(qv0:06,L~183:9). The ASP3 genes are part of the pathway,
and are present in four copies in the reference strain S288c,
conferring increased resistance to nitrogen starvation stress. The
inferred state of the pathway thus corresponds to the ASP3 copy
number via the locus genotype proxy.
Furthermore, the fatty acid metabolism pathway activation was
associated with the OAF1 (oleate-activated transcription factor)
locus genotype (qv10{4,L~73:3), which is a known regulator of
the pathway [32]. We thus hypothesise that genetic variants in
OAF1 between the two strains are responsible for differences in
fatty acid metabolism in the segregants, as has also been proposed
in earlier work [33].
Finally, the environment was strongly associated to the very
wide metabolic pathways category (qv10{5,L~408:4). This
KEGG entry comprises 619 genes, and captures the effect of the
growth condition of the segregants on their metabolic state.Freeform factors. The freeform factors capture broad
variance components in the data, with each factor’s activation
contributing to every probe expression level. Regardless of the
unsupervised inference of the activations, they still show strong
associations to environment and locus genotypes. However, due to
this global nature of the factors, the associations are less
straightforwardly amenable to interpretation. The first factor was
associated with the environment (qv10{5,L~282:1), and
accounts for mean shifts in gene expression levels between
segregants grown in glucose and ethanol (Table S3). Several of
the other factors were associated with genotypes of ‘‘pivotal loci’’
described before [8,9,15]. It may be possible to make suggestions
about the functionality via methods such as overrepresentation of
GO categories within sets of genes with large weights for a factor,
such as a recent study that performed a similar association analysis
with unsupervised factors [22]. Our approach of using existing
data for guidance is stronger compared to unsupervised methods
as we use evidence of which gene is affected by the factor, thus
improving statistical identifiability, and do not rely on an ad hoc
choice of number of factors. This yields interpretable results that
are more useful for generating hypotheses for the consequence of
genetic or environmental variation.
Response to small molecule stress has been measured in the
same segregants to map drug response loci [34]. This study found
eight QTL hotspots, six of which are within 20kb of loci that also
show several associations to our inferred intermediate phenotypes
(Tables S4, S5, S6), corroborating their pleiotropic effect.
Some of inferred transcription factor activations arecorrelated with their corresponding mRNA and proteinexpression
Twenty seven of 167 Yeastract factors were associated with the
probe expression level measuring the transcription factor gene at
the 5% FDR (Table S1, Figure S1). Eighteen of them (67%) were
also significantly associated with a SNP genotype or environment.
While statistically significant, these associations do not explain
majority of the factor variability, as only two Yeastract factors
were correlated with their probe expression level with Pearson
r2w0:5.
The general lack of correlation between factor activation and
the corresponding measured expression level for the remaining
transcription factors is perhaps not surprising. Previous studies
have found poor correlation between mRNA and protein
expression levels [35,36]. Also, alternative mechanisms for
activation exist. Many Yeastract factors without significant
correlation to transcript levels have been shown to be activated
not via increase in expression, but other means. For example,
PHO4 is activated by multiple phosphorylation events [37].
Simlarly, nuclear localisation and therefore activation of ACE2
and MSN2 are controlled by phosphorylation state [38,39]. We
predict most of the other transcription factors to also be activated
by non-transcriptional means.
The protein level of one of the Yeastract factors, GIS2, has been
assayed quantitatively in a previous study [36] for 87 of the 109
segregants we considered in a similar growth condition. For this
transcription factor, the inferred activation was better correlated to
Genetic Analysis with Inferred Phenotypes
PLoS Genetics | www.plosgenetics.org 4 January 2011 | Volume 7 | Issue 1 | e1001276
the protein level than the corresponding probe expression level for
16 of the 20 random initialisations. This example gives further
support to treating the inferred factors as meaningful quantitative
traits.
Genetically driven transcription factor activations explaintrans eQTL hotpots
As observed before [15,4,9] some segregating loci showed
significant associations with up to 743 (IRA2, regulator of the RAS-
cAMP pathway locus) probe expression levels (Figure S2). There
are nine such loci with at least 50 associations (‘‘hotspots’’). On
average, 15% of the genes associated with a trans eQTL hotspot
(FDRv5%, Methods) could be explained by a transcription factor
associated with the hotspot locus genotype, and targeting the gene
(Table S7). In 85% of these cases, the association with the inferred
factor activation was stronger than with the locus genotype, and
many additional associations with factor targets are recovered. For
example, the PHO84 locus was associated with the PHO4
Yeastract factor activation (qv0:02,L~17:6), as well as 72 probe
expression levels in trans. Fourteen of these were also significantly
associated with the PHO4 factor activation, all showing a stronger
association. PHO4 itself was significantly associated with 60 more
probes, expanding the range of plausible effects of the PHO84
locus. This shows that using inferred intermediate phenotypes can
reveal additional associations that otherwise would not be
statistically significant.
Genetic interactions with inferred cellular phenotypesaffect gene expression levels
We scanned the genome for genotype-factor interactions that
effect gene expression levels (Figure 1c) using a standard linear
interaction model (Methods), and recovered three broad classes of
interactions (Figure 2). We tested each locus-gene pair indepen-
dently for interaction with any inferred factor using 20
permutations, and information from all the random restarts of
the model to assess significance (Methods). If a single factor was
observed with the strongest interaction score for a locus-gene pair
in at least half the multiple restarts, we interpreted it as the true
interacting factor; in other cases, we did not designate a factor to
an interaction effect. We give examples of interactions we find
below, highlighting how they add to the understanding of the
propagation of the genotype effect.
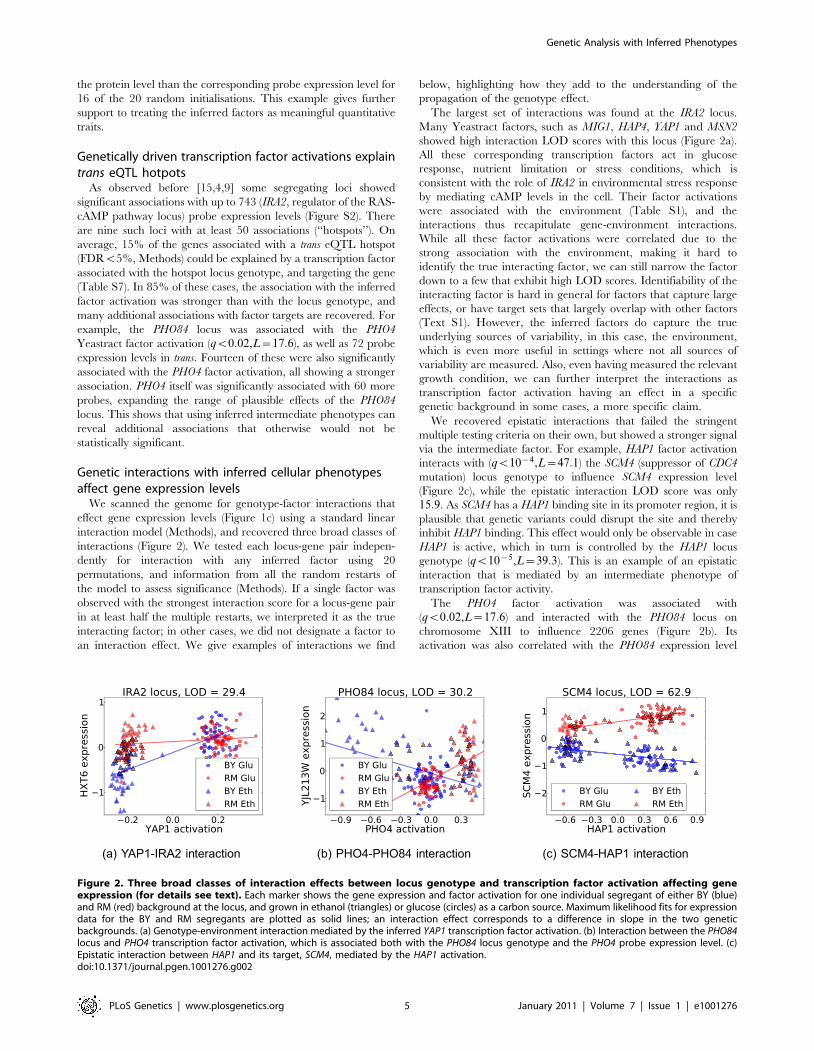
The largest set of interactions was found at the IRA2 locus.
Many Yeastract factors, such as MIG1, HAP4, YAP1 and MSN2
showed high interaction LOD scores with this locus (Figure 2a).
All these corresponding transcription factors act in glucose
response, nutrient limitation or stress conditions, which is
consistent with the role of IRA2 in environmental stress response
by mediating cAMP levels in the cell. Their factor activations
were associated with the environment (Table S1), and the
interactions thus recapitulate gene-environment interactions.
While all these factor activations were correlated due to the
strong association with the environment, making it hard to
identify the true interacting factor, we can still narrow the factor
down to a few that exhibit high LOD scores. Identifiability of the
interacting factor is hard in general for factors that capture large
effects, or have target sets that largely overlap with other factors
(Text S1). However, the inferred factors do capture the true
underlying sources of variability, in this case, the environment,
which is even more useful in settings where not all sources of
variability are measured. Also, even having measured the relevant
growth condition, we can further interpret the interactions as
transcription factor activation having an effect in a specific
genetic background in some cases, a more specific claim.
We recovered epistatic interactions that failed the stringent
multiple testing criteria on their own, but showed a stronger signal
via the intermediate factor. For example, HAP1 factor activation
interacts with (qv10{4,L~47:1) the SCM4 (suppressor of CDC4
mutation) locus genotype to influence SCM4 expression level
(Figure 2c), while the epistatic interaction LOD score was only
15:9. As SCM4 has a HAP1 binding site in its promoter region, it is
plausible that genetic variants could disrupt the site and thereby
inhibit HAP1 binding. This effect would only be observable in case
HAP1 is active, which in turn is controlled by the HAP1 locus
genotype (qv10{5,L~39:3). This is an example of an epistatic
interaction that is mediated by an intermediate phenotype of
transcription factor activity.
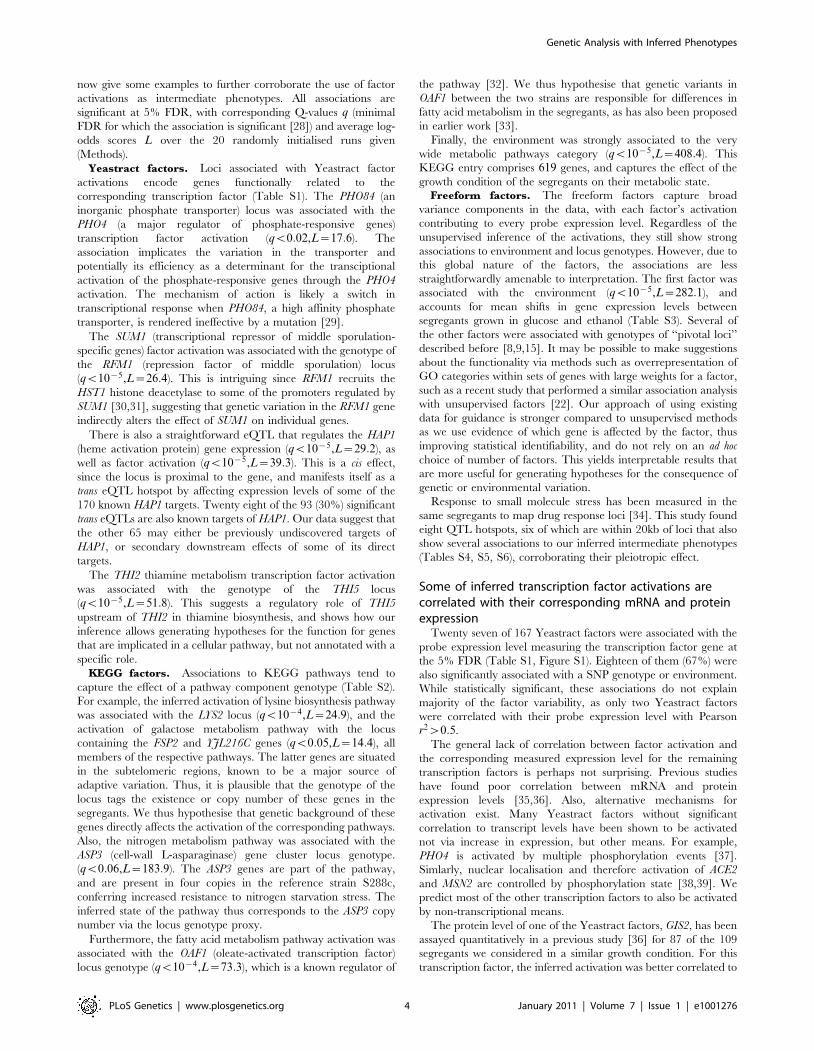
The PHO4 factor activation was associated with
(qv0:02,L~17:6) and interacted with the PHO84 locus on
chromosome XIII to influence 2206 genes (Figure 2b). Its
activation was also correlated with the PHO84 expression level
Figure 2. Three broad classes of interaction effects between locus genotype and transcription factor activation affecting geneexpression (for details see text). Each marker shows the gene expression and factor activation for one individual segregant of either BY (blue)and RM (red) background at the locus, and grown in ethanol (triangles) or glucose (circles) as a carbon source. Maximum likelihood fits for expressiondata for the BY and RM segregants are plotted as solid lines; an interaction effect corresponds to a difference in slope in the two geneticbackgrounds. (a) Genotype-environment interaction mediated by the inferred YAP1 transcription factor activation. (b) Interaction between the PHO84locus and PHO4 transcription factor activation, which is associated both with the PHO84 locus genotype and the PHO4 probe expression level. (c)Epistatic interaction between HAP1 and its target, SCM4, mediated by the HAP1 activation.doi:10.1371/journal.pgen.1001276.g002
Genetic Analysis with Inferred Phenotypes
PLoS Genetics | www.plosgenetics.org 5 January 2011 | Volume 7 | Issue 1 | e1001276
(DrD~0:70), and interacted with the environment variable to
influence gene expression levels. These interactions recapture
genes differentially expressed in the two growth conditions, as the
PHO4 activation separates segregants based on both environment
as well as the PHO84 locus genotype.
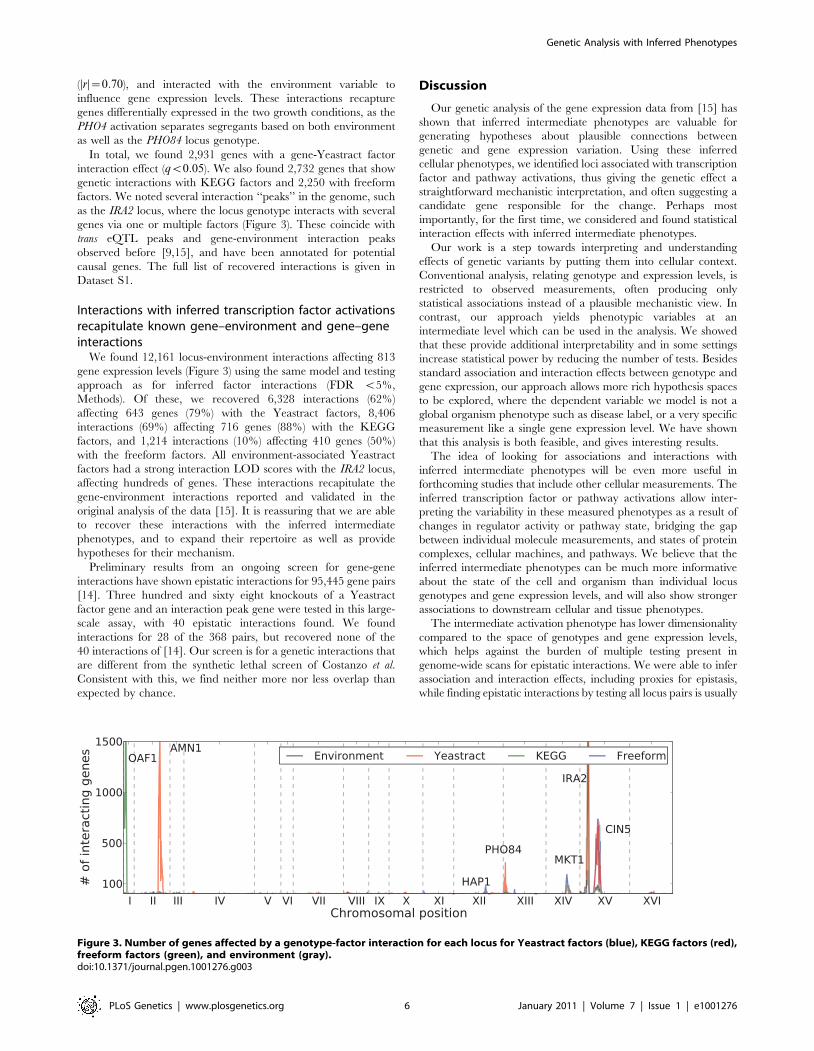
In total, we found 2,931 genes with a gene-Yeastract factor
interaction effect (qv0:05). We also found 2,732 genes that show
genetic interactions with KEGG factors and 2,250 with freeform
factors. We noted several interaction ‘‘peaks’’ in the genome, such
as the IRA2 locus, where the locus genotype interacts with several
genes via one or multiple factors (Figure 3). These coincide with
trans eQTL peaks and gene-environment interaction peaks
observed before [9,15], and have been annotated for potential
causal genes. The full list of recovered interactions is given in
Dataset S1.
Interactions with inferred transcription factor activationsrecapitulate known gene–environment and gene–geneinteractions
We found 12,161 locus-environment interactions affecting 813
gene expression levels (Figure 3) using the same model and testing
approach as for inferred factor interactions (FDR v5%,
Methods). Of these, we recovered 6,328 interactions (62%)
affecting 643 genes (79%) with the Yeastract factors, 8,406
interactions (69%) affecting 716 genes (88%) with the KEGG
factors, and 1,214 interactions (10%) affecting 410 genes (50%)
with the freeform factors. All environment-associated Yeastract
factors had a strong interaction LOD scores with the IRA2 locus,
affecting hundreds of genes. These interactions recapitulate the
gene-environment interactions reported and validated in the
original analysis of the data [15]. It is reassuring that we are able
to recover these interactions with the inferred intermediate
phenotypes, and to expand their repertoire as well as provide
hypotheses for their mechanism.
Preliminary results from an ongoing screen for gene-gene
interactions have shown epistatic interactions for 95,445 gene pairs
[14]. Three hundred and sixty eight knockouts of a Yeastract
factor gene and an interaction peak gene were tested in this large-
scale assay, with 40 epistatic interactions found. We found
interactions for 28 of the 368 pairs, but recovered none of the
40 interactions of [14]. Our screen is for a genetic interactions that
are different from the synthetic lethal screen of Costanzo et al.
Consistent with this, we find neither more nor less overlap than
expected by chance.
Discussion
Our genetic analysis of the gene expression data from [15] has
shown that inferred intermediate phenotypes are valuable for
generating hypotheses about plausible connections between
genetic and gene expression variation. Using these inferred
cellular phenotypes, we identified loci associated with transcription
factor and pathway activations, thus giving the genetic effect a
straightforward mechanistic interpretation, and often suggesting a
candidate gene responsible for the change. Perhaps most
importantly, for the first time, we considered and found statistical
interaction effects with inferred intermediate phenotypes.
Our work is a step towards interpreting and understanding
effects of genetic variants by putting them into cellular context.
Conventional analysis, relating genotype and expression levels, is
restricted to observed measurements, often producing only
statistical associations instead of a plausible mechanistic view. In
contrast, our approach yields phenotypic variables at an
intermediate level which can be used in the analysis. We showed
that these provide additional interpretability and in some settings
increase statistical power by reducing the number of tests. Besides
standard association and interaction effects between genotype and
gene expression, our approach allows more rich hypothesis spaces
to be explored, where the dependent variable we model is not a
global organism phenotype such as disease label, or a very specific
measurement like a single gene expression level. We have shown
that this analysis is both feasible, and gives interesting results.
The idea of looking for associations and interactions with
inferred intermediate phenotypes will be even more useful in
forthcoming studies that include other cellular measurements. The
inferred transcription factor or pathway activations allow inter-
preting the variability in these measured phenotypes as a result of
changes in regulator activity or pathway state, bridging the gap
between individual molecule measurements, and states of protein
complexes, cellular machines, and pathways. We believe that the
inferred intermediate phenotypes can be much more informative
about the state of the cell and organism than individual locus
genotypes and gene expression levels, and will also show stronger
associations to downstream cellular and tissue phenotypes.
The intermediate activation phenotype has lower dimensionality
compared to the space of genotypes and gene expression levels,
which helps against the burden of multiple testing present in
genome-wide scans for epistatic interactions. We were able to infer
association and interaction effects, including proxies for epistasis,
while finding epistatic interactions by testing all locus pairs is usually
Figure 3. Number of genes affected by a genotype-factor interaction for each locus for Yeastract factors (blue), KEGG factors (red),freeform factors (green), and environment (gray).doi:10.1371/journal.pgen.1001276.g003
Genetic Analysis with Inferred Phenotypes
PLoS Genetics | www.plosgenetics.org 6 January 2011 | Volume 7 | Issue 1 | e1001276
hindered by the billions of tests performed [40,8,12,13]. The
incorporation of prior information to infer interpretable factors is a
flexible way to reduce the number of tests by capturing relevant
parts of the data variation in a few factors, and can also add power if
the factor is a better proxy for the true interacting variable.
The inferred transcription factor activations did not mostly
correlate with their expression level. This is expected, as the
activity of a protein depends on the protein level, localisation,
posttranslational modification state, and existence of binding
partners to carry out its function. Expression level alone is often a
poor proxy for a measure of protein activation.
A range of prior work has applied linear or generalised linear
models to infer unobserved determinants of gene expression levels.
For example, broad hidden factors have been inferred from gene
expression that are likely to be due to confounding sources and
hence can safely be explained away, thereby increasing the power of
eQTL studies [10,23,21]. Although methodologically related, this
work has a completely different aim. Also, unsupervised sparse
linear models have been applied to infer hidden determinants in
gene expression which are subsequently analysed for association to
the genetic state [22]. This approach is closely related to the
‘‘freeform factors’’ included in this analysis for comparison. Overall,
we show that factor learning taking prior knowledge into account
adds statistical identifiability of the actual factors thereby providing
interpretability. Other interesting approaches perform feature
selection to capture relevant properties of the segregating sites in
order to pinpoint the causative allele [33], or build a predictive
(network) model of gene expression, followed by analysing its cliques
and subnetworks [41]. The integration of QTL models and causal
inference in trait networks has also been explored in [42], and a
general statistical framework for this task has been recently
proposed by [43]. While conceptually related, these approaches
build on the assumption that all trait variables are fully observed and
hence do not model unobserved intermediate phenotypes explicitly.
A very recent work proposed an integrated Bayesian ANOVA
model that explains the gene expression profile by modules [44].
These modules in turn are modelled as a function of the genotype,
taking direct and epistatic regulation into account. Importantly, this
approach infers gene expression determinants in an unsupervised
fashion, and hence the interpretation of these association signals can
be difficult and remains as retrospective analysis step. Finally, a
methodologically related sparse factor analysis model employing
prior information has been applied to a narrower dataset with an
aim to explain trans eQTL hotspots [45]. However, the study does
not consider the idea of genetic effects in the phenotypic context, or
look for interaction effects, which is a primary focus of this work.
There has been speculation that a significant proportion of
heritable variability that cannot be attributed to associations with
single loci is due to interaction effects. This hypothesis is intuitively
appealing, since we expect some genetic variants only to have an
effect in a specific context. We have found an abundance of such
statistical interactions, and shown how many of them help to
understand and interpret yeast gene expression regulation. Often,
they recapitulated epistatic or gene-environment interactions, but
nevertheless added a plausible mechanism of action. It will be
especially interesting and important to see how these methods
work on large, extensively genotyped and phenotyped human
cohorts that are becoming available in the near future.
Methods
DatasetsGene expression data from [15] (GEO accession number
GSE9376) were downloaded using PUMAdb (http://puma.
princeton.edu). In line with [15], we considered spots good data
if the intensity was well above background and the feature was not
a nonuniformity outlier. Transcripts with more than 20% of
missing values were discarded. All other missing expression values
were replaced with the averages across the corresponding growth
condition.
The remaining expression data consisted of 5493 probe
measurements for 109 crosses of BY (laboratory) and RM (wild)
strains grown in both glucose and ethanol. For each strain, the
mRNA from the two growth conditions was assayed on one
Agilent slide composed of two arrays, resulting in a total of 218
expression profiles. We normalised the average gene expression for
each slide, and thus each of the 109 segregants to be 0 to account
for the potential experiment bias. Further, as the segregants were
randomised with respect to which of the two dyes was used in the
assay, we subtracted off a linear fit of the dye effect for each gene
separately, as its influence is known to be gene-dependent (e.g.
[46]). Strain genotypes were kindly provided by R. Brem. Each of
the 109 segregant strains was genotyped at 2,956 loci to give a
crude map of genetic background.
Transcription factor binding data were downloaded from
Yeastract [26] (Version 1.1438) and contained binary indicators
of binding between 174 transcription factors and 5,914 genes. We
considered 3,000 most variable probes whose corresponding genes
were included in the binding matrix, and transcription factors that
influenced at least 5 genes. After further discarding probes for
which there were no data available, the remaining Yeastract prior
dataset consisted of binding data for 167 transcription factors
affecting 2,941 genes.
Similarly, pathway information were downloaded from the
KEGG database [27]. Only pathways with at least 5 genes were
included in the network prior. This filtering procedure retained 63
pathways controlling 1,263 genes. The results of [15] were not
used as a source of information for either of the prior datasets.
Statistical modelThe statistical model underlying our analysis assumes that the
gene expression levels are influenced by effects of locus genotypes,
intermediate factors, and interaction effects between them. These
effects jointly influence expression variability in an additive
manner, resulting in a generative model for expression yg,j of
gene g in individual j of the form:
yg,j~mgzXN
n~1
hg,nsn,j
|fflfflfflfflfflffl{zfflfflfflfflfflffl}SNP effect
zXK
k~1
wg,kxk,j
|fflfflfflfflfflfflffl{zfflfflfflfflfflfflffl}factor effect
z
XK
k~1
XN
n~1
wg,k,n sn,jxk,j
� �|fflfflfflfflfflfflfflfflfflfflfflfflfflfflfflfflffl{zfflfflfflfflfflfflfflfflfflfflfflfflfflfflfflfflffl}
interaction term
zyg,j :
ð2Þ
Here, mg is the mean expression level, yg,j the residual expression
(noise), and hg,n denote the weights of genotypes of SNPs sn,j . The
activations xk~(xk,1, . . . ,xk,J ) of K intermediate factors are
modelled as unobserved latent variables that linearly influence
gene g with weights wg,k. Finally, the strength of interaction effects
between factor k and SNP n is regulated by the interaction weights
wg,k,n.
On a second level of the model, the latent factor activations xk
may themselves be associated to the genetic state. Again assuming
a linear model, these relations are cast as
Genetic Analysis with Inferred Phenotypes
PLoS Genetics | www.plosgenetics.org 7 January 2011 | Volume 7 | Issue 1 | e1001276
xk,j~mkzXN
n~1
bk,nsn,j|fflfflffl{zfflfflffl}SNP effect
zEk,j , ð3Þ
where bk,n is the association weight and Ek,j denotes the
observation noise.
While appealing because of its generality, it is hard to perform
joint parameter inference in the model implied by Equations (2)
and (3). Here, we follow a two-step approach to approximate the
joint inference:
1. Factor inference. The latent factors X~(x1, . . . ,xK ) and
weights W~fwg,kg are inferred from the expression levels
alone, not taking the effects of SNPs sn,j via association or
interaction into account.
2. Association and interaction testing. Significance of
associations of factors to SNPs (Equation (3)) and SNP-gene-
factor interaction terms (Equation (2)) are tested conditioned on
the state of the inferred factors.
This approach renders the inferences tractable and allows for
statistical significance testing of the potential influencing effects
that make up the total gene expression variability (Equation (2)). In
this scheme, the factor inference is approximated, as the
contribution of direct SNP effects and interactions is not taken
into account while learning. In the context of the dataset
investigated here, this approximation is well justified because of
the relative effect sizes. The total variance explained by the
interactions is small compared to the direct factor effects. If
necessary on other datasets, this step-wise procedure could also be
iterated, refining the state of the inferred factors given the state of
associations and interactions.
The implementation of the statistical models for the inference
step and the statistical tests are described in the following.
Factor inferenceFactors are inferred using a sparse Bayesian factor analysis
model (Figure S3) [24,25]. Starting from the full model in
Equation (2), the terms for direct genetic associations and
interactions are dropped. The remaining factor model explains
the expression profile yj~(y1,j , . . . ,yG,j)T of the G genes for
segregant j by a product of activations xj~(x1,j , . . . ,xK ,j)T of the
K factors, and the G times K weight matrix W~(w1, . . . ,wG) and
per-gene Gaussian noise y~(y1, . . . ,yG)T
yg,j~wg:xjzyg: ð4Þ
The expression data Y is observed, and all other variables are
treated as random variables with corresponding prior probabili-
ties. The indicator variable zg,k encodes whether factor k regulates
gene g (zg,k~1) or not (zg,k~0).
P(wg,k Dzg,k~0)~N (wg,k D0,s0)
P(wg,k Dzg,k~1)~N (wg,k D0,1) ð5Þ
The width s0 of the first Gaussian is small, driving the weight to
zero. In experiments, we used s0~10{4. The existing knowledge
about whether a factor affects a gene, extracted from KEGG or
Yeastract, is then encoded as a Bernoulli prior on the indicator
variables zg,k.
pg,k~P(zg,k~1)~g0 no link
1{g1 link
�: ð6Þ
The variable g0 can be thought of as the false negative rate (FNR)
and g1 as the false positive rate (FPR) of the observed prior
information. We used g0~0:06 and g0~0:0001 for Yeastract and
KEGG factors, respectively, and g1~0:001 for both. The ratio of
the false positive and false negative rate is motivated by relatively
high false positive rates in chromatin immunoprecipitation
experiments, and confidence in the KEGG annotations. Altogether,
this part of the model corresponds to a Gaussian mixture of the form
P(wg,k Dpg,k)~pg,kN wg,k D0,1� �
z(1{pg,k)N wg,k D0,s20
� �: ð7Þ
Prior probabilities over factors X are standard Gaussian
distributed, xk,j*N (0,1). The per-gene noise is Gaussian
distributed with precisions tg, yg*N (0,1
tg
). The precisions tg
are in turn a priori Gamma distributed, tg*Gamma(tg Dat,bt).For the experiments this prior was set to be uninformative with
at~bt~0:001.
Inference in the sparse factor analysis model is achieved using a
hybrid of two deterministic approximations, variational learning
(VB) [47] and Expectation Propagation [48], with exact details
presented in [24,25].
Orthogonality of factors to experimental covariates. We
verified that the normalisation procedure applied to the gene
expression profiles (Dataset S1) ruled out any artifactual
dependency of the factor activations on experimental covariates.
First, we checked whether the 109 strain indicator variables
corresponding to the 109 Agilent slides used were correlated with
the factor activations. Factor activations and the indicator
variables were uncorrelated (Pearson’s r2v0:07) for all factor
activations across restarts and choices of prior knowledge. We then
permuted the indicators, and repeated the experiment, observing
correlations stronger than 0.07 for each of the prior settings.
Second, the correlation between the inferred factors and the dye
indicator variable did not exceed 10{10 for any prior setting and
random restart. This is expected as all gene expression profiles
were normalised to be orthogonal to the dye indicator.
Statistical identifiability of factors and model
restarts. In general, factor analysis models are prone to
suffering from intrinsic symmetries such as sign flips or factor
permutations with impacts on the interpretability of obtained
solutions. The informative sparsity prior of our factor analysis
model (Equation (6)) substantially reduces these ambiguities, as it
introduces constraints on possible factor configurations. A detailed
discussion, including a quantitative evaluation of these symmetries
can be found in Text S1.
As an additional measure, our analysis explicitly takes the
variability of factor solutions into account by analysing a set of
inference solutions rather than a single point estimate. In the
experiments, we performed 20 independent runs of the factor
analysis model with parameters randomly initialised from their
respective prior distributions, and used this whole ensemble to test
for significant association and interaction effects.
Association and interaction testingWe used standard marker regression to calculate test statistics
for both association and interaction effects involving the inferred
factor activations, using suitable approximations of the full model
Genetic Analysis with Inferred Phenotypes
PLoS Genetics | www.plosgenetics.org 8 January 2011 | Volume 7 | Issue 1 | e1001276
implied by Equations (2) and (3) (Text S1). In short, we calculated
standard log-odds (LOD) scores for significance of association and
interaction weights. We then repeated this procedure on permuted
data to establish an empirical null distribution of LOD scores, and
calculated local false discovery rates (Q-values) for the association
and interaction statistics. To incorporate the uncertainty in factor
inference in the significance testing, we recalculated the Q-values
for every random restart of the model. Finally, we combined the
Q-values across runs and used this combined statistic to assess the
overall significance of any one effect. The consistency across
restarts may also serve as criterion for the identifiability of a
particular factor association/interaction. Full methods are given in
Text S1.
SoftwareAn open source Python implementation of the sparse factor
analysis model is available from http://www.stegle.info/software/
FAQTL and ftp://ftp.sanger.ac.uk/pub/rd/PEER.
Supporting Information
Dataset S1 List of interactions for each prior setting (combined
q,0.05).
Found at: doi:10.1371/journal.pgen.1001276.s001 (1.09 MB ZIP)
Figure S1 Histogram of average Pearson R‘2 correlation values
between Yeastract factor activations and their corresponding
probe expression measurements.
Found at: doi:10.1371/journal.pgen.1001276.s002 (0.01 MB PDF)
Figure S2 Top panel: number of inferred factor activations
associated (q,0.05) with the genotype of each locus in the
genome. Lower panel: number of trans eQTLs (q,0.05) found for
each locus in the genome.
Found at: doi:10.1371/journal.pgen.1001276.s003 (0.03 MB PDF)
Figure S3 The Bayesian network of the sparse factor analysis
model. Observed data {yg,j} for genes g M {1,… G} in individuals
j M {1, … J} are modelled by the product between unobserved
factor activations {xj} and weights {wg}, and Gaussian observa-
tion noise. The indicator variables {zg,k} determine the state of the
gate, either switching the corresponding mixing weight off or on A
priori knowledge about the connectivity structure is introduced as a
prior on the Bernoulli distribution parameter pg,k. For the hybrid
algorithm VB/EP, Expectation Propagation is used for inference
in the submodel enclosed in the grey shaded area ‘‘EP.’’
Found at: doi:10.1371/journal.pgen.1001276.s004 (0.05 MB PDF)
Table S1 Properties of inferred Yeastract factor activations. Q-
value and average LOD score of association with SNPs (with best
locus) or environment indicator is given for associations with
combined Q-value,0.05.
Found at: doi:10.1371/journal.pgen.1001276.s005 (0.05 MB PDF)
Table S2 Properties of inferred KEGG factor activations. Q-
value and average LOD score of association with SNPs (with best
locus) or environment indicator is given for associations with
combined Q-value,0.05.
Found at: doi:10.1371/journal.pgen.1001276.s006 (0.03 MB PDF)
Table S3 Properties of inferred freeform factor activations. Q-
value and average LOD score of association with SNPs (with best
locus) or environment indicator is given for associations with
combined Q-value,0.05.
Found at: doi:10.1371/journal.pgen.1001276.s007 (0.03 MB PDF)
Table S4 Associations to loci with more than one Yeastract
factor association. Q-value and average LOD score are given for
all factors associated to each locus at combined Q-value,0.050.
Found at: doi:10.1371/journal.pgen.1001276.s008 (0.03 MB PDF)
Table S5 Associations to loci with more than one KEGG factor
association. Q-value and average LOD score are given for all
factors associated to each locus at combined Q-value,0.050.
Found at: doi:10.1371/journal.pgen.1001276.s009 (0.03 MB PDF)
Table S6 Associations to loci with more than one freeform
factor association. Q-value and average LOD score are given for
all factors associated to each locus at combined Q-value,0.050.
Found at: doi:10.1371/journal.pgen.1001276.s010 (0.03 MB PDF)
Table S7 Trans eQTL peaks with at least 50 associations. For
each peak, the number of significant associations to probe
expression levels (1.), number of associations for Yeastract factor
activations significantly associated with the peak (2.), number of
genes more strongly associated with the factor than the peak locus
genotype (3.) are given, together with the number and fraction of
trans eQTLs explained by the factors, fraction of trans eQTLs more
strongly associated with the factor, and fraction of trans eQTLs
associated with a factor that are more strongly associated with the
factor.
Found at: doi:10.1371/journal.pgen.1001276.s011 (0.05 MB PDF)
Text S1 Supplementary methods and simulation study.
Found at: doi:10.1371/journal.pgen.1001276.s012 (0.29 MB PDF)
Acknowledgments
The authors would like to thank Manolis Dermitzakis for suggesting the
idea of looking for interaction effects, Rachel Brem for providing the
genotype data, Leonid Kruglyak for providing the proteome data, Charles
Pettitt for help on simulations, and Jordana Bell, members of the Durbin
group, and Cavendish Road Centre for Excellence for comments on the
manuscript.
Author Contributions
Conceived and designed the experiments: LP OS JW RD. Performed the
experiments: LP OS. Analyzed the data: LP OS. Wrote the paper: LP OS
JW RD.
References
1. Hirschhorn JN, Daly MJ (2005) Genome-wide association studies for common
diseases and complex traits. Nat Rev Genet 6: 95–108.
2. Mackay TFC, Stone EA, Ayroles JF (2009) The genetics of quantitative traits:
challenges and prospects. Nat Rev Genet 10: 565–577.
3. Montgomery SB, Dermitzakis ET (2009) The resolution of the genetics of gene
expression. Hum Mol Genet 18: R211–215.
4. Brem RB, Yvert G, Clinton R, Kruglyak L (2002) Genetic dissection of
transcriptional regulation in budding yeast. Science 296: 752–755.
5. Morley M, Molony CM, Weber TM, Devlin JL, Ewens KG, et al. (2004)
Genetic analysis of genome-wide variation in human gene expression. Nature
430: 743–747.
6. Stranger B, Forrest M, Clark A, Minichiello M, Deutsch S, et al. (2005)
Genome-wide associations of gene expression variation in humans. PLoS Genet
1: e78. doi:10.1371/journal.pgen.0010078.
7. Stranger BEE, Nica ACC, Forrest MSS, Dimas A, Bird CPP, et al. (2007)
Population genomics of human gene expression. Nature Genetics 39:
1217–1224.
8. Brem R, Kruglyak L (2005) The landscape of genetic complexity across 5,700
gene expression traits in yeast. Proc Natl Acad Sci USA 102: 1572.
9. Yvert G, Brem RB, Whittle J, Akey JM, Foss E, et al. (2003) Trans-acting
regulatory variation in Saccharomyces cerevisiae and the role of transcription
factors. Nature Genetics 35: 57–64.
10. Stegle O, Parts L, Durbin R, Winn J (2010) A Bayesian framework to account
for complex non-genetic factors in gene expression levels greatly increases power
in eQTL studies. PLoS Comput Biol 6: e1000770. doi:10.1371/journal.-
pcbi.1000770.
11. Gibson G (2008) The environmental contribution to gene expression profiles.
Nat Rev Genet 9: 575–582.
Genetic Analysis with Inferred Phenotypes
PLoS Genetics | www.plosgenetics.org 9 January 2011 | Volume 7 | Issue 1 | e1001276
12. Storey JD, Akey JM, Kruglyak L (2005) Multiple locus linkage analysis of
genomewide expression in yeast. PLoS Biol 3: e267. doi:10.1371/journal.pbio.0030267.
13. Zou W, Zeng Z (2009) Multiple interval mapping for gene expression QTL
analysis. Genetica 137: 125–134.14. Costanzo M, Baryshnikova A, Bellay J, Kim Y, Spear ED, et al. (2010) The
genetic landscape of a cell. Science 327: 425.15. Smith EN, Kruglyak L (2008) Gene-environment interaction in yeast gene
expression. PLoS Biol 6: e83. 10.1371/journal.pbio.0060083.
16. Chen Y, Zhu J, Lum PY, Yang X, Pi nto S, et al. (2008) Variations in DNAelucidate molecular networks that cause disease. Nature 452: 429.
17. Schadt EE, Lamb J, Yang X, Zhu J, Edwards S, et al. (2005) An integrativegenomics approach to infer causal associations between ge ne expression and
disease. Nature Genetics 37: 710–7.18. Lum PY, Castellini LW, Wang S, Pinto S, Lamb J, et al. (2008) Variations in
DNA elucidate molecular networks that cause disease. Nature 452: 429–35.
19. Alter O, Brown PO, Botstein D (2000) Singular value decomposition forgenome-wide expression data processing and modeling. Proc Natl Acad Sci USA
97: 10101–10106.20. Liao JC, Boscolo R, Yang Y, Tran LM, Sabatti C, et al. (2003) Network
component analysis: Reconstruction of regulatory signals in biological systems.
Proc Natl Acad Sci USA 100: 15522–15527.21. Leek J, Storey J (2007) Capturing heterogeneity in gene expression studies by
surrogate variable analysis. PLoS Genet 3: e161. doi:10.1371/journal.pgen.0030161.
22. Biswas S, Storey J, Akey J (2008) Mapping gene expression quantitative trait lociby singular value decomposition and independent component analysis. BMC
Bioinformatics 9: 244.
23. Stegle O, Kannan A, Durbin R, Winn J (2008) Accounting for non-geneticfactors improves the power of eQTL studies. In: Proceedings of the 12th annual
international conference on Research in computational molecular biologySpringer-Verlag. pp 411–422.
24. Stegle O, Sharp K, Winn J, Rattray M (2010) A comparison of inference in
sparse factor analysis models. Technical report.25. Rattray M, Stegle O, Sharp K, Winn J (2009) Inference algorithms and learning
theory for Bayesian sparse factor analysis. Journal of Physics: Conference Series197: 012002.
26. Teixeira MC, Monteiro P, Jain P, Tenreiro S, Fernandes AR, et al. (2006) TheYEASTRACT database: a tool for the analysis of transcription regulatory
associations in Saccharomyces cerevisiae. Nucleic Acids Research 34: D3–D5.
27. Kanehisa M, Goto S, Kawashima S, Nakaya A (2002) The KEGG databases atGenomeNet. Nucleic Acids Research 30: 42.
28. Storey J, Tibshirani R (2003) Statistical significance for genomewide studies.Proc Natl Acad Sci USA 100: 9440.
29. Wykoff D, Rizvi A, Raser J, Margolin B, O’Shea E (2007) Positive feedback
regulates switching of phosphate transporters in S. cerevisiae. Molecular Cell 27:1005–1013.
30. (2009) Saccharomyces Genome Database. World Wide Web electronicpublication. URL http://www.yeastgenome.org/.
31. McCord R, Pierce M, Xie J, Wonkatal S, Mickel S, et al. (2003) Rfm1, a novel
tethering factor required to recruit the Hst1 histone deacetylase for repression ofmiddle sporulation genes. Molecular and Cellular Biology 23: 2009–2016.
32. Smith J, Ramsey S, Marelli M, Marzolf B, Hwang D, et al. (2007)
Transcriptional responses to fatty acid are coordinated by combinatorialcontrol. Molecular Systems Biology 3.
33. Lee S, Dudley A, Drubin D, Silver P, Krogan N, et al. (2009) Learning a prioron regulatory potential from eQTL data. PLoS Genet 5: e1000358.
doi:10.1371/journal.pgen.1000358.
34. Perlstein EO, Ruderfer DM, Roberts DC, Schreiber SL, Kruglyak L (2007)Genetic basis of individual differences in the response to small-molecule drugs in
yeast. Nature Genetics 39: 496–502.35. Gygi S, Rochon Y, Franza B, Aebersold R (1999) Correlation between protein
and mRNA abundance in yeast. Molecular and Cellular Biology 19: 1720.36. Foss EJ, Radulovic D, Shaffer SA, Ruderfer DM, Bedalov A, et al. (2007)
Genetic basis of proteome variation in yeast. Nature Genetics 39: 1369–1375.
37. Komeili A, O’Shea E (1999) Roles of phosphorylation sites in regulating activityof the transcription factor Pho4. Science 284: 977.
38. O’Conallain C, Doolin M, Taggart C, Thornton F, Butler G (1999) Regulatednuclear localisation of the yeast transcription factor Ace2p controls expression of
chitinase (CTS1) in Saccharomyces cerevisiae. Molecular and General Genetics
MGG 262: 275–282.39. Goerner W, Durchschlag E, Martinez-Pastor M, Estruch F, Ammerer G, et al.
(1998) Nuclear localization of the C2H2 zinc finger protein MSN2P is regulatedby stress and protein kinase A activity. Genes and Development 12: 586.
40. Cordell HJ (2009) Detecting gene-gene interactions that underlie humandiseases. Nat Rev Genet 10: 392–404.
41. Zhu J, Zhang B, Smith EN, Drees B, Brem RB, et al. (2008) Integrating large-
scale functional genomic data to dissect the complexity of yeast regulatorynetworks. Nature Genetics 40: 854–861.
42. Aten J, Fuller T, Lusis A, Horvath S (2008) Using genetic markers to orient theedges in quantitative trait networks: the NEO software. BMC Systems Biology 2:
34.
43. Chaibub Neto E, Keller M, Attie A, Yandell B (2010) Causal graphical modelsin systems genetics: A unified framework for joint inference of causal network
and genetic architecture for correlated phenotypes. The Annals of AppliedStatistics 4: 320–339.
44. Zhang W, Zhu J, Schadt EE, Liu JS (2010) A Bayesian partition method fordetecting pleiotropic and epistatic eQTL modules. PLoS Comput Biol 6:
e1000642. doi:10.1371/journal.pcbi.1000642.
45. Sun W, Yu T, Li K (2007) Detection of eQTL modules mediated by activitylevels of transcription factors. Bioinformatics 23: 2290.
46. Martin-Magniette ML, Aubert J, Cabannes E, Daudin JJ (2005) Evaluation ofthe gene-specific dye bias in cdna microarray experiments. Bioinformatics 21:
1995–2000.
47. Jordan M, Ghahramani Z, Jaakkola T, Saul L (1999) An introduction tovariational methods for graphical models. Machine Learning 37: 183–233.
48. Minka TP (2001) Expectation propagation for approximate Bayesian inference.In: Uncertainty in Artificial Intelligence, volume 17. pp 362–369.
Genetic Analysis with Inferred Phenotypes
PLoS Genetics | www.plosgenetics.org 10 January 2011 | Volume 7 | Issue 1 | e1001276