Embed Size (px)
Citation preview
JOINT CTF-SCF/TFC.17/7
May 24, 2017
Meeting of the Joint Trust Fund Committee Washington D.C. June 7, 2017
RISK REPORT OF THE CTF AND SCF
2
I. INTRODUCTION
At the November 2015 Joint TFC meeting, it was agreed that the CIF AU should proceed with the same systematic approach for implementing the ERM Framework for the subprograms under the SCF as it had done for CTF by defining the top-level risks and objectives for each subprogram, as well as the Risk Categories, Tier 1 and 2 Risks and Risk Tolerances, and assessing risks against these tolerances.
In May 2017 the CIF AU launched three more risk dashboards for the three SCF subprograms (the FIP Risk Dashboard, PPCR Risk Dashboard, and SREP Risk Dashboard).1 Like the CTF Risk Dashboard, most of the content of these SCF Dashboards is consistently updated on a monthly basis. To foster better awareness about the availability of up-to-date risk-related information on these dashboards, in May 2017 the CIF AU initiated a practice of sending monthly email notifications to dashboard users, informing them of the availability of updated risk metrics and summarizing material changes to them.
Additionally, in an effort to improve the timeliness of non-payment event reporting, in
May 2017 the CIF AU initiated a practice of sending quarterly email notices to the MDBs reminding them of their obligations to report these events under the Financial Procedures Agreements, Financing Terms and Review Procedures, and TFC Directives.
This paper provides an update on assessments of the more significant risk exposures
facing the CIF programs and subprograms. Information as of December 31, 2016 was used to flag projects for Implementation Risk. Information pertaining to the other risks is as of March 31, 2017.
II. ASSESSMENT OF KEY RISK EXPOSURES Definition of Risk: Any threat to the achievement of the corresponding CIF program/subprogram’s objectives.
This definition, along with the definition of the CIF program/subprogram’s objectives, establish the context for the ERM Framework.
Presently, the following represent the four most important risks to which the CIF’s program/subprograms are exposed.
i. Implementation Risk – CTF and SCF ii. Currency Risk via Promissory Notes – CTF and SCF
iii. Resource Availability Risk2 – CTF and SCF iv. Credit Risk – CTF
1 The CIF AU launched the CTF Risk Dashboard in January 2016. 2 Previously this was referred to as Over-programming Risk, however, the term ‘over-programming’ historically has referred to different things which has led to confusion so ‘Resource Availability Risk’ is now being used for risk management purposes.
3
This section provides an update on these risk exposures.
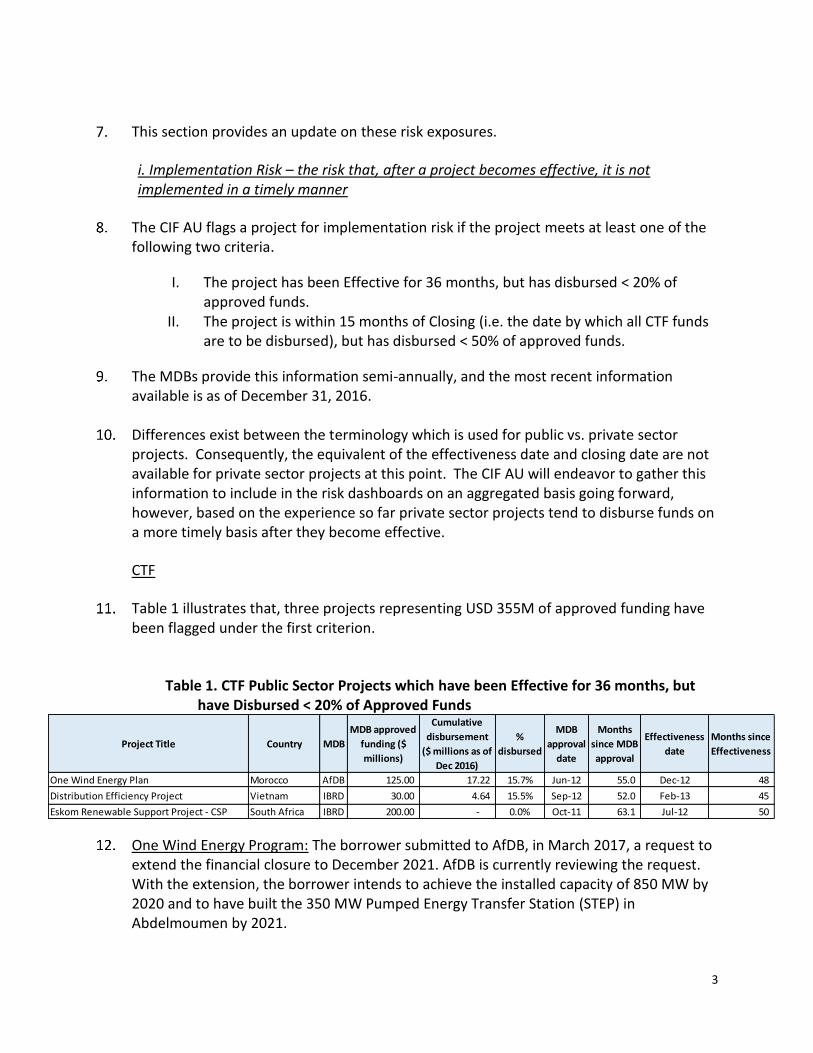
i. Implementation Risk – the risk that, after a project becomes effective, it is not implemented in a timely manner
The CIF AU flags a project for implementation risk if the project meets at least one of the following two criteria.
I. The project has been Effective for 36 months, but has disbursed < 20% of approved funds.
II. The project is within 15 months of Closing (i.e. the date by which all CTF funds are to be disbursed), but has disbursed < 50% of approved funds.
The MDBs provide this information semi-annually, and the most recent information available is as of December 31, 2016.
Differences exist between the terminology which is used for public vs. private sector projects. Consequently, the equivalent of the effectiveness date and closing date are not available for private sector projects at this point. The CIF AU will endeavor to gather this information to include in the risk dashboards on an aggregated basis going forward, however, based on the experience so far private sector projects tend to disburse funds on a more timely basis after they become effective.
CTF
Table 1 illustrates that, three projects representing USD 355M of approved funding have been flagged under the first criterion.
Table 1. CTF Public Sector Projects which have been Effective for 36 months, but
have Disbursed < 20% of Approved Funds
One Wind Energy Program: The borrower submitted to AfDB, in March 2017, a request to extend the financial closure to December 2021. AfDB is currently reviewing the request. With the extension, the borrower intends to achieve the installed capacity of 850 MW by 2020 and to have built the 350 MW Pumped Energy Transfer Station (STEP) in Abdelmoumen by 2021.
Project Title Country MDB
MDB approved
funding ($
millions)
Cumulative
disbursement
($ millions as of
Dec 2016)
%
disbursed
MDB
approval
date
Months
since MDB
approval
Effectiveness
date
Months since
Effectiveness
One Wind Energy Plan Morocco AfDB 125.00 17.22 15.7% Jun-12 55.0 Dec-12 48
Distribution Efficiency Project Vietnam IBRD 30.00 4.64 15.5% Sep-12 52.0 Feb-13 45
Eskom Renewable Support Project - CSP South Africa IBRD 200.00 - 0.0% Oct-11 63.1 Jul-12 50
4
The delays are primarily due to complexities with the procurement processes (e.g. PPP, a single lot, multi-donor context (AfDB, EIB, UE, KFW)). The time elapsed between the launch of the prequalification of the project and the provisional award took 53 months which was well beyond initial expectations. The PPP contracts are under negotiations and will be signed before the end of June 2017. The delay in the start-up of the STEP in Abdelmoumen was also due to the fact that the first pre-qualification process of this project was cancelled, leading to a delay of nearly 48 months in the procurement process. The process is now at its final stage and it is expected that the contract will be signed before September 2017 with work commencing in November 2017.
Distribution Efficiency Project: Disbursement has been slow due to a variety of factors,
including delays in setting up the central coordination unit (CMU) and local project implementation units (PIUs) in participating utility companies which were affected after the "Euromaidan revolution" and the ensuing complicated political situation. Insufficient capacity of the PIUs with lack of experience in Bank procedures caused further delays.
The difficult financial position of the utilities also contributed to slow disbursement since
most are facing short-term liquidity problems, although CTF support is beneficial for utilities in the long term. Despite these constraints, disbursements have commenced with most investments getting to the implementation stage.
Eskom Renewable Energy Project - CSP: The suggestions provided by the financiers to
resolve the procurement issues that were impacting the implementation were duly noted by Eskom, which initiated engagements with key stakeholders to discuss the options available for the continuation of the CSP project or its review. The procurement of the CSP component has not proceeded due to higher risk of failure and due to high cost (both CSP bids received were found to be non-responsive). Eskom has indicated that it is developing an alternative proposal to explore replacing the CSP component with a Solar PV/battery storage hybrid solution, and indicated that it will share this proposal with IBRD, AfDB and other co-financiers for review. All options are on the table and IBRD has indicated that it intends to review Eskom’s proposal prior to proposing next steps to the TFC.
Table 2 illustrates the 3 projects representing USD 525M of approved funding which have been flagged under the second criterion.
5
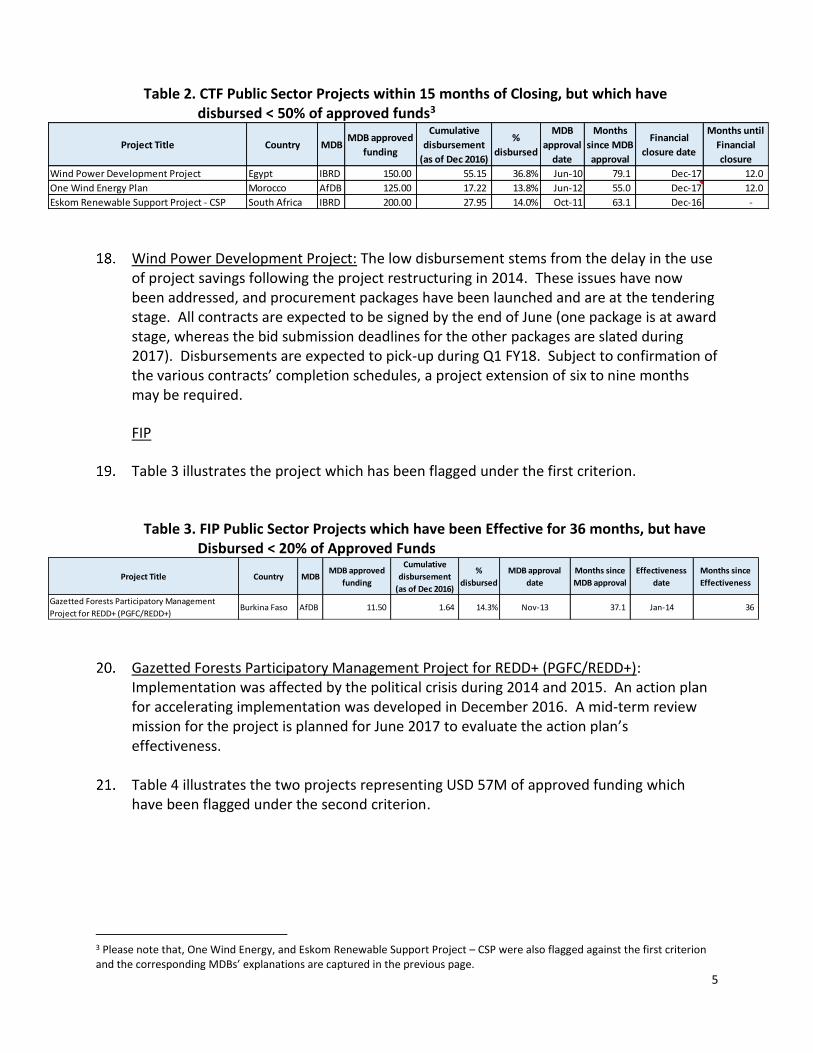
Table 2. CTF Public Sector Projects within 15 months of Closing, but which have disbursed < 50% of approved funds3
Wind Power Development Project: The low disbursement stems from the delay in the use of project savings following the project restructuring in 2014. These issues have now been addressed, and procurement packages have been launched and are at the tendering stage. All contracts are expected to be signed by the end of June (one package is at award stage, whereas the bid submission deadlines for the other packages are slated during 2017). Disbursements are expected to pick-up during Q1 FY18. Subject to confirmation of the various contracts’ completion schedules, a project extension of six to nine months may be required.
FIP
Table 3 illustrates the project which has been flagged under the first criterion.
Table 3. FIP Public Sector Projects which have been Effective for 36 months, but have
Disbursed < 20% of Approved Funds
Gazetted Forests Participatory Management Project for REDD+ (PGFC/REDD+): Implementation was affected by the political crisis during 2014 and 2015. An action plan for accelerating implementation was developed in December 2016. A mid-term review mission for the project is planned for June 2017 to evaluate the action plan’s effectiveness.
Table 4 illustrates the two projects representing USD 57M of approved funding which have been flagged under the second criterion.
3 Please note that, One Wind Energy, and Eskom Renewable Support Project – CSP were also flagged against the first criterion and the corresponding MDBs’ explanations are captured in the previous page.
Project Title Country MDBMDB approved
funding
Cumulative
disbursement
(as of Dec 2016)
%
disbursed
MDB
approval
date
Months
since MDB
approval
Financial
closure date
Months until
Financial
closure
Wind Power Development Project Egypt IBRD 150.00 55.15 36.8% Jun-10 79.1 Dec-17 12.0
One Wind Energy Plan Morocco AfDB 125.00 17.22 13.8% Jun-12 55.0 Dec-17 12.0
Eskom Renewable Support Project - CSP South Africa IBRD 200.00 27.95 14.0% Oct-11 63.1 Dec-16 -
Project Title Country MDBMDB approved
funding
Cumulative
disbursement
(as of Dec 2016)
%
disbursed
MDB approval
date
Months since
MDB approval
Effectiveness
date
Months since
Effectiveness
Gazetted Forests Participatory Management
Project for REDD+ (PGFC/REDD+)Burkina Faso AfDB 11.50 1.64 14.3% Nov-13 37.1 Jan-14 36
6
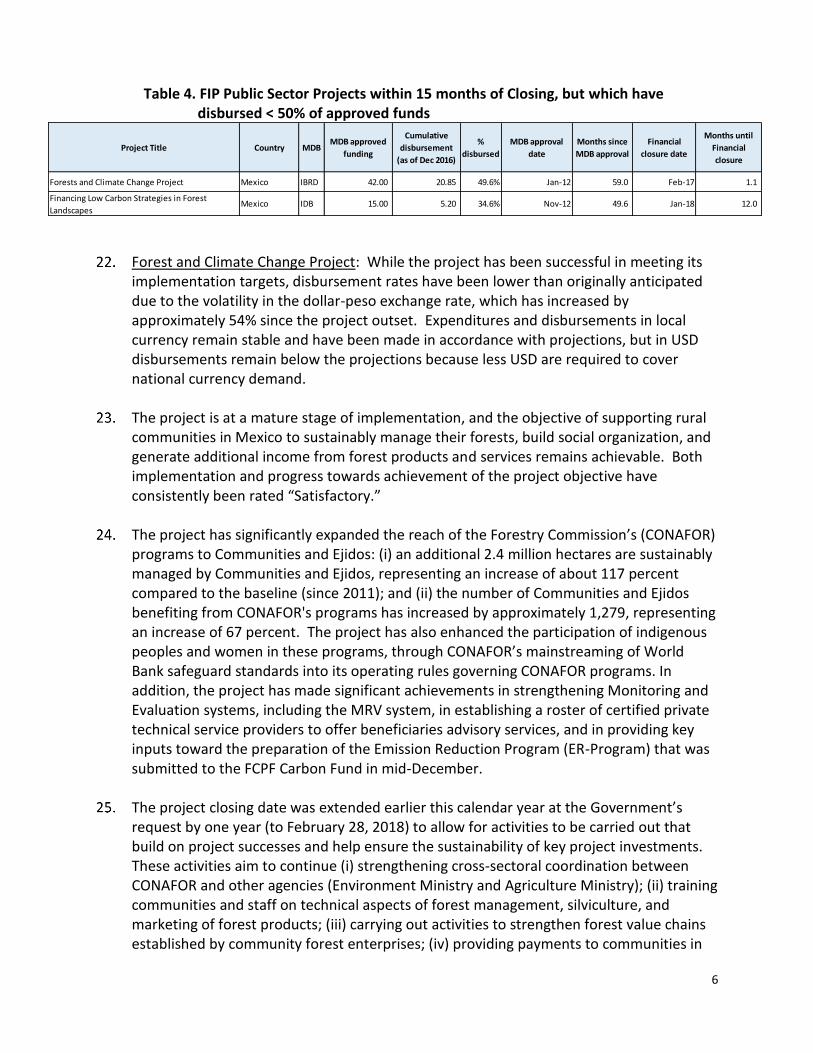
Table 4. FIP Public Sector Projects within 15 months of Closing, but which have disbursed < 50% of approved funds
Forest and Climate Change Project: While the project has been successful in meeting its implementation targets, disbursement rates have been lower than originally anticipated due to the volatility in the dollar-peso exchange rate, which has increased by approximately 54% since the project outset. Expenditures and disbursements in local currency remain stable and have been made in accordance with projections, but in USD disbursements remain below the projections because less USD are required to cover national currency demand.
The project is at a mature stage of implementation, and the objective of supporting rural
communities in Mexico to sustainably manage their forests, build social organization, and generate additional income from forest products and services remains achievable. Both implementation and progress towards achievement of the project objective have consistently been rated “Satisfactory.”
The project has significantly expanded the reach of the Forestry Commission’s (CONAFOR)
programs to Communities and Ejidos: (i) an additional 2.4 million hectares are sustainably managed by Communities and Ejidos, representing an increase of about 117 percent compared to the baseline (since 2011); and (ii) the number of Communities and Ejidos benefiting from CONAFOR's programs has increased by approximately 1,279, representing an increase of 67 percent. The project has also enhanced the participation of indigenous peoples and women in these programs, through CONAFOR’s mainstreaming of World Bank safeguard standards into its operating rules governing CONAFOR programs. In addition, the project has made significant achievements in strengthening Monitoring and Evaluation systems, including the MRV system, in establishing a roster of certified private technical service providers to offer beneficiaries advisory services, and in providing key inputs toward the preparation of the Emission Reduction Program (ER-Program) that was submitted to the FCPF Carbon Fund in mid-December.
The project closing date was extended earlier this calendar year at the Government’s
request by one year (to February 28, 2018) to allow for activities to be carried out that build on project successes and help ensure the sustainability of key project investments. These activities aim to continue (i) strengthening cross-sectoral coordination between CONAFOR and other agencies (Environment Ministry and Agriculture Ministry); (ii) training communities and staff on technical aspects of forest management, silviculture, and marketing of forest products; (iii) carrying out activities to strengthen forest value chains established by community forest enterprises; (iv) providing payments to communities in
Project Title Country MDBMDB approved
funding
Cumulative
disbursement
(as of Dec 2016)
%
disbursed
MDB approval
date
Months since
MDB approval
Financial
closure date
Months until
Financial
closure
Forests and Climate Change Project Mexico IBRD 42.00 20.85 49.6% Jan-12 59.0 Feb-17 1.1
Financing Low Carbon Strategies in Forest
LandscapesMexico IDB 15.00 5.20 34.6% Nov-12 49.6 Jan-18 12.0

7
exchange for environmental services; (v) aligning forestry, agriculture and livestock policies and programs and customizing CONAFOR's forestry incentive programs to promote REDD+ practices at the community level; and (vi) providing financing to communities carrying out REDD+ activities.
Financing Low Carbon Strategies in Forest Landscapes: It took much longer than anticipated to hire a Technical Assistance and Promotion Facility for the project. It has now been hired and IDB anticipates that disbursements will now accelerate. The financial closure date has been extended by two years to January 2020.
PPCR
Table 5 illustrates the seven projects representing USD 95M of approved funding which have been flagged under the first criterion.
Table 5. PPCR Public Sector Projects which have been Effective for 36 months, but
have Disbursed < 20% of Approved Funds
Climate Proofing of Agricultural Infrastructure and Business-focused Adaptation (Cambodia): The consulting services needed to be adjusted which delayed the project, however, efforts are underway to expedite disbursements. A contract has been awarded for the rehabilitation of two core irrigation subprojects amounting to USD 1.97 million and construction work has begun. A contract was expected to be awarded for land leveling in June 2017, and the project’s anticipated completion date is now March 2020.
GMS Southern Economic Corridor Towns Development Project: Delays in consultant recruitment and in finalizing detailed engineering designs have led to slower disbursements. The civil works contracts have not been awarded. A review mission was conducted in August 9-19, 2016 to address project implementation issues. The mission prioritized subprojects to fit within the available budget and bidding on the projects commenced in 2016. As of December, 31 2016, detailed engineering designs for the five PPCR subprojects (Battambang Wastewater Treatment, Poipet Wastewater Treatment, Bavet Wastewater Treatment, Battambang Flood Control and Neak Loeung Flood Control) were approximately 60% completed. A request to extend the financial closure date to December 31, 2018 is being processed.
Project Title Country MDB
MDB
approved
funding
Cumulative
disbursement
(as of Dec 2016)
%
disbursed
MDB
approval
date
Months
since MDB
approval
Effectiveness
date
Months since
Effectiveness
Climate Proofing of Agricultural Infrastructure and Business-focused
AdaptationCambodia ADB 9.50 0.85 8.9% Jun-13 42.2 Nov-13 38
GMS Southern Economic Corridor Towns Development Project Cambodia ADB 9.40 0.50 5.4% Dec-12 48.7 Apr-13 45
Mainstreaming Climate Resilience into Development Planning Cambodia ADB 7.00 1.34 19.2% Oct-12 51.0 Oct-12 50
Climate Information Development and Forecasting Project (PDIPC) Niger AFDB 13.00 0.86 6.7% Sep-12 51.1 Aug-13 41
Water Resources Mobilization and Development Project
(PROMOVARE)Niger AFDB 22.00 1.96 8.9% Sep-12 51.1 Aug-13 41
Climate Information System and PPCR Program Coordination Yemen IBRD 19.00 1.59 8.4% Sep-13 39.9 Oct-13 39
Enhancing Climate Resilience for West Coast Road ProjectSouth Pacific-
SamoaIBRD 14.80 1.11 7.5% Dec-12 48.5 Apr-13 44
8
Mainstreaming Climate Resilience into Development Planning: The initial consulting firm was terminated due to breach of contract and late completion of PPCR Phase 1 TA activities, which has led to a two-year delay in implementation. The anticipated completion date is now December 2019. A new consulting firm was recruited in February 2015.
As of June 30, 2016, the total amount of contracts awarded was USD 5.99 million and the total disbursement is USD 1.42 million. The TA established a PPCR coordinating and technical backstopping unit and a SPCR Coordination team with representatives from 10 ministries and two agencies. The SPCR Coordination Team held four meetings (June 2014, July 2015, December 2015 and June 2016) to discuss (i) progress of eight SPCR investment projects (three on agriculture, one on water resources, two on road transport, and two on urban water supply and sanitation); (ii) use of climate change risk screening tools; and (iii) development of indicators for effectiveness of adaptation measures. Five stakeholder consultation meetings were organized for monitoring and reporting of the PPCR core indicators, and three reports delivered (2014, 2015 and 2016).
The TA Package A delivered an inception report, four quarterly progress reports, four SPCR Newsletters, nine SPCR investment project sheets (drafts), one draft technical report on climate risk screening tools, 10 agriculture and water management case studies (draft), two adaptation toolkits on agriculture and water resources (draft), and a baseline report on TA DMF (draft). Six field trips were conducted for members of the adaptation working group to identify potential adaptation projects and conduct feasibility studies. An English SPCR website was launched while the Khmer website is still under preparation. So far, five workshops have been conducted benefitting 290 stakeholders.
The TA Package B delivered an inception report, capacity needs assessment report, three quarterly progress reports, one project brochure, and organized two training workshops for CSOs on CBA and DRR, vulnerability risk assessment tools and project management benefitting 150 stakeholders. Of the 136 CSOs who expressed interest, 19 were selected to receive small grants totaling approximately USD 1.4 million. Signing of contracts with selected CSOs is in progress.
Climate Information Development and Forecasting Project (PDIPC): The project experienced initial institutional problems that blocked the project until June 2015. Since the project implementation unit carried out a large part of the preliminary studies for the implementation of the project activities, the procurement process took more time than expected. There are still delays in the implementation of the other activities of the project, mainly the acquisition and installation of hydro meteorological measurement stations. Concerns with the level of implementation of the project remain, and it is very likely that the project will not reach its expected objectives by the end of 2018, and that an extension will be necessary.
9
Water Resources Mobilization and Development Project (PROMOVARE): The project experienced initial problems which obstructed its progress during the first two years, and its effective start date was June 2015. Since then, all the planned studies have been carried out, the procurement processes required for the completion of the works are finalized, the contracts have been signed and the work commenced during this first quarter of 2017. The work related with the hydro-agricultural development are foreseen to start by early 2018. With the commitment of all construction contracts, the rate of disbursement of the loan reached 8.9% and AfDB estimates that disbursement will exceed 20% by the end of 2017. AfDB believes that the project will reach its physical and financial objectives by the end of 2018.
Climate Information System and PPCR Program Coordination: This project has since been cancelled.
Enhancing Climate Resilience for West Coast Road Project: The low disbursement rate can be attributed to delays with Component 1 which comprises the bulk of funds (over 80% of total project costs). The bidding process cannot start until the design is completed. Issuance of civil works bidding documents is currently scheduled for late June 2017. Based on indicative procurement timelines, contract signing would tentatively take place in early 2018. This is dependent on Land Transfer Authority capacity and Government of Samoa tender board requirements to evaluate bids in a timely manner. Once construction begins, disbursements will accelerate quickly.
The delays have largely been due to: (i) confusion and debate between Government agencies regarding the road reserve boundaries for the West Coast Road which have stalled completion of the road design; (ii) unacceptable deliverables from the design consultants; (iii) lack of capacity within the implementing agency’s project management division (there have been four different project managers for the project over the past two years); and (iv) lack of support from the Project Management Consultancy in effectively managing a relatively poorly performing design consultant. Much of the aforementioned issues are derived from thin capacity within Government of Samoa in three key areas: project management, procurement and financial management.
Actions are being taken to improve the pace of implementation, including the task team conducting more intensive supervision missions, conducting regular conference calls with the client and the earlier deployment of an Implementation Support Specialist. In addition, a Technical Advisor has been deployed within the implementing agency to provide much needed project management support. Most recently, during the April 2017 mission, the task team helped the government put together an action plan to address the issues in the areas of project management, procurement, and financial management so that the project can be brought back on track. Doing so will require a restructure (including an extension) in order for the project to meet its PDO. A mid-term review is currently planned for August 2017.
10
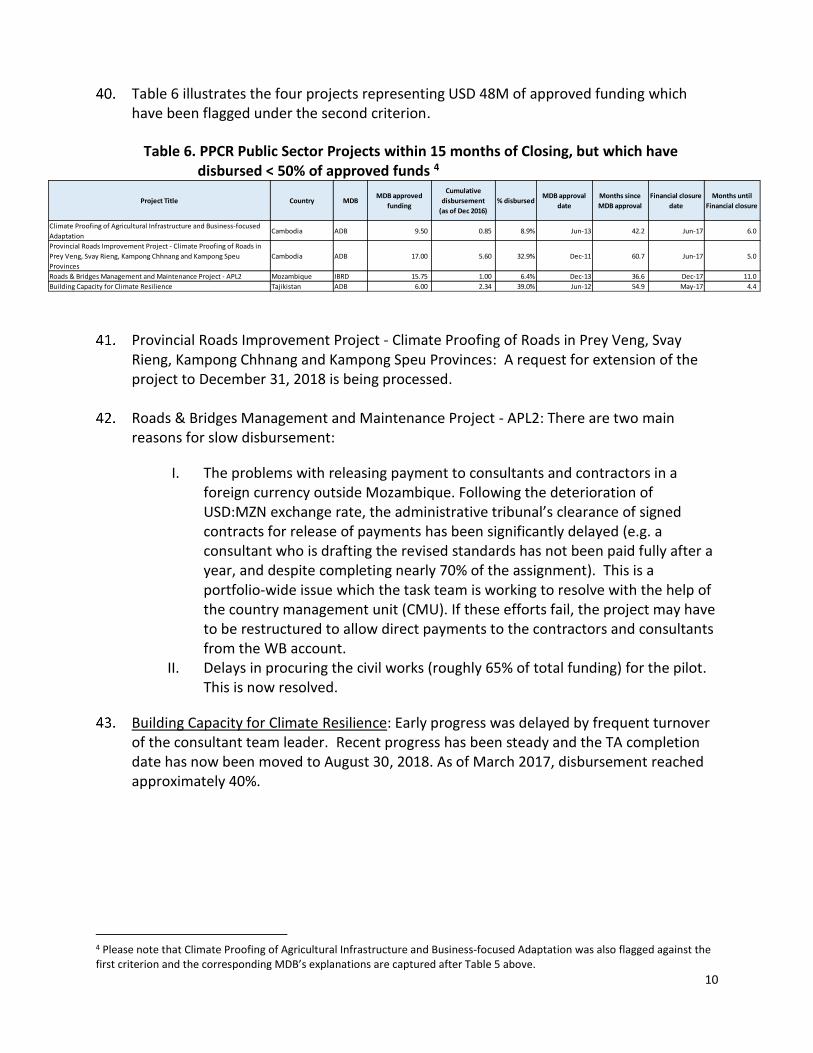
Table 6 illustrates the four projects representing USD 48M of approved funding which have been flagged under the second criterion.
Table 6. PPCR Public Sector Projects within 15 months of Closing, but which have disbursed < 50% of approved funds 4
Provincial Roads Improvement Project - Climate Proofing of Roads in Prey Veng, Svay Rieng, Kampong Chhnang and Kampong Speu Provinces: A request for extension of the project to December 31, 2018 is being processed.
Roads & Bridges Management and Maintenance Project - APL2: There are two main reasons for slow disbursement:
I. The problems with releasing payment to consultants and contractors in a foreign currency outside Mozambique. Following the deterioration of USD:MZN exchange rate, the administrative tribunal’s clearance of signed contracts for release of payments has been significantly delayed (e.g. a consultant who is drafting the revised standards has not been paid fully after a year, and despite completing nearly 70% of the assignment). This is a portfolio-wide issue which the task team is working to resolve with the help of the country management unit (CMU). If these efforts fail, the project may have to be restructured to allow direct payments to the contractors and consultants from the WB account.
II. Delays in procuring the civil works (roughly 65% of total funding) for the pilot. This is now resolved.
Building Capacity for Climate Resilience: Early progress was delayed by frequent turnover of the consultant team leader. Recent progress has been steady and the TA completion date has now been moved to August 30, 2018. As of March 2017, disbursement reached approximately 40%.
4 Please note that Climate Proofing of Agricultural Infrastructure and Business-focused Adaptation was also flagged against the first criterion and the corresponding MDB’s explanations are captured after Table 5 above.
Project Title Country MDBMDB approved
funding
Cumulative
disbursement
(as of Dec 2016)
% disbursedMDB approval
date
Months since
MDB approval
Financial closure
date
Months until
Financial closure
Climate Proofing of Agricultural Infrastructure and Business-focused
AdaptationCambodia ADB 9.50 0.85 8.9% Jun-13 42.2 Jun-17 6.0
Provincial Roads Improvement Project - Climate Proofing of Roads in
Prey Veng, Svay Rieng, Kampong Chhnang and Kampong Speu
Provinces
Cambodia ADB 17.00 5.60 32.9% Dec-11 60.7 Jun-17 5.0
Roads & Bridges Management and Maintenance Project - APL2 Mozambique IBRD 15.75 1.00 6.4% Dec-13 36.6 Dec-17 11.0
Building Capacity for Climate Resilience Tajikistan ADB 6.00 2.34 39.0% Jun-12 54.9 May-17 4.4
11
SREP
SREP does not have any projects with material funding which have been flagged under either criteria.
ii. Currency Risk via Promissory Notes – the risk that fluctuations in currency exchange rates will cause the value of the foreign currency in which a promissory note is denominated to decline.
The primary source of currency risk exposure for each CIF program/subprogram remains the outstanding (unencashed) foreign currency denominated promissory notes. Each CIF program/subprogram is exposed to the risk that the value of the foreign currency in which a promissory note is denominated will decline before the promissory note is encashed.
Each CIF program/subprogram received substantial contributions in the form of GBP-denominated promissory notes. GBP-denominated promissory note contributions across all programs/subprograms total almost GBP 2.06 billion. The portion of these promissory notes which remain outstanding is GBP 1.19 billion, and has not changed since the December 2016 TFC Meetings. Significant exposures to fluctuations in the value of the GBP relative to the USD have been incurred across all programs/subprograms as a result.
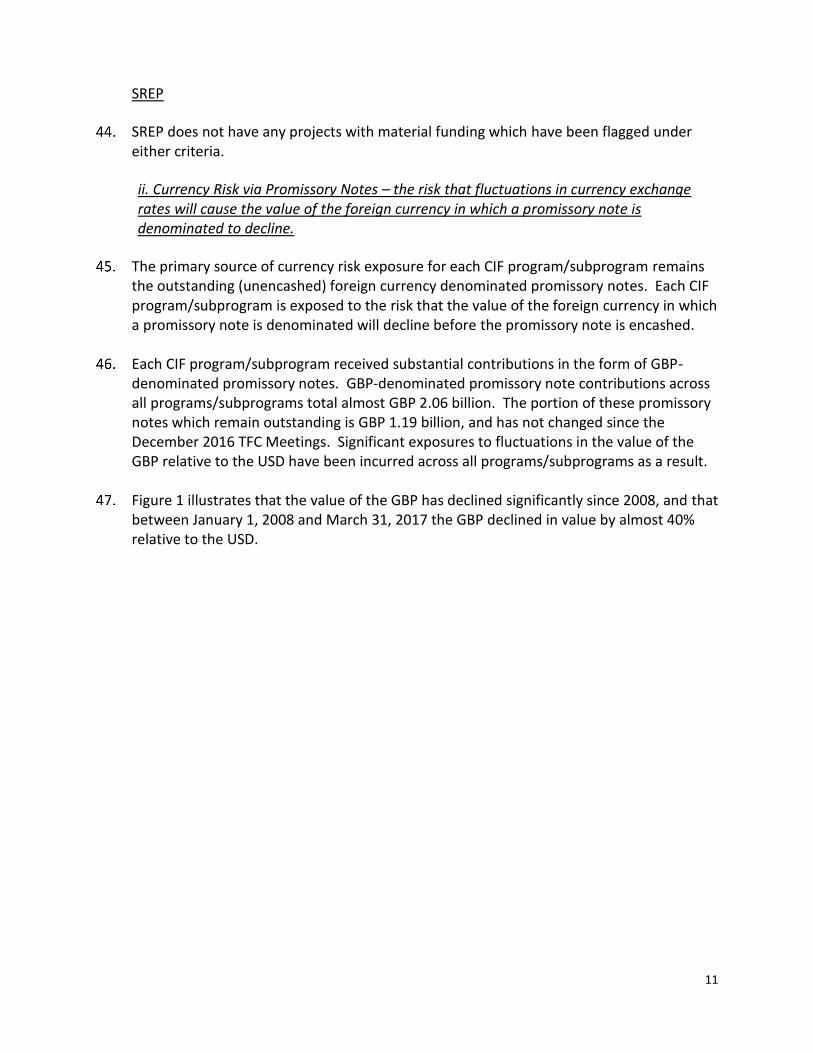
Figure 1 illustrates that the value of the GBP has declined significantly since 2008, and that between January 1, 2008 and March 31, 2017 the GBP declined in value by almost 40% relative to the USD.
12
Figure 1: GBP/USD Exchange Rates January 1, 2008 – March 31, 2017
On June 23, 2016, the UK held a referendum where the electorate voted to commence the process for leaving the EU. This caused a sharp 8% decline in the value of the GBP for the month of June, followed by further declines in the following months.
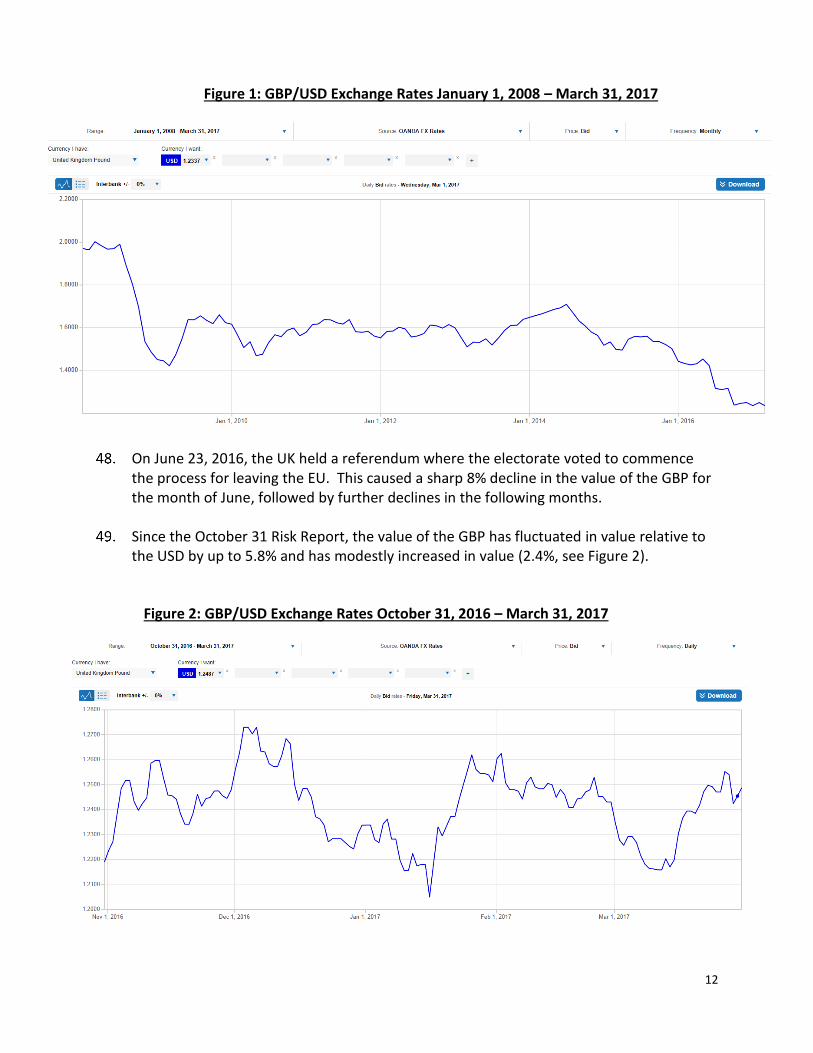
Since the October 31 Risk Report, the value of the GBP has fluctuated in value relative to the USD by up to 5.8% and has modestly increased in value (2.4%, see Figure 2).
Figure 2: GBP/USD Exchange Rates October 31, 2016 – March 31, 2017
13
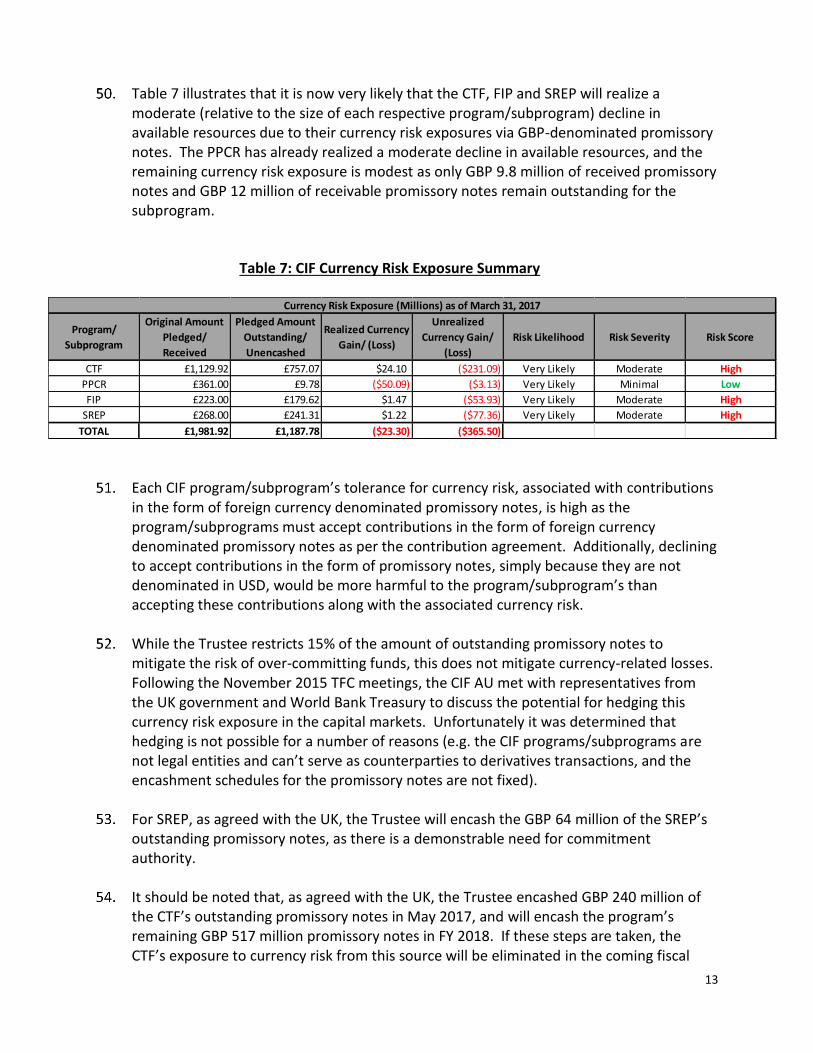
Table 7 illustrates that it is now very likely that the CTF, FIP and SREP will realize a moderate (relative to the size of each respective program/subprogram) decline in available resources due to their currency risk exposures via GBP-denominated promissory notes. The PPCR has already realized a moderate decline in available resources, and the remaining currency risk exposure is modest as only GBP 9.8 million of received promissory notes and GBP 12 million of receivable promissory notes remain outstanding for the subprogram.
Table 7: CIF Currency Risk Exposure Summary
Each CIF program/subprogram’s tolerance for currency risk, associated with contributions in the form of foreign currency denominated promissory notes, is high as the program/subprograms must accept contributions in the form of foreign currency denominated promissory notes as per the contribution agreement. Additionally, declining to accept contributions in the form of promissory notes, simply because they are not denominated in USD, would be more harmful to the program/subprogram’s than accepting these contributions along with the associated currency risk.
While the Trustee restricts 15% of the amount of outstanding promissory notes to mitigate the risk of over-committing funds, this does not mitigate currency-related losses. Following the November 2015 TFC meetings, the CIF AU met with representatives from the UK government and World Bank Treasury to discuss the potential for hedging this currency risk exposure in the capital markets. Unfortunately it was determined that hedging is not possible for a number of reasons (e.g. the CIF programs/subprograms are not legal entities and can’t serve as counterparties to derivatives transactions, and the encashment schedules for the promissory notes are not fixed).
For SREP, as agreed with the UK, the Trustee will encash the GBP 64 million of the SREP’s outstanding promissory notes, as there is a demonstrable need for commitment authority.
It should be noted that, as agreed with the UK, the Trustee encashed GBP 240 million of the CTF’s outstanding promissory notes in May 2017, and will encash the program’s remaining GBP 517 million promissory notes in FY 2018. If these steps are taken, the CTF’s exposure to currency risk from this source will be eliminated in the coming fiscal
Program/
Subprogram
Original Amount
Pledged/
Received
Pledged Amount
Outstanding/
Unencashed
Realized Currency
Gain/ (Loss)
Unrealized
Currency Gain/
(Loss)
Risk Likelihood Risk Severity Risk Score
CTF £1,129.92 £757.07 $24.10 ($231.09) Very Likely Moderate High
PPCR £361.00 £9.78 ($50.09) ($3.13) Very Likely Minimal Low
FIP £223.00 £179.62 $1.47 ($53.93) Very Likely Moderate High
SREP £268.00 £241.31 $1.22 ($77.36) Very Likely Moderate High
TOTAL £1,981.92 £1,187.78 ($23.30) ($365.50)
Currency Risk Exposure (Millions) as of March 31, 2017
14
year. As a matter of policy, however, the UK generally is unable to permit encashment of its promissory notes in the absence of a demonstrable need for liquidity or commitment authority.
It is important to note that the declines in available resources which result from currency risk exposure aggravate resource availability risk.
iii. Resource Availability Risk – the risk that the Trustee will not have sufficient resources, under a respective CIF program/subprogram, to commit to fund all projects in the program/subprogram’s pipeline.
From a risk management perspective, currency risk reserves and pledges which have not yet been received are treated as being unavailable for committing to fund projects because these two sources of funds may not be available if the corresponding currency declines substantially or the pledge is never received. Resource availability risk, if not addressed, may result in unmet recipient expectations, and damage to the CIF’s reputation.
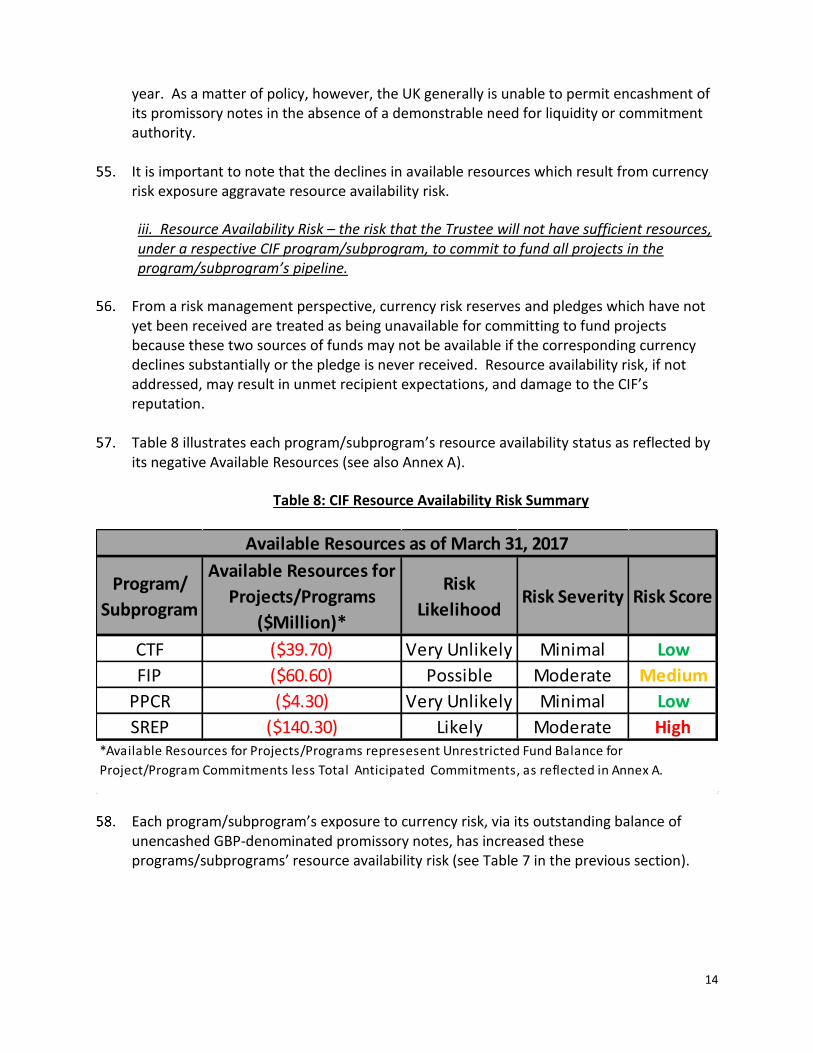
Table 8 illustrates each program/subprogram’s resource availability status as reflected by its negative Available Resources (see also Annex A).
Table 8: CIF Resource Availability Risk Summary
Each program/subprogram’s exposure to currency risk, via its outstanding balance of unencashed GBP-denominated promissory notes, has increased these programs/subprograms’ resource availability risk (see Table 7 in the previous section).
Program/
Subprogram
Available Resources for
Projects/Programs
($Million)*
Risk
LikelihoodRisk Severity Risk Score
CTF ($39.70) Very Unlikely Minimal Low
FIP ($60.60) Possible Moderate Medium
PPCR ($4.30) Very Unlikely Minimal Low
SREP ($140.30) Likely Moderate High
Available Resources as of March 31, 2017
*Available Resources for Projects/Programs represesent Unrestricted Fund Balance for
Project/Program Commitments less Total Anticipated Commitments, as reflected in Annex A.
15
CTF
For the CTF, the TFC agreed to accept this risk and permit the CTF to over-program by 30% of pledged resources. The risk tolerance for the CTF is therefore high.
To mitigate this risk, the TFC, MDBs, and CIF AU have all consistently conveyed the message that resource allocations in CTF are not guaranteed. Additionally, the CTF has now adopted a sealed pipeline approach where only projects which are to be submitted to the TFC by June 30, 2017 will be considered for approval, and this has reduced the size of the pipeline substantially. It is also unlikely that all remaining projects in this pipeline will be submitted for TFC approval by this deadline. For these reasons it is increasingly likely that the CTF will have sufficient resources for the Trustee to commit to fund all projects in the sealed pipeline.
FIP
The TFC did not agree to permit the FIP to over-program so the risk tolerance for the FIP is therefore low. As of March 31, 2017 USD 54 million of the current USD 61 million of the shortfall in available resources can be attributed to unrealized declines in the value of the FIP’s GBP-denominated promissory notes. The shortfall could potentially affect the new pilot countries which were recently approved but which have not yet submitted investment proposals.
PPCR
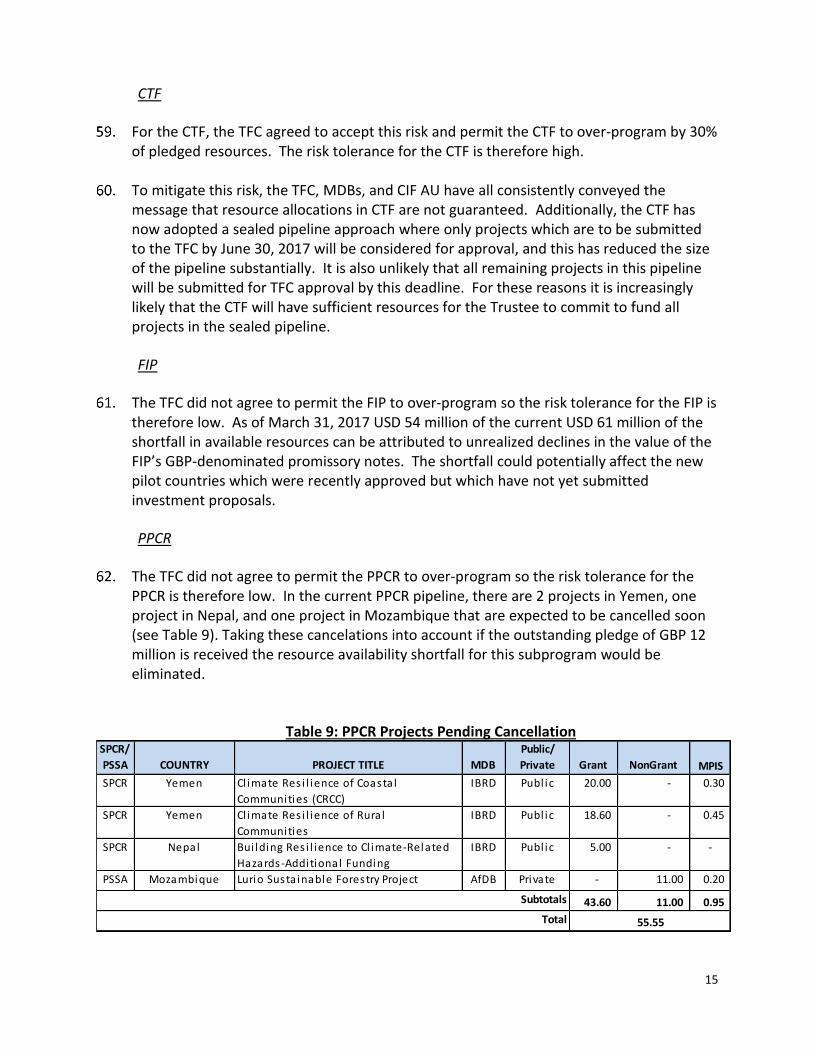
The TFC did not agree to permit the PPCR to over-program so the risk tolerance for the PPCR is therefore low. In the current PPCR pipeline, there are 2 projects in Yemen, one project in Nepal, and one project in Mozambique that are expected to be cancelled soon (see Table 9). Taking these cancelations into account if the outstanding pledge of GBP 12 million is received the resource availability shortfall for this subprogram would be eliminated.
Table 9: PPCR Projects Pending Cancellation
SPCR/
PSSA COUNTRY PROJECT TITLE MDB
Public/
Private Grant NonGrant MPIS
SPCR Yemen Cl imate Res i l ience of Coasta l
Communities (CRCC)
IBRD Publ ic 20.00 - 0.30
SPCR Yemen Cl imate Res i l ience of Rural
Communities
IBRD Publ ic 18.60 - 0.45
SPCR Nepal Bui lding Res i l ience to Cl imate-Related
Hazards-Additional Funding
IBRD Publ ic 5.00 - -
PSSA Mozambique Lurio Susta inable Forestry Project AfDB Private - 11.00 0.20
43.60 11.00 0.95 Subtotals
55.55Total
16
SREP
The TFC agreed to accept this risk for the SREP, and permit the SREP to over-program by 30% of pledged resources. The risk tolerance for the SREP is therefore high.
To mitigate this risk, the TFC, MDBs, and CIF AU have all consistently conveyed the message that resource allocations in SREP are not guaranteed. Additionally, the SREP has now adopted a sealed pipeline approach and this has reduced the size of the pipeline. As of March 31, 2017 USD 77 million of the current USD 140 million shortfall unavailable resources (USD 112 million grant and USD 28 million non-grant) can be attributed to unrealized declines in the value of the SREP’s GBP-denominated promissory notes.
iv. Credit Risk (CTF) – the risk that a CTF financing recipient will become unwilling or unable to satisfy the terms of an obligation to an MDB in its capacity as an originator and servicer of the CTF’s outgoing financing.
Exposure to this risk could lead to insufficient available resources in the CTF for the Trustee to repay loan contributors. Additionally the viability and success of a project can be affected by a recipient’s financial solvency.
The primary source of credit risk exposure for the CTF is incurred through the funds it commits for public sector (75% of the portfolio) and private sector (25% of the portfolio) loans. Credit risk exposure incurred through other instruments (e.g. guarantees) is minimal.
Over the past year, the level of detail of the assessments of the CTF’s credit risk exposures which the CIF AU reports on the CTF Risk Dashboard has increased substantially, particularly for the public sector.
Public Sector Exposure
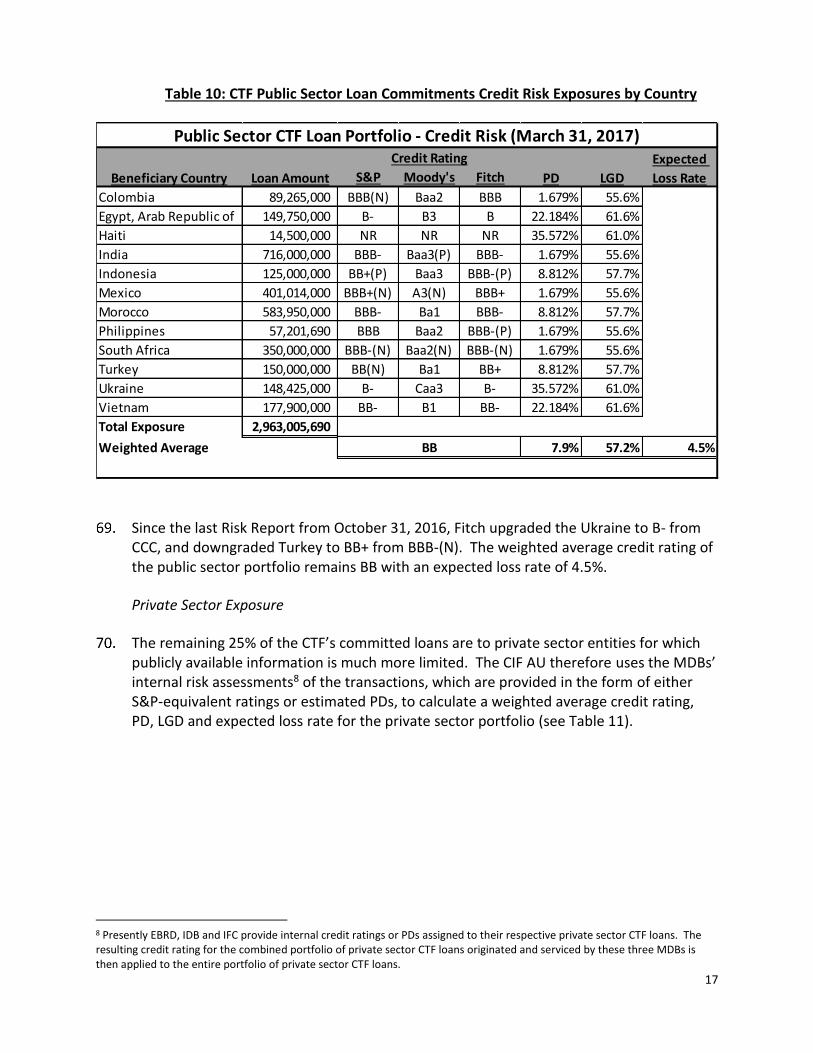
All CTF public sector loans are extended directly to externally rated sovereigns (with the exception of Haiti5 which is unrated), or to entities guaranteed by externally rated sovereigns. Presently The CTF is exposed to 12 sovereigns with ratings ranging from triple-C (Ukraine) to Single-A (Mexico). The CIF AU uses the five-year probability of default (PD)6 and loss given default (LGD) associated with each rating category to estimate the expected loss rate7 associated with the public sector loan portfolio (see Table 10).
5 In the absence of an external rating, we assume that the probability of default associated with Haiti corresponds with that associated with a triple-C rating. 6 As published in Moody's Annual Default Study: Corporate Default and Recovery Rates, 1920-2015. 7 Expected Loss Rate = PD x LGD.
17
Table 10: CTF Public Sector Loan Commitments Credit Risk Exposures by Country
Since the last Risk Report from October 31, 2016, Fitch upgraded the Ukraine to B- from CCC, and downgraded Turkey to BB+ from BBB-(N). The weighted average credit rating of the public sector portfolio remains BB with an expected loss rate of 4.5%.
Private Sector Exposure
The remaining 25% of the CTF’s committed loans are to private sector entities for which publicly available information is much more limited. The CIF AU therefore uses the MDBs’ internal risk assessments8 of the transactions, which are provided in the form of either S&P-equivalent ratings or estimated PDs, to calculate a weighted average credit rating, PD, LGD and expected loss rate for the private sector portfolio (see Table 11).
8 Presently EBRD, IDB and IFC provide internal credit ratings or PDs assigned to their respective private sector CTF loans. The resulting credit rating for the combined portfolio of private sector CTF loans originated and serviced by these three MDBs is then applied to the entire portfolio of private sector CTF loans.
S&P Moody's Fitch
Colombia 89,265,000 BBB(N) Baa2 BBB 1.679% 55.6%
Egypt, Arab Republic of 149,750,000 B- B3 B 22.184% 61.6%
Haiti 14,500,000 NR NR NR 35.572% 61.0%
India 716,000,000 BBB- Baa3(P) BBB- 1.679% 55.6%
Indonesia 125,000,000 BB+(P) Baa3 BBB-(P) 8.812% 57.7%
Mexico 401,014,000 BBB+(N) A3(N) BBB+ 1.679% 55.6%
Morocco 583,950,000 BBB- Ba1 BBB- 8.812% 57.7%
Philippines 57,201,690 BBB Baa2 BBB-(P) 1.679% 55.6%
South Africa 350,000,000 BBB-(N) Baa2(N) BBB-(N) 1.679% 55.6%
Turkey 150,000,000 BB(N) Ba1 BB+ 8.812% 57.7%
Ukraine 148,425,000 B- Caa3 B- 35.572% 61.0%
Vietnam 177,900,000 BB- B1 BB- 22.184% 61.6%
Total Exposure 2,963,005,690
Weighted Average 7.9% 57.2% 4.5%
LGD
Expected
Loss Rate
Public Sector CTF Loan Portfolio - Credit Risk (March 31, 2017)
BB
Credit Rating
Beneficiary Country Loan Amount PD
18
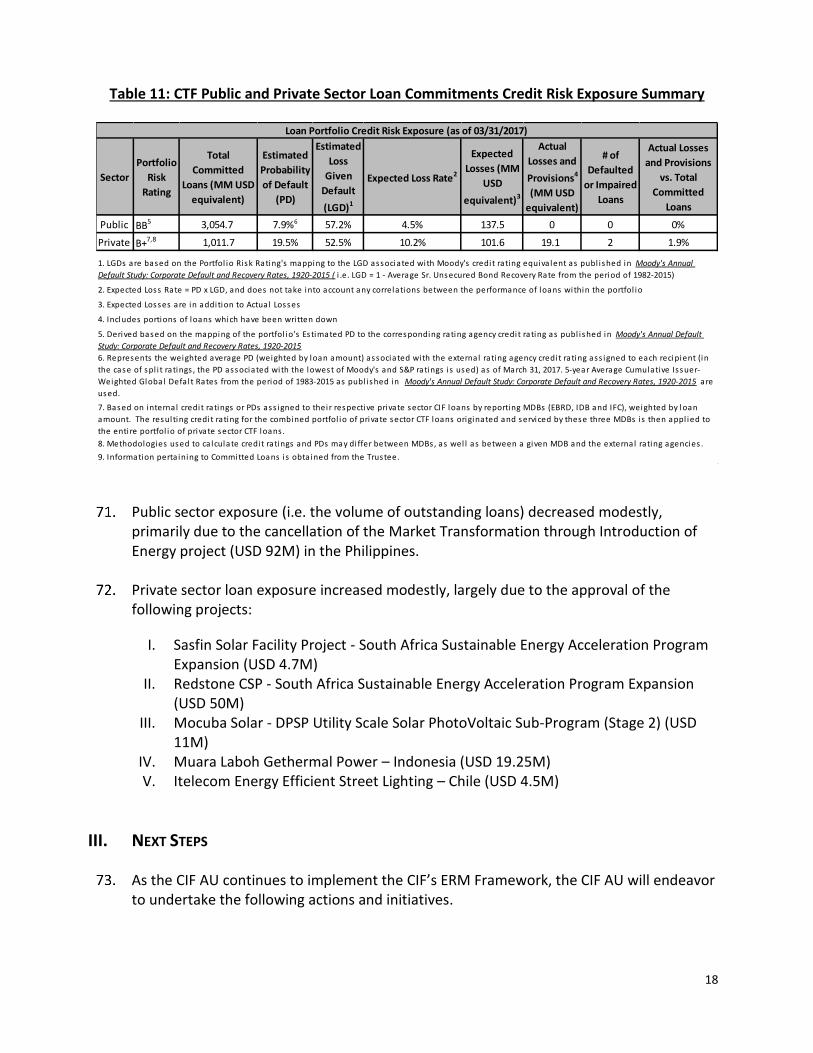
Table 11: CTF Public and Private Sector Loan Commitments Credit Risk Exposure Summary
Public sector exposure (i.e. the volume of outstanding loans) decreased modestly, primarily due to the cancellation of the Market Transformation through Introduction of Energy project (USD 92M) in the Philippines.
Private sector loan exposure increased modestly, largely due to the approval of the following projects:
I. Sasfin Solar Facility Project - South Africa Sustainable Energy Acceleration Program Expansion (USD 4.7M)
II. Redstone CSP - South Africa Sustainable Energy Acceleration Program Expansion (USD 50M)
III. Mocuba Solar - DPSP Utility Scale Solar PhotoVoltaic Sub-Program (Stage 2) (USD 11M)
IV. Muara Laboh Gethermal Power – Indonesia (USD 19.25M) V. Itelecom Energy Efficient Street Lighting – Chile (USD 4.5M)
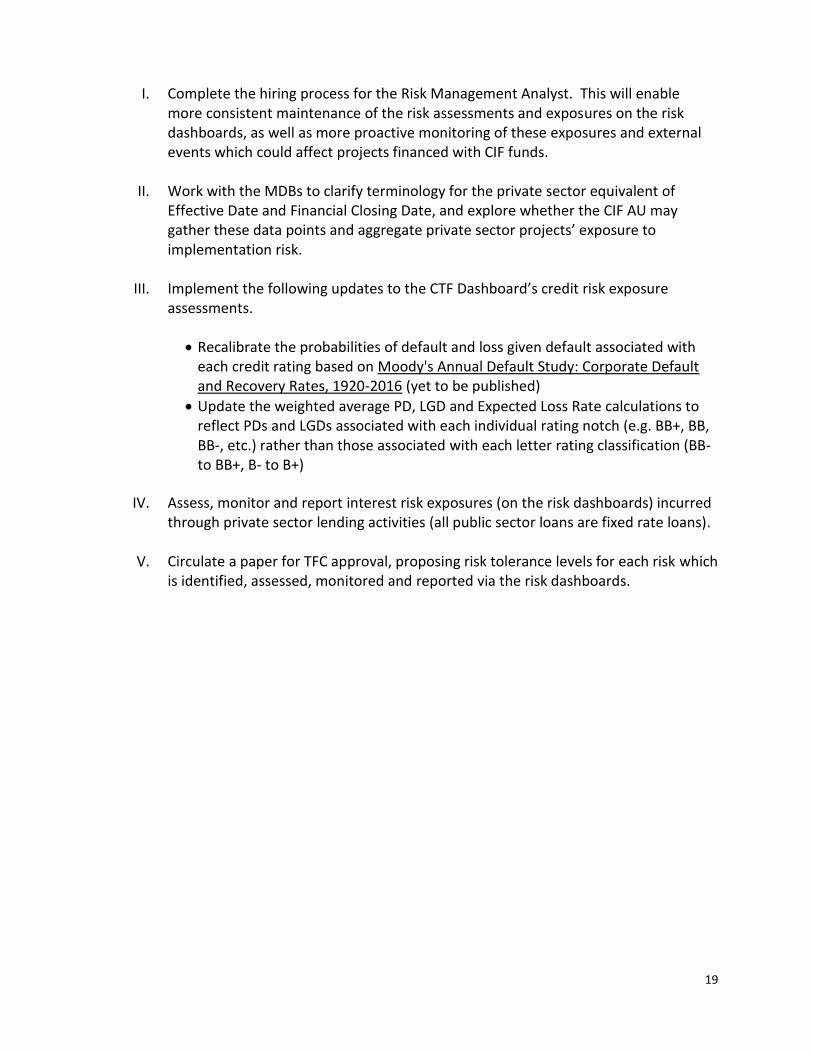
III. NEXT STEPS
As the CIF AU continues to implement the CIF’s ERM Framework, the CIF AU will endeavor to undertake the following actions and initiatives.
Sector
Portfolio
Risk
Rating
Total
Committed
Loans (MM USD
equivalent)
Estimated
Probability
of Default
(PD)
Estimated
Loss
Given
Default
(LGD)1
Expected Loss Rate2
Expected
Losses (MM
USD
equivalent)3
Actual
Losses and
Provisions4
(MM USD
equivalent)
# of
Defaulted
or Impaired
Loans
Actual Losses
and Provisions
vs. Total
Committed
Loans
Public BB5 3,054.7 7.9%6 57.2% 4.5% 137.5 0 0 0%
Private B+7,8 1,011.7 19.5% 52.5% 10.2% 101.6 19.1 2 1.9%
Loan Portfolio Credit Risk Exposure (as of 03/31/2017)
9. Information perta ining to Committed Loans is obtained from the Trustee.
1. LGDs are based on the Portfol io Risk Rating's mapping to the LGD associated with Moody's credit rating equiva lent as publ ished in Moody's Annual
Default Study: Corporate Default and Recovery Rates, 1920-2015 ( i .e. LGD = 1 - Average Sr. Unsecured Bond Recovery Rate from the period of 1982-2015)
2. Expected Loss Rate = PD x LGD, and does not take into account any correlations between the performance of loans within the portfol io
3. Expected Losses are in addition to Actual Losses
4. Includes portions of loans which have been wri tten down
5. Derived based on the mapping of the portfol io's Estimated PD to the corresponding rating agency credit rating as publ ished in Moody's Annual Default
Study: Corporate Default and Recovery Rates, 1920-2015
6. Represents the weighted average PD (weighted by loan amount) associated with the external rating agency credit rating ass igned to each recipient (in
the case of spl i t ratings , the PD associated with the lowest of Moody's and S&P ratings i s used) as of March 31, 2017. 5-year Average Cumulative Issuer-
Weighted Global Defa l t Rates from the period of 1983-2015 as publ ished in Moody's Annual Default Study: Corporate Default and Recovery Rates, 1920-2015 are
used.
7. Based on internal credit ratings or PDs ass igned to their respective private sector CIF loans by reporting MDBs (EBRD, IDB and IFC), weighted by loan
amount. The resulting credit rating for the combined portfol io of private sector CTF loans originated and serviced by these three MDBs is then appl ied to
the entire portfol io of private sector CTF loans .
8. Methodologies used to ca lculate credit ratings and PDs may di ffer between MDBs, as wel l as between a given MDB and the external rating agencies .
19
I. Complete the hiring process for the Risk Management Analyst. This will enable more consistent maintenance of the risk assessments and exposures on the risk dashboards, as well as more proactive monitoring of these exposures and external events which could affect projects financed with CIF funds.
II. Work with the MDBs to clarify terminology for the private sector equivalent of Effective Date and Financial Closing Date, and explore whether the CIF AU may gather these data points and aggregate private sector projects’ exposure to implementation risk.
III. Implement the following updates to the CTF Dashboard’s credit risk exposure assessments.
Recalibrate the probabilities of default and loss given default associated with each credit rating based on Moody's Annual Default Study: Corporate Default and Recovery Rates, 1920-2016 (yet to be published)
Update the weighted average PD, LGD and Expected Loss Rate calculations to reflect PDs and LGDs associated with each individual rating notch (e.g. BB+, BB, BB-, etc.) rather than those associated with each letter rating classification (BB- to BB+, B- to B+)
IV. Assess, monitor and report interest risk exposures (on the risk dashboards) incurred through private sector lending activities (all public sector loans are fixed rate loans).
V. Circulate a paper for TFC approval, proposing risk tolerance levels for each risk which is identified, assessed, monitored and reported via the risk dashboards.
20
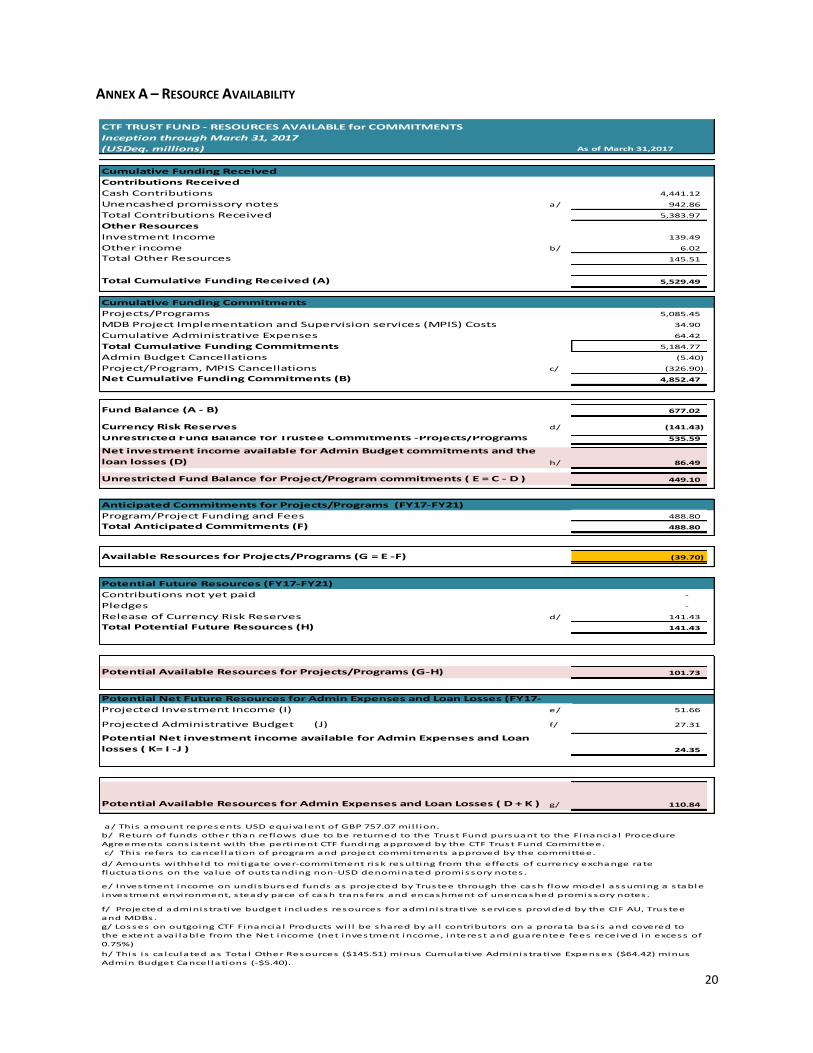
ANNEX A – RESOURCE AVAILABILITY
CTF TRUST FUND - RESOURCES AVAILABLE for COMMITMENTS
Inception through March 31, 2017
(USDeq. millions) As of March 31,2017
Cumulative Funding Received
Contributions Received
Cash Contributions 4,441.12
Unencashed promissory notes a/ 942.86
Total Contributions Received 5,383.97
Other Resources
Investment Income 139.49
Other income b/ 6.02
Total Other Resources 145.51
Total Cumulative Funding Received (A) 5,529.49
Cumulative Funding Commitments
Projects/Programs 5,085.45
MDB Project Implementation and Supervision services (MPIS) Costs 34.90
Cumulative Administrative Expenses 64.42
Total Cumulative Funding Commitments 5,184.77
Admin Budget Cancellations (5.40)
Project/Program, MPIS Cancellations c/ (326.90)
Net Cumulative Funding Commitments (B) 4,852.47
Fund Balance (A - B) 677.02
Currency Risk Reserves d/ (141.43)
Unrestricted Fund Balance for Trustee Commitments -Projects/Programs 535.59
Net investment income available for Admin Budget commitments and the
loan losses (D) h/ 86.49
Unrestricted Fund Balance for Project/Program commitments ( E = C - D ) 449.10
Anticipated Commitments for Projects/Programs (FY17-FY21)
Program/Project Funding and Fees 488.80
Total Anticipated Commitments (F) 488.80
Available Resources for Projects/Programs (G = E -F) (39.70)
Potential Future Resources (FY17-FY21)
Contributions not yet paid -
Pledges -
Release of Currency Risk Reserves d/ 141.43
Total Potential Future Resources (H) 141.43
Potential Available Resources for Projects/Programs (G-H) 101.73
Potential Net Future Resources for Admin Expenses and Loan Losses (FY17-
Projected Investment Income (I) e/ 51.66
Projected Administrative Budget (J) f/ 27.31
Potential Net investment income available for Admin Expenses and Loan
losses ( K= I -J ) 24.35
Potential Available Resources for Admin Expenses and Loan Losses ( D + K ) g/ 110.84
a/ This amount represents USD equiva lent of GBP 757.07 mi l l ion.
b/ Return of funds other than reflows due to be returned to the Trust Fund pursuant to the Financia l Procedure
Agreements cons is tent with the pertinent CTF funding approved by the CTF Trust Fund Committee.
c/ This refers to cancel lation of program and project commitments approved by the committee.
d/ Amounts withheld to mitigate over-commitment ri sk resulting from the effects of currency exchange rate
fluctuations on the va lue of outstanding non-USD denominated promissory notes .
e/ Investment income on undisbursed funds as projected by Trustee through the cash flow model assuming a s table
investment environment, s teady pace of cash transfers and encashment of unencashed promissory notes .
f/ Projected adminis trative budget includes resources for adminis trative services provided by the CIF AU, Trustee
and MDBs.
g/ Losses on outgoing CTF Financia l Products wi l l be shared by a l l contributors on a prorata bas is and covered to
the extent ava i lable from the Net income (net investment income, interest and guarentee fees received in excess of
0.75%)
h/ This i s ca lculated as Tota l Other Resources ($145.51) minus Cumulative Adminis trative Expenses ($64.42) minus
Admin Budget Cancel lations (-$5.40).
21
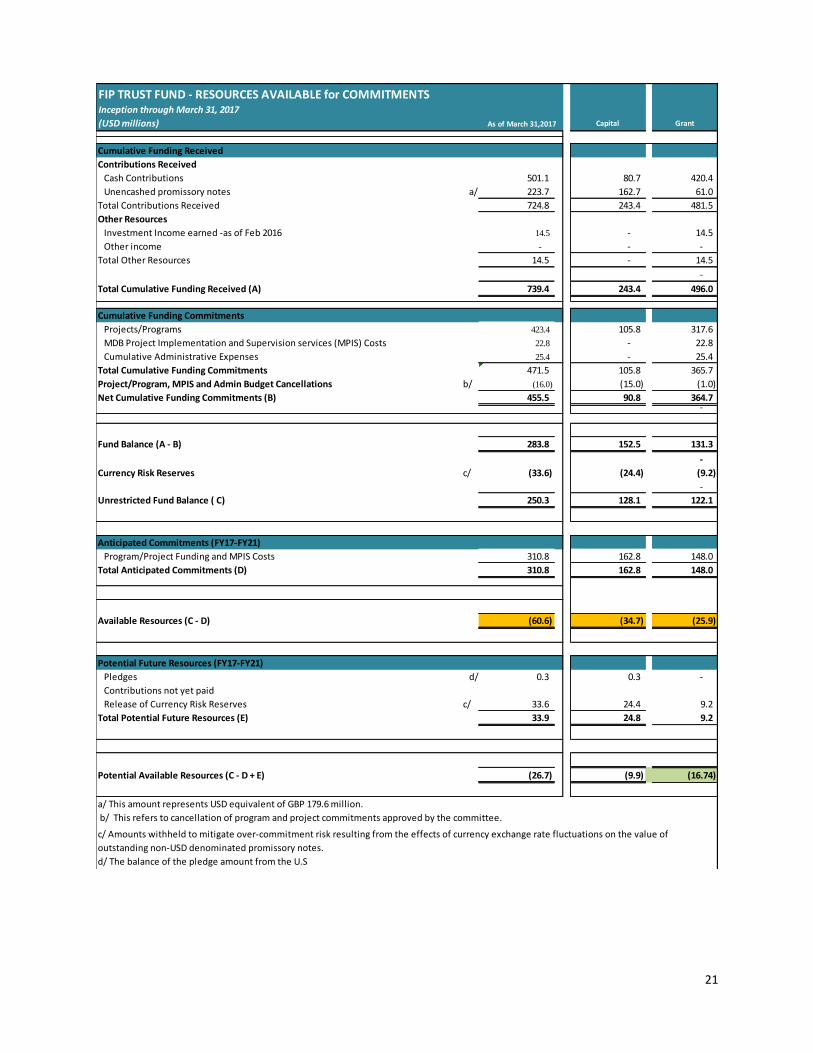
FIP TRUST FUND - RESOURCES AVAILABLE for COMMITMENTSInception through March 31, 2017
(USD millions) Capital Grant
Cumulative Funding Received
Contributions Received
Cash Contributions 501.1 80.7 420.4
Unencashed promissory notes a/ 223.7 162.7 61.0
Total Contributions Received 724.8 243.4 481.5
Other Resources
Investment Income earned -as of Feb 2016 14.5 - 14.5
Other income - - -
Total Other Resources 14.5 - 14.5
-
Total Cumulative Funding Received (A) 739.4 243.4 496.0 -
Cumulative Funding Commitments
Projects/Programs 423.4 105.8 317.6
MDB Project Implementation and Supervision services (MPIS) Costs 22.8 - 22.8
Cumulative Administrative Expenses 25.4 - 25.4
Total Cumulative Funding Commitments 471.5 105.8 365.7
Project/Program, MPIS and Admin Budget Cancellations b/ (16.0) (15.0) (1.0)
Net Cumulative Funding Commitments (B) 455.5 90.8 364.7 -
Fund Balance (A - B) 283.8 152.5 131.3
-
Currency Risk Reserves c/ (33.6) (24.4) (9.2)
-
Unrestricted Fund Balance ( C) 250.3 128.1 122.1
Anticipated Commitments (FY17-FY21)
Program/Project Funding and MPIS Costs 310.8 162.8 148.0
Total Anticipated Commitments (D) 310.8 162.8 148.0
Available Resources (C - D) (60.6) (34.7) (25.9)
Potential Future Resources (FY17-FY21)
Pledges d/ 0.3 0.3 -
Contributions not yet paid
Release of Currency Risk Reserves c/ 33.6 24.4 9.2
Total Potential Future Resources (E) 33.9 24.8 9.2
Potential Available Resources (C - D + E) (26.7) (9.9) (16.74)
a/ This amount represents USD equivalent of GBP 179.6 million.
d/ The balance of the pledge amount from the U.S
b/ This refers to cancellation of program and project commitments approved by the committee.
As of March 31,2017
c/ Amounts withheld to mitigate over-commitment risk resulting from the effects of currency exchange rate fluctuations on the value of
outstanding non-USD denominated promissory notes.
22
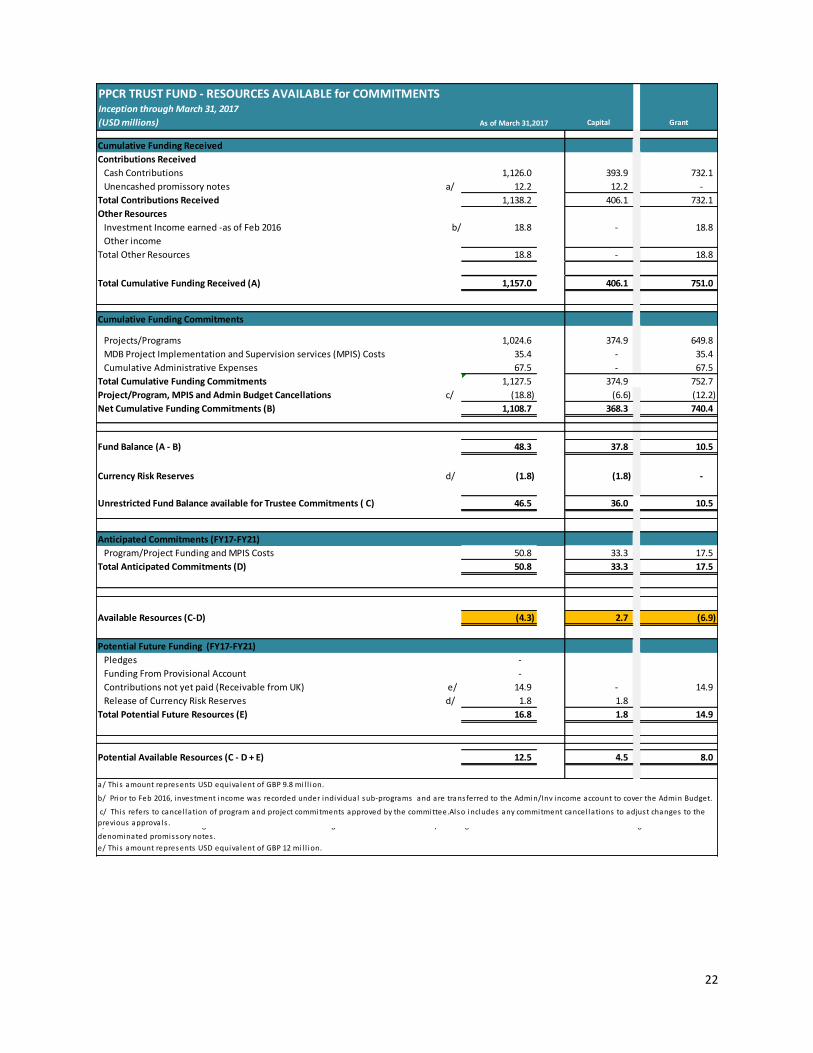
PPCR TRUST FUND - RESOURCES AVAILABLE for COMMITMENTSInception through March 31, 2017
(USD millions) Capital Grant
Cumulative Funding Received
Contributions Received
Cash Contributions 1,126.0 393.9 732.1
Unencashed promissory notes a/ 12.2 12.2 -
Total Contributions Received 1,138.2 406.1 732.1
Other Resources
Investment Income earned -as of Feb 2016 b/ 18.8 - 18.8
Other income
Total Other Resources 18.8 - 18.8
Total Cumulative Funding Received (A) 1,157.0 406.1 751.0
Cumulative Funding Commitments
Projects/Programs 1,024.6 374.9 649.8
MDB Project Implementation and Supervision services (MPIS) Costs 35.4 - 35.4
Cumulative Administrative Expenses 67.5 - 67.5
Total Cumulative Funding Commitments 1,127.5 374.9 752.7
Project/Program, MPIS and Admin Budget Cancellations c/ (18.8) (6.6) (12.2)
Net Cumulative Funding Commitments (B) 1,108.7 368.3 740.4
Fund Balance (A - B) 48.3 37.8 10.5
Currency Risk Reserves d/ (1.8) (1.8) -
Unrestricted Fund Balance available for Trustee Commitments ( C) 46.5 36.0 10.5
Anticipated Commitments (FY17-FY21)
Program/Project Funding and MPIS Costs 50.8 33.3 17.5
Total Anticipated Commitments (D) 50.8 33.3 17.5
Available Resources (C-D) (4.3) 2.7 (6.9)
Potential Future Funding (FY17-FY21)
Pledges -
Funding From Provisional Account -
Contributions not yet paid (Receivable from UK) e/ 14.9 - 14.9
Release of Currency Risk Reserves d/ 1.8 1.8
Total Potential Future Resources (E) 16.8 1.8 14.9
Potential Available Resources (C - D + E) 12.5 4.5 8.0
a/ This amount represents USD equiva lent of GBP 9.8 mi l l ion.
e/ This amount represents USD equiva lent of GBP 12 mi l l ion.
As of March 31,2017
b/ Prior to Feb 2016, investment income was recorded under individual sub-programs and are transferred to the Admin/Inv income account to cover the Admin Budget.
After Feb 2016, the investment income is recorded for a l l SCF programs under a separate Admin/Inv Income account. c/ This refers to cancel lation of program and project commitments approved by the committee.Also includes any commitment cancel lations to adjust changes to the
previous approvals . d/ Amounts withheld to mitigate over-commitment ri sk resulting from the effects of currency exchange rate fluctuations on the va lue of outstanding non-USD
denominated promissory notes .
23
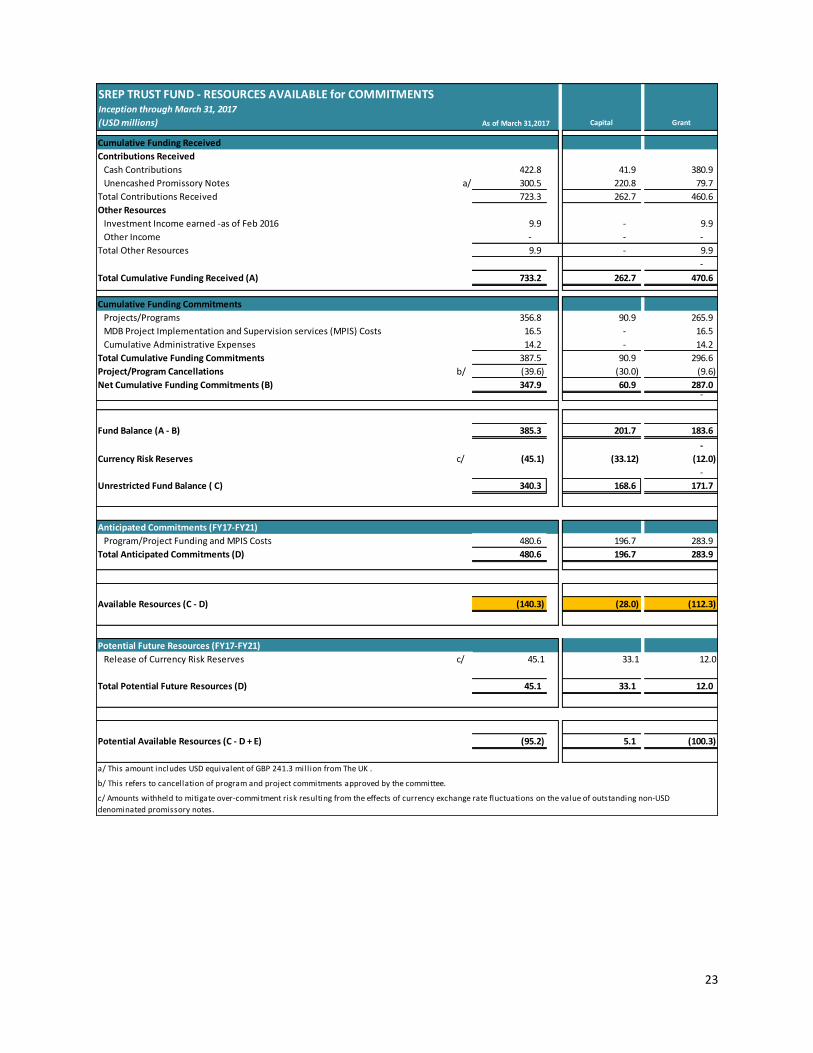
SREP TRUST FUND - RESOURCES AVAILABLE for COMMITMENTSInception through March 31, 2017
(USD millions) Capital Grant
Cumulative Funding Received
Contributions Received
Cash Contributions 422.8 41.9 380.9
Unencashed Promissory Notes a/ 300.5 220.8 79.7
Total Contributions Received 723.3 262.7 460.6
Other Resources
Investment Income earned -as of Feb 2016 9.9 - 9.9
Other Income - - -
Total Other Resources 9.9 - 9.9
-
Total Cumulative Funding Received (A) 733.2 262.7 470.6 -
Cumulative Funding Commitments
Projects/Programs 356.8 90.9 265.9
MDB Project Implementation and Supervision services (MPIS) Costs 16.5 - 16.5
Cumulative Administrative Expenses 14.2 - 14.2
Total Cumulative Funding Commitments 387.5 90.9 296.6
Project/Program Cancellations b/ (39.6) (30.0) (9.6)
Net Cumulative Funding Commitments (B) 347.9 60.9 287.0 -
Fund Balance (A - B) 385.3 201.7 183.6
-
Currency Risk Reserves c/ (45.1) (33.12) (12.0)
-
Unrestricted Fund Balance ( C) 340.3 168.6 171.7
Anticipated Commitments (FY17-FY21)
Program/Project Funding and MPIS Costs 480.6 196.7 283.9
Total Anticipated Commitments (D) 480.6 196.7 283.9
Available Resources (C - D) (140.3) (28.0) (112.3)
Potential Future Resources (FY17-FY21)
Release of Currency Risk Reserves c/ 45.1 33.1 12.0
Total Potential Future Resources (D) 45.1 33.1 12.0
Potential Available Resources (C - D + E) (95.2) 5.1 (100.3)
b/ This refers to cancellation of program and project commitments approved by the committee.
As of March 31,2017
a/ This amount includes USD equivalent of GBP 241.3 mill ion from The UK .
c/ Amounts withheld to mitigate over-commitment risk resulting from the effects of currency exchange rate fluctuations on the value of outstanding non-USD
denominated promissory notes.