Embed Size (px)
Citation preview
SAGE-Hindawi Access to ResearchInternational Journal of Alzheimer’s DiseaseVolume 2011, Article ID 546871, 11 pagesdoi:10.4061/2011/546871
Research Article
Joint Assessment of Structural, Perfusion, and Diffusion MRI inAlzheimer’s Disease and Frontotemporal Dementia
Yu Zhang,1, 2 Norbert Schuff,1, 2 Christopher Ching,1, 2 Duygu Tosun,1, 2 Wang Zhan,1, 2
Marzieh Nezamzadeh,1, 2 Howard J. Rosen,3 Joel H. Kramer,3 Maria Luisa Gorno-Tempini,3
Bruce L. Miller,3 and Michael W. Weiner1, 2, 3
1 Center for Imaging of Neurodegenerative Diseases, Department of Veterans Affairs San Francisco VA, Medical Center,4150, Clement Street, San Francisco, CA 94121, USA
2 Department of Radiology, University of California, San Francisco, CA 94143, USA3 Department of Neurology, University of California, San Francisco, CA 94143, USA
Correspondence should be addressed to Yu Zhang, [email protected]
Received 29 November 2010; Accepted 26 April 2011
Academic Editor: Katsuya Urakami
Copyright © 2011 Yu Zhang et al. This is an open access article distributed under the Creative Commons Attribution License,which permits unrestricted use, distribution, and reproduction in any medium, provided the original work is properly cited.
Most MRI studies of Alzheimer’s disease (AD) and frontotemporal dementia (FTD) have assessed structural, perfusion anddiffusion abnormalities separately while ignoring the relationships across imaging modalities. This paper aimed to assess braingray (GM) and white matter (WM) abnormalities jointly to elucidate differences in abnormal MRI patterns between the diseases.Twenty AD, 20 FTD patients, and 21 healthy control subjects were imaged using a 4 Tesla MRI. GM loss and GM hypoperfusionwere measured using high-resolution T1 and arterial spin labeling MRI (ASL-MRI). WM degradation was measured with diffusiontensor imaging (DTI). Using a new analytical approach, the study found greater WM degenerations in FTD than AD at mildabnormality levels. Furthermore, the GM loss and WM degeneration exceeded the reduced perfusion in FTD whereas, in AD,structural and functional damages were similar. Joint assessments of multimodal MRI have potential value to provide new imagingmarkers for improved differential diagnoses between FTD and AD.
1. Introduction
Alzheimer’s disease (AD) and frontotemporal dementia(FTD) are two of the most common and devastating dis-orders that result in dementia in the elderly population.Although the definitive diagnosis of each type of dementiais not possible until autopsy, biomarkers based on magneticresonance imaging (MRI), providing measurements of brainvolume, perfusion, and white matter integrity, have beenpromising for improved diagnosis and prediction of demen-tia progression [1]. In AD, which is a progressive dementingdisorder associated with cognitive impairments beginningwith episodic memory deficits, MRI measurements of brainvolume have shown characteristic gray matter (GM) loss pri-marily in medial temporal lobe regions [2, 3] whereas func-tional studies using arterial spin labeling MRI or PET/SPECTimaging have shown prominent changes primarily in theparietal lobe (including the posterior cingulate gyrus and lat-
eral temporoparietal areas) [4–7], though regions of struc-tural, and functional alterations can overlap. Furthermore,diffusion tensor imaging (DTI), a unique method to assessthe integrity of white matter microstructure, have revealedwhite matter (WM) alterations in AD, involving the parietal,temporal, and frontal brain regions [8–13]. In FTD, which isassociated with impairments of social behaviors, personality,and executive functions, MRI has shown characteristic pat-terns of structural GM loss [14, 15] and GM dysfunction[16–20] primarily in frontal and anterior temporal lobes.WM volume loss [21, 22] and WM degradation in FTD[23–25] have also been reported in the frontal and temporalregions.
Using biomarkers of neurocognitive measurements todifferentiate between AD and FTD are often difficult becauseof overlapping symptoms. Several studies using imagingmarkers compared differences in abnormal brain patternsbetween AD and FTD directly. Structural MRI showed that
2 International Journal of Alzheimer’s Disease
AD was associated with greater GM loss than FTD in pos-terior brain regions [26, 27] whereas FTD was associatedwith more severe GM loss than was AD in frontal brainregions [26, 28–30]. Similarly, functional imaging such asPET/SPECT and perfusion MRI showed that AD was associ-ated with greater reduced cerebral blood flow or metabolismthan FTD in parietal and occipital brain regions [16, 28,30–32]; whereas FTD was associated with greater frontaldysfunction than AD [16, 30, 32]. In addition to differencesin GM, we have previously reported differences in WM be-tween AD and FTD [25]. Specifically, measurements offractional anisotropy (FA)—a summary measure of DTIindexing WM integrity—indicated greater WM degradation(FA reduction) of frontal brain regions in FTD comparedto AD. Furthermore, no brain region in AD was shown tohave more WM degradation when compared to FTD. Takentogether, these findings suggest that AD and FTD are eachassociated with disease-specific regional patterns of GM andWM alterations. Recent multimodality strategies [33, 34]of combined radiological markers such as analyzing brainvolume and perfusion or WM changes together have shownsuperior power than that using conventional single modalitydomain (e.g., brain volume measurement alone) in diagnosisof AD. However, to our knowledge, rarely did MRI studiesevaluate GM and WM differences between AD and FTDjointly.
In this study we present a new approach to comparestructural, perfusion, and diffusion alterations between ADand FTD using T1-weighted high-resolution structural MRI,arterial spin-labeled perfusion MRI (ASL-MRI), and DTI.The objective was to determine if a joint evaluation ofmultimodal MRI could provide a biomarker for a differentialdiagnosis between AD and FTD.
2. Subjects and Methods
2.1. Subjects. Twenty AD patients (mean age and standarddeviation: 63.1±6.9 yrs) with a Mini-Mental State Examina-tion (MMSE) [35] score of on average 21.9± 5.6, 20 patientswith FTD (age: 60.7 ± 9.9 yrs; MMSE: 23.1 ± 5.6) and 21cognitively normal (CN) subjects (age: 61.9± 9.6 yrs; MMSE:29.6 ± 0.5) were included in this cross-sectional MRI study.A summary of the subject demographics and relevant clinicalinformation are listed in Table 1. The patients with FTD andAD were recruited from the Memory and Aging Center ofthe University of California, San Francisco. All patients werediagnosed based on information obtained from an extensiveclinical history and physical examination. The MR imageswere used to rule out other major neuropathologies such astumors, strokes, or inflammation but not to diagnose de-mentia. The subjects were included in the study if theywere between 30–80 years old and without history of braintrauma, brain tumor, stroke, epilepsy, alcoholism, psychi-atric illness, or other systemic diseases that affect brainfunction. FTD was diagnosed according to the consensuscriteria established by Neary et al. [36]. All FTD patientswere diagnosed with the frontal variant subtype, two ofwhich had combined motor neuron-related symptoms. ADpatients were diagnosed according to the criteria of the
National Institute of Neurological and Communicative Dis-orders and Stroke-Alzheimer’s Disease and Related DisordersAssociation (NINCDS/ADRDA) [37]. All subjects receiveda standard battery of neuropsychological tests includingassessment of global cognitive impairment using MMSE andglobal functional impairment using the Clinical DementiaRating (CDR) scale [38]. Fifty-seven out of all 61subjects hadblood drawn for APOE genotyping. Reliable informationabout the age of onset of symptoms was available from 12 outof 20 AD patients and from all 20 FTD patients. Because it isnot unusual for subjects in this age group to have WM signalhyperintensities (WMSH) on MRI, subjects with WMSHwere included. An experienced radiologist reviewed all MRIdata, and the scores of WMSH were used as covariates inthe analysis. The severity of WMSH was classified as mild(deep white matter lesions ≤3 mm, and periventricular hy-perintensities <5 mm thickness), moderate (deep whitematter lesions between 4–10 mm, or periventricular hyperin-tensities between 6–10 mm thickness), or severe (deep whitematter lesions >10 mm, or periventricular hyperintensities>10 mm thickness), according to the Scheltens’ rating scale[39]. All subjects or their legal guardians gave written in-formed consent before participating in the study, which wasapproved by the Committees of Human Research at theUniversity of California and the VA Medical Center at SanFrancisco.
2.2. Data Acquisition. All scans were preformed on a 4Tesla (Bruker/Siemens) MRI system with a single housingbirdcage transmit and 8-channel receive coil. T1-weightedimages were obtained using a 3D volumetric magnetizationprepared rapid gradient echo (MPRAGE) sequence with TR/TE/TI = 2300/3/950 ms, 7-degree flip angle, 1.0 × 1.0× 1.0 mm3 resolution, 157 continuous sagittal slices. Inaddition, FLAIR (fluid attenuated inversion recovery) imageswith timing TR/TE/TI = 5000/355/1900 ms were acquired tofacilitate the evaluation of WMSH. Perfusion images wereacquired using a continuous arterial spin labeling (cASL)sequence [40] with a single-shot echo-planar imaging (EPI)part to map the perfusion signal. cASL-MRI was performedwith TR/TE = 5200/9 ms with 2-second long labeling pulsesand a one-second postlabeling delay. Sixteen slices with 5 mmslice thickness and 1.2 mm interslice gap, 3.75 × 3.75 mm2
in-plane resolution were acquired. DTI was acquired basedon a dual spin-echo EPI sequence supplemented with two-fold parallel imaging acceleration (GRAPPA) [41] to reducesusceptibility distortions. Other imaging parameters wereTR/TE = 6000/77 ms, field of view 256 × 224 cm, 128 ×112 matrix size, yielding 2 × 2 mm2 in-plane resolution, 40slices each 3 mm thick. One reference image (b = 0) andsix diffusion-weighted images (b = 800 s/mm2, along 6noncollinear directions) were acquired.
2.3. Data Analyses. The assessment of brain volume changeswere performed using SPM8 software (http://www.fil.ion.ucl.ac.uk/spm/software/spm8/) based on an “optimized”VBM procedure described by Ashburner and Friston [42].The procedure included several steps. (1) Tissue segmen-tation: An expectation maximization segmentation (EMS)
International Journal of Alzheimer’s Disease 3
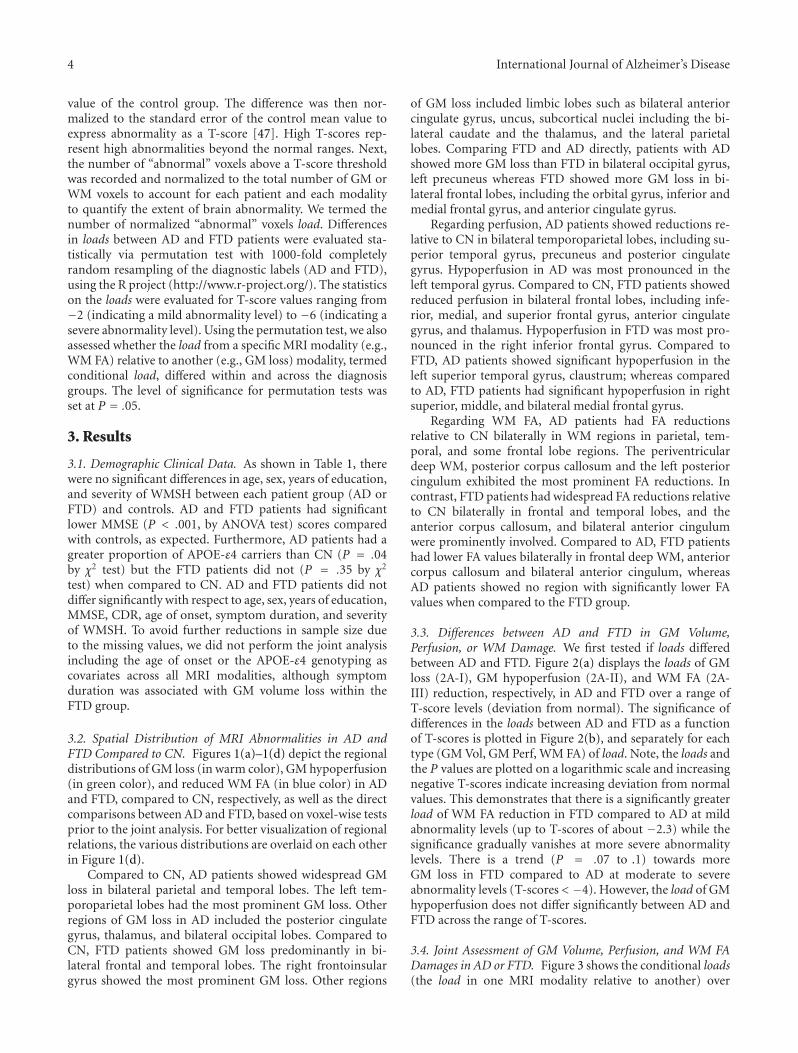
Table 1: Demographic and clinical data summary.
Normal AD FTD
Number of subjects 21 20 20
Age (years) 61.9± 9.6 63.1± 6.9 60.7± 9.9
Age range (years) 33∼73 51∼73 32∼74
Sex (M : F) 11 : 10 11 : 9 13 : 7
Years of Education (years) 16.8± 2.5 15.7± 3.0 16.2± 3.2
MMSE 29.6± 0.5 21.9± 5.6 23.1± 5.6
CDR 0 0.8± 0.3 1.2± 0.6
APOE-ε4 (carriers: non-carriers) 3 : 17a 14 : 5a 7 : 11b
Age of onset (years) NA 56.2± 5.7c 55.1± 9.9
Symptom duration (years) NA 3.25± 1.6c 5.3± 4.9
WMSH (severe : moderate : mild) 3 : 2 : 16 1 : 4 : 15 2 : 2 : 16avalue for one subject is missing.
bvalue for two subjects is missing.cvalue for 8 subjects is missing.WMSH = white matter signal hyperintensities.
algorithm [43] was applied to obtain probabilistic mapsof GM, WM, and CSF from the T1-weighted MRI data.(2) Spatial normalization: first, customized GM and WMprior images were created by transforming GM and WMprobabilistic maps of all subjects into the standard MNI(Montreal Neurological Institute) space [42]. The segmentedGM probabilistic maps in their native spaces were thenspatially normalized again to the customized GM prior imageusing a nonlinear transformation with 16 interactions. (3)Jacobian modulation: the spatially normalized GM imageswere multiplied by the Jacobian determinants of the trans-formation (modulation) to obtain volume differences. (4)Smoothing: the modulated GM images were smoothed withan 8 mm full-width-at-half-maximum (FWHM) isotropicGaussian kernel to reduce variations from misregistrationsand to perform voxelwise image statistics.
The assessment of perfusion changes included the follow-ing steps. (1) Cerebral blood flow (CBF) image calculation:a perfusion weighted (PWI) image was created by pairwisesubtraction of coregistered labeled from unlabeled ASL im-ages. The PWI images were then scaled to obtain a quan-titative CBF image based on a single compartment perfusionmodel [44]. (2) Intermodality coregistration: ALS perfusionand the corresponding T2- and T1-weighted image werecoregistered using an affine alignment to establish anatomi-cal correspondence between CBF and segmented GM imagesand to compute partial volume-corrected CBF in GM.(3) Partial volume correction: partial volume correction ofCBF images was performed by rescaling CBF in each voxelproportionately to the GM and WM content, assuming thatperfusion of white matter is only 25% of that of GM, asdetailed by Du et al. [16]. (4) Spatial normalization: thepartial volume-corrected CBF images in GM were spatiallynormalized to the customized GM prior image that wascreated from the previous processing of VBM, using the samenonlinear transformation and smoothing parameters.
The assessment of white matter integrity was performedbased on DTI and computation of fractional anisotropy(FA) maps, using the dTV.II software [45] and Volume-one
software package (URL: http://www.ut-radiology.umin.jp/people/masutani/dTV.htm), supplemented by automaticimage denoising and eddy-current corrections. SPM8 soft-ware was used for voxelwise analysis of the FA images asoutlined in detail elsewhere [25]. In brief, the FA imagesin the native space underwent the following procedures. (1)Creation of a customized FA template: an averaged FA imagewas first created from all subjects’ FA images that initiallytransformed to the EPI-derived MNI template in SPM. Thisaveraged FA image was further co-registered to the WM priorimage using affine alignment and manual adjustment [46] toarchive a customized FA template that accurately correspondto the anatomical information in the WM prior image.(2) Spatial normalization and smoothing: the FA image ofeach subject in the native space was recursively normalizedto the customized FA template using the same nonlineartransformation and smoothing parameters that were appliedin the previous VBM procedure.
2.4. Statistics. Paired group differences were evaluated voxel-by-voxel using a general linear model with diagnosis as maincontrast and age, sex, and the years of education as covariates.In addition, total intracranial volume (TIV) was used as acovariate in test for volume differences and global meanperfusion was used as a covariate in test for perfusion dif-ferences. A threshold of at least 85% GM volume fractionin voxels was applied to restrict GM volume and perfusionanalyses to voxels containing predominantly GM. Similarly, athreshold of at least 80% WM volume fraction was applied torestrict FA analysis to voxels containing predominantly WM.The statistical significance for main effects of abnormalities,which was only the prestep for joint analyses, was set to anuncorrected voxel-level P value of .001.
To test if FTD and AD differ with respect to WM and GMabnormalities, we started by determining the number of vox-els representing “abnormal” values for each patient and eachMRI modality. This was conducted by recording voxelwisedifferences between an individual’s image value (GM vol-ume, GM perfusion, or WM FA) and the respective mean
4 International Journal of Alzheimer’s Disease
value of the control group. The difference was then nor-malized to the standard error of the control mean value toexpress abnormality as a T-score [47]. High T-scores rep-resent high abnormalities beyond the normal ranges. Next,the number of “abnormal” voxels above a T-score thresholdwas recorded and normalized to the total number of GM orWM voxels to account for each patient and each modalityto quantify the extent of brain abnormality. We termed thenumber of normalized “abnormal” voxels load. Differencesin loads between AD and FTD patients were evaluated sta-tistically via permutation test with 1000-fold completelyrandom resampling of the diagnostic labels (AD and FTD),using the R project (http://www.r-project.org/). The statisticson the loads were evaluated for T-score values ranging from−2 (indicating a mild abnormality level) to −6 (indicating asevere abnormality level). Using the permutation test, we alsoassessed whether the load from a specific MRI modality (e.g.,WM FA) relative to another (e.g., GM loss) modality, termedconditional load, differed within and across the diagnosisgroups. The level of significance for permutation tests wasset at P = .05.
3. Results
3.1. Demographic Clinical Data. As shown in Table 1, therewere no significant differences in age, sex, years of education,and severity of WMSH between each patient group (AD orFTD) and controls. AD and FTD patients had significantlower MMSE (P < .001, by ANOVA test) scores comparedwith controls, as expected. Furthermore, AD patients had agreater proportion of APOE-ε4 carriers than CN (P = .04by χ2 test) but the FTD patients did not (P = .35 by χ2
test) when compared to CN. AD and FTD patients did notdiffer significantly with respect to age, sex, years of education,MMSE, CDR, age of onset, symptom duration, and severityof WMSH. To avoid further reductions in sample size dueto the missing values, we did not perform the joint analysisincluding the age of onset or the APOE-ε4 genotyping ascovariates across all MRI modalities, although symptomduration was associated with GM volume loss within theFTD group.
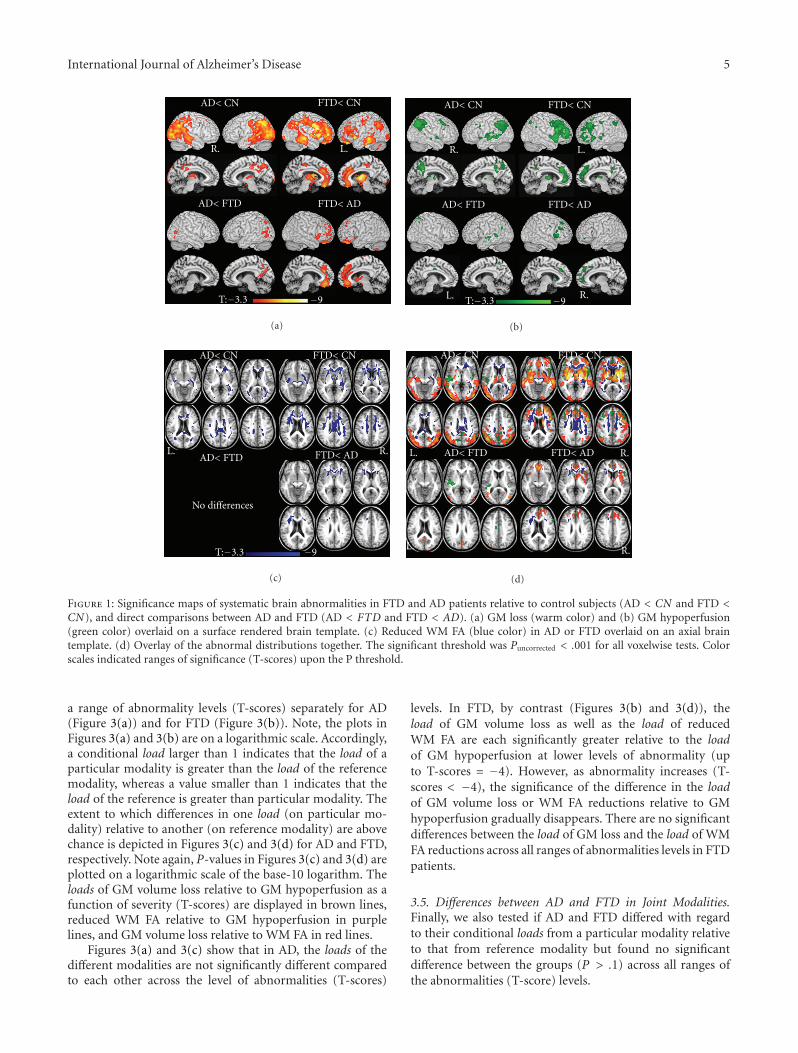
3.2. Spatial Distribution of MRI Abnormalities in AD andFTD Compared to CN. Figures 1(a)–1(d) depict the regionaldistributions of GM loss (in warm color), GM hypoperfusion(in green color), and reduced WM FA (in blue color) in ADand FTD, compared to CN, respectively, as well as the directcomparisons between AD and FTD, based on voxel-wise testsprior to the joint analysis. For better visualization of regionalrelations, the various distributions are overlaid on each otherin Figure 1(d).
Compared to CN, AD patients showed widespread GMloss in bilateral parietal and temporal lobes. The left tem-poroparietal lobes had the most prominent GM loss. Otherregions of GM loss in AD included the posterior cingulategyrus, thalamus, and bilateral occipital lobes. Compared toCN, FTD patients showed GM loss predominantly in bi-lateral frontal and temporal lobes. The right frontoinsulargyrus showed the most prominent GM loss. Other regions
of GM loss included limbic lobes such as bilateral anteriorcingulate gyrus, uncus, subcortical nuclei including the bi-lateral caudate and the thalamus, and the lateral parietallobes. Comparing FTD and AD directly, patients with ADshowed more GM loss than FTD in bilateral occipital gyrus,left precuneus whereas FTD showed more GM loss in bi-lateral frontal lobes, including the orbital gyrus, inferior andmedial frontal gyrus, and anterior cingulate gyrus.
Regarding perfusion, AD patients showed reductions re-lative to CN in bilateral temporoparietal lobes, including su-perior temporal gyrus, precuneus and posterior cingulategyrus. Hypoperfusion in AD was most pronounced in theleft temporal gyrus. Compared to CN, FTD patients showedreduced perfusion in bilateral frontal lobes, including infe-rior, medial, and superior frontal gyrus, anterior cingulategyrus, and thalamus. Hypoperfusion in FTD was most pro-nounced in the right inferior frontal gyrus. Compared toFTD, AD patients showed significant hypoperfusion in theleft superior temporal gyrus, claustrum; whereas comparedto AD, FTD patients had significant hypoperfusion in rightsuperior, middle, and bilateral medial frontal gyrus.
Regarding WM FA, AD patients had FA reductionsrelative to CN bilaterally in WM regions in parietal, tem-poral, and some frontal lobe regions. The periventriculardeep WM, posterior corpus callosum and the left posteriorcingulum exhibited the most prominent FA reductions. Incontrast, FTD patients had widespread FA reductions relativeto CN bilaterally in frontal and temporal lobes, and theanterior corpus callosum, and bilateral anterior cingulumwere prominently involved. Compared to AD, FTD patientshad lower FA values bilaterally in frontal deep WM, anteriorcorpus callosum and bilateral anterior cingulum, whereasAD patients showed no region with significantly lower FAvalues when compared to the FTD group.
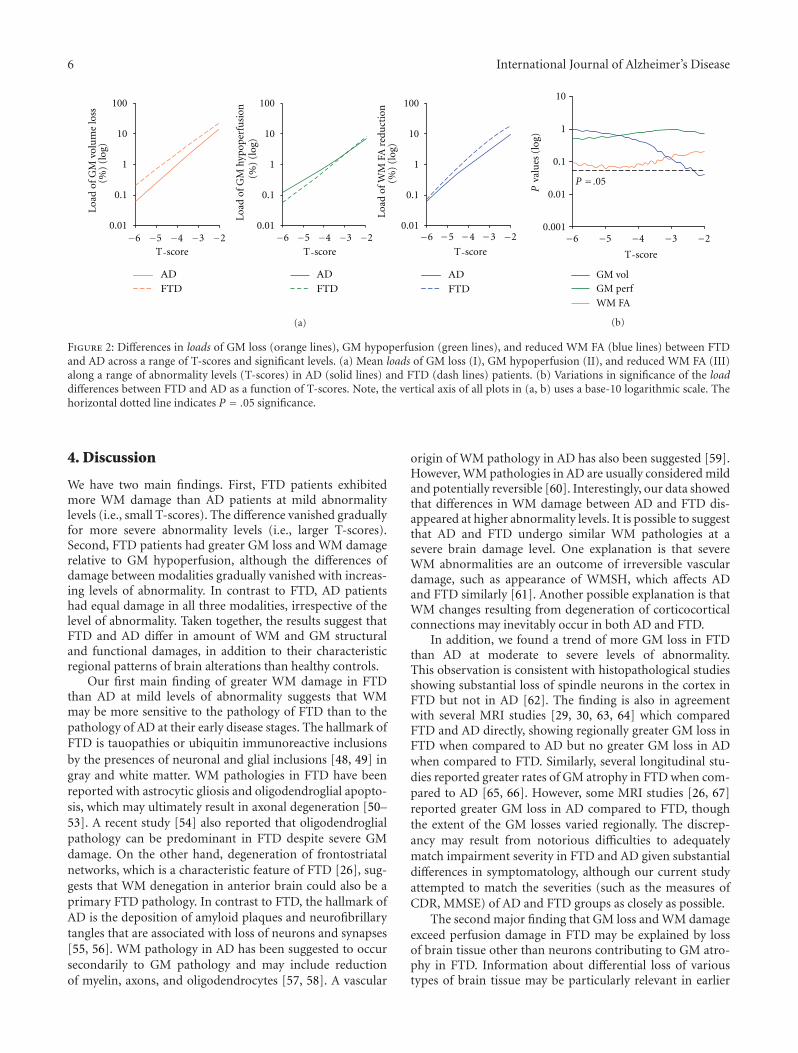
3.3. Differences between AD and FTD in GM Volume,Perfusion, or WM Damage. We first tested if loads differedbetween AD and FTD. Figure 2(a) displays the loads of GMloss (2A-I), GM hypoperfusion (2A-II), and WM FA (2A-III) reduction, respectively, in AD and FTD over a range ofT-score levels (deviation from normal). The significance ofdifferences in the loads between AD and FTD as a functionof T-scores is plotted in Figure 2(b), and separately for eachtype (GM Vol, GM Perf, WM FA) of load. Note, the loads andthe P values are plotted on a logarithmic scale and increasingnegative T-scores indicate increasing deviation from normalvalues. This demonstrates that there is a significantly greaterload of WM FA reduction in FTD compared to AD at mildabnormality levels (up to T-scores of about −2.3) while thesignificance gradually vanishes at more severe abnormalitylevels. There is a trend (P = .07 to .1) towards moreGM loss in FTD compared to AD at moderate to severeabnormality levels (T-scores < −4). However, the load of GMhypoperfusion does not differ significantly between AD andFTD across the range of T-scores.
3.4. Joint Assessment of GM Volume, Perfusion, and WM FADamages in AD or FTD. Figure 3 shows the conditional loads(the load in one MRI modality relative to another) over
International Journal of Alzheimer’s Disease 5
FTD< CNAD< CN
AD< FTD FTD< AD
L.R.
T:−3.3 −9
(a)
FTD< CNAD< CN
AD< FTD FTD< AD
L.R.
T:−3.3 −9R.L.
(b)
FTD< CNAD< CN
AD< FTD FTD< ADL. R.
T:−3.3 −9
No differences
(c)
FTD< CNAD< CN
AD< FTD FTD< ADL. R.
L. R.
(d)
Figure 1: Significance maps of systematic brain abnormalities in FTD and AD patients relative to control subjects (AD < CN and FTD <CN), and direct comparisons between AD and FTD (AD < FTD and FTD < AD). (a) GM loss (warm color) and (b) GM hypoperfusion(green color) overlaid on a surface rendered brain template. (c) Reduced WM FA (blue color) in AD or FTD overlaid on an axial braintemplate. (d) Overlay of the abnormal distributions together. The significant threshold was Puncorrected < .001 for all voxelwise tests. Colorscales indicated ranges of significance (T-scores) upon the P threshold.
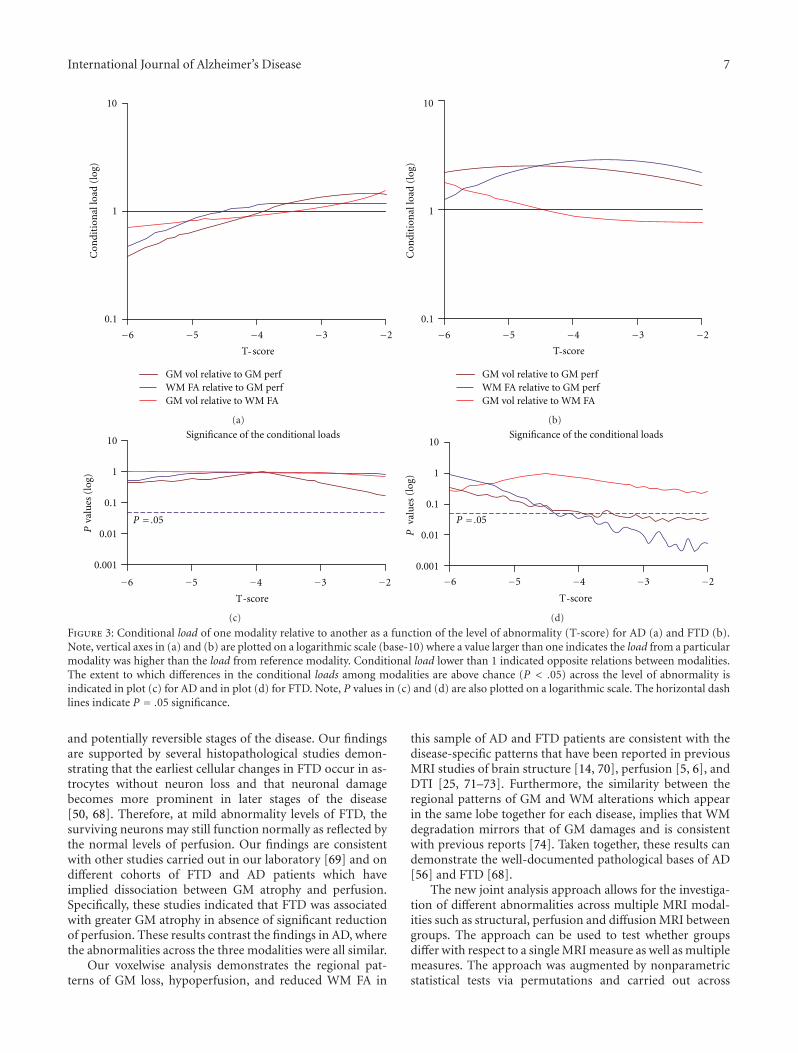
a range of abnormality levels (T-scores) separately for AD(Figure 3(a)) and for FTD (Figure 3(b)). Note, the plots inFigures 3(a) and 3(b) are on a logarithmic scale. Accordingly,a conditional load larger than 1 indicates that the load of aparticular modality is greater than the load of the referencemodality, whereas a value smaller than 1 indicates that theload of the reference is greater than particular modality. Theextent to which differences in one load (on particular mo-dality) relative to another (on reference modality) are abovechance is depicted in Figures 3(c) and 3(d) for AD and FTD,respectively. Note again, P-values in Figures 3(c) and 3(d) areplotted on a logarithmic scale of the base-10 logarithm. Theloads of GM volume loss relative to GM hypoperfusion as afunction of severity (T-scores) are displayed in brown lines,reduced WM FA relative to GM hypoperfusion in purplelines, and GM volume loss relative to WM FA in red lines.
Figures 3(a) and 3(c) show that in AD, the loads of thedifferent modalities are not significantly different comparedto each other across the level of abnormalities (T-scores)
levels. In FTD, by contrast (Figures 3(b) and 3(d)), theload of GM volume loss as well as the load of reducedWM FA are each significantly greater relative to the loadof GM hypoperfusion at lower levels of abnormality (upto T-scores = −4). However, as abnormality increases (T-scores < −4), the significance of the difference in the loadof GM volume loss or WM FA reductions relative to GMhypoperfusion gradually disappears. There are no significantdifferences between the load of GM loss and the load of WMFA reductions across all ranges of abnormalities levels in FTDpatients.
3.5. Differences between AD and FTD in Joint Modalities.Finally, we also tested if AD and FTD differed with regardto their conditional loads from a particular modality relativeto that from reference modality but found no significantdifference between the groups (P > .1) across all ranges ofthe abnormalities (T-score) levels.
6 International Journal of Alzheimer’s Disease
AD
FTD
AD
FTD
AD
FTD
−6 −5 −4 −3 −2 −6 −5 −4 3 −− 2 −6 −5 −4 −3 −20.01
0.1
1
10
100
0.01
0.1
1
10
100
0.01
0.1
1
10
100
L oa
dof
GM
hypo
per
fusi
on(%
)(l
og)
Loa
dof
GM
volu
me
loss
(%)
(log
)
Loa
dof
WM
FAre
duct
ion
(%)
(log
)
T score T score- - T score-
(a)
−6 −5 −4 −3 −20.001
0.01
0.1
1
10
GM volGM perf
WM FA
P = .05
T score
Pva
lues
(log
)
-
(b)
Figure 2: Differences in loads of GM loss (orange lines), GM hypoperfusion (green lines), and reduced WM FA (blue lines) between FTDand AD across a range of T-scores and significant levels. (a) Mean loads of GM loss (I), GM hypoperfusion (II), and reduced WM FA (III)along a range of abnormality levels (T-scores) in AD (solid lines) and FTD (dash lines) patients. (b) Variations in significance of the loaddifferences between FTD and AD as a function of T-scores. Note, the vertical axis of all plots in (a, b) uses a base-10 logarithmic scale. Thehorizontal dotted line indicates P = .05 significance.
4. Discussion
We have two main findings. First, FTD patients exhibitedmore WM damage than AD patients at mild abnormalitylevels (i.e., small T-scores). The difference vanished graduallyfor more severe abnormality levels (i.e., larger T-scores).Second, FTD patients had greater GM loss and WM damagerelative to GM hypoperfusion, although the differences ofdamage between modalities gradually vanished with increas-ing levels of abnormality. In contrast to FTD, AD patientshad equal damage in all three modalities, irrespective of thelevel of abnormality. Taken together, the results suggest thatFTD and AD differ in amount of WM and GM structuraland functional damages, in addition to their characteristicregional patterns of brain alterations than healthy controls.
Our first main finding of greater WM damage in FTDthan AD at mild levels of abnormality suggests that WMmay be more sensitive to the pathology of FTD than to thepathology of AD at their early disease stages. The hallmark ofFTD is tauopathies or ubiquitin immunoreactive inclusionsby the presences of neuronal and glial inclusions [48, 49] ingray and white matter. WM pathologies in FTD have beenreported with astrocytic gliosis and oligodendroglial apopto-sis, which may ultimately result in axonal degeneration [50–53]. A recent study [54] also reported that oligodendroglialpathology can be predominant in FTD despite severe GMdamage. On the other hand, degeneration of frontostriatalnetworks, which is a characteristic feature of FTD [26], sug-gests that WM denegation in anterior brain could also be aprimary FTD pathology. In contrast to FTD, the hallmark ofAD is the deposition of amyloid plaques and neurofibrillarytangles that are associated with loss of neurons and synapses[55, 56]. WM pathology in AD has been suggested to occursecondarily to GM pathology and may include reductionof myelin, axons, and oligodendrocytes [57, 58]. A vascular
origin of WM pathology in AD has also been suggested [59].However, WM pathologies in AD are usually considered mildand potentially reversible [60]. Interestingly, our data showedthat differences in WM damage between AD and FTD dis-appeared at higher abnormality levels. It is possible to suggestthat AD and FTD undergo similar WM pathologies at asevere brain damage level. One explanation is that severeWM abnormalities are an outcome of irreversible vasculardamage, such as appearance of WMSH, which affects ADand FTD similarly [61]. Another possible explanation is thatWM changes resulting from degeneration of corticocorticalconnections may inevitably occur in both AD and FTD.
In addition, we found a trend of more GM loss in FTDthan AD at moderate to severe levels of abnormality.This observation is consistent with histopathological studiesshowing substantial loss of spindle neurons in the cortex inFTD but not in AD [62]. The finding is also in agreementwith several MRI studies [29, 30, 63, 64] which comparedFTD and AD directly, showing regionally greater GM loss inFTD when compared to AD but no greater GM loss in ADwhen compared to FTD. Similarly, several longitudinal stu-dies reported greater rates of GM atrophy in FTD when com-pared to AD [65, 66]. However, some MRI studies [26, 67]reported greater GM loss in AD compared to FTD, thoughthe extent of the GM losses varied regionally. The discrep-ancy may result from notorious difficulties to adequatelymatch impairment severity in FTD and AD given substantialdifferences in symptomatology, although our current studyattempted to match the severities (such as the measures ofCDR, MMSE) of AD and FTD groups as closely as possible.
The second major finding that GM loss and WM damageexceed perfusion damage in FTD may be explained by lossof brain tissue other than neurons contributing to GM atro-phy in FTD. Information about differential loss of varioustypes of brain tissue may be particularly relevant in earlier
International Journal of Alzheimer’s Disease 7
−6 −5 −4 −3 −2
Con
diti
onal
load
(log
)
0.1
1
10
GM vol relative to GM perfWM FA relative to GM perfGM vol relative to WM FA
T score-
(a)
−6 −5 −4 −3 −2
Con
diti
onal
load
(log
)
0.1
1
10
GM vol relative to GM perfWM FA relative to GM perfGM vol relative to WM FA
T score-
(b)
Pva
lues
(log
)
0.001
0.01
0.1
1
10Significance of the conditional loads
−6 −5 −4 −3 −2
P = .05
-T score
(c)
valu
es(l
og)
0.001
0.01
0.1
1
10Significance of the conditional loads
−6 −5 −4 −3 −2
P = .05
P
T score-
(d)
Figure 3: Conditional load of one modality relative to another as a function of the level of abnormality (T-score) for AD (a) and FTD (b).Note, vertical axes in (a) and (b) are plotted on a logarithmic scale (base-10) where a value larger than one indicates the load from a particularmodality was higher than the load from reference modality. Conditional load lower than 1 indicated opposite relations between modalities.The extent to which differences in the conditional loads among modalities are above chance (P < .05) across the level of abnormality isindicated in plot (c) for AD and in plot (d) for FTD. Note, P values in (c) and (d) are also plotted on a logarithmic scale. The horizontal dashlines indicate P = .05 significance.
and potentially reversible stages of the disease. Our findingsare supported by several histopathological studies demon-strating that the earliest cellular changes in FTD occur in as-trocytes without neuron loss and that neuronal damagebecomes more prominent in later stages of the disease[50, 68]. Therefore, at mild abnormality levels of FTD, thesurviving neurons may still function normally as reflected bythe normal levels of perfusion. Our findings are consistentwith other studies carried out in our laboratory [69] and ondifferent cohorts of FTD and AD patients which haveimplied dissociation between GM atrophy and perfusion.Specifically, these studies indicated that FTD was associatedwith greater GM atrophy in absence of significant reductionof perfusion. These results contrast the findings in AD, wherethe abnormalities across the three modalities were all similar.
Our voxelwise analysis demonstrates the regional pat-terns of GM loss, hypoperfusion, and reduced WM FA in
this sample of AD and FTD patients are consistent with thedisease-specific patterns that have been reported in previousMRI studies of brain structure [14, 70], perfusion [5, 6], andDTI [25, 71–73]. Furthermore, the similarity between theregional patterns of GM and WM alterations which appearin the same lobe together for each disease, implies that WMdegradation mirrors that of GM damages and is consistentwith previous reports [74]. Taken together, these results candemonstrate the well-documented pathological bases of AD[56] and FTD [68].
The new joint analysis approach allows for the investiga-tion of different abnormalities across multiple MRI modal-ities such as structural, perfusion and diffusion MRI betweengroups. The approach can be used to test whether groupsdiffer with respect to a single MRI measure as well as multiplemeasures. The approach was augmented by nonparametricstatistical tests via permutations and carried out across
8 International Journal of Alzheimer’s Disease
a range of T-scores to reduce measurement bias toward thevarious brain conditions. The concept can be expanded inprinciple to conduct a voxelwise joint analysis of multipleMRI measures to determine regional variations in GM lossand hypoperfusion. Other statistical methods for joint anal-yses of multiple image modalities such as joint independentcomponent analysis (jICA) [75] may provide alternativesolutions. The findings with multimodal MRI could poten-tially be useful to improve the design of AD and FTD clinicaltrials involving MRI. First, correlations across the MRI meas-ures, potentially boosting sensitivity and specificity, couldlead to reduced sample sizes. Second, the finding revealedthat FTD presents more white matter involvement relativeto AD, thus providing a new biological feature of FTD, andcould be used to relax the need to match disease severity instudies recruiting AD and FTD patients.
Limitations of the current study include a small samplesize that was reliant on clinical diagnoses which were notsufficiently confirmed by autopsies. Therefore, confidencein the generalization of the results is limited, and potentialmisdiagnosis of patients may have resulted in spurious find-ings. Furthermore, we cannot completely rule out that otherfactors than disease etiology, such as genetic profiles, dura-tion of symptoms, and cardiovascular conditions, whichcontributed to MRI differences between the patients andthus contaminated the findings. Second, diffusion encodingwas limited to the minimum of 6 directions at the time thisprotocol was initiated, although it is known that many moreencoding directions improve the characterization of diffu-sion such as fewer ambiguities in regions of crossing fibersand better spatial invariance of the noise pattern. Therefore,fiber crossings and the DTI noise pattern may potentiallymimic regional differences in FA between these groups.Third, we ignored relationships between brain regions inour joint analysis and therefore under-utilized informationfrom the multimodal MRI data. A more powerful statisticalframework [76] that takes spatial relations between mul-tivariate measures into account may provide more power.Finally, the data was artificially scaled to provide a uniformresolution for all MRI modalities, which may have induceda spatial bias as well as altered selectively the sensitivity ofeach modality. Other approaches that do not require a uni-form resolution but can operate on variable spatial scales,such as information theoretic formalisms [77], may lead todifferences in results.
In conclusion, our findings suggest that FTD and ADdiffer regarding their impacts on WM and GM structural andfunctional abnormalities, in addition to differences betweentheir characteristic regional patterns of brain alterations. Fur-thermore, the joint assessment of multimodal MRI measuresemployed in this study has potential value to improve thedifferential diagnosis between FTD and AD.
Acknowledgments
This research was funded in part by National Institutes ofHealth Grants (P01AG19724, P50 AG23501) and a Grantfrom the National Center for Resource Research (P41
RR23953). This material is the result of work supportedwith resources and the use of facilities at the VeteransAdministration Medical Center, San Francisco California.The authors thank all the participants in this study. Theauthors also thank Mr. Shannon Buckley and Mr. PouriaMojabi for assistance with image processing, Mr. Philip Inselfor the help with statistics, and Dr. Susanne Mueller for theadvice in data analysis.
References
[1] N. S. Ryan and N. C. Fox, “Imaging biomarkers in Alzheimer’sdisease,” Annals of the New York Academy of Sciences, vol. 1180,pp. 20–27, 2009.
[2] J. C. Baron, G. Chetelat, B. Desgranges et al., “In vivo mappingof gray matter loss with voxel-based morphometry in mildAlzheimer’s disease,” NeuroImage, vol. 14, no. 2, pp. 298–309,2001.
[3] K. Ishii, H. Sasaki, A. K. Kono, N. Miyamoto, T. Fukuda,and E. Mori, “Comparison of gray matter and metabolicreduction in mild Alzheimer’s disease using FDG-PET andvoxel-based morphometric MR studies,” European Journal ofNuclear Medicine and Molecular Imaging, vol. 32, no. 8, pp.959–963, 2005.
[4] P. Bartenstein, S. Minoshima, C. Hirsch et al., “Quantitativeassessment of cerebral blood flow in patients with Alzheimer’sdisease by SPECT,” Journal of Nuclear Medicine, vol. 38, no. 7,pp. 1095–1101, 1997.
[5] N. A. Johnson, G. H. Jahng, M. W. Weiner et al., “Patternof cerebral hypoperfusion in Alzheimer disease and mildcognitive impairment measured with arterial spin-labelingMR imaging: initial experience,” Radiology, vol. 234, no. 3, pp.851–859, 2005.
[6] D. C. Alsop, J. A. Detre, and M. Grossman, “Assessment ofcerebral blood flow in Alzheimer’s disease by spin-labeledmagnetic resonance imaging,” Annals of Neurology, vol. 47, no.1, pp. 93–100, 2000.
[7] E. J. Kim, S. S. Cho, Y. Jeong et al., “Glucose metabolism inearly onset versus late onset Alzheimer’s disease: an SPM anal-ysis of 120 patients,” Brain, vol. 128, no. 8, pp. 1790–1801,2005.
[8] S. Xie, J. X. Xiao, G. L. Gong et al., “Voxel-based detectionof white matter abnormalities in mild Alzheimer disease,”Neurology, vol. 66, no. 12, pp. 1845–1849, 2006.
[9] O. Naggara, C. Oppenheim, D. Rieu et al., “Diffusion tensorimaging in early Alzheimer’s disease,” Psychiatry Research—Neuroimaging, vol. 146, no. 3, pp. 243–249, 2006.
[10] R. Stahl, O. Dietrich, S. J. Teipel, H. Hampel, M. F. Reiser, andS. O. Schoenberg, “White matter damage in Alzheimer diseaseand mild cognitive impairment: assessment with diffusion-tensor MR imaging and parallel imaging techniques,” Radiol-ogy, vol. 243, no. 2, pp. 483–492, 2007.
[11] S. J. Teipel, R. Stahl, O. Dietrich et al., “Multivariate networkanalysis of fiber tract integrity in Alzheimer’s disease,” Neu-roImage, vol. 34, no. 3, pp. 985–995, 2007.
[12] J. Huang, R. P. Friedland, and A. P. Auchus, “Diffusion tensorimaging of normal-appearing white matter in mild cognitiveimpairment and early Alzheimer disease: preliminary evidenceof axonal degeneration in the temporal lobe,” AmericanJournal of Neuroradiology, vol. 28, no. 10, pp. 1943–1948, 2007.
[13] L. Wang, F. C. Goldstein, E. Veledar et al., “Alterations incortical thickness and white matter integrity in mild cogni-tive impairment measured by whole-brain cortical thickness
International Journal of Alzheimer’s Disease 9
mapping and diffusion tensor imaging,” American Journal ofNeuroradiology, vol. 30, no. 5, pp. 893–899, 2009.
[14] H. J. Rosen, M. L. Gorno-Tempini, W. P. Goldman et al.,“Patterns of brain atrophy in frontotemporal dementia andsemantic dementia,” Neurology, vol. 58, no. 2, pp. 198–208,2002.
[15] M. Grossman, C. McMillan, P. Moore et al., “What’s in a name:voxel-based morphometric analyses of MRI and namingdifficulty in Alzheimer’s disease, frontotemporal dementia andcorticobasal degeneration,” Brain, vol. 127, no. 3, pp. 628–649,2004.
[16] A. T. Du, G. H. Jahng, S. Hayasaka et al., “Hypoperfusion infrontotemporal dementia and Alzheimer disease by arterialspin labeling MRI,” Neurology, vol. 67, no. 7, pp. 1215–1220,2006.
[17] J. Diehl, T. Grimmer, A. Drzezga, M. Riemenschneider, H.Forstl, and A. Kurz, “Cerebral metabolic patterns at earlystages of frontotemporal dementia and semantic dementia: APET study,” Neurobiology of Aging, vol. 25, no. 8, pp. 1051–1056, 2004.
[18] T. Grimmer, J. Diehl, A. Drzezga, H. Forstl, and A. Kurz,“Region-specific decline of cerebral glucose metabolism inpatients with frontotemporal dementia: a prospective F-FDG-PET study,” Dementia and Geriatric Cognitive Disorders, vol.18, no. 1, pp. 32–36, 2004.
[19] K. Ishii, S. Sakamoto, M. Sasaki et al., “Cerebral glucosemetabolism in patients with frontotemporal dementia,” Jour-nal of Nuclear Medicine, vol. 39, no. 11, pp. 1875–1878, 1998.
[20] Y. Jeong, S. S. Cho, J. M. Park et al., “18F-FDG PET findingsin frontotemporal dementia: an SPM analysis of 29 patients,”Journal of Nuclear Medicine, vol. 46, no. 2, pp. 233–239, 2005.
[21] V. A. Cardenas, A. L. Boxer, L. L. Chao et al., “Deformation-based morphometry reveals brain atrophy in frontotemporaldementia,” Archives of Neurology, vol. 64, no. 6, pp. 873–877,2007.
[22] L. L. Chao, N. Schuff, E. M. Clevenger et al., “Patterns ofwhite matter atrophy in frontotemporal lobar degeneration,”Archives of Neurology, vol. 64, no. 11, pp. 1619–1624, 2007.
[23] B. Borroni, S. M. Brambati, C. Agosti et al., “Evidence of whitematter changes on diffusion tensor imaging in frontotemporaldementia,” Archives of Neurology, vol. 64, no. 2, pp. 246–251,2007.
[24] E. S. Matsuo, R. W. Shin, M. L. Billingsley et al., “Biopsy-derived adult human brain tau is phosphorylated at many ofthe same sites as Alzheimer’s disease paired helical filamenttau,” Neuron, vol. 13, no. 4, pp. 989–1002, 1994.
[25] Y. Zhang, N. Schuff, A. T. Du et al., “White matter damage infrontotemporal dementia and Alzheimers disease measured bydiffusion MRI,” Brain, vol. 132, no. 9, pp. 2579–2592, 2009.
[26] G. D. Rabinovici, W. W. Seeley, E. J. Kim et al., “DistinctMRI atrophy patterns in autopsy-proven Alzheimer’s diseaseand frontotemporal lobar degeneration,” American Journal ofAlzheimer’s Disease and other Dementias, vol. 22, no. 6, pp.474–488, 2007.
[27] T. Fukui and A. Kertesz, “Volumetric study of lobar atrophyin Pick complex and Alzheimer’s disease,” Journal of theNeurological Sciences, vol. 174, no. 2, pp. 111–121, 2000.
[28] A. R. Varma, W. Adams, J. J. Lloyd et al., “Diagnostic patternsof regional atrophy on MRI and regional cerebral blood flowchange on SPECT in young onset patients with Alzheimer’sdisease, frontotemporal dementia and vascular dementia,”Acta Neurologica Scandinavica, vol. 105, no. 4, pp. 261–269,2002.
[29] C. Bocti, C. Rockel, P. Roy, F. Gao, and S. E. Black, “Top-ographical patterns of lobar atrophy in frontotemporaldementia and Alzheimer’s disease,” Dementia and GeriatricCognitive Disorders, vol. 21, no. 5-6, pp. 364–372, 2006.
[30] T. Kanda, K. Ishii, T. Uemura et al., “Comparison of greymatter and metabolic reductions in frontotemporal dementiausing FDG-PET and voxel-based morphometric MR studies,”European Journal of Nuclear Medicine and Molecular Imaging,vol. 35, no. 12, pp. 2227–2234, 2008.
[31] C. Tranfaglia, B. Palumbo, D. Siepi, H. Sinzinger, and L. Par-netti, “Semi-quantitative analysis of perfusion of Brodmannareas in the differential diagnosis of cognitive impairmentin Alzheimer’s disease, fronto-temporal dementia and mildcognitive impairment,” Hellenic Journal of Nuclear Medicine,vol. 12, no. 2, pp. 110–195, 2009.
[32] A. Varrone, S. Pappata, C. Caraco et al., “Voxel-based com-parison of rCBF SPET images in frontotemporal dementiaand Alzheimer’s disease highlights the involvement of differentcortical networks,” European Journal of Nuclear Medicine, vol.29, no. 11, pp. 1447–1454, 2002.
[33] C. Luckhaus, M. Janner, M. Cohnen et al., “A novel MRI-biomarker candidate for Alzheimer’s disease composed ofregional brain volume and perfusion variables,” EuropeanJournal of Neurology, vol. 17, no. 12, pp. 1437–1444, 2010.
[34] K. B. Walhovd, A. M. Fjell, I. Amlien et al., “Multimodal imag-ing in mild cognitive impairment: metabolism, morphometryand diffusion of the temporal-parietal memory network,”NeuroImage, vol. 45, no. 1, pp. 215–223, 2009.
[35] M. F. Folstein, S. E. Folstein, and P. R. McHugh, “’Mini mentalstate’: a practical method for grading the cognitive state ofpatients for the clinician,” Journal of Psychiatric Research, vol.12, no. 3, pp. 189–198, 1975.
[36] D. Neary, J. S. Snowden, L. Gustafson et al., “Frontotemporallobar degeneration: a consensus on clinical diagnostic crite-ria,” Neurology, vol. 51, no. 6, pp. 1546–1554, 1998.
[37] G. McKhann, D. Drachman, M. Folstein, R. Katzman, D.Price, and E. M. Stadlan, “Clinical diagnosis of Alzheimer’sdisease: report of the NINCDS- ADRDA Work Group underthe auspices of Department of Health and Human ServicesTask Force on Alzheimer’s Disease,” Neurology, vol. 34, no. 7,pp. 939–944, 1984.
[38] J. C. Morris, “The Clinical Dementia Rating (CDR): currentversion and scoring rules,” Neurology, vol. 43, no. 11, pp. 2412–2414, 1993.
[39] P. Scheltens, F. Barkhof, D. Leys et al., “A semiquantitativerating scale for the assessment of signal hyperintensities onmagnetic resonance imaging,” Journal of the NeurologicalSciences, vol. 114, no. 1, pp. 7–12, 1993.
[40] J. A. Detre, J. S. Leigh, D. S. Williams, and A. P. Koretsky,“Perfusion imaging,” Magnetic Resonance in Medicine, vol. 23,no. 1, pp. 37–45, 1992.
[41] M. A. Griswold, P. M. Jakob, R. M. Heidemann et al.,“Generalized autocalibrating partially parallel acquisitions(GRAPPA),” Magnetic Resonance in Medicine, vol. 47, no. 6,pp. 1202–1210, 2002.
[42] J. Ashburner and K. J. Friston, “Voxel-based morphometry—the methods,” NeuroImage, vol. 11, no. 6 I, pp. 805–821, 2000.
[43] K. Van Leemput, F. Maes, D. Vandermeulen, A. Colchester,and P. Suetens, “Automated segmentation of multiple sclerosislesions by model outlier detection,” IEEE Transactions onMedical Imaging, vol. 20, no. 8, pp. 677–688, 2001.
[44] J. Wang, Y. Zhang, R. L. Wolf, A. C. Roc, D. C. Alsop,and J. A. Detre, “Amplitude-modulated continuous arterial
10 International Journal of Alzheimer’s Disease
spin-labeling 3.0-T perfusion MR imaging with a single coil:feasibility study,” Radiology, vol. 235, no. 1, pp. 218–228, 2005.
[45] Y. Masutani, S. Aoki, O. Abe, N. Hayashi, and K. Otomo, “MRdiffusion tensor imaging: recent advance and new techniquesfor diffusion tensor visualization,” European Journal of Radiol-ogy, vol. 46, no. 1, pp. 53–66, 2003.
[46] W. Zhan, Y. Zhang, S. G. Mueller et al., “Characterizationof white matter degeneration in elderly subjects by magneticresonance diffusion and FLAIR imaging correlation,” Neu-roImage, vol. 47, supplement 2, pp. T58–T65, 2009.
[47] M. Signorini, E. Paulesu, K. Friston et al., “Rapid assessmentof regional cerebral metabolic abnormalities in single subjectswith quantitative and nonquantitative [18F]FDG PET: a clini-cal validation of statistical parametric mapping,” NeuroImage,vol. 9, no. 1, pp. 63–80, 1999.
[48] G. M. McKhann, M. S. Albert, M. Grossman, B. Miller,D. Dickson, and J. Q. Trojanowski, “Clinical and patho-logical diagnosis of frontotemporal dementia: report of thework group on frontotemporal dementia and Pick’s disease,”Archives of Neurology, vol. 58, no. 11, pp. 1803–1809, 2001.
[49] J. Q. Trojanowski, K. Duff, H. Fillit et al., “New directionsfor frontotemporal dementia drug discovery,” Alzheimer’s andDementia, vol. 4, no. 2, pp. 89–93, 2008.
[50] M. Broe, J. Kril, and G. M. Halliday, “Astrocytic degenerationrelates to the severity of disease in frontotemporal dementia,”Brain, vol. 127, no. 10, pp. 2214–2220, 2004.
[51] J. M. Powers, N. P. Byrne, M. Ito et al., “A novel leukoen-cephalopathy associated with tau deposits primarily in whitematter glia,” Acta Neuropathologica, vol. 106, no. 2, pp. 181–187, 2003.
[52] E. Englund and A. Brun, “Frontal lobe degeneration of non-Alzheimer type IV: white matter changes,” Archives of Geron-tology and Geriatrics, vol. 6, no. 3, pp. 235–243, 1987.
[53] E. M. Larsson, E. Englund, M. Sjobeck, J. Latt, and S.Brockstedt, “MRI with diffusion tensor imaging post-mortemat 3.0 T in a patient with frontotemporal dementia,” Dementiaand Geriatric Cognitive Disorders, vol. 17, no. 4, pp. 316–319,2004.
[54] G. G. Kovacs, K. Majtenyi, S. Spina et al., “White mattertauopathy with globular glial inclusions: a distinct sporadicfrontotemporal lobar segeneration,” Journal of Neuropathologyand Experimental Neurology, vol. 67, no. 10, pp. 963–975,2008.
[55] M. E. Calhoun, P. Burgermeister, A. L. Phinney et al., “Neu-ronal overexpression of mutant amyloid precursor proteinresults in prominent deposition of cerebrovascular amyloid,”Proceedings of the National Academy of Sciences of the UnitedStates of America, vol. 96, no. 24, pp. 14088–14093, 1999.
[56] H. Braak and E. Braak, “Staging of Alzheimer’s disease-relatedneurofibrillary changes,” Neurobiology of Aging, vol. 16, no. 3,pp. 271–278, 1995.
[57] M. Bozzali, A. Falini, M. Franceschi et al., “White matterdamage in Alzheimer’s disease assessed in vivo using diffusiontensor magnetic resonance imaging,” Journal of NeurologyNeurosurgery and Psychiatry, vol. 72, no. 6, pp. 742–746, 2002.
[58] H. Hanyu, H. Sakurai, T. Iwamoto, M. Takasaki, H. Shindo,and K. Abe, “Diffusion-weighted MR imaging of the hip-pocampus and temporal white matter in Alzheimer’s disease,”Journal of the Neurological Sciences, vol. 156, no. 2, pp. 195–200, 1998.
[59] E. Englund, “Neuropathology of white matter changes inAlzheimer’s disease and vascular dementia,” Dementia and
Geriatric Cognitive Disorders, vol. 9, supplement 1, pp. 6–12,1998.
[60] C. M. Filley and B. K. Kleinschmidt-DeMasters, “Toxicleukoencephalopathy,” The New England Journal of Medicine,vol. 345, no. 6, pp. 425–432, 2001.
[61] A. R. Varma, R. Laitt, J. J. Lloyd et al., “Diagnostic valueof high signal abnormalities on T2 weighted MRI in thedifferentiation of Alzheimer’s, frontotemporal and vasculardementias,” Acta Neurologica Scandinavica, vol. 105, no. 5, pp.355–364, 2002.
[62] W. W. Seeley, D. A. Carlin, J. M. Allman et al., “Earlyfrontotemporal dementia targets neurons unique to apes andhumans,” Annals of Neurology, vol. 60, no. 6, pp. 660–667,2006.
[63] H. Kitagaki, E. Mori, S. Yamaji et al., “Frontotemporal demen-tia and Alzheimer disease: evaluation of cortical atrophy withautomated hemispheric surface display generated with MRimages,” Radiology, vol. 208, no. 2, pp. 431–439, 1998.
[64] B. B. Avants, P. A. Cook, L. Ungar, J. C. Gee, and M. Grossman,“Dementia induces correlated reductions in white matterintegrity and cortical thickness: a multivariate neuroimagingstudy with sparse canonical correlation analysis,” NeuroImage,vol. 50, no. 3, pp. 1004–1016, 2010.
[65] J. L. Whitwell, C. R. Jack Jr., V. S. Pankratz et al., “Rates ofbrain atrophy over time in autopsy-proven frontotemporaldementia and Alzheimer disease,” NeuroImage, vol. 39, no. 3,pp. 1034–1040, 2008.
[66] D. Chan, N. C. Fox, R. Jenkins, R. I. Scahill, W. R. Crum, andM. N. Rossor, “Rates of global and regional cerebral atrophyin AD and frontotemporal dementia,” Neurology, vol. 57, no.10, pp. 1756–1763, 2001.
[67] C. Davatzikos, S. M. Resnick, X. Wu, P. Parmpi, and C. M.Clark, “Individual patient diagnosis of AD and FTD via high-dimensional pattern classification of MRI,” NeuroImage, vol.41, no. 4, pp. 1220–1227, 2008.
[68] C. Kersaitis, G. M. Halliday, and J. J. Kril, “Regional andcellular pathology in frontotemporal dementia: relationship tostage of disease in cases with and without Pick bodies,” ActaNeuropathologica, vol. 108, no. 6, pp. 515–523, 2004.
[69] S. Shimizu, Y. Zhang, J. Laxamana et al., “Concordanceand discordance between brain perfusion and atrophy infrontotemporal dementia,” Brain Imaging and Behavior, vol.4, no. 1, pp. 46–54, 2010.
[70] J. L. Whitwell, K. A. Josephs, M. N. Rossor et al., “Magneticresonance imaging signatures of tissue pathology in fron-totemporal dementia,” Archives of Neurology, vol. 62, no. 9, pp.1402–1408, 2005.
[71] S. Takahashi, H. Yonezawa, J. Takahashi, M. Kudo, T. Inoue,and H. Tohgi, “Selective reduction of diffusion anisotropy inwhite matter of Alzheimer disease brains measured by 3.0 Teslamagnetic resonance imaging,” Neuroscience Letters, vol. 332,no. 1, pp. 45–48, 2002.
[72] A. Fellgiebel, M. J. Muller, P. Wille et al., “Color-codeddiffusion-tensor-imaging of posterior cingulate fiber tracts inmild cognitive impairment,” Neurobiology of Aging, vol. 26, no.8, pp. 1193–1198, 2005.
[73] D. H. Salat, D. S. Tuch, A. J. W. van der Kouwe et al.,“White matter pathology isolates the hippocampal formationin Alzheimer’s disease,” Neurobiology of Aging, vol. 31, no. 2,pp. 244–256, 2010.
[74] G. Bartzokis, P. H. Lu, and J. Mintz, “Human brain myeli-nation and amyloid beta deposition in Alzheimer’s disease,”Alzheimer’s and Dementia, vol. 3, no. 2, pp. 122–125, 2007.

International Journal of Alzheimer’s Disease 11
[75] K. A. Celone, V. D. Calhoun, B. C. Dickerson et al., “Alterationsin memory networks in mild cognitive impairment andAlzheimer’s disease: an independent component analysis,”Journal of Neuroscience, vol. 26, no. 40, pp. 10222–10231, 2006.
[76] K. J. Worsley, J. E. Taylor, F. Tomaiuolo, and J. Lerch, “Unifiedunivariate and multivariate random field theory,” NeuroImage,vol. 23, supplement 1, pp. S189–S195, 2004.
[77] K. Young, A. T. Du, J. Kramer et al., “Patterns of structuralcomplexity in Alzheimer’s disease and frontotemporal demen-tia,” Human Brain Mapping, vol. 30, no. 5, pp. 1667–1677,2009.

Submit your manuscripts athttp://www.hindawi.com
Stem CellsInternational
Hindawi Publishing Corporationhttp://www.hindawi.com Volume 2014
Hindawi Publishing Corporationhttp://www.hindawi.com Volume 2014
MEDIATORSINFLAMMATION
of
Hindawi Publishing Corporationhttp://www.hindawi.com Volume 2014
Behavioural Neurology
EndocrinologyInternational Journal of
Hindawi Publishing Corporationhttp://www.hindawi.com Volume 2014
Hindawi Publishing Corporationhttp://www.hindawi.com Volume 2014
Disease Markers
Hindawi Publishing Corporationhttp://www.hindawi.com Volume 2014
BioMed Research International
OncologyJournal of
Hindawi Publishing Corporationhttp://www.hindawi.com Volume 2014
Hindawi Publishing Corporationhttp://www.hindawi.com Volume 2014
Oxidative Medicine and Cellular Longevity
Hindawi Publishing Corporationhttp://www.hindawi.com Volume 2014
PPAR Research
The Scientific World JournalHindawi Publishing Corporation http://www.hindawi.com Volume 2014
Immunology ResearchHindawi Publishing Corporationhttp://www.hindawi.com Volume 2014
Journal of
ObesityJournal of
Hindawi Publishing Corporationhttp://www.hindawi.com Volume 2014
Hindawi Publishing Corporationhttp://www.hindawi.com Volume 2014
Computational and Mathematical Methods in Medicine
OphthalmologyJournal of
Hindawi Publishing Corporationhttp://www.hindawi.com Volume 2014
Diabetes ResearchJournal of
Hindawi Publishing Corporationhttp://www.hindawi.com Volume 2014
Hindawi Publishing Corporationhttp://www.hindawi.com Volume 2014
Research and TreatmentAIDS
Hindawi Publishing Corporationhttp://www.hindawi.com Volume 2014
Gastroenterology Research and Practice
Hindawi Publishing Corporationhttp://www.hindawi.com Volume 2014
Parkinson’s Disease
Evidence-Based Complementary and Alternative Medicine
Volume 2014Hindawi Publishing Corporationhttp://www.hindawi.com