Embed Size (px)
Citation preview
Govern with Confidence
Effective Financial Management For Schools
AISSA Leadership Program
Immanuel College32 Morphett Road Adelaide – 8 June 2011
Govern with Confidence
John Somerset
Qualifications Graduate Diploma Company Directors Course
Certificate IV in Workplace Training and Assessment
Graduate Diploma in Applied Finance and Investment
Professional Year Institute of Chartered Accountants
Bachelor of Commerce University of Queensland
Accreditations/Memberships Graduate - Australian Institute of Company Directors
Fellow - Financial Services Institute of Australasia
Member - Institute of Chartered Accountants in Australia
Member - Performance Measurement Association (UK)
Core Expertise Chartered accounting – 25 years Ex Price Waterhouse Coopers, Hall Chadwick/William Buck Broad accounting, taxation, business advisor Benchmarking and financial analysis of schools (16 years). Corporate governance of schools. Financial risk management and performance improvement Budgeting ,board reporting models, on-line tools.
Appointments Council and Finance - St Paul’s School (2000 – 2008) Chairman - St Paul’s School Foundation (2006 to 2008) Director - St Stephen’s College Ltd (2004 - ) Chair Finance Committee – St Stephen’s College Risk Assurance Committee – St Stephen’s College Treasurer –Independent Schools Queensland (2001 – 2011)
President –Independent Schools Queensland (2011 - )
Director – Independent Schools Council of Australia
Govern with Confidence
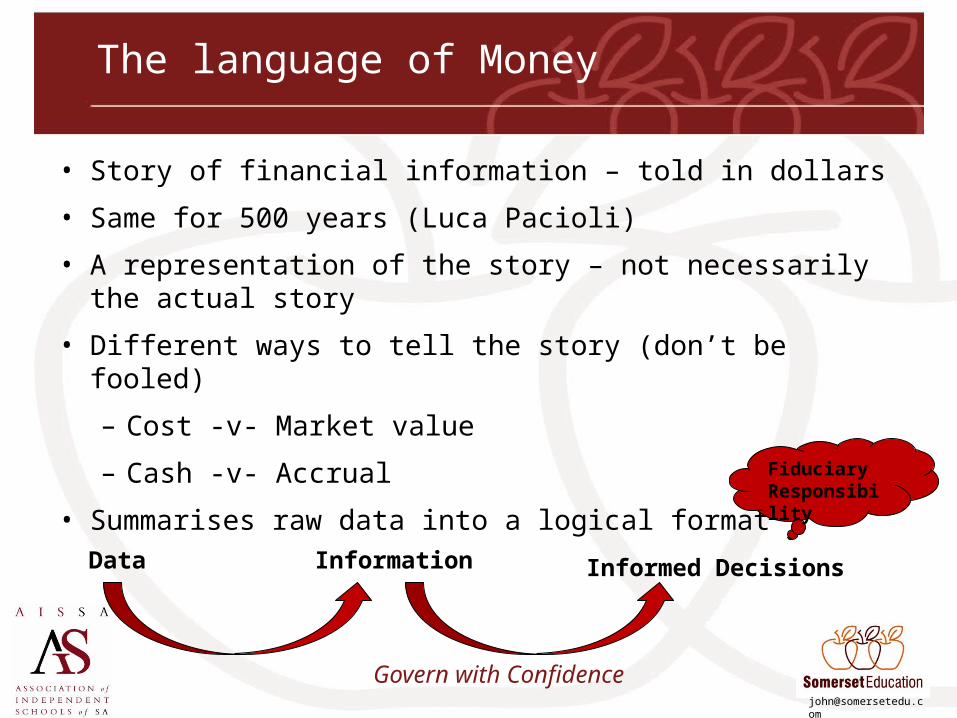
The language of Money
• Story of financial information – told in dollars
• Same for 500 years (Luca Pacioli)
• A representation of the story – not necessarily the actual story
• Different ways to tell the story (don’t be fooled)
– Cost -v- Market value
– Cash -v- Accrual
• Summarises raw data into a logical formatData Information Informed Decisions
Fiduciary Responsibility
Govern with Confidence
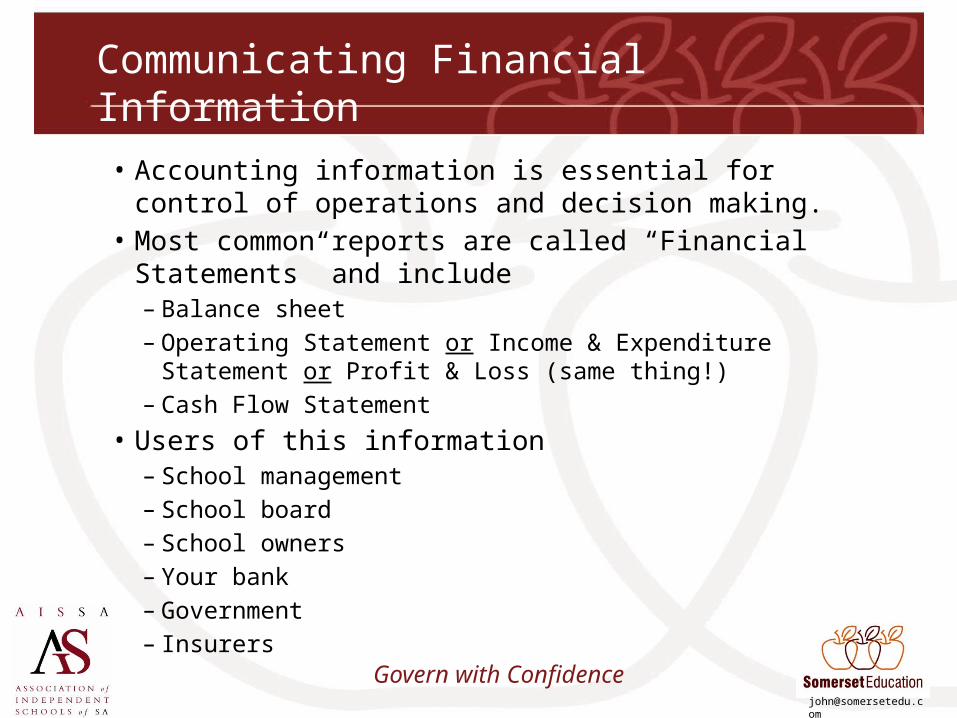
Communicating Financial Information
• Accounting information is essential for control of operations and decision making.
• Most common reports are called “Financial Statements” and include– Balance sheet– Operating Statement or Income & Expenditure Statement or Profit &
Loss (same thing!)– Cash Flow Statement
• Users of this information– School management– School board – School owners– Your bank– Government– Insurers

Govern with Confidence
The Players on the Field
Balance Sheet Your World
Income StatementWhere you play the game with the outside World
Govern with Confidence
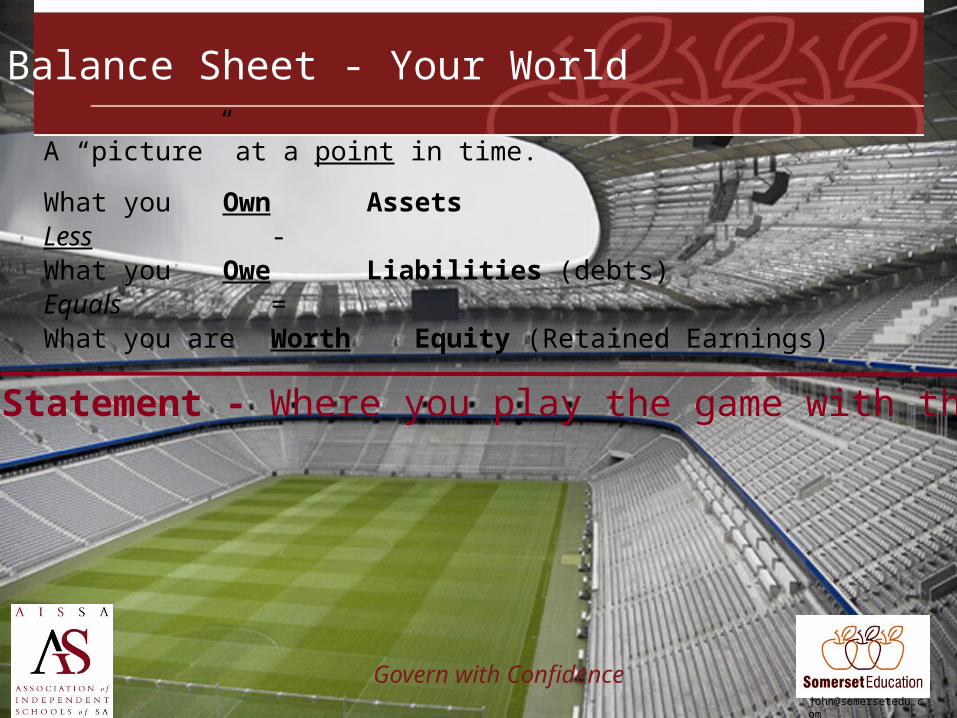
Balance Sheet - Your World
Income Statement - Where you play the game with the World
A “picture” at a point in time.
What you Own AssetsLess -What you Owe Liabilities (debts)Equals =What you are Worth Equity (Retained Earnings)
Govern with Confidence
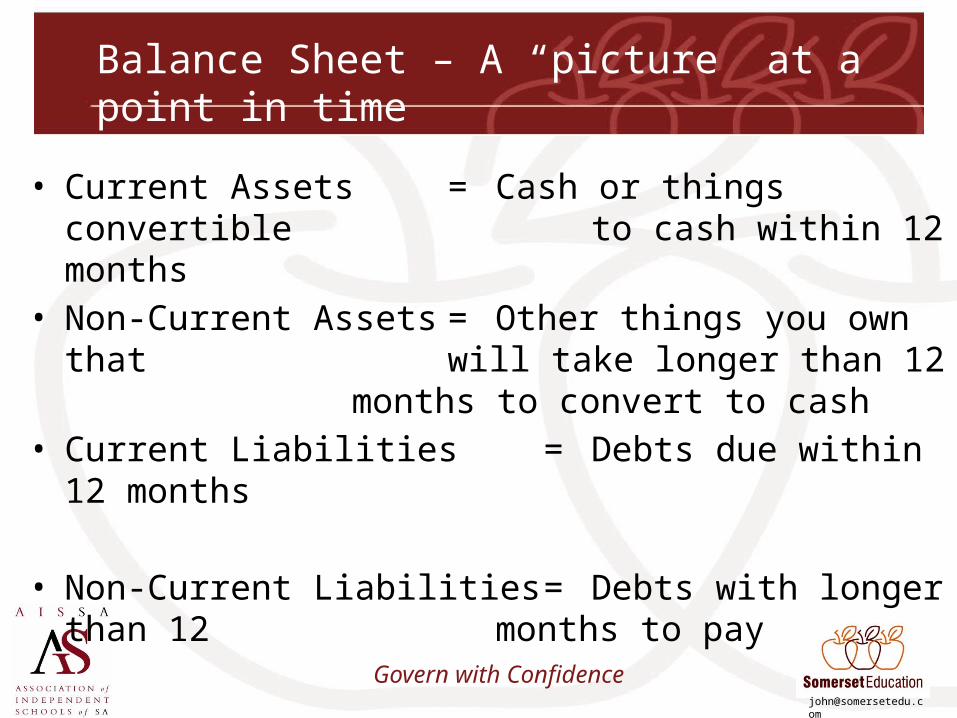
Balance Sheet – A “picture” at a point in time
• Current Assets = Cash or things convertible to cash within 12 months
• Non-Current Assets = Other things you own that will take longer than 12 months to convert to cash
• Current Liabilities = Debts due within 12 months
• Non-Current Liabilities = Debts with longer than 12 months to pay
Govern with Confidence
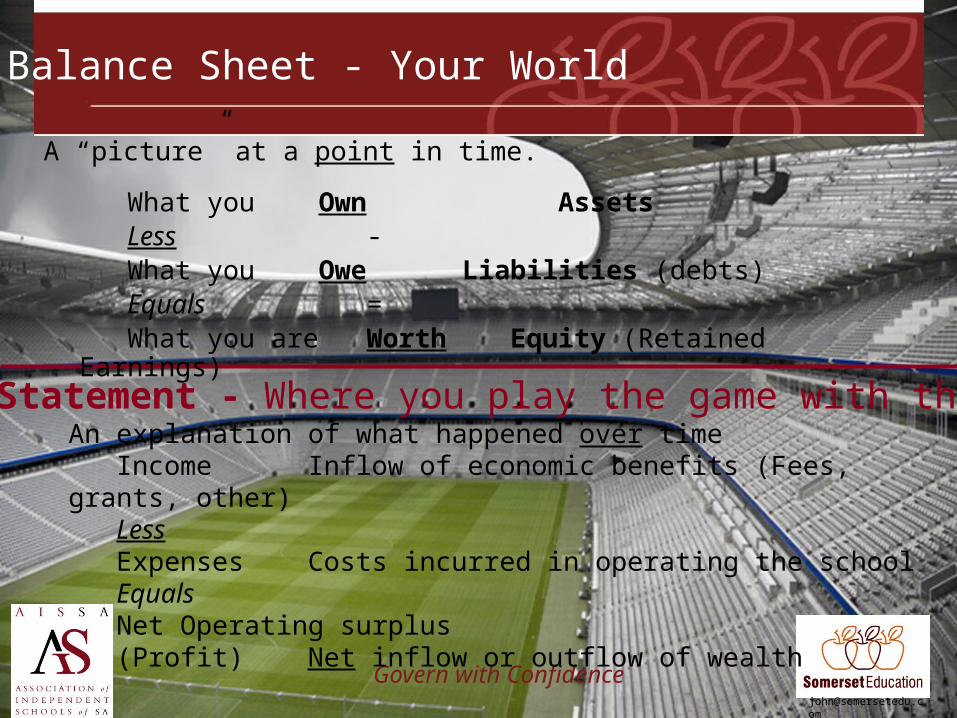
Balance Sheet - Your World
Income Statement - Where you play the game with the World
A “picture” at a point in time.
What you Own AssetsLess -What you Owe Liabilities (debts)Equals =What you are Worth Equity (Retained Earnings)
An explanation of what happened over timeIncome Inflow of economic benefits (Fees, grants, other) LessExpenses Costs incurred in operating the schoolEqualsNet Operating surplus (Profit) Net inflow or outflow of wealth
Govern with Confidence
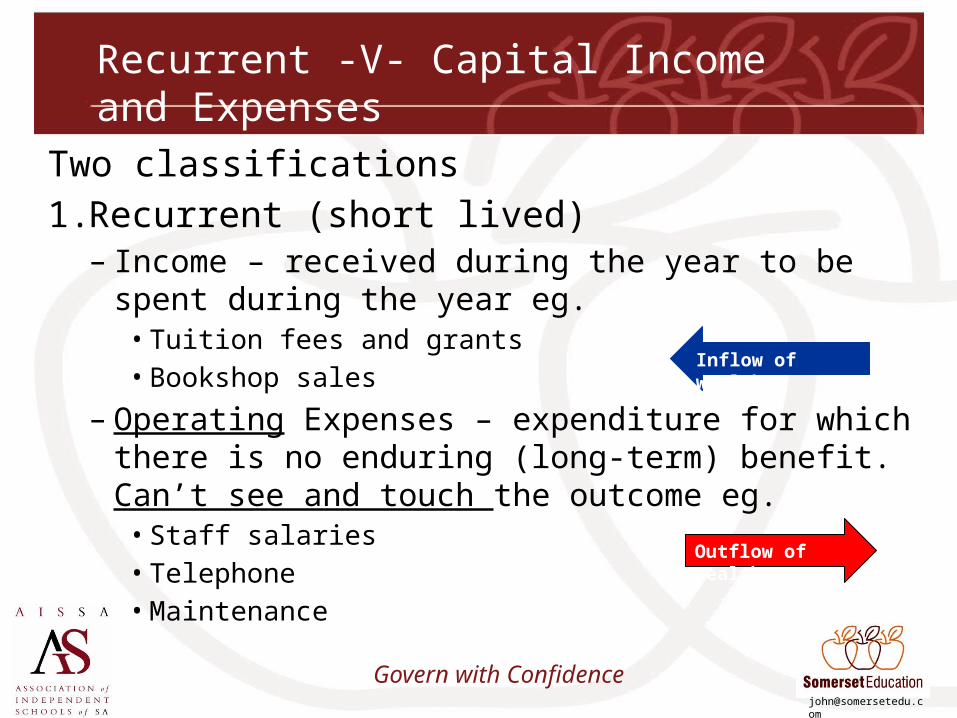
Recurrent -V- Capital Income and Expenses
Two classifications1. Recurrent (short lived)
– Income – received during the year to be spent during the year eg.
• Tuition fees and grants• Bookshop sales
– Operating Expenses – expenditure for which there is no enduring (long-term) benefit. Can’t see and touch the outcome eg.
• Staff salaries• Telephone• Maintenance
Outflow of wealth
Inflow of wealth
Govern with Confidence
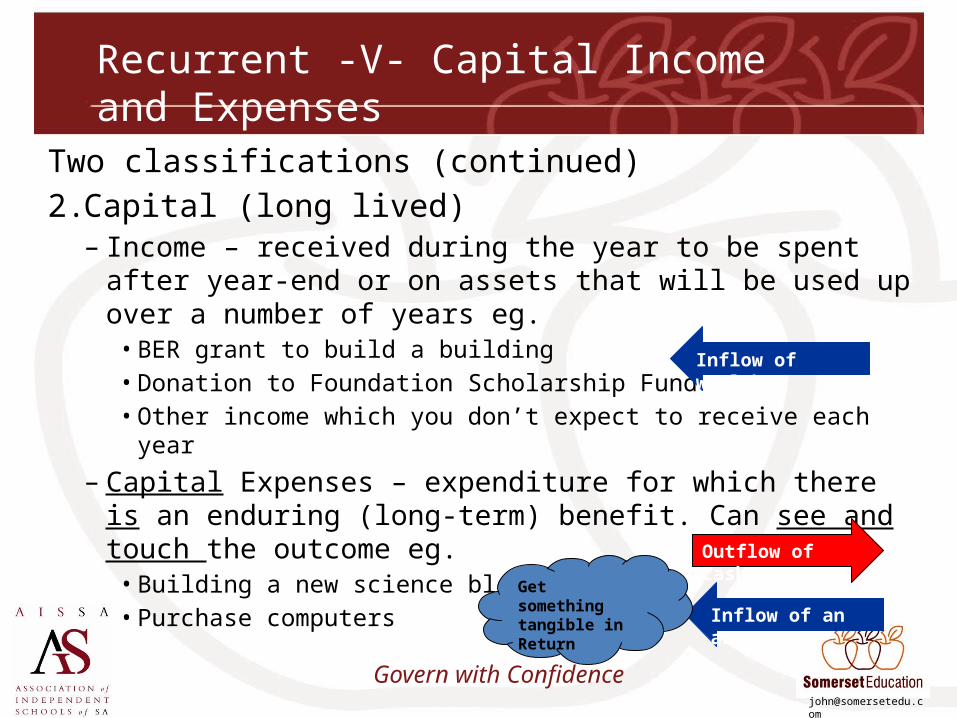
Recurrent -V- Capital Income and Expenses
Two classifications (continued)2. Capital (long lived)
– Income – received during the year to be spent after year-end or on assets that will be used up over a number of years eg.
• BER grant to build a building• Donation to Foundation Scholarship Fund• Other income which you don’t expect to receive each year
– Capital Expenses – expenditure for which there is an enduring (long-term) benefit. Can see and touch the outcome eg.
• Building a new science block• Purchase computers
Inflow of wealth
Inflow of an asset
Outflow of cash
Get something tangible in Return
Govern with Confidence
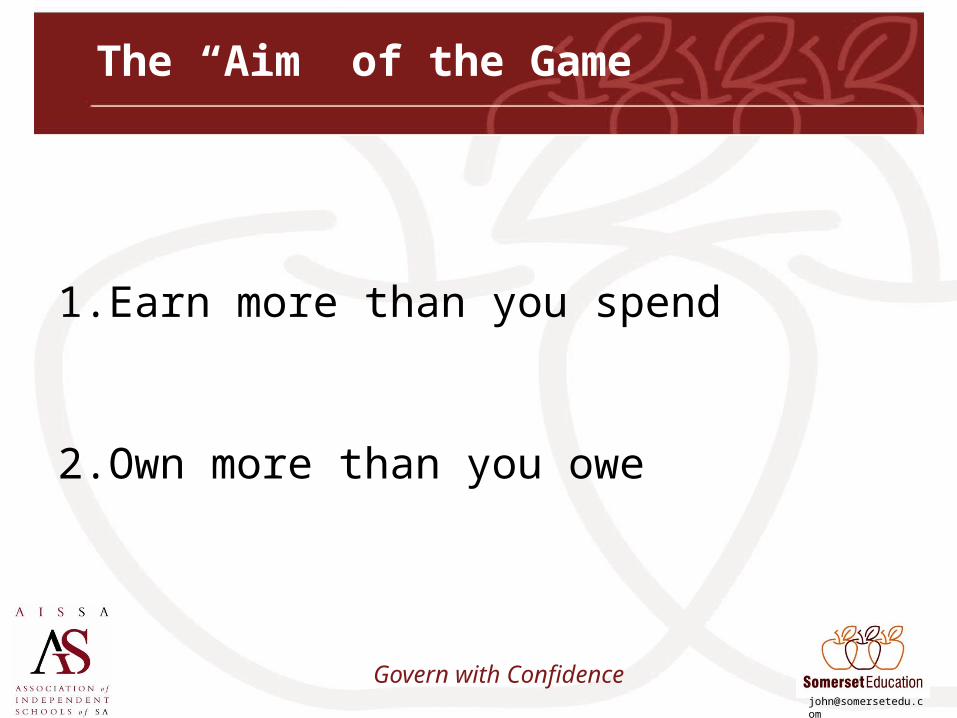
The “Aim” of the Game
1. Earn more than you spend
2. Own more than you owe
Govern with Confidence
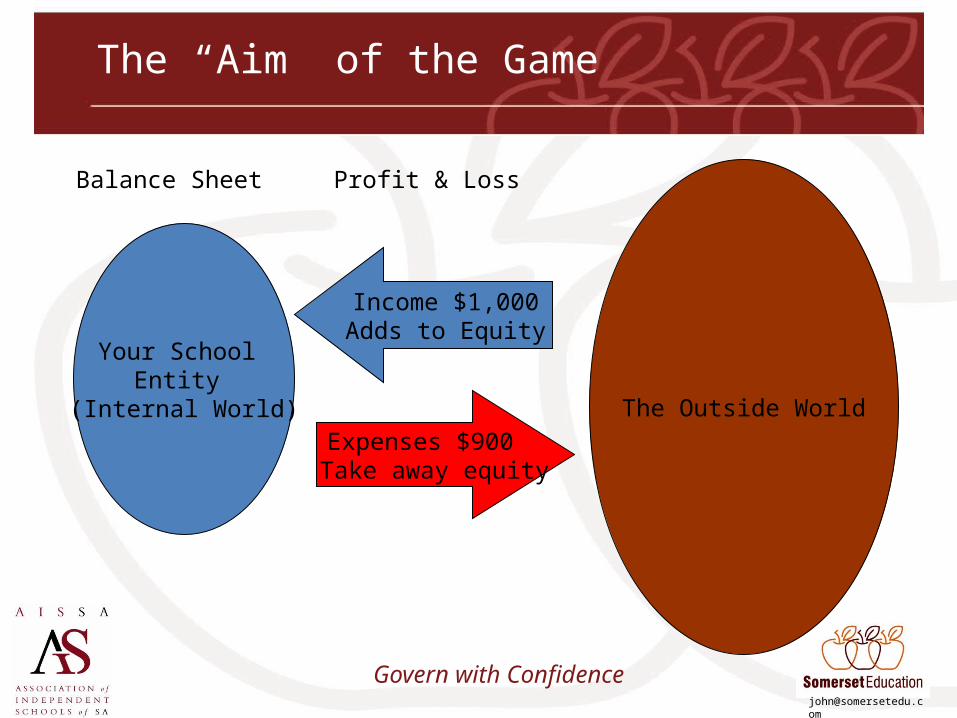
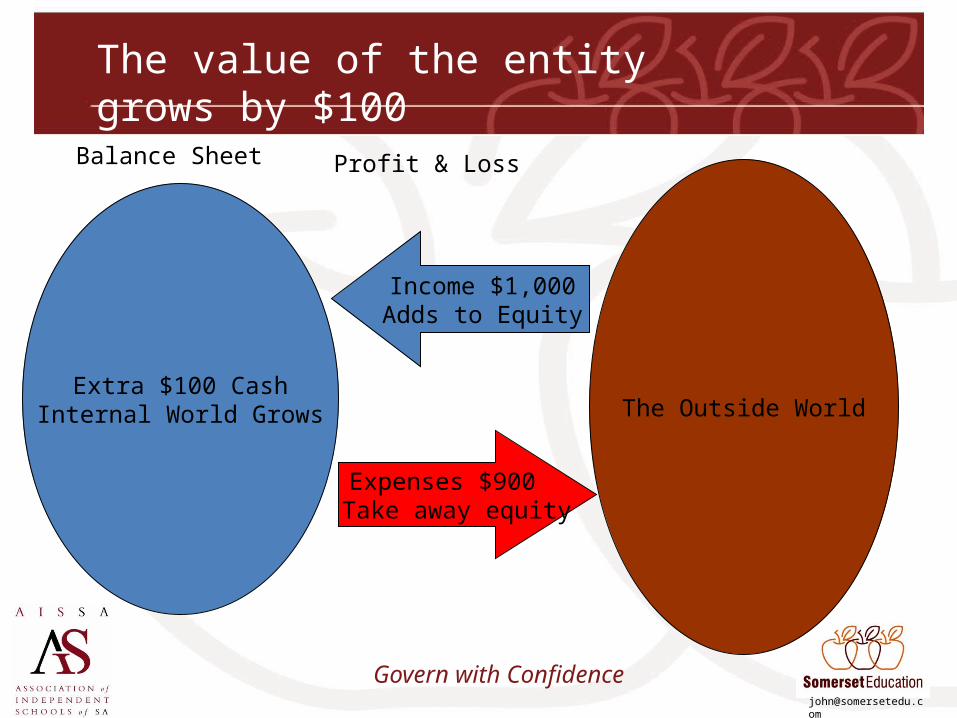
The “Aim” of the Game
Your School Entity
(Internal World)
Income $1,000Adds to Equity
Expenses $900 Take away equity
The Outside World
Balance Sheet Profit & Loss
Govern with Confidence
The value of the entity grows by $100
Extra $100 CashInternal World Grows The Outside World
Balance Sheet Profit & Loss
Income $1,000Adds to Equity
Expenses $900 Take away equity
Govern with Confidence
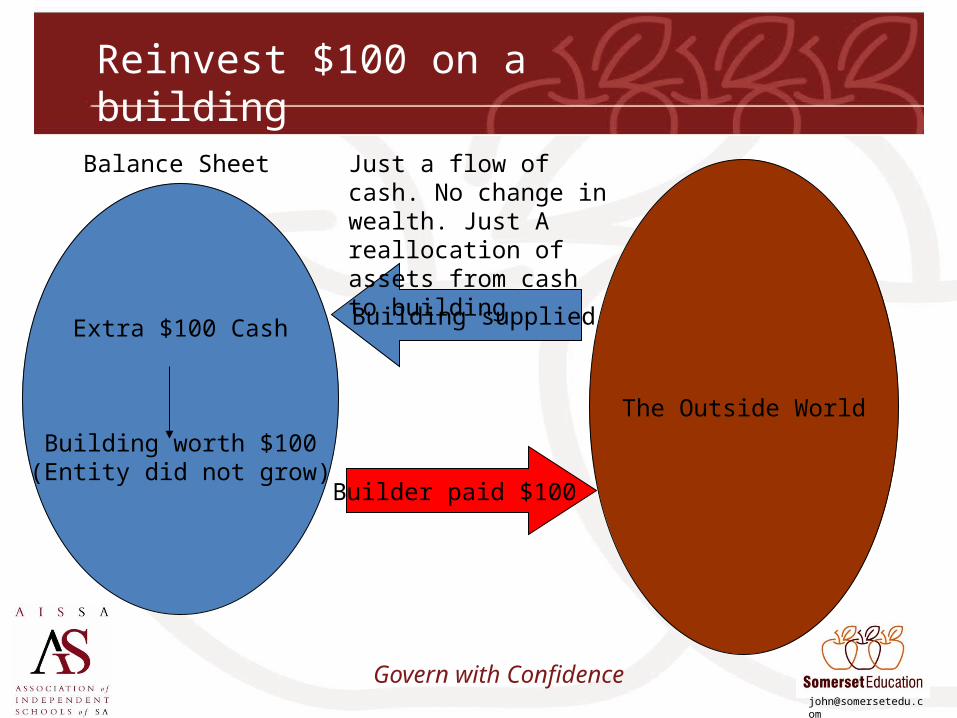
Reinvest $100 on a building
Extra $100 Cash
Building worth $100(Entity did not grow)
Builder paid $100
Building supplied
The Outside World
Balance Sheet Just a flow of cash. No change in wealth. Just A reallocation of assets from cash to building

Govern with Confidence
How are the Balance Sheet and Income Statement Related?
• The profit (surplus) or loss (deficit) incurred for the year is added to or subtracted from your Equity (what you are worth).
• What you are worth (your equity), is affected by the profit you make, or loss incurred, by trading with the rest of the World.
• Your “World” is affected by the skill of your transactions Have you brought wealth in or have you lost it?
Govern with Confidence
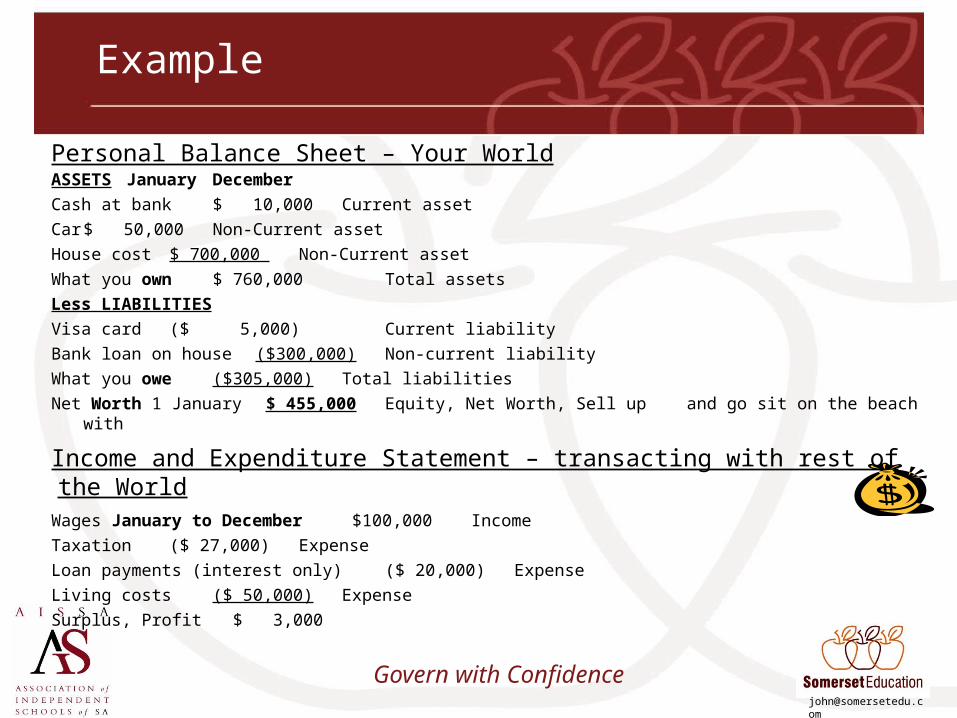
Example
Personal Balance Sheet – Your WorldASSETS January December Cash at bank $ 10,000 Current assetCar $ 50,000 Non-Current assetHouse cost $ 700,000 Non-Current assetWhat you own $ 760,000 Total assetsLess LIABILITIESVisa card ($ 5,000) Current liabilityBank loan on house ($300,000) Non-current liabilityWhat you owe ($305,000) Total liabilitiesNet Worth 1 January $ 455,000 Equity, Net Worth, Sell up
and go sit on the beach with
Income and Expenditure Statement – transacting with rest of the WorldWages January to December $100,000 IncomeTaxation ($ 27,000) ExpenseLoan payments (interest only) ($ 20,000) ExpenseLiving costs ($ 50,000) ExpenseSurplus, Profit $ 3,000
Govern with Confidence
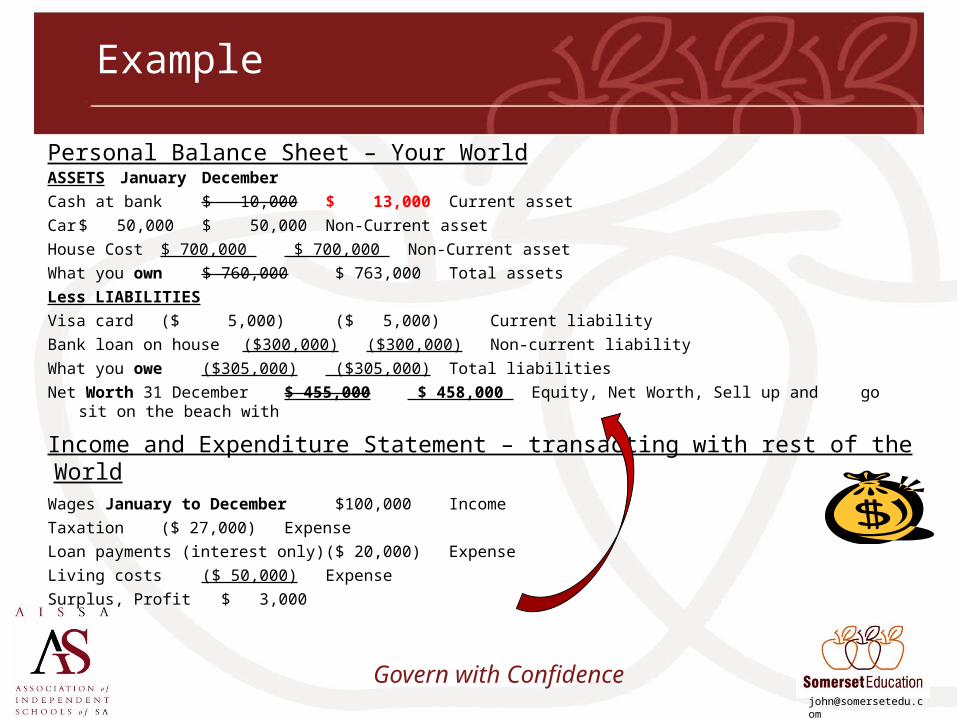
Example
Personal Balance Sheet – Your WorldASSETS January December Cash at bank $ 10,000 $ 13,000 Current assetCar $ 50,000 $ 50,000 Non-Current assetHouse Cost $ 700,000 $ 700,000 Non-Current assetWhat you own $ 760,000 $ 763,000 Total assetsLess LIABILITIESVisa card ($ 5,000) ($ 5,000) Current liabilityBank loan on house ($300,000) ($300,000) Non-current liabilityWhat you owe ($305,000) ($305,000) Total liabilitiesNet Worth 31 December $ 455,000 $ 458,000 Equity, Net Worth, Sell up
and go sit on the beach with
Income and Expenditure Statement – transacting with rest of the WorldWages January to December $100,000 IncomeTaxation ($ 27,000) ExpenseLoan payments (interest only) ($ 20,000) ExpenseLiving costs ($ 50,000) ExpenseSurplus, Profit $ 3,000
Govern with Confidence
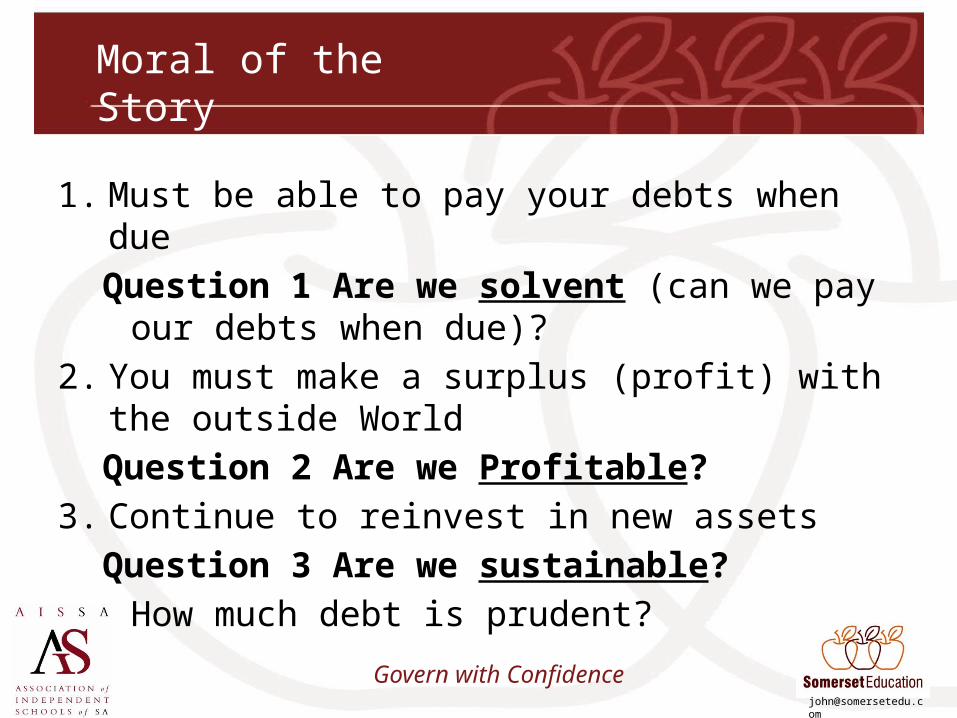
Moral of the Story
1. Must be able to pay your debts when dueQuestion 1 Are we solvent (can we pay our debts
when due)?2. You must make a surplus (profit) with the outside
WorldQuestion 2 Are we Profitable?
3. Continue to reinvest in new assetsQuestion 3 Are we sustainable?
How much debt is prudent?
Govern with Confidence
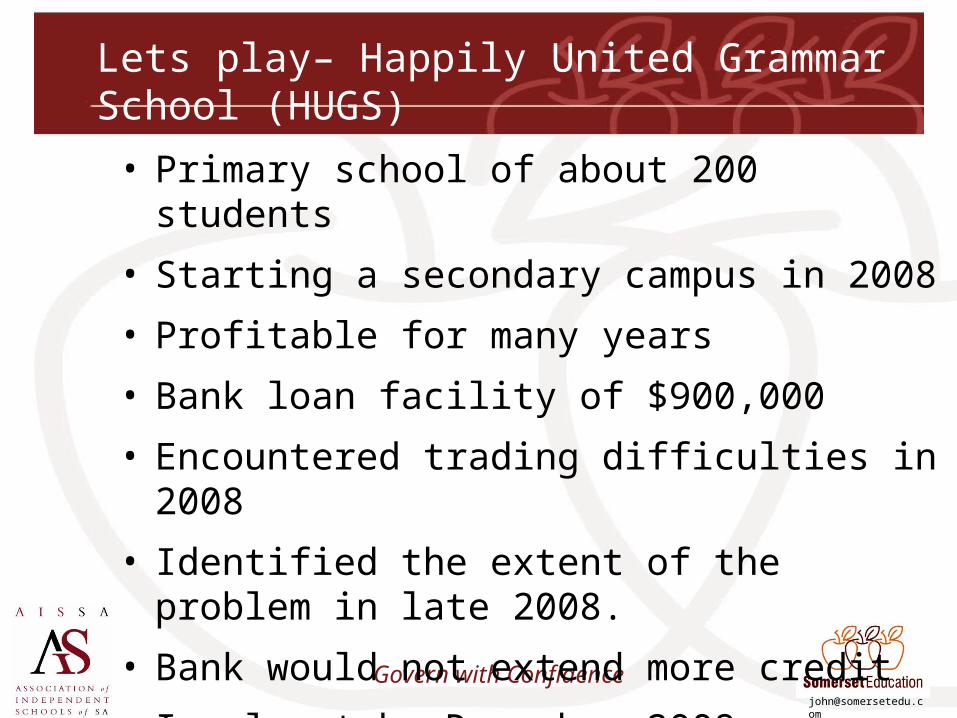
Lets play– Happily United Grammar School (HUGS)
• Primary school of about 200 students
• Starting a secondary campus in 2008
• Profitable for many years
• Bank loan facility of $900,000
• Encountered trading difficulties in 2008
• Identified the extent of the problem in late 2008.
• Bank would not extend more credit
• Insolvent by December 2008
Govern with Confidence
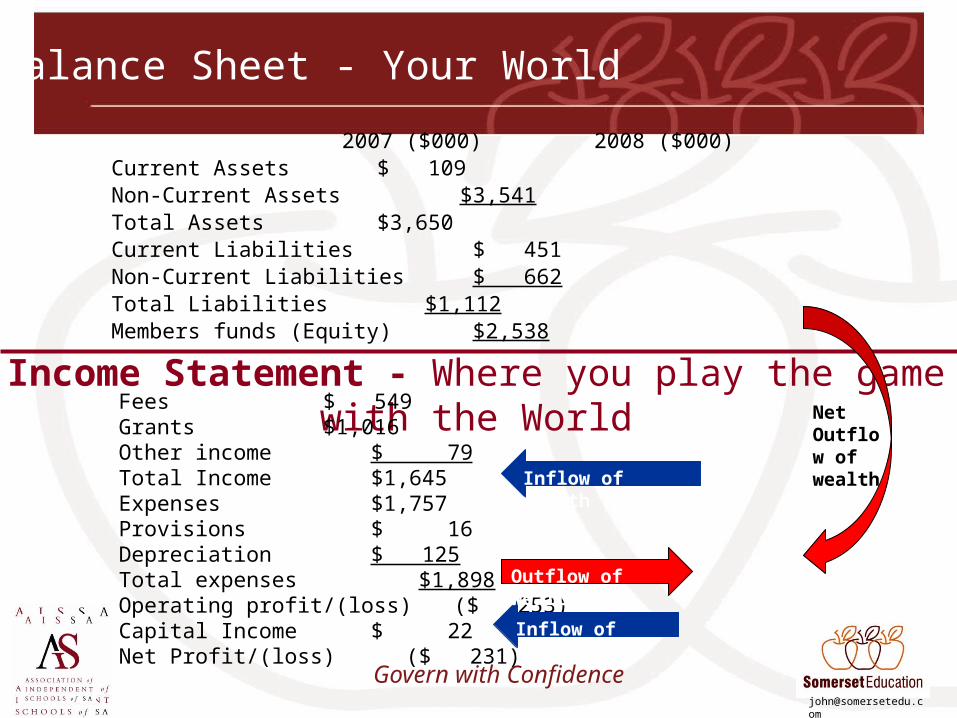
Balance Sheet - Your World
Income Statement - Where you play the game with the World
2007 ($000) 2008 ($000)Current Assets $ 109Non-Current Assets $3,541Total Assets $3,650Current Liabilities $ 451Non-Current Liabilities $ 662Total Liabilities $1,112Members funds (Equity) $2,538
Fees $ 549Grants $1,016Other income $ 79Total Income $1,645Expenses $1,757Provisions $ 16Depreciation $ 125Total expenses $1,898Operating profit/(loss) ($ 253)Capital Income $ 22Net Profit/(loss) ($ 231)
Inflow of wealth
Inflow of wealth
Outflow of wealth
Net Outflow of wealth
Govern with Confidence
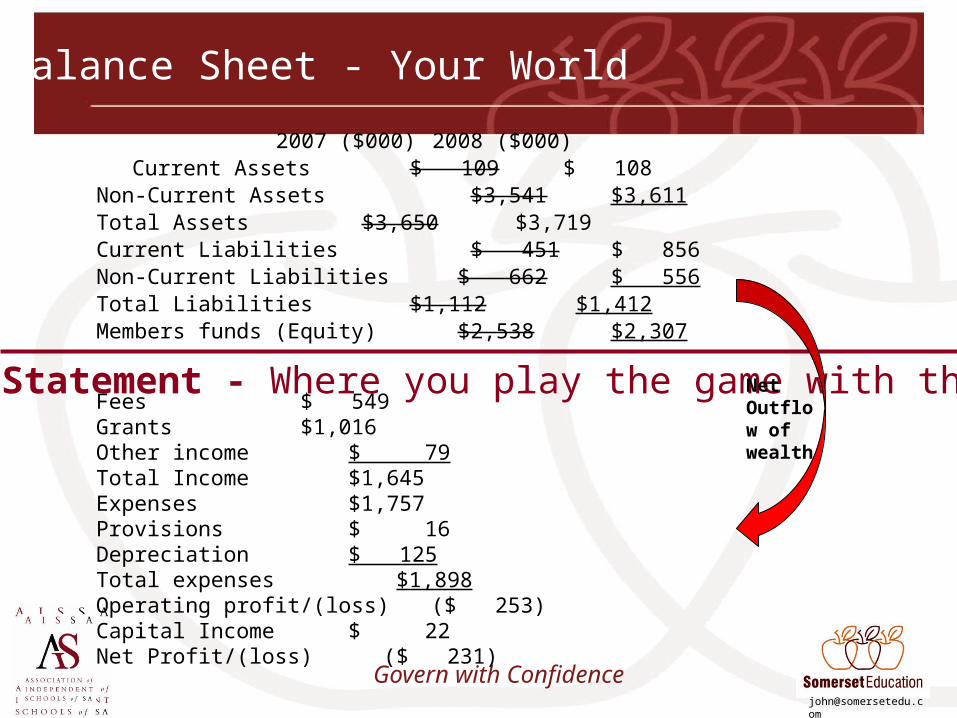
Balance Sheet - Your World
Income Statement - Where you play the game with the World
2007 ($000) 2008 ($000)Current Assets $ 109 $ 108
Non-Current Assets $3,541 $3,611Total Assets $3,650 $3,719Current Liabilities $ 451 $ 856Non-Current Liabilities $ 662 $ 556Total Liabilities $1,112 $1,412Members funds (Equity) $2,538 $2,307
Fees $ 549Grants $1,016Other income $ 79Total Income $1,645Expenses $1,757Provisions $ 16Depreciation $ 125Total expenses $1,898Operating profit/(loss) ($ 253)Capital Income $ 22Net Profit/(loss) ($ 231)
Net Outflow of wealth
Govern with Confidence
Matching Principle
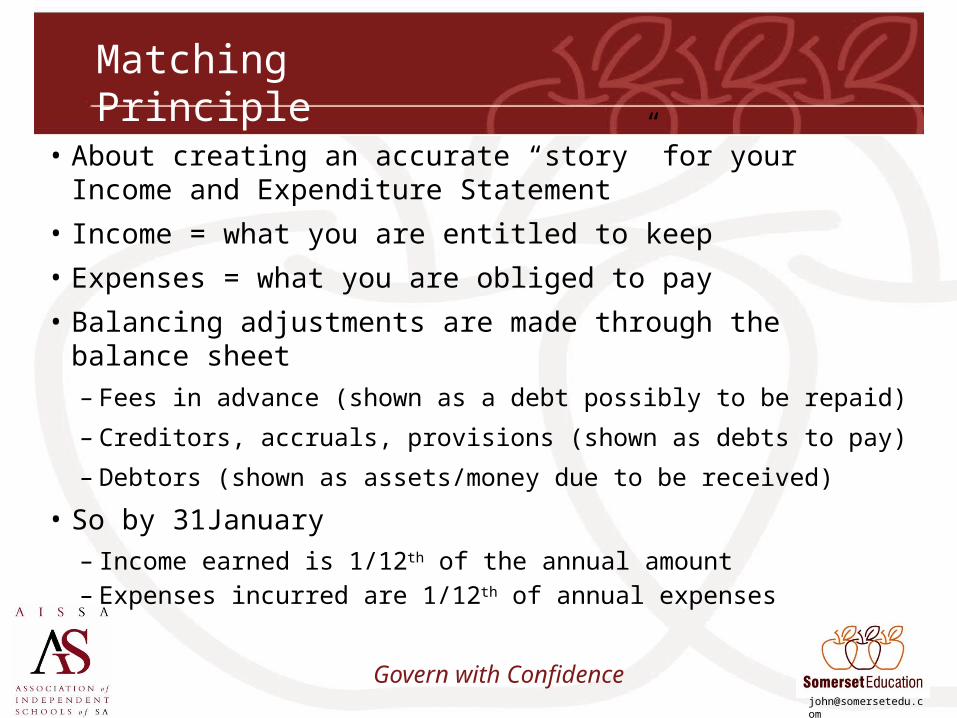
• About creating an accurate “story” for your Income and Expenditure Statement
• Income = what you are entitled to keep• Expenses = what you are obliged to pay• Balancing adjustments are made through the balance sheet
– Fees in advance (shown as a debt possibly to be repaid)
– Creditors, accruals, provisions (shown as debts to pay)
– Debtors (shown as assets/money due to be received)
• So by 31January – Income earned is 1/12th of the annual amount– Expenses incurred are 1/12th of annual expenses
Govern with Confidence
Cash Basis accounting – An Example
• Recognise income when banked and expenses when paid
Govern with Confidence
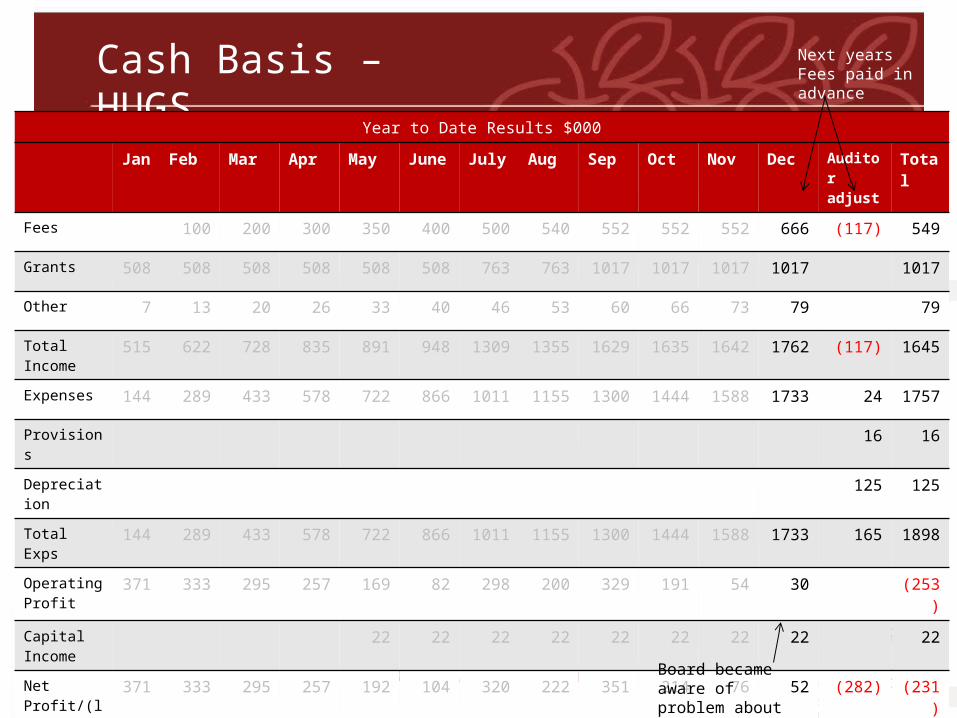
Cash Basis – HUGSYear to Date Results $000
Jan Feb Mar Apr May June July Aug Sep Oct Nov Dec Auditor adjust
Total
Fees 100 200 300 350 400 500 540 552 552 552 666 (117) 549
Grants 508 508 508 508 508 508 763 763 1017 1017 1017 1017 1017
Other 7 13 20 26 33 40 46 53 60 66 73 79 79
Total Income 515 622 728 835 891 948 1309 1355 1629 1635 1642 1762 (117) 1645
Expenses 144 289 433 578 722 866 1011 1155 1300 1444 1588 1733 24 1757
Provisions 16 16
Depreciation 125 125
Total Exps 144 289 433 578 722 866 1011 1155 1300 1444 1588 1733 165 1898
Operating Profit
371 333 295 257 169 82 298 200 329 191 54 30 (253)
Capital Income
22 22 22 22 22 22 22 22 22
Net Profit/(loss)
371 333 295 257 192 104 320 222 351 214 76 52 (282) (231)
Next years Fees paid in advance
Board became aware of problem about here
Govern with Confidence
Accrual Basis
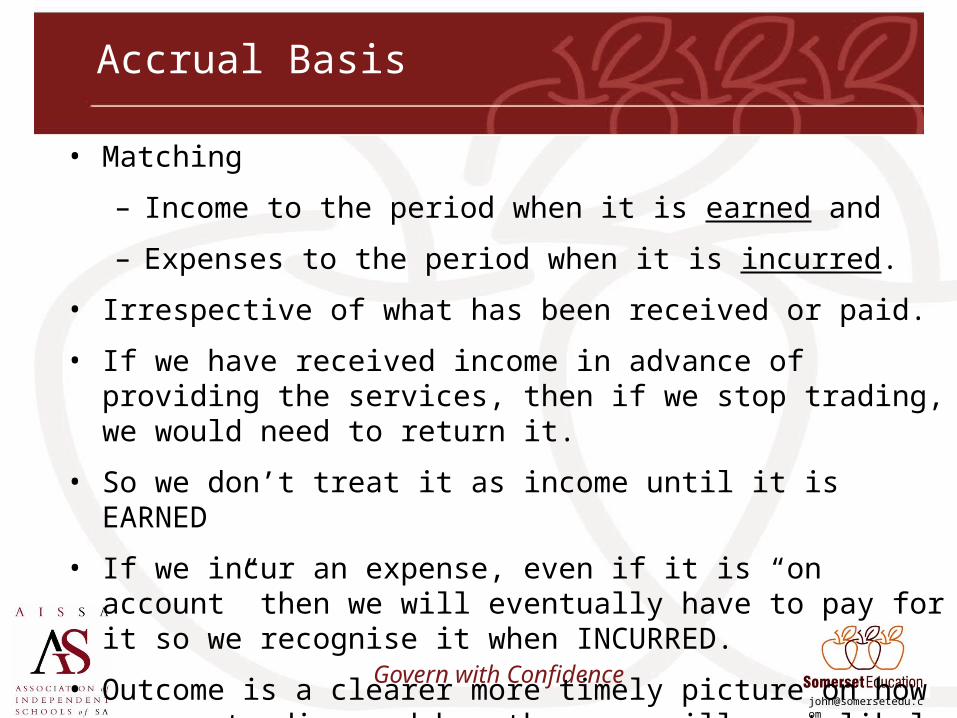
• Matching
– Income to the period when it is earned and
– Expenses to the period when it is incurred.
• Irrespective of what has been received or paid.
• If we have received income in advance of providing the services, then if we stop trading, we would need to return it.
• So we don’t treat it as income until it is EARNED
• If we incur an expense, even if it is “on account” then we will eventually have to pay for it so we recognise it when INCURRED.
• Outcome is a clearer more timely picture on how we are trading and how the year will most likely unfold.
Govern with Confidence
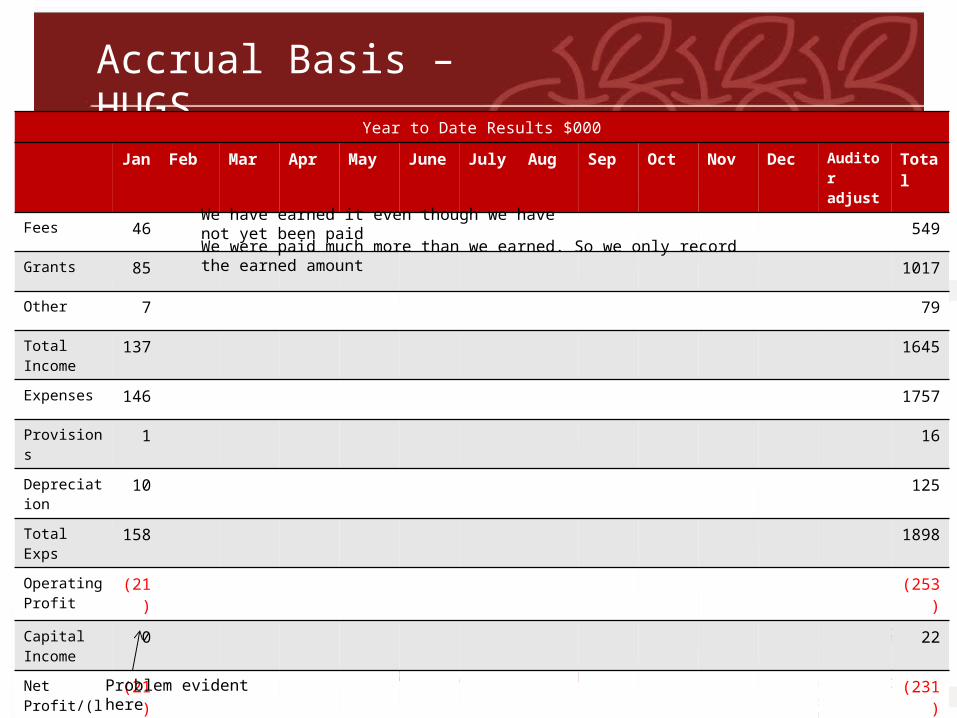
Accrual Basis – HUGSYear to Date Results $000
Jan Feb Mar Apr May June July Aug Sep Oct Nov Dec Auditor adjust
Total
Fees 46 549
Grants 85 1017
Other 7 79
Total Income 137 1645
Expenses 146 1757
Provisions 1 16
Depreciation 10 125
Total Exps 158 1898
Operating Profit
(21) (253)
Capital Income
0 22
Net Profit/(loss)
(21) (231)
Problem evident here
We have earned it even though we have not yet been paidWe were paid much more than we earned. So we only record the earned amount
Govern with Confidence
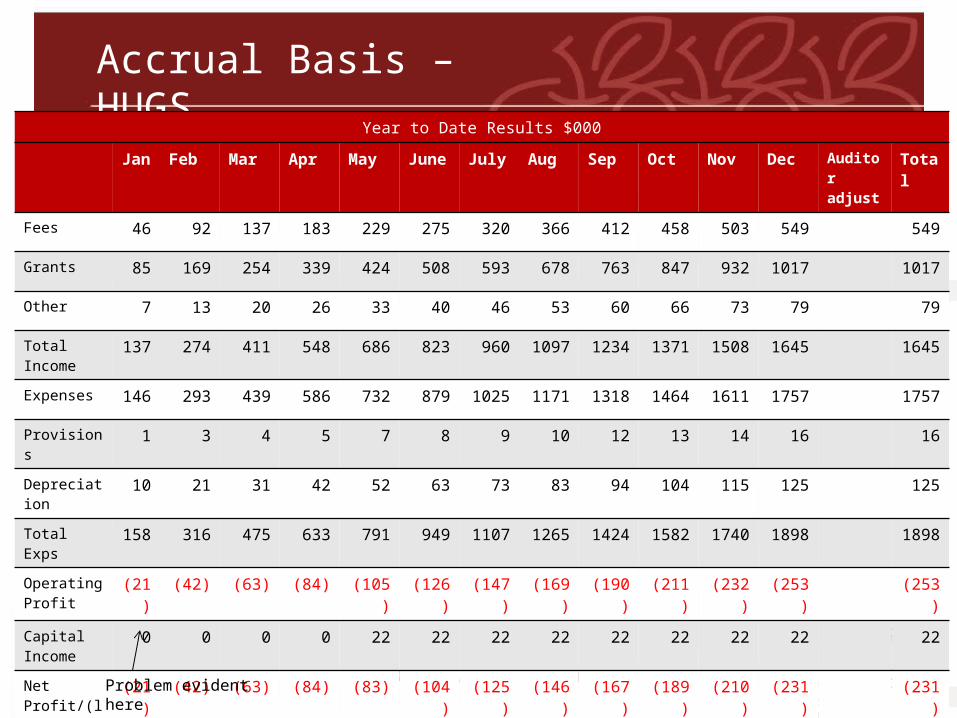
Accrual Basis – HUGSYear to Date Results $000
Jan Feb Mar Apr May June July Aug Sep Oct Nov Dec Auditor adjust
Total
Fees 46 92 137 183 229 275 320 366 412 458 503 549 549
Grants 85 169 254 339 424 508 593 678 763 847 932 1017 1017
Other 7 13 20 26 33 40 46 53 60 66 73 79 79
Total Income 137 274 411 548 686 823 960 1097 1234 1371 1508 1645 1645
Expenses 146 293 439 586 732 879 1025 1171 1318 1464 1611 1757 1757
Provisions 1 3 4 5 7 8 9 10 12 13 14 16 16
Depreciation 10 21 31 42 52 63 73 83 94 104 115 125 125
Total Exps 158 316 475 633 791 949 1107 1265 1424 1582 1740 1898 1898
Operating Profit
(21) (42) (63) (84) (105) (126) (147) (169) (190) (211) (232) (253) (253)
Capital Income
0 0 0 0 22 22 22 22 22 22 22 22 22
Net Profit/(loss)
(21) (42) (63) (84) (83) (104) (125) (146) (167) (189) (210) (231) (231)
Problem evident here
Govern with Confidence
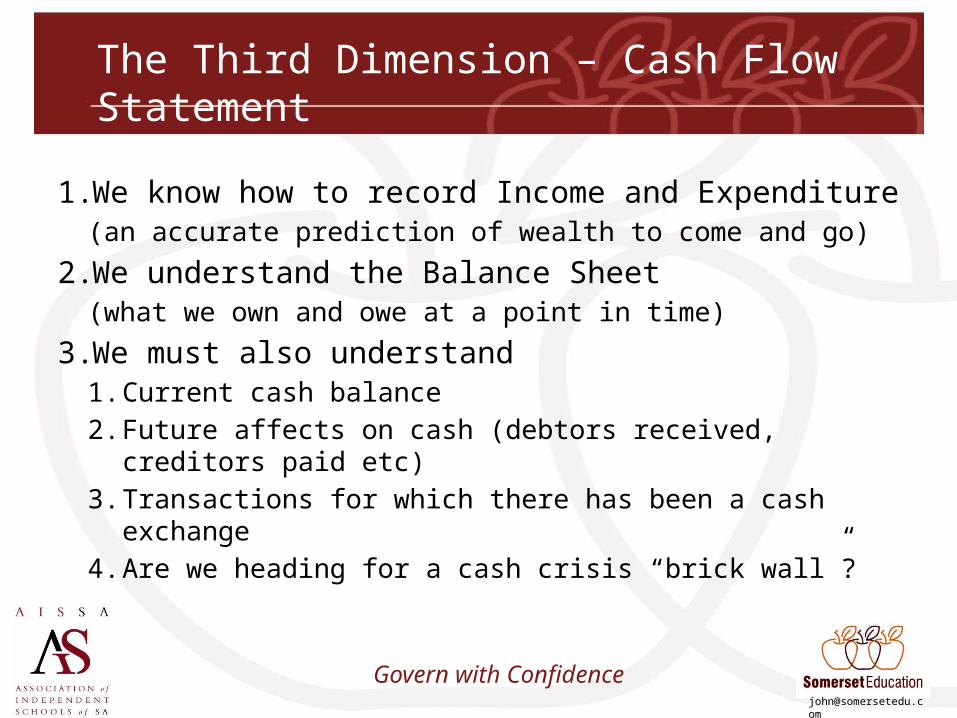
The Third Dimension – Cash Flow Statement
1. We know how to record Income and Expenditure(an accurate prediction of wealth to come and go)
2. We understand the Balance Sheet(what we own and owe at a point in time)
3. We must also understand1. Current cash balance2. Future affects on cash (debtors received, creditors paid
etc)3. Transactions for which there has been a cash exchange4. Are we heading for a cash crisis “brick wall”?

Govern with Confidence
Going Concern Principal
• School must be able to buy and sell its services and plant & equipment in the normal course of trading.
• There must be no pressure to dispose of assets.• School has adequate cash to pay its debts as and
when due.• If it can’t, then it is most likely insolvent and
should cease trading• Must understand what cash is already committed
Govern with Confidence
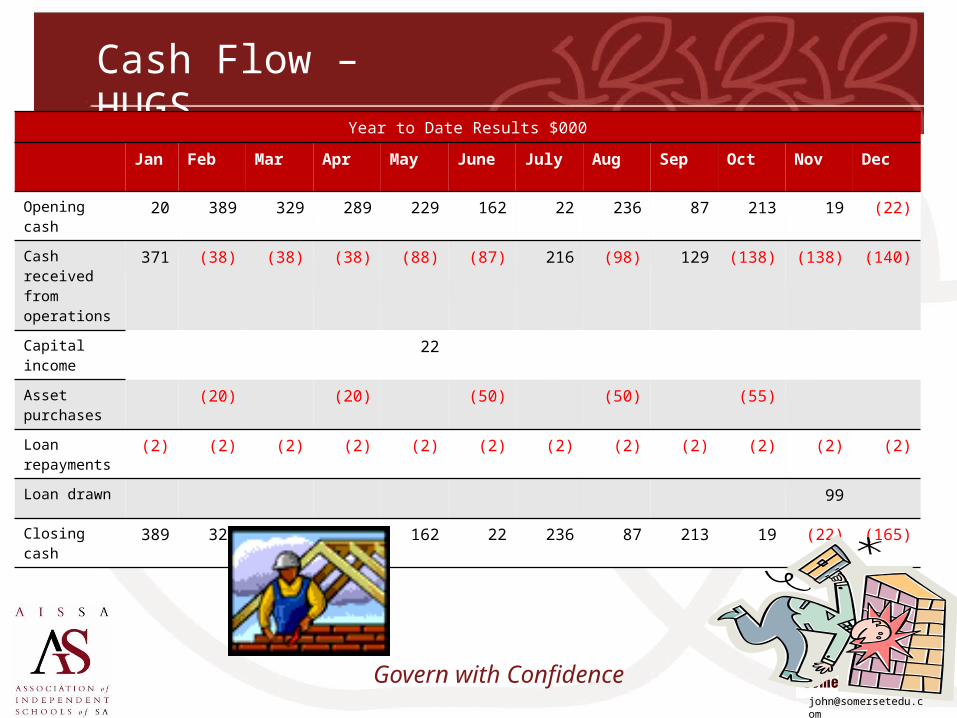
Cash Flow – HUGSYear to Date Results $000
Jan Feb Mar Apr May June July Aug Sep Oct Nov Dec
Opening cash 20 389 329 289 229 162 22 236 87 213 19 (22)
Cash received from operations
371 (38) (38) (38) (88) (87) 216 (98) 129 (138) (138) (140)
Capital income 22
Asset purchases
(20) (20) (50) (50) (55)
Loan repayments
(2) (2) (2) (2) (2) (2) (2) (2) (2) (2) (2) (2)
Loan drawn 99
Closing cash 389 329 289 229 162 22 236 87 213 19 (22) (165)
Govern with Confidence
Rules of Risk Management
1. Understand the risks
2. Quantify the risks
3. Mitigate the risks
“Chance favours only a prepared mind”
Govern with Confidence
Agenda
1. Why schools fail
2. Preventing financial distress
3. Meeting your fiduciary responsibilities
Govern with Confidence
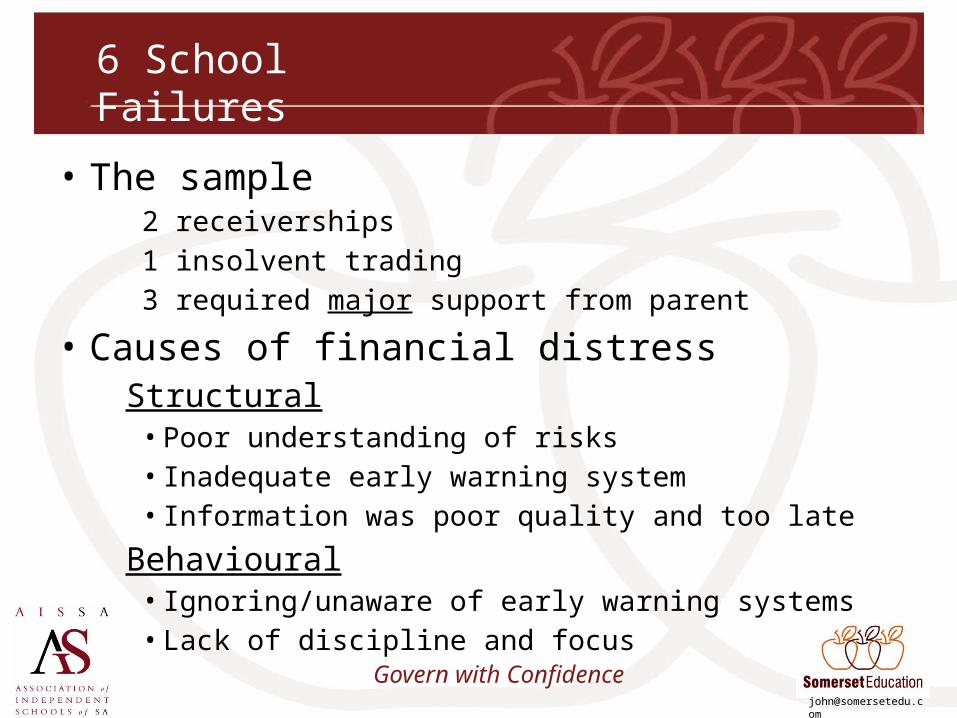
6 School Failures
• The sample2 receiverships1 insolvent trading3 required major support from parent
• Causes of financial distressStructural
• Poor understanding of risks• Inadequate early warning system• Information was poor quality and too late
Behavioural• Ignoring/unaware of early warning systems• Lack of discipline and focus
Govern with Confidence
Secret to success
1. Learn from mistakes2. Preparation
(knowledge of relative performance – past, present, future)
3. Hard work/Discipline
Govern with Confidence
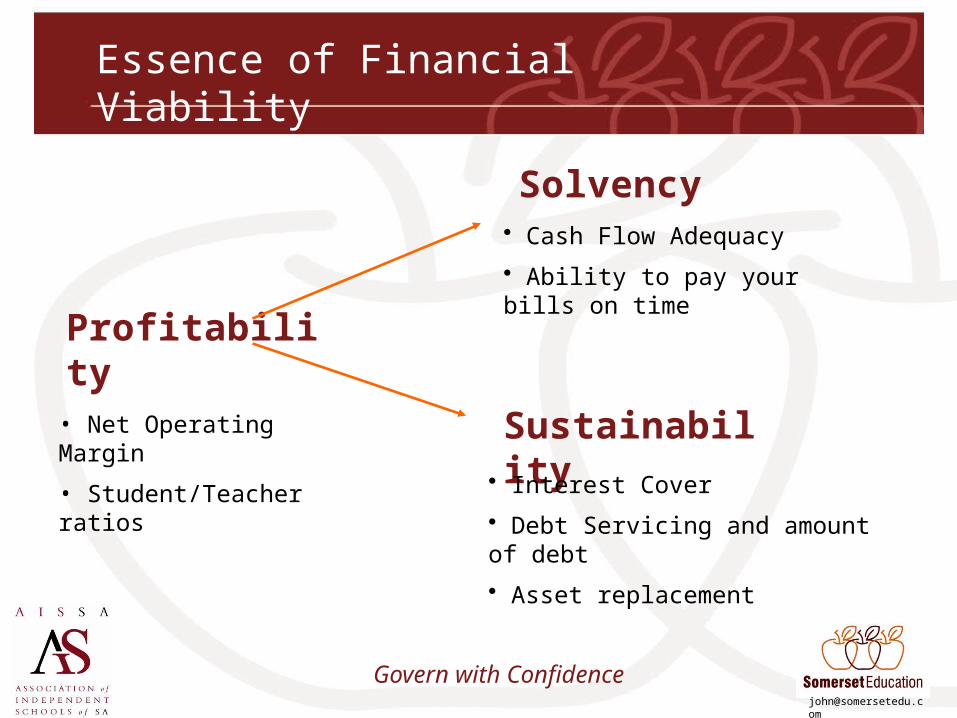
Essence of Financial Viability
Profitability
Sustainability
Solvency
• Net Operating Margin
• Student/Teacher ratios• Interest Cover
• Debt Servicing and amount of debt
• Asset replacement
• Cash Flow Adequacy
• Ability to pay your bills on time
Govern with Confidence
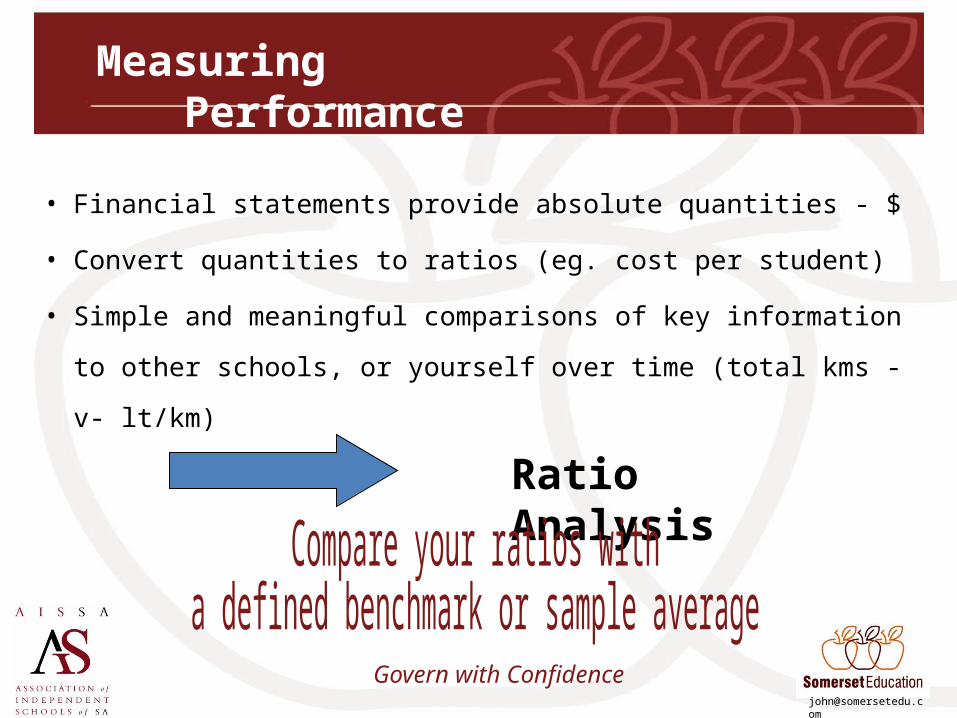
Measuring Performance
• Financial statements provide absolute quantities - $
• Convert quantities to ratios (eg. cost per student)
• Simple and meaningful comparisons of key information to other
schools, or yourself over time (total kms -v- lt/km)
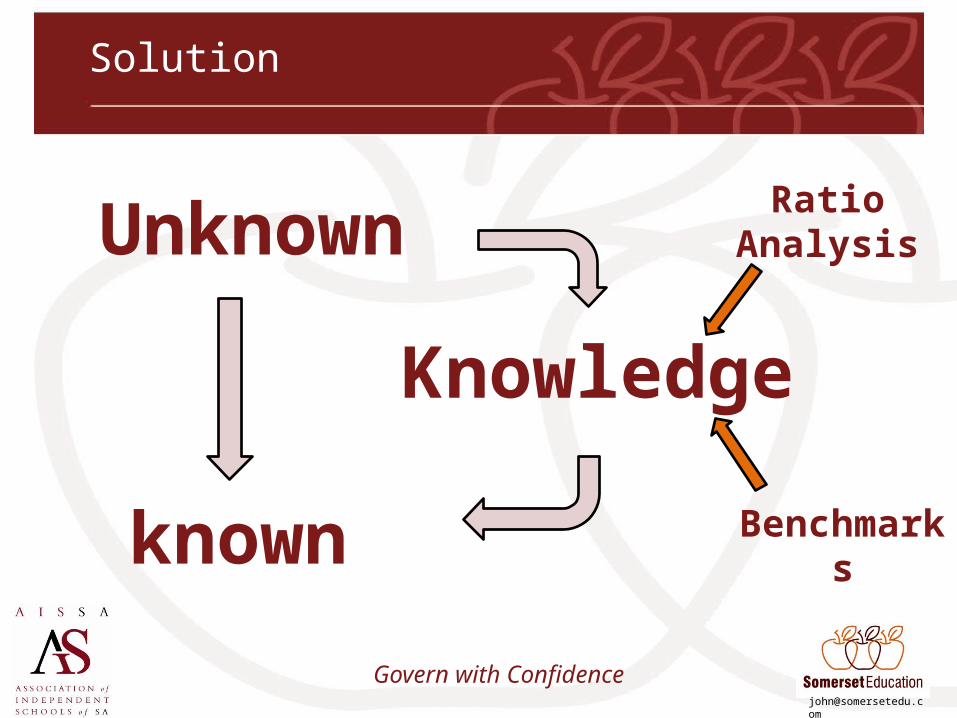
Ratio Analysis
Govern with Confidence
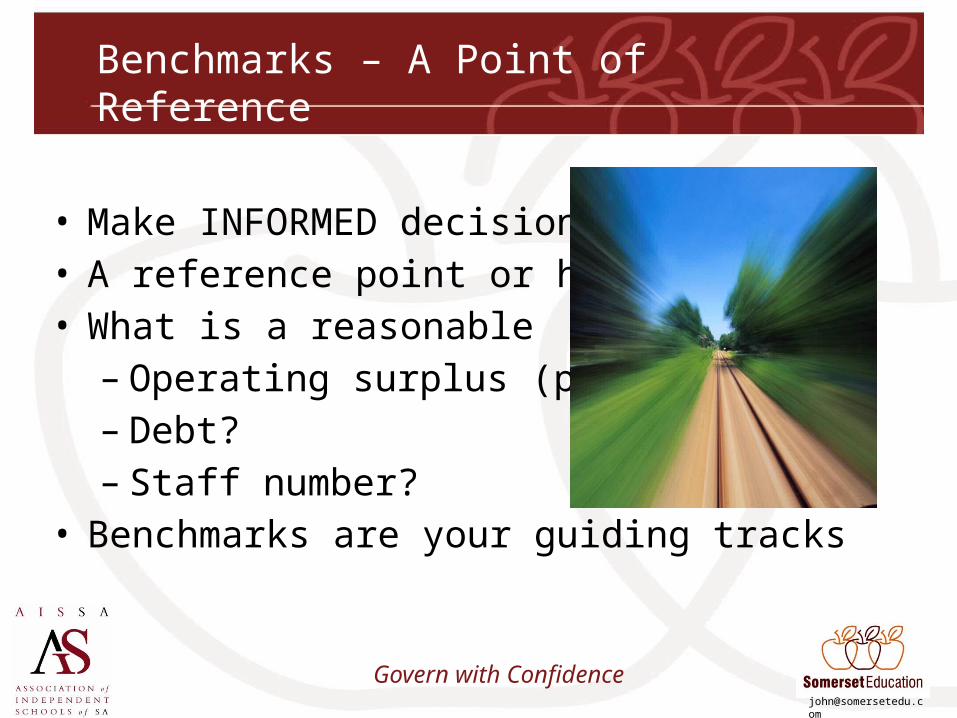
Benchmarks – A Point of Reference
• Make INFORMED decisions• A reference point or hurdle• What is a reasonable
– Operating surplus (profit)?– Debt?– Staff number?
• Benchmarks are your guiding tracks
Govern with Confidence
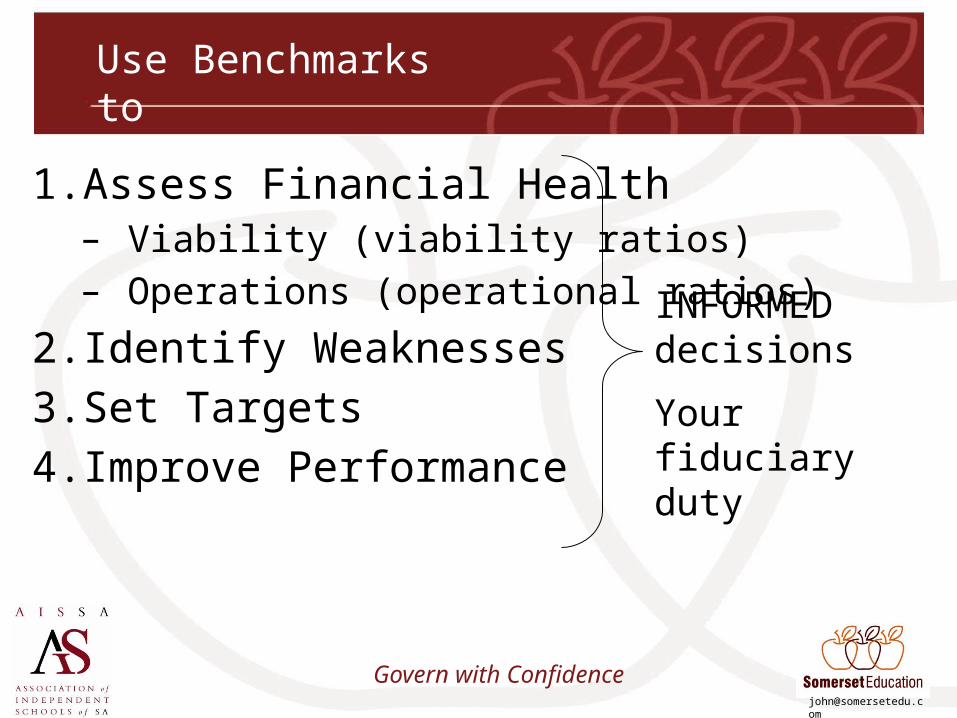
Use Benchmarks to
1. Assess Financial Health– Viability (viability ratios)– Operations (operational ratios)
2. Identify Weaknesses3. Set Targets4. Improve Performance
INFORMED decisions
Your fiduciary duty
Govern with Confidence
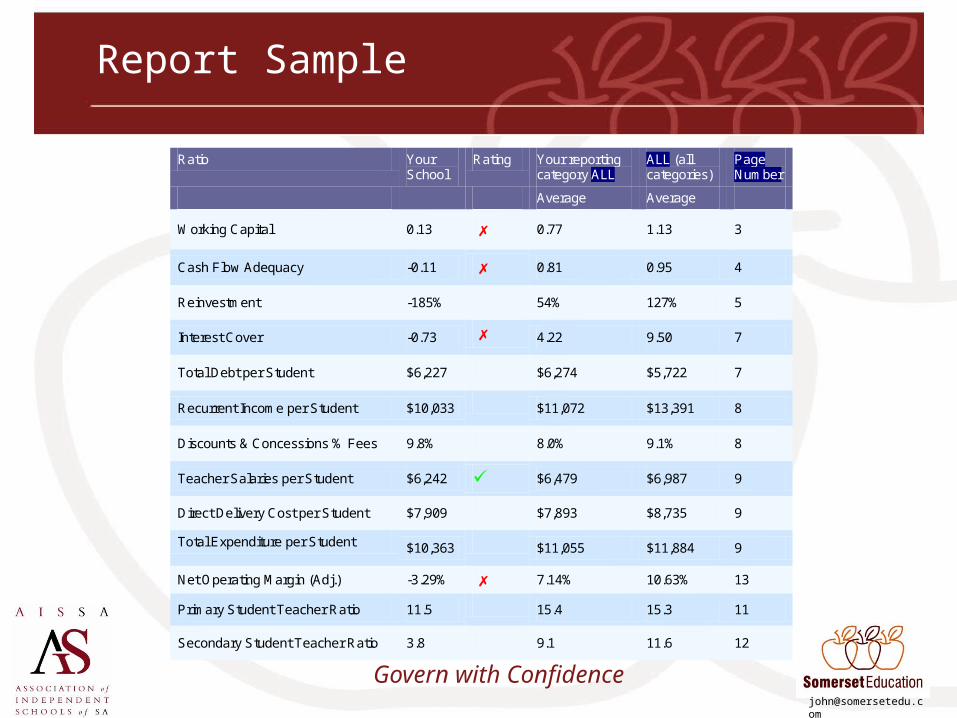
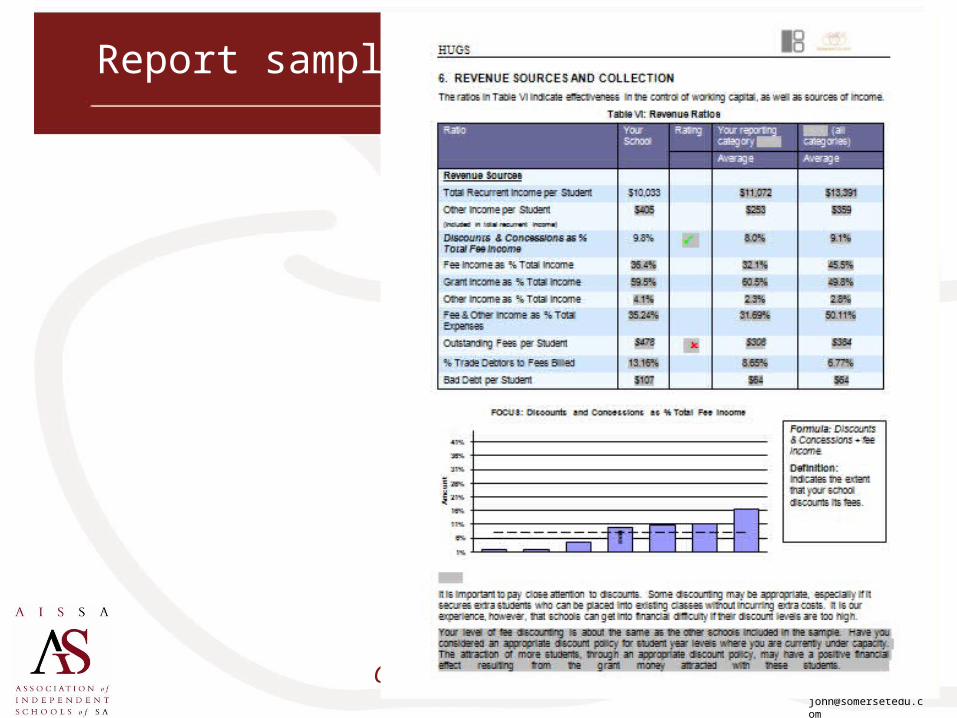
Report Sample
Ratio Your School
Rating Your reporting category ALL
ALL (all categories)
Page Number
Average Average
Working Capital 0.13 0.77 1.13 3
Cash Flow Adequacy -0.11 0.81 0.95 4
Reinvestment -185% 54% 127% 5
Interest Cover -0.73 4.22 9.50 7
Total Debt per Student $6,227 $6,274 $5,722 7
Recurrent Income per Student $10,033 $11,072 $13,391 8
Discounts & Concessions % Fees 9.8% 8.0% 9.1% 8
Teacher Salaries per Student $6,242 $6,479 $6,987 9
Direct Delivery Cost per Student $7,909 $7,893 $8,735 9
Total Expenditure per Student $10,363 $11,055 $11,884 9
Net Operating Margin (Adj.) -3.29% 7.14% 10.63% 13
Primary Student Teacher Ratio 11.5 15.4 15.3 11
Secondary Student Teacher Ratio 3.8 9.1 11.6 12
Govern with Confidence
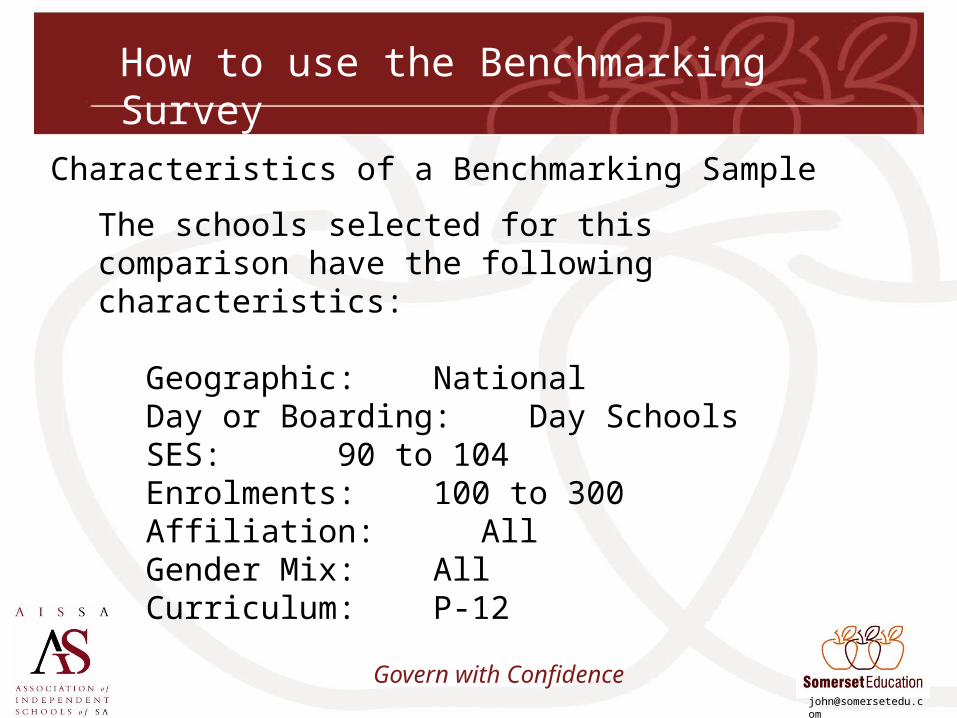
How to use the Benchmarking Survey
The schools selected for this comparison have the following characteristics:
Geographic: NationalDay or Boarding: Day SchoolsSES: 90 to 104Enrolments: 100 to 300Affiliation: AllGender Mix: AllCurriculum: P-12
Characteristics of a Benchmarking Sample
Govern with Confidence
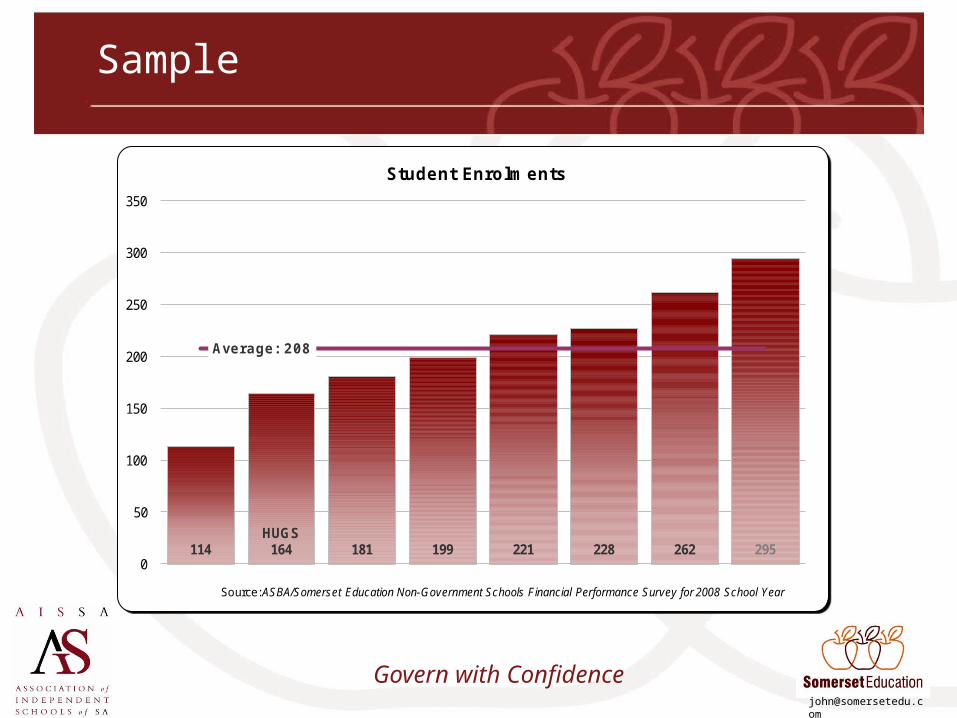
114HUGS
164 181 199 221 228 262 295
Average: 208
0
50
100
150
200
250
300
350
Student Enrolments
Source: ASBA/Somerset Education Non-Government Schools Financial Performance Survey for 2008 School Year
Sample
Govern with Confidence
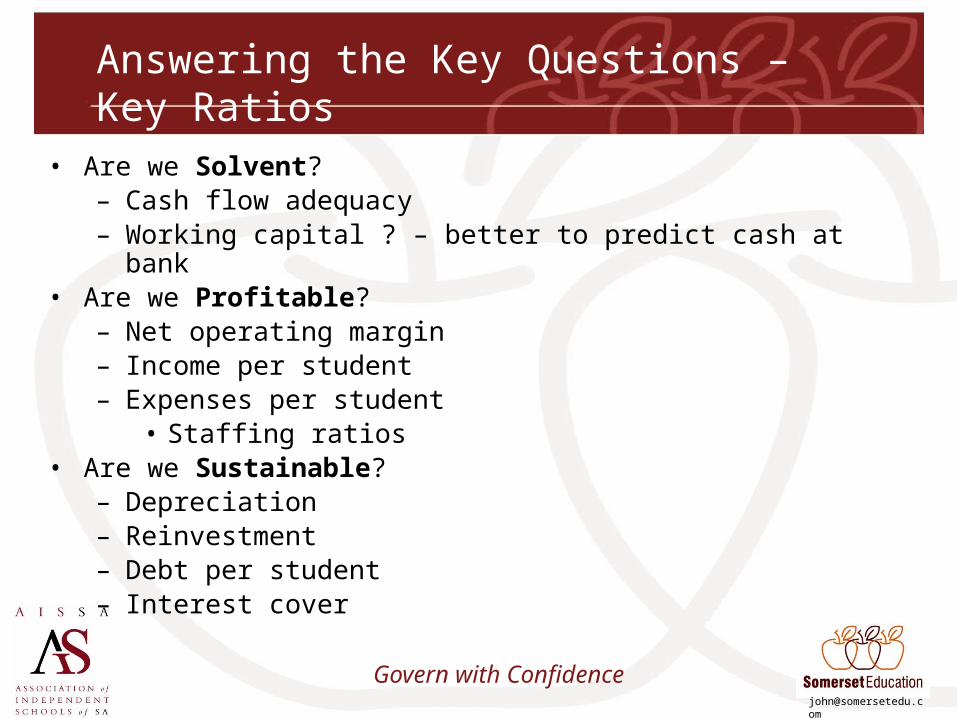
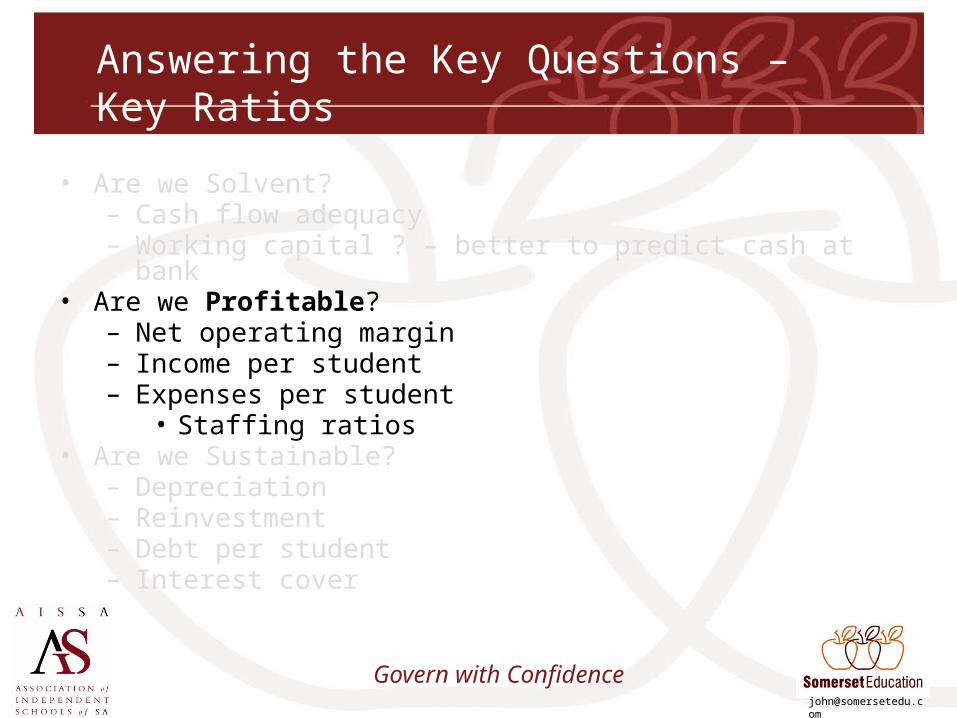
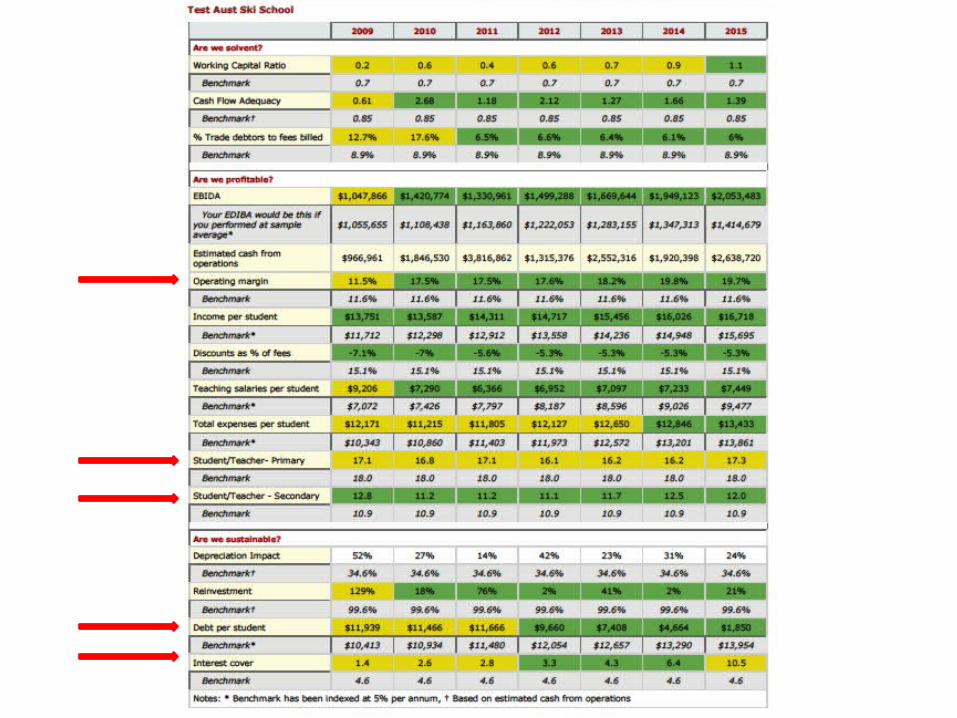
Answering the Key Questions – Key Ratios
• Are we Solvent?– Cash flow adequacy– Working capital ? – better to predict cash at bank
• Are we Profitable?– Net operating margin– Income per student– Expenses per student
• Staffing ratios• Are we Sustainable?
– Depreciation– Reinvestment – Debt per student – Interest cover
Govern with Confidence
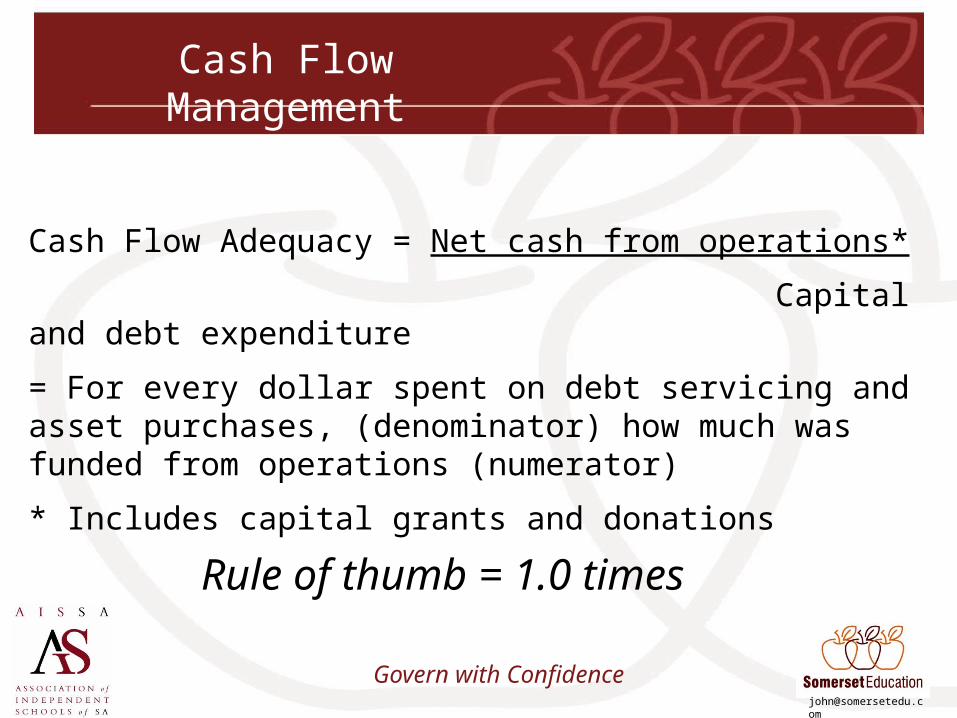
Cash Flow Management
Cash Flow Adequacy = Net cash from operations*
Capital and debt expenditure
= For every dollar spent on debt servicing and asset purchases, (denominator) how much was funded from operations (numerator)
* Includes capital grants and donations
Rule of thumb = 1.0 times
Govern with Confidence
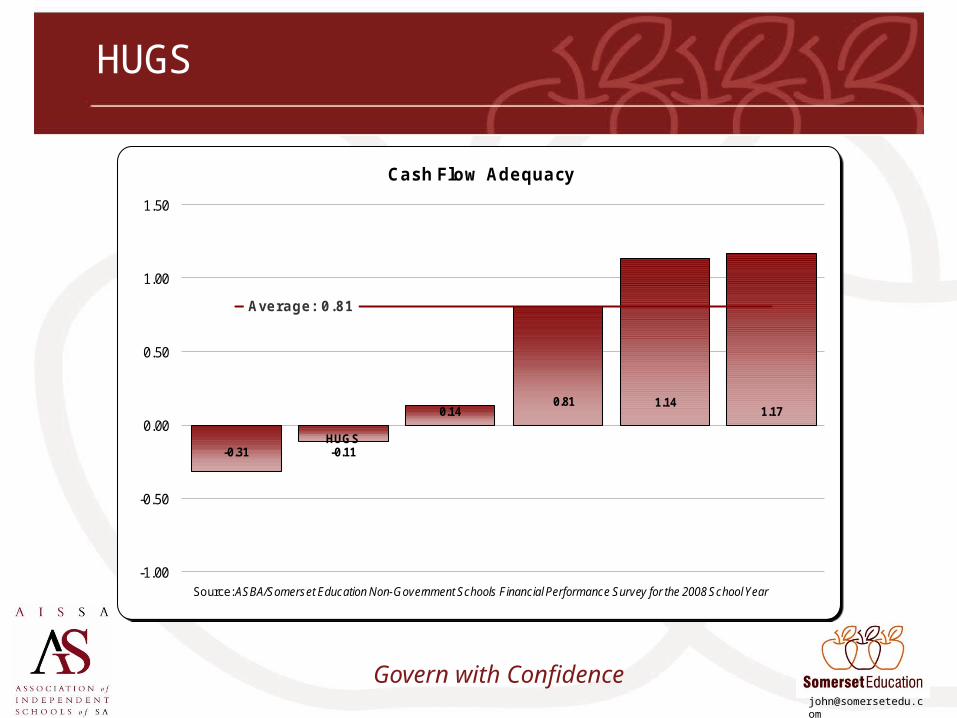
-0.31HUGS-0.11
0.140.81 1.14
1.17
Average: 0.81
-1.00
-0.50
0.00
0.50
1.00
1.50
Cash Flow Adequacy
Source: ASBA/Somerset Education Non-Government Schools Financial Performance Survey for the 2008 School Year
HUGS
Govern with Confidence
-
0.50
1.00
1.50
2.00
2.50
3.00
3.50
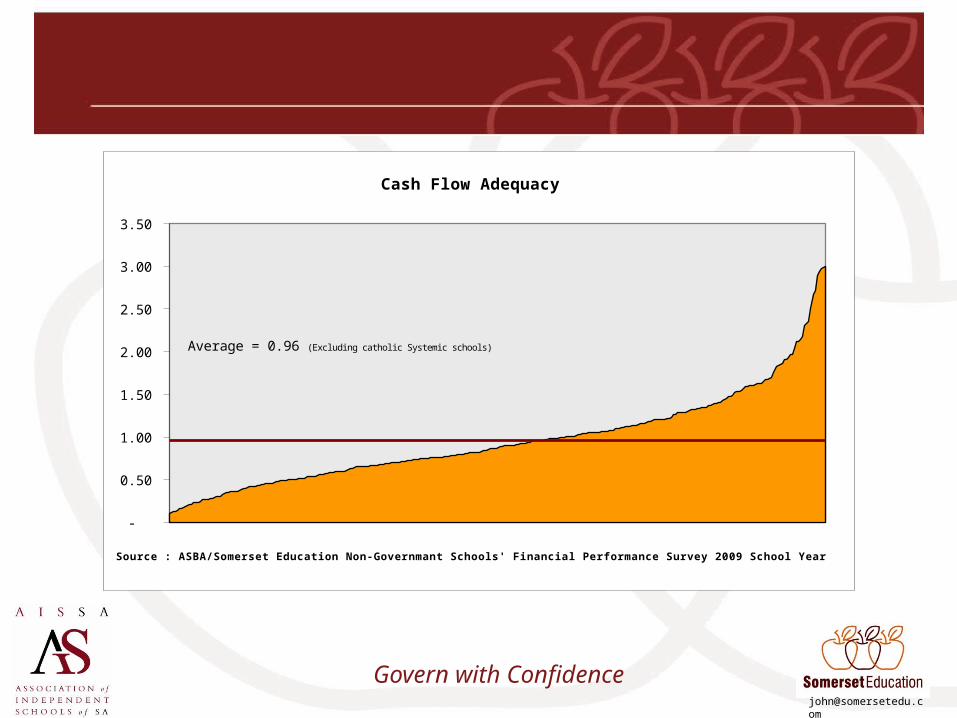
Cash Flow Adequacy
Source : ASBA/Somerset Education Non-Governmant Schools' Financial Performance Survey 2009 School Year
Average = 0.96 (Excluding catholic Systemic schools)
Govern with Confidence
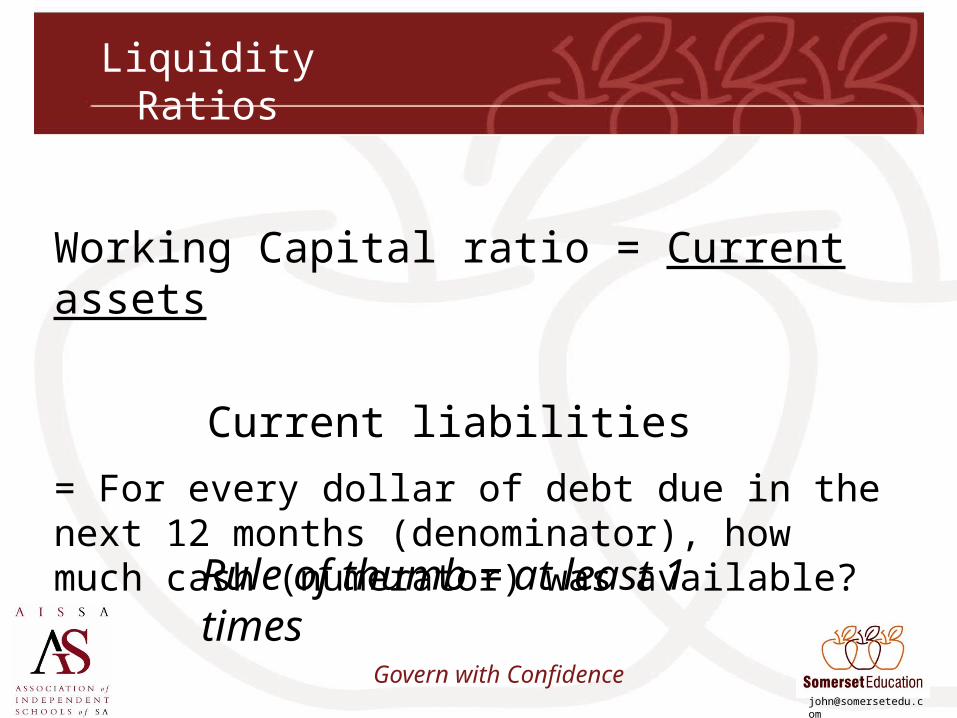
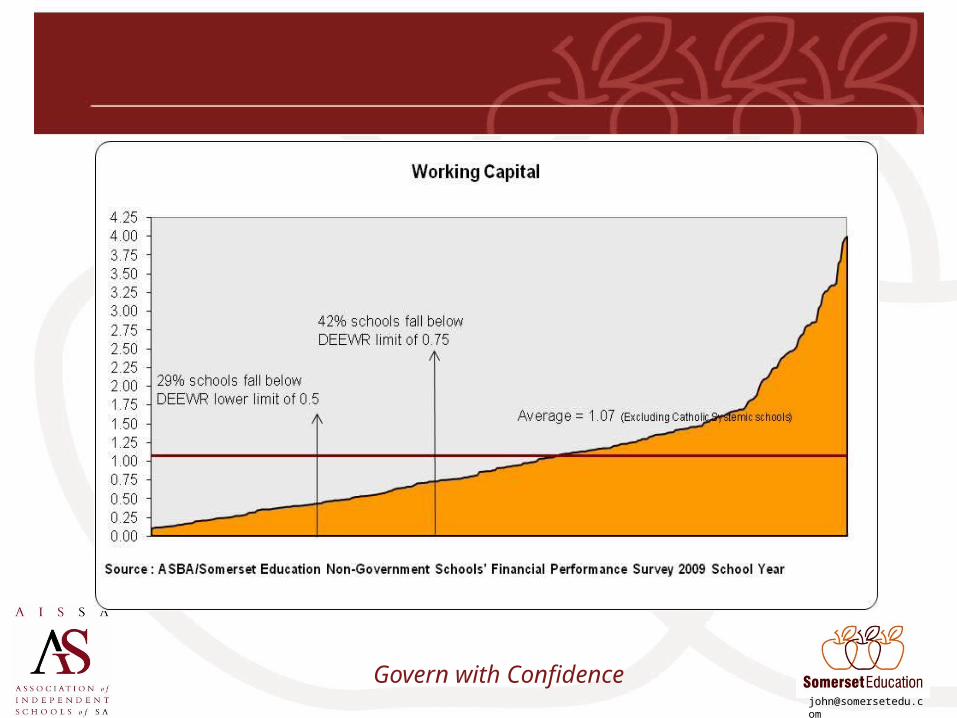
Liquidity Ratios
Working Capital ratio = Current assets
Current liabilities= For every dollar of debt due in the next 12 months (denominator), how much cash (numerator) was available?
Rule of thumb = at least 1 times
Govern with Confidence
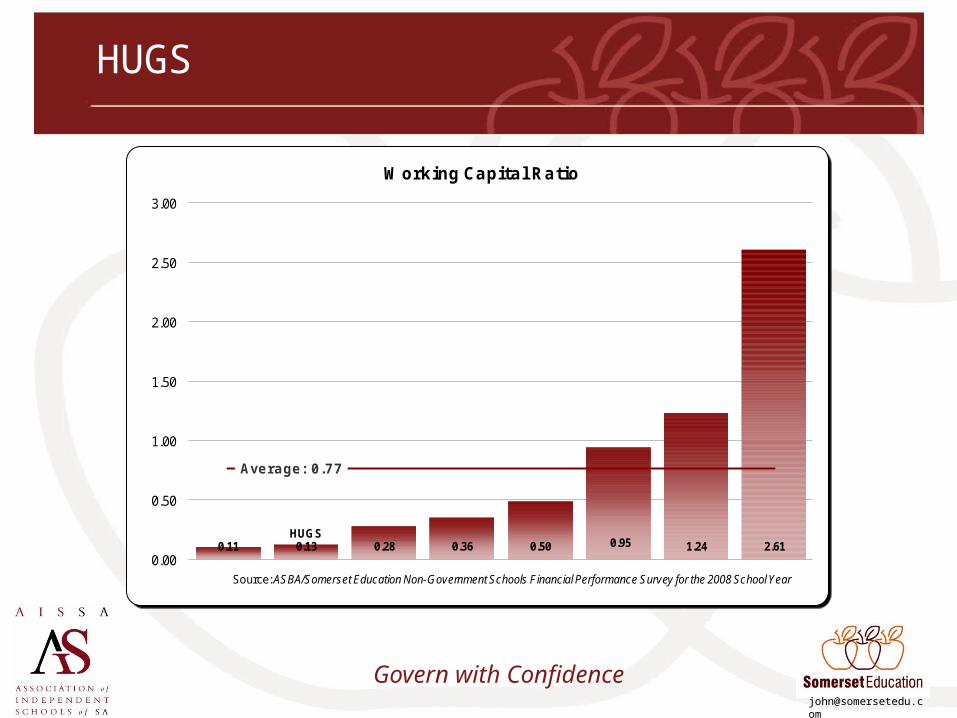
0.11HUGS0.13 0.28 0.36 0.50 0.95 1.24 2.61
Average: 0.77
0.00
0.50
1.00
1.50
2.00
2.50
3.00
Working Capital Ratio
Source: ASBA/Somerset Education Non-Government Schools Financial Performance Survey for the 2008 School Year
HUGS
Govern with Confidence
Answering the Key Questions – Key Ratios
• Are we Solvent?– Cash flow adequacy– Working capital ? – better to predict cash at bank
• Are we Profitable?– Net operating margin– Income per student– Expenses per student
• Staffing ratios• Are we Sustainable?
– Depreciation– Reinvestment – Debt per student – Interest cover
Govern with Confidence
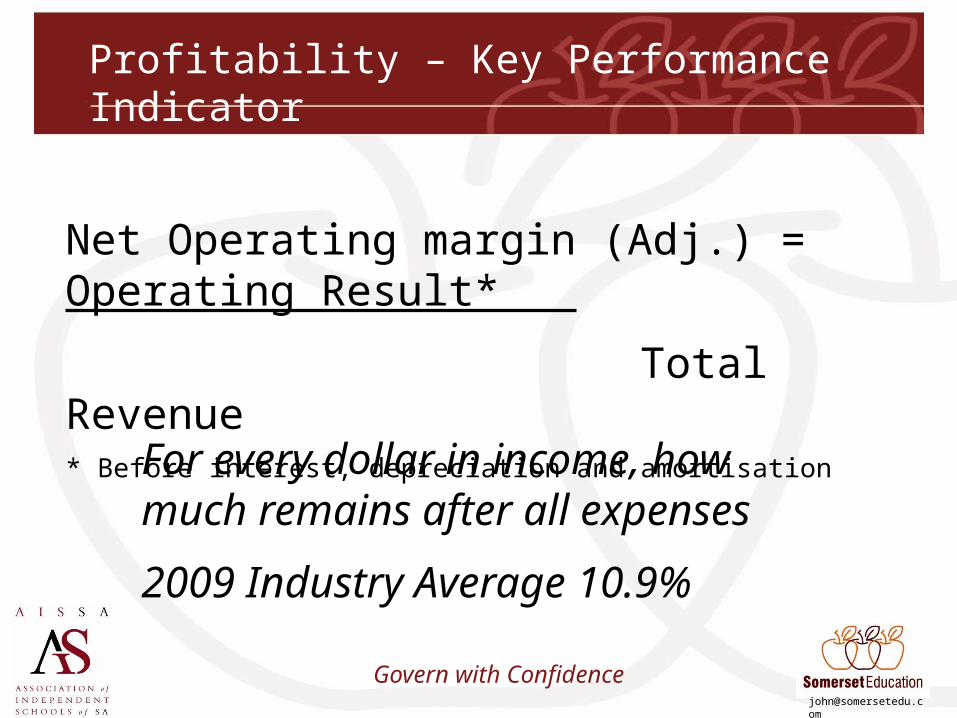
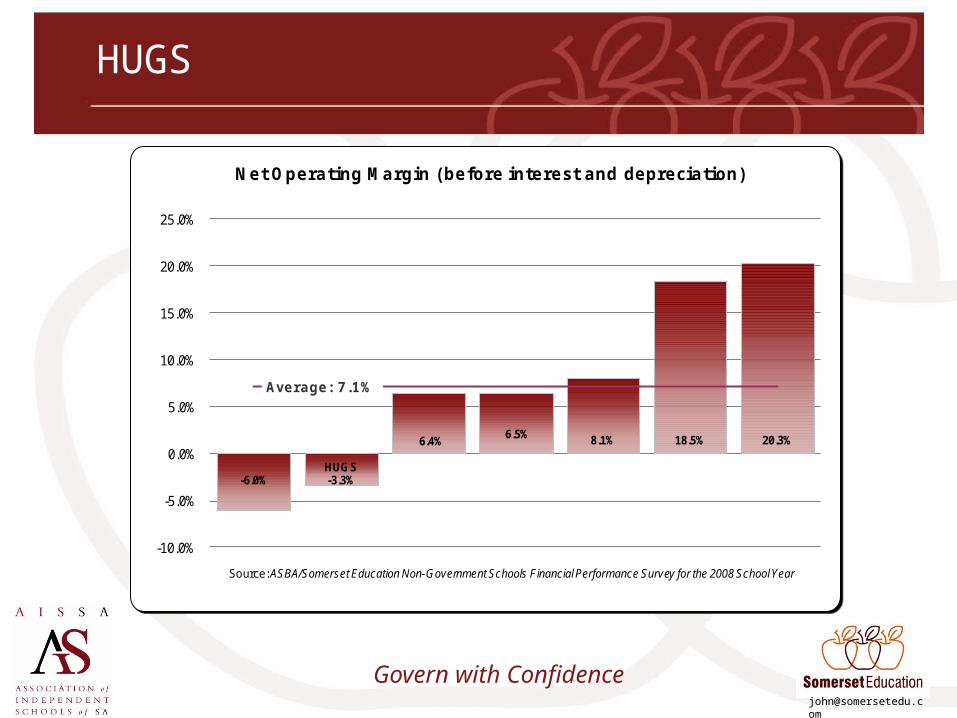
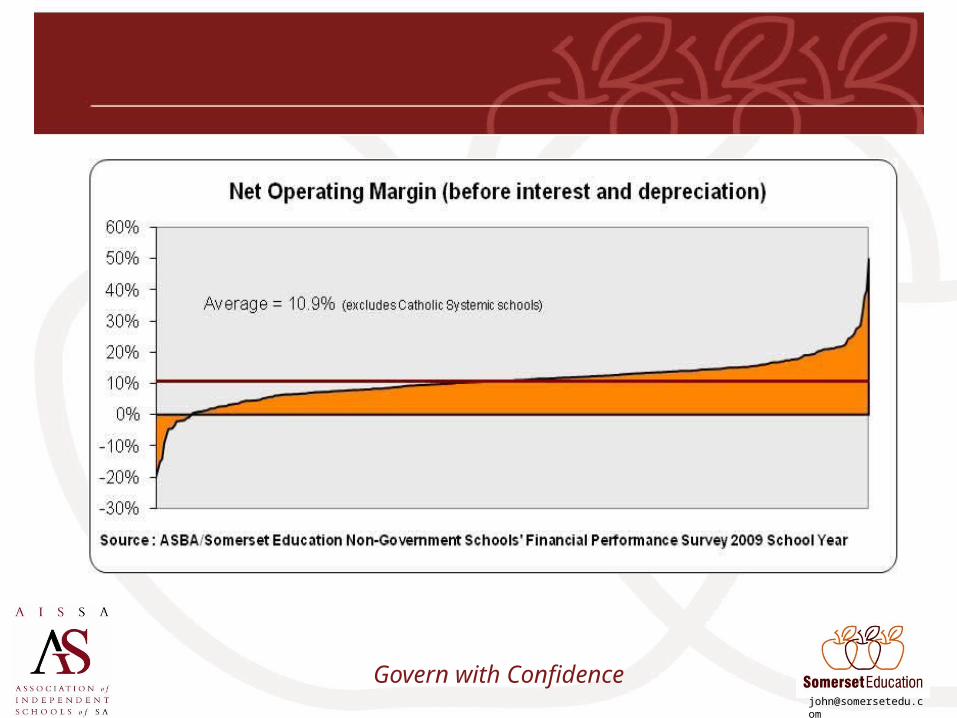
Profitability – Key Performance Indicator
Net Operating margin (Adj.) = Operating Result*
Total Revenue* Before interest, depreciation and amortisation
For every dollar in income, how much remains after all expenses
2009 Industry Average 10.9%
Govern with Confidence
-6.0%HUGS-3.3%
6.4%6.5% 8.1% 18.5% 20.3%
Average: 7.1%
-10.0%
-5.0%
0.0%
5.0%
10.0%
15.0%
20.0%
25.0%
Net Operating Margin (before interest and depreciation)
Source: ASBA/Somerset Education Non-Government Schools Financial Performance Survey for the 2008 School Year
HUGS
Govern with Confidence
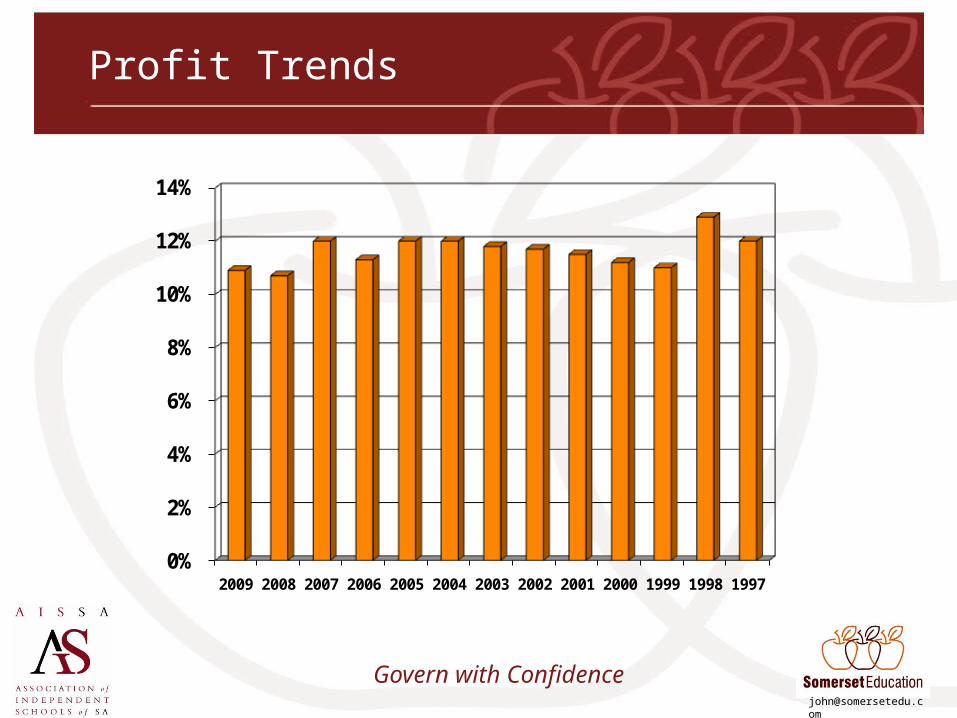
Profit Trends
0%
2%
4%
6%
8%
10%
12%
14%
2009 2008 2007 2006 2005 2004 2003 2002 2001 2000 1999 1998 1997
Govern with Confidence
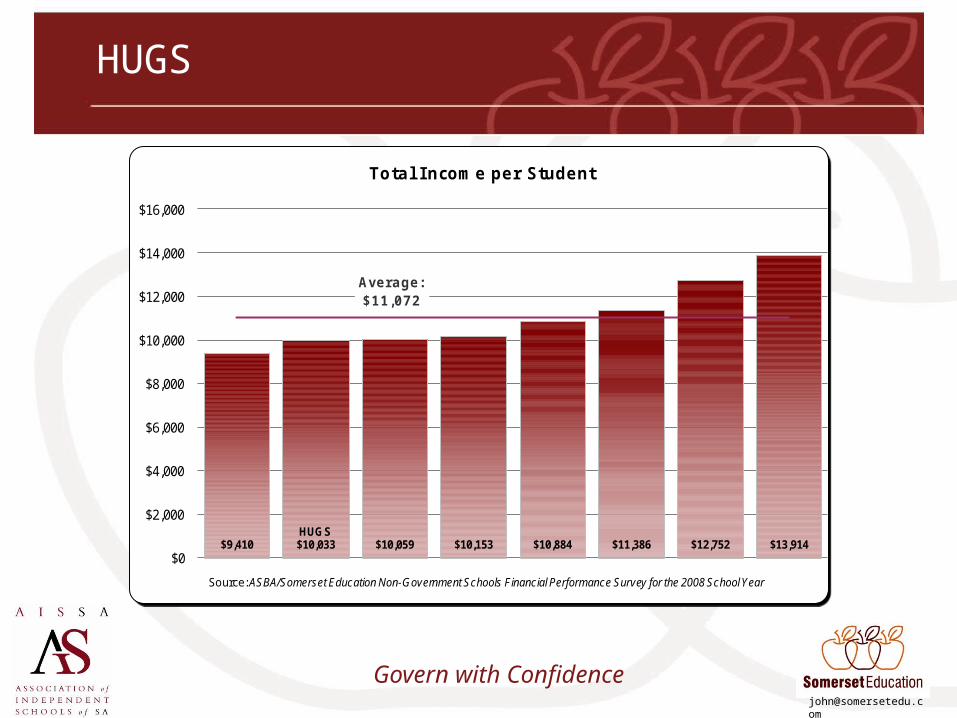
$9,410 HUGS$10,033 $10,059 $10,153 $10,884 $11,386 $12,752 $13,914
Average: $11,072
$0
$2,000
$4,000
$6,000
$8,000
$10,000
$12,000
$14,000
$16,000
Total I ncome per Student
Source: ASBA/Somerset Education Non-Government Schools Financial Performance Survey for the 2008 School Year
HUGS
Govern with Confidence
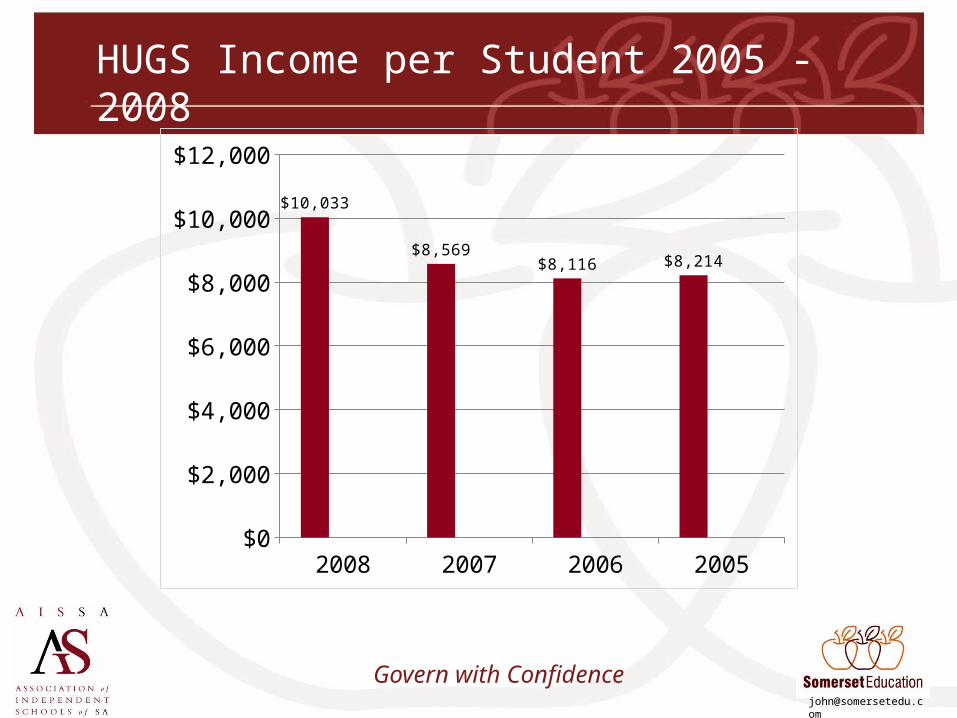
HUGS Income per Student 2005 - 2008
2008 2007 2006 2005$0
$2,000
$4,000
$6,000
$8,000
$10,000
$12,000
$10,033
$8,569$8,116 $8,214
Govern with Confidence
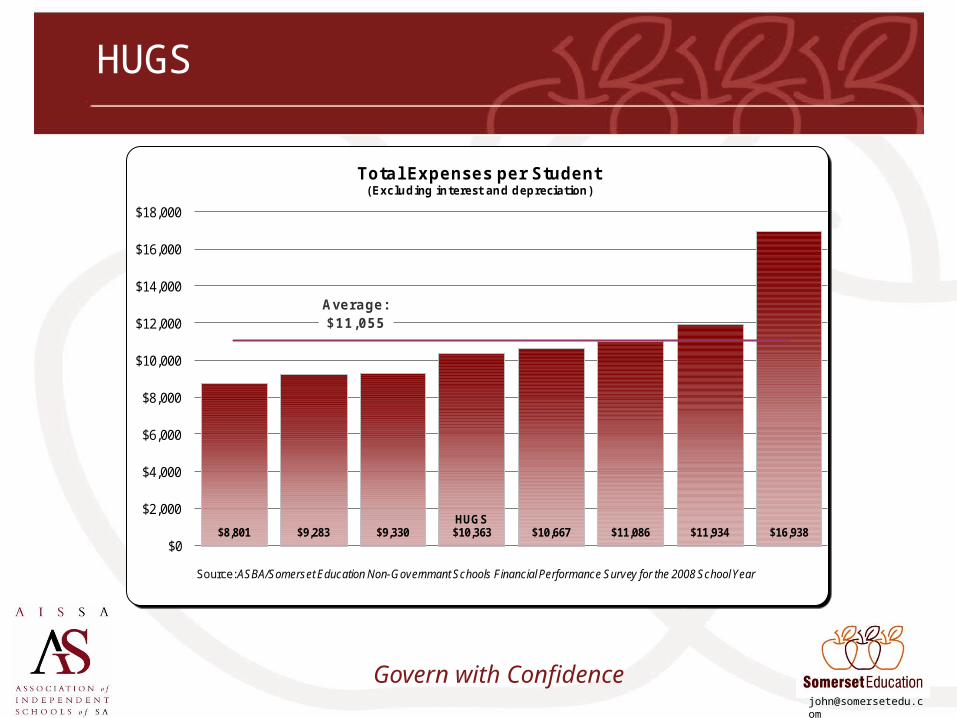
$8,801 $9,283 $9,330HUGS$10,363 $10,667 $11,086 $11,934 $16,938
Average: $11,055
$0
$2,000
$4,000
$6,000
$8,000
$10,000
$12,000
$14,000
$16,000
$18,000
Total Expenses per Student (Excluding interest and depreciation)
Source: ASBA/Somerset Education Non-Governmant Schools Financial Performance Survey for the 2008 School Year
HUGS
Govern with Confidence
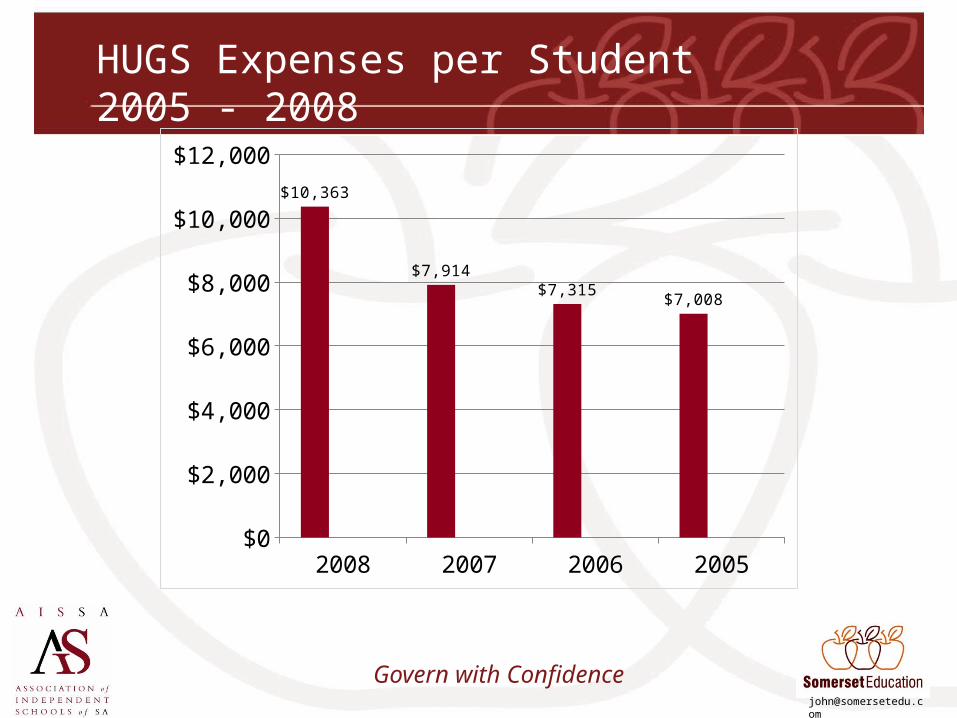
HUGS Expenses per Student 2005 - 2008
2008 2007 2006 2005$0
$2,000
$4,000
$6,000
$8,000
$10,000
$12,000
$10,363
$7,914$7,315
$7,008
Govern with Confidence
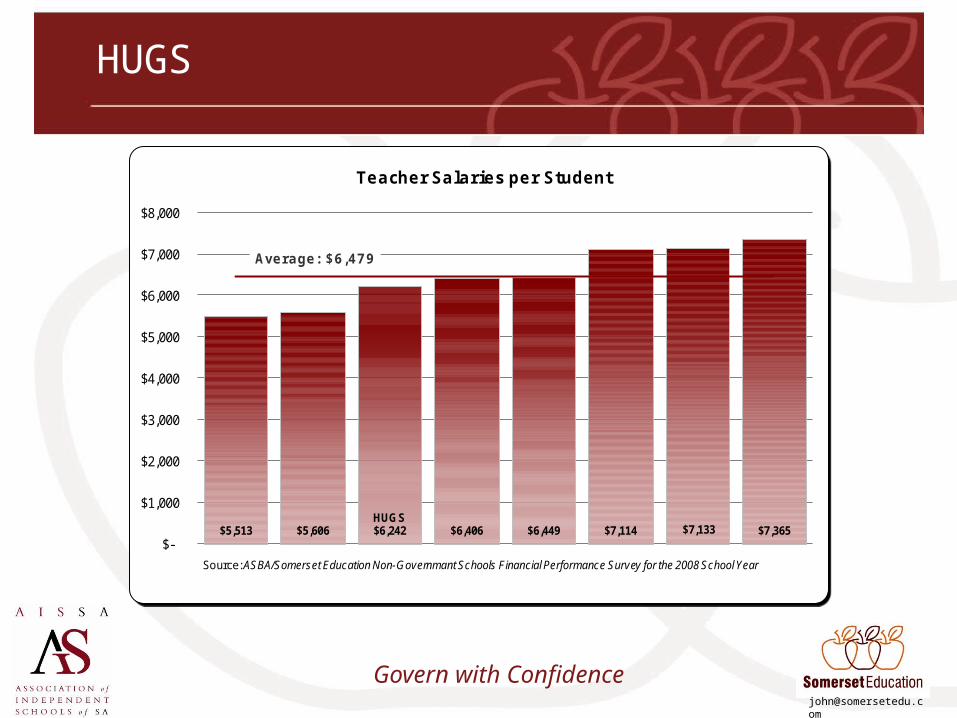
$5,513 $5,606HUGS$6,242 $6,406 $6,449 $7,114 $7,133 $7,365
Average: $6,479
$-
$1,000
$2,000
$3,000
$4,000
$5,000
$6,000
$7,000
$8,000
Teacher Salaries per Student
Source: ASBA/Somerset Education Non-Governmant Schools Financial Performance Survey for the 2008 School Year
HUGS
Govern with Confidence
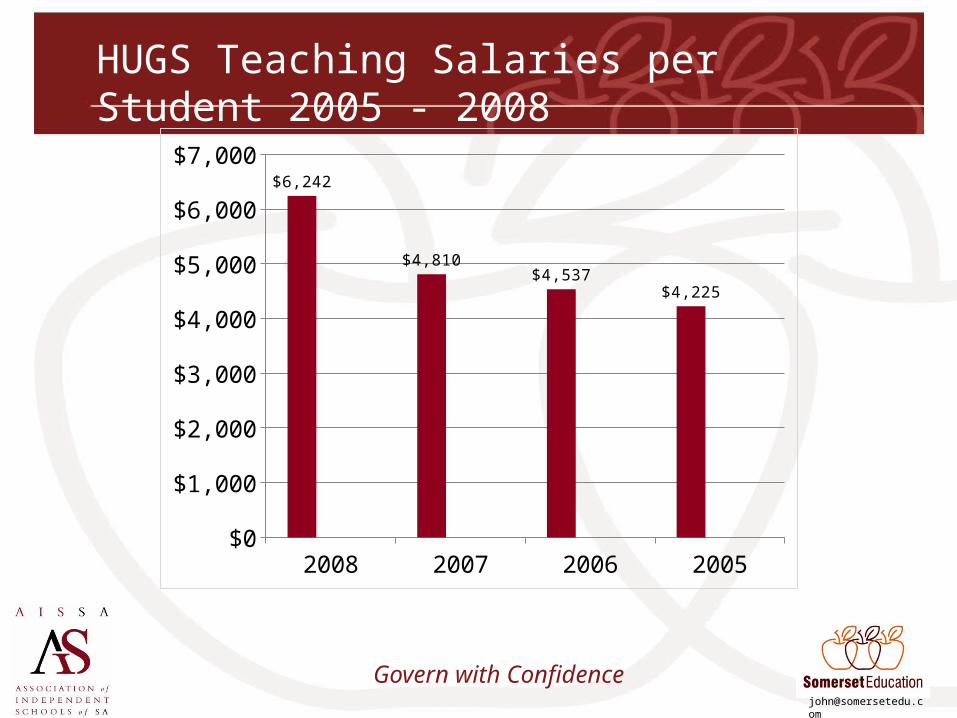
HUGS Teaching Salaries per Student 2005 - 2008
2008 2007 2006 2005$0
$1,000
$2,000
$3,000
$4,000
$5,000
$6,000
$7,000$6,242
$4,810$4,537
$4,225
Govern with Confidence
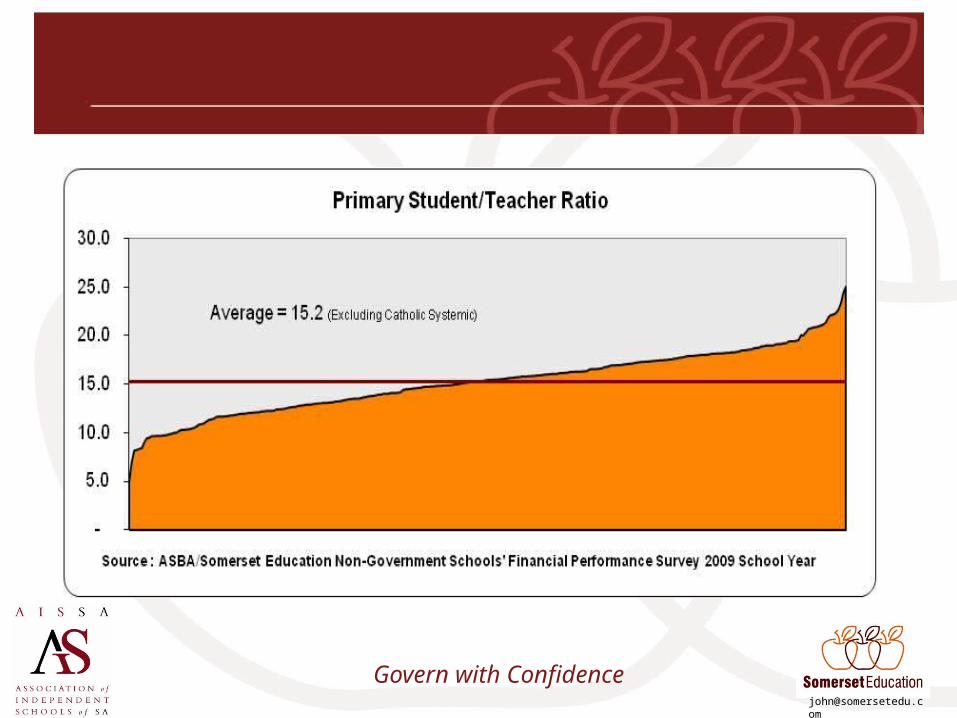
Staffing
Student/Teacher ratio = Number of students
Full-Time teacher equivalent
= Average number of students per EFT teacher
Best Practice = Depends on the school
Govern with Confidence
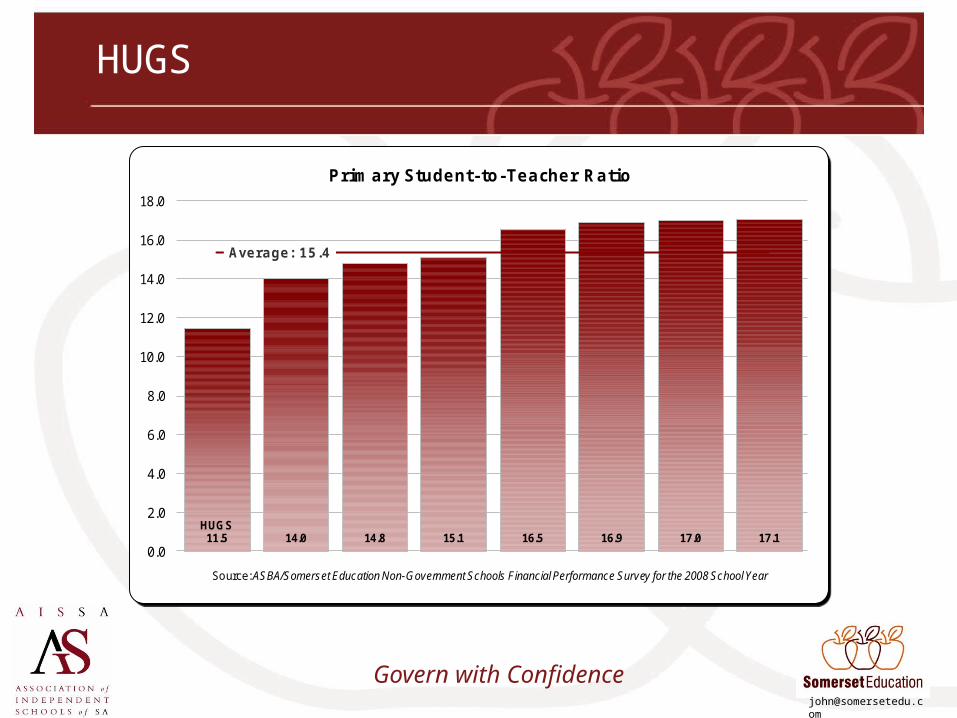
HUGS11.5 14.0 14.8 15.1 16.5 16.9 17.0 17.1
Average: 15.4
0.0
2.0
4.0
6.0
8.0
10.0
12.0
14.0
16.0
18.0
Primary Student-to-Teacher Ratio
Source: ASBA/Somerset Education Non-Government Schools Financial Performance Survey for the 2008 School Year
HUGS
Govern with Confidence
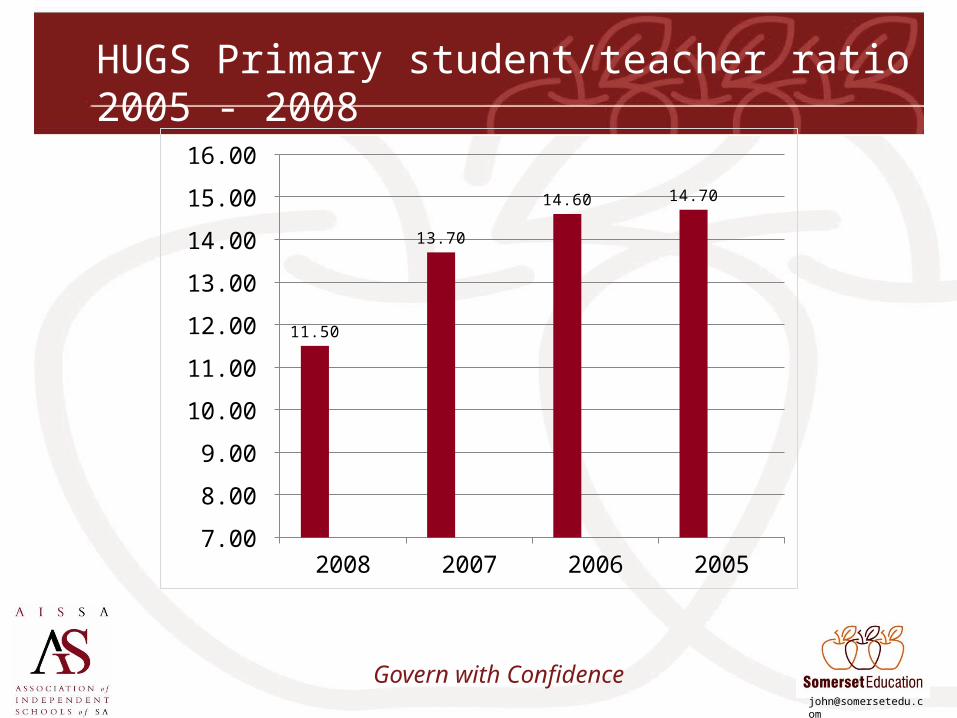
HUGS Primary student/teacher ratio 2005 - 2008
2008 2007 2006 2005 7.00
8.00
9.00
10.00
11.00
12.00
13.00
14.00
15.00
16.00
11.50
13.70
14.60 14.70
Govern with Confidence
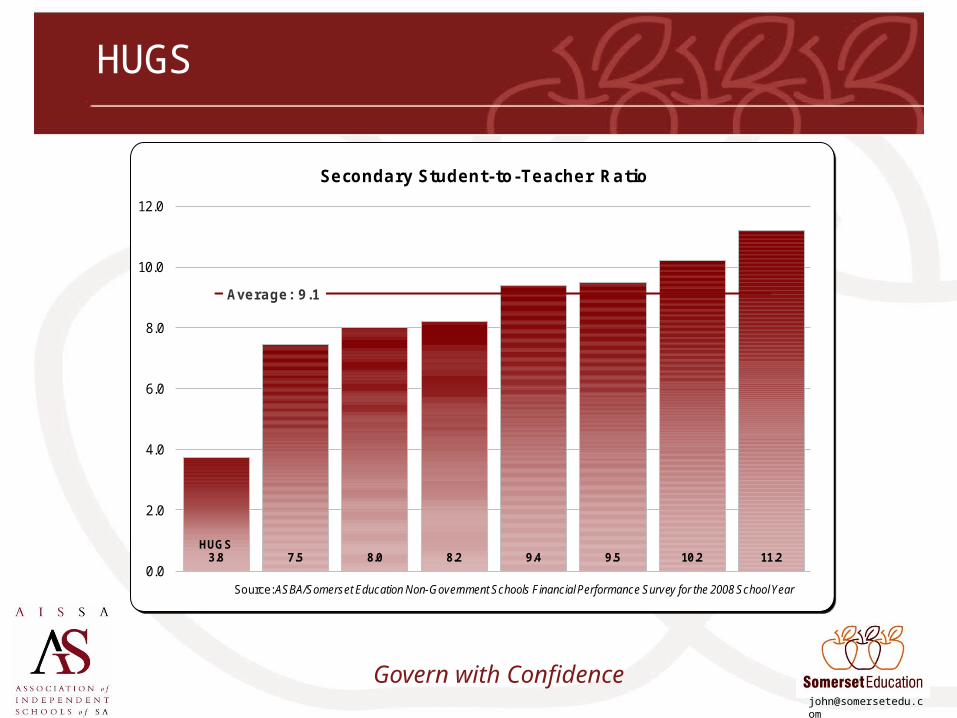
HUGS3.8 7.5 8.0 8.2 9.4 9.5 10.2 11.2
Average: 9.1
0.0
2.0
4.0
6.0
8.0
10.0
12.0
Secondary Student-to-Teacher Ratio
Source: ASBA/Somerset Education Non-Government Schools Financial Performance Survey for the 2008 School Year
HUGS
Govern with Confidence
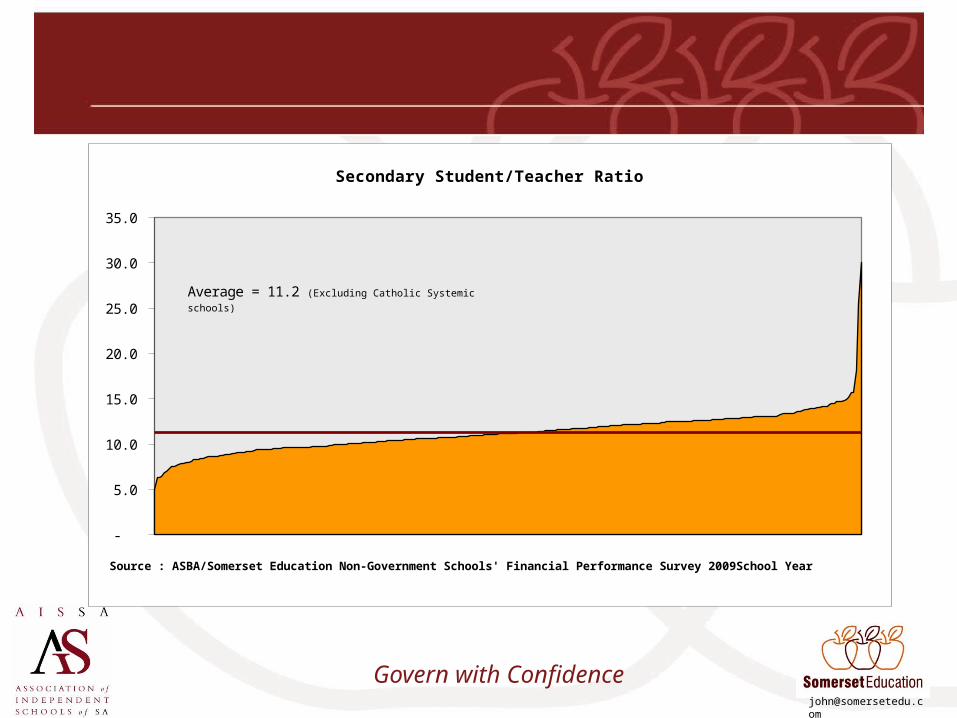
-
5.0
10.0
15.0
20.0
25.0
30.0
35.0
Secondary Student/Teacher Ratio
Source : ASBA/Somerset Education Non-Government Schools' Financial Performance Survey 2009School Year
Average = 11.2 (Excluding Catholic Systemic schools)
Govern with Confidence
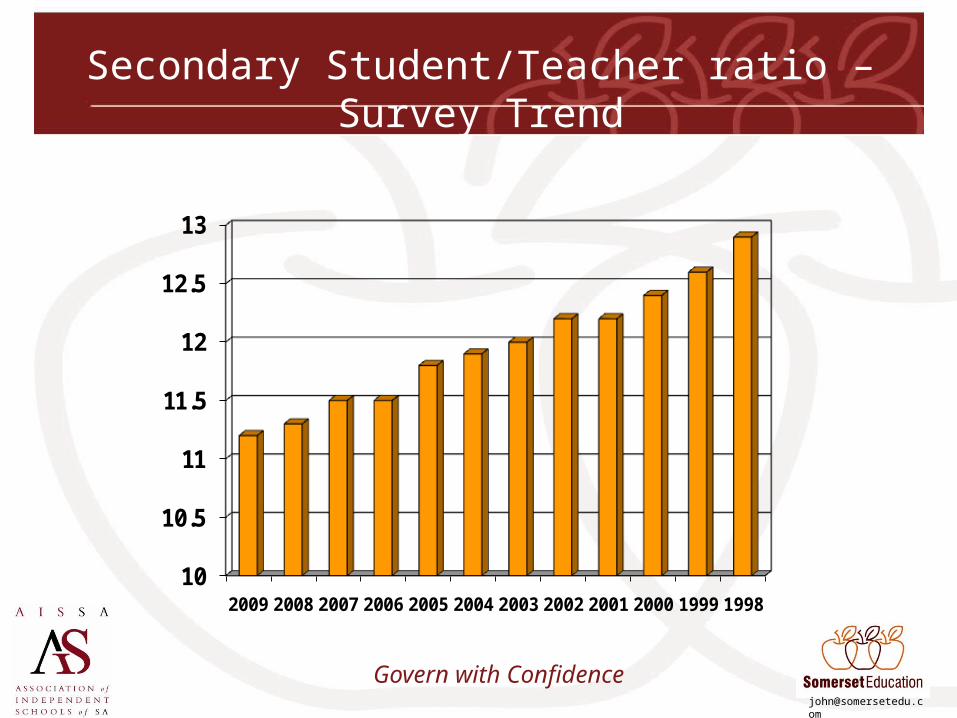
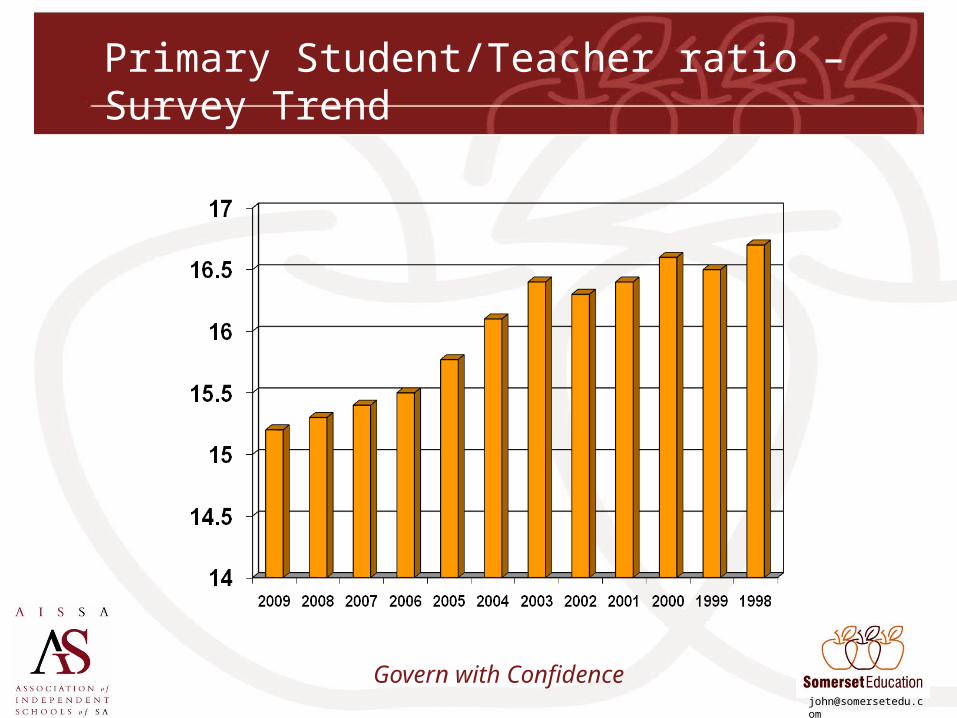
Secondary Student/Teacher ratio – Survey Trend
10
10.5
11
11.5
12
12.5
13
2009 2008 2007 2006 2005 2004 2003 2002 2001 2000 1999 1998
Govern with Confidence
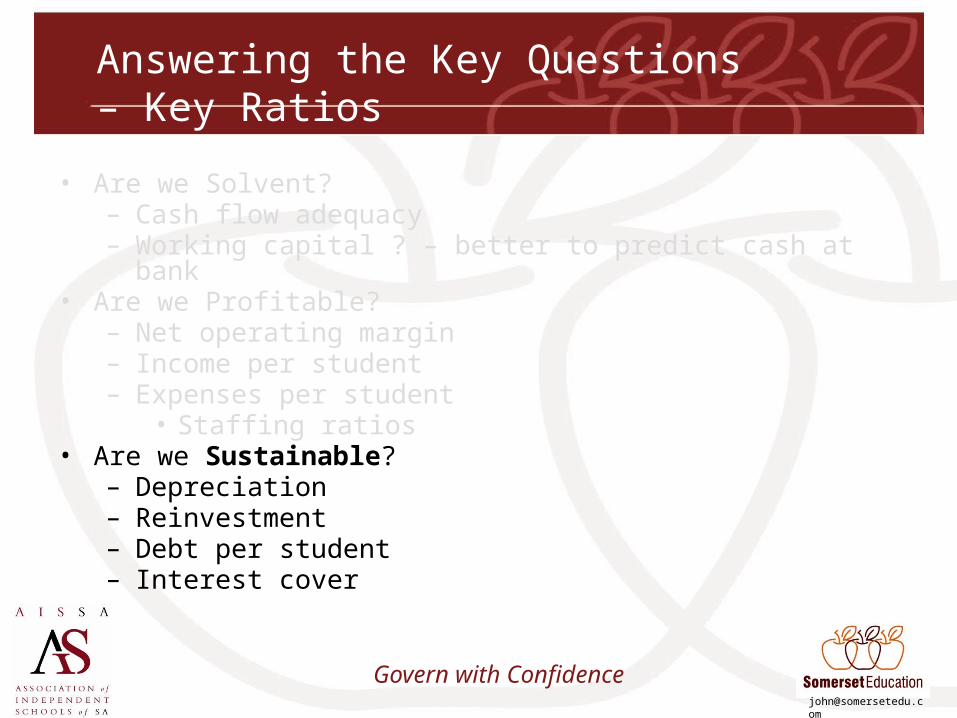
Answering the Key Questions – Key Ratios
• Are we Solvent?– Cash flow adequacy– Working capital ? – better to predict cash at bank
• Are we Profitable?– Net operating margin– Income per student– Expenses per student
• Staffing ratios• Are we Sustainable?
– Depreciation– Reinvestment – Debt per student – Interest cover
Govern with Confidence
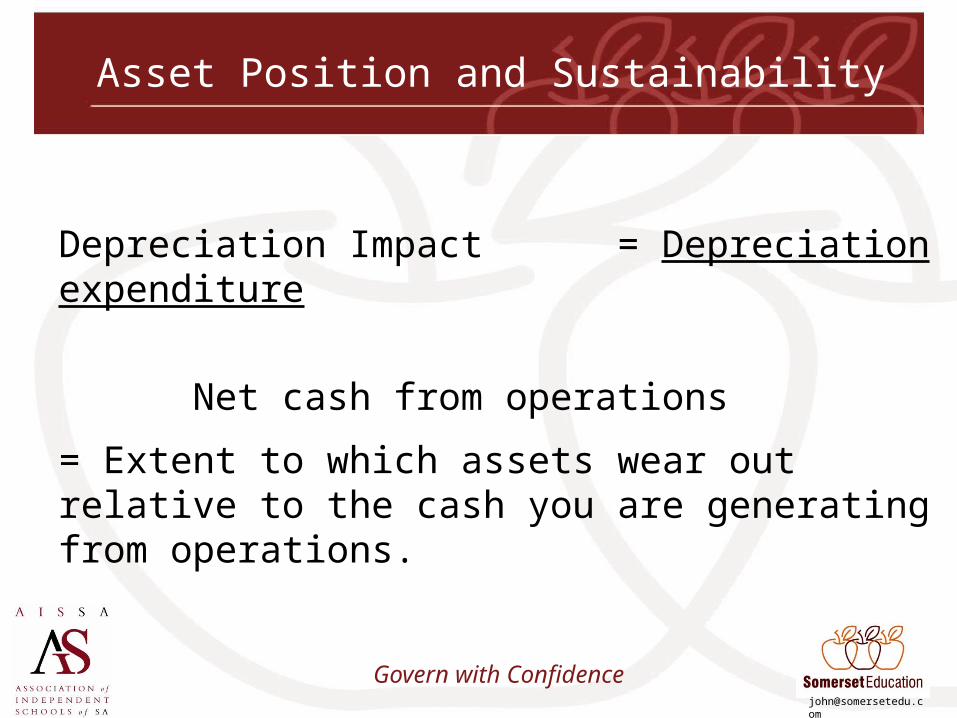
Asset Position and Sustainability
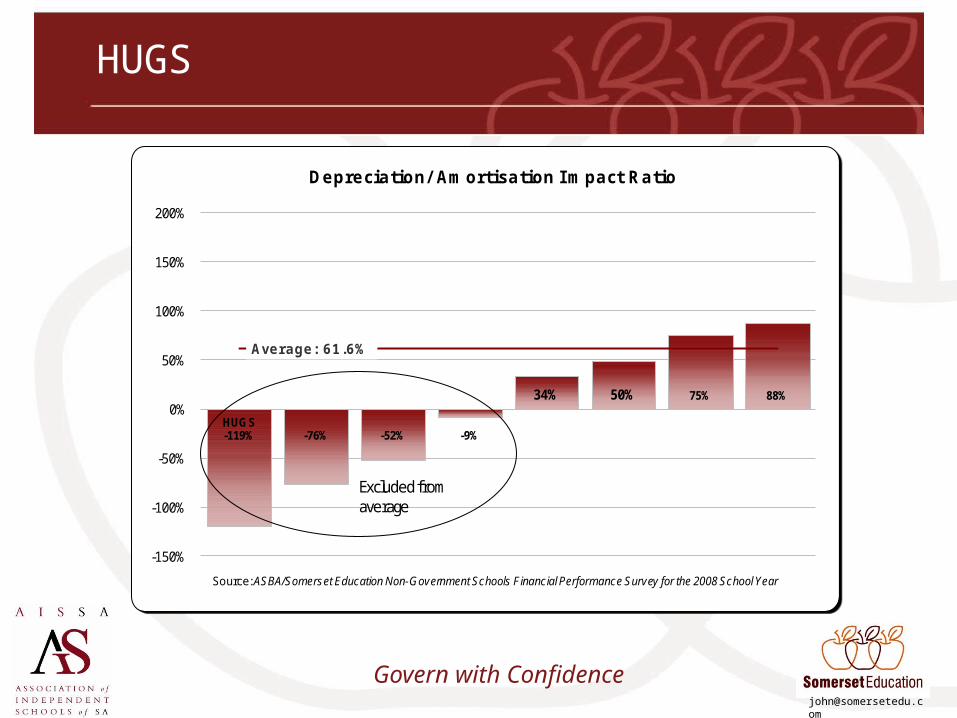
Depreciation Impact = Depreciation expenditure
Net cash from operations
= Extent to which assets wear out relative to the cash you are generating from operations.
Govern with Confidence
HUGS-119% -76% -52% -9%
34% 50% 75% 88%
Average: 61.6%
-150%
-100%
-50%
0%
50%
100%
150%
200%
Depreciation/ Amortisation I mpact Ratio
Source: ASBA/Somerset Education Non-Government Schools Financial Performance Survey for the 2008 School Year
Excluded from average
HUGS
Govern with Confidence
0%
50%
100%
150%
200%
250%
300%
350%
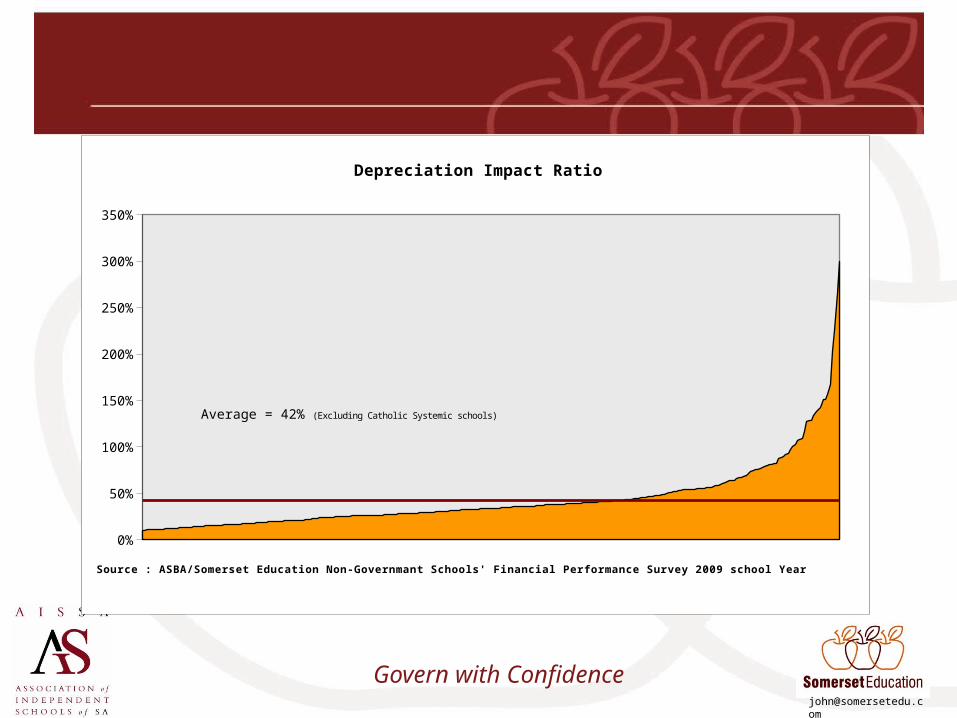
Depreciation Impact Ratio
Source : ASBA/Somerset Education Non-Governmant Schools' Financial Performance Survey 2009 school Year
Average = 42% (Excluding Catholic Systemic schools)
Govern with Confidence
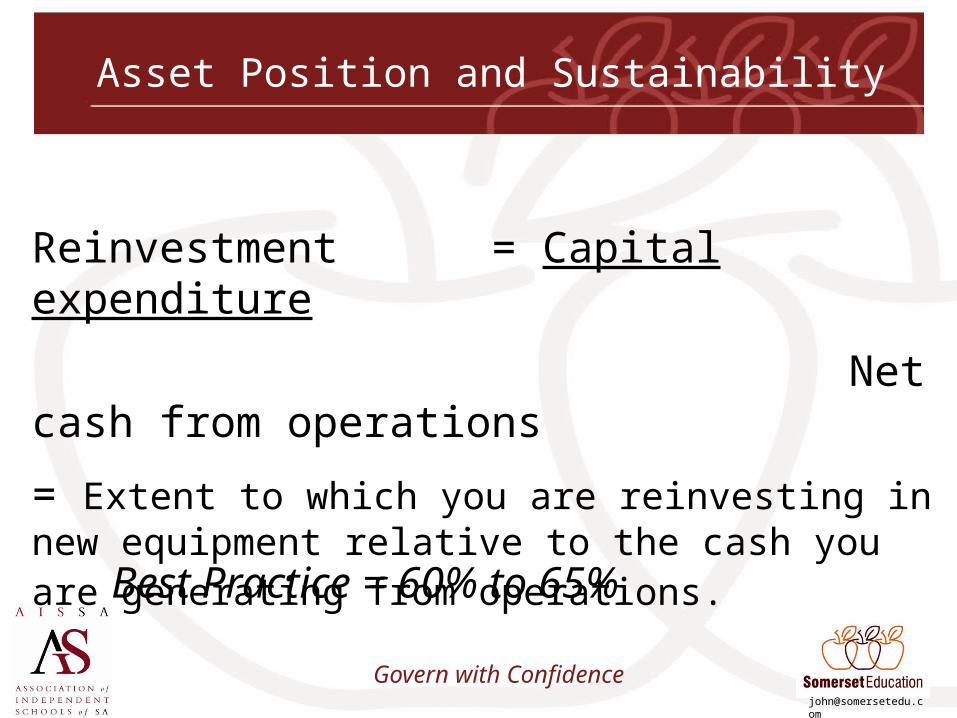
Asset Position and Sustainability
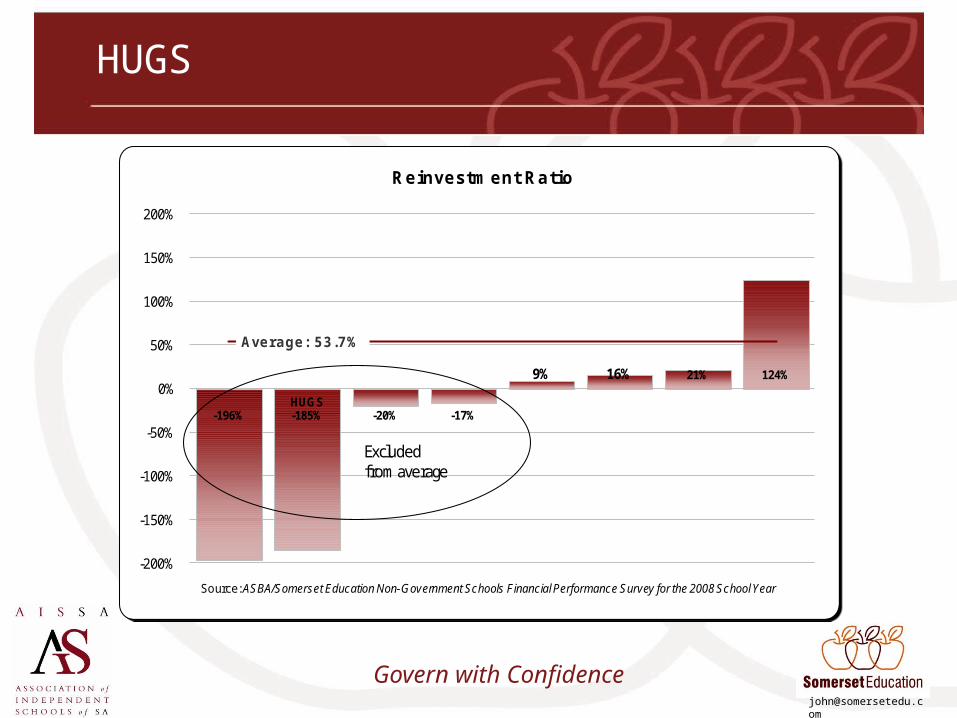
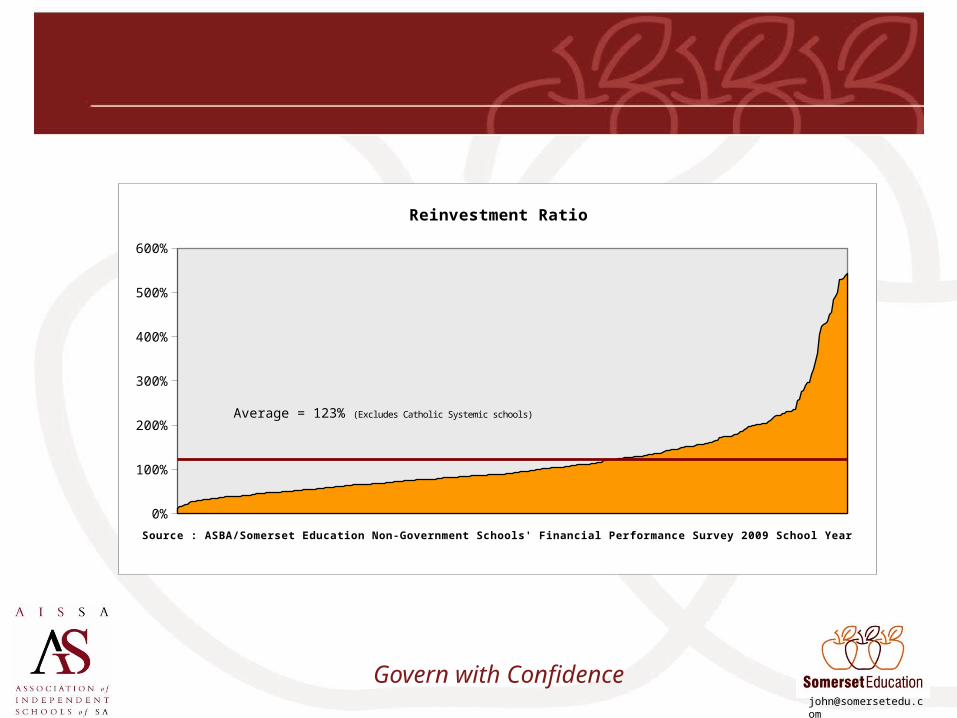
Reinvestment = Capital expenditure
Net cash from operations
= Extent to which you are reinvesting in new equipment relative to the cash you are generating from operations.
Best Practice = 60% to 65%
Govern with Confidence
-196%HUGS-185% -20% -17%
9% 16% 21% 124%
Average: 53.7%
-200%
-150%
-100%
-50%
0%
50%
100%
150%
200%
Reinvestment Ratio
Source: ASBA/Somerset Education Non-Government Schools Financial Performance Survey for the 2008 School Year
Excluded from average
HUGS
Govern with Confidence
0%
100%
200%
300%
400%
500%
600%
Reinvestment Ratio
Source : ASBA/Somerset Education Non-Government Schools' Financial Performance Survey 2009 School Year
Average = 123% (Excludes Catholic Systemic schools)
Govern with Confidence
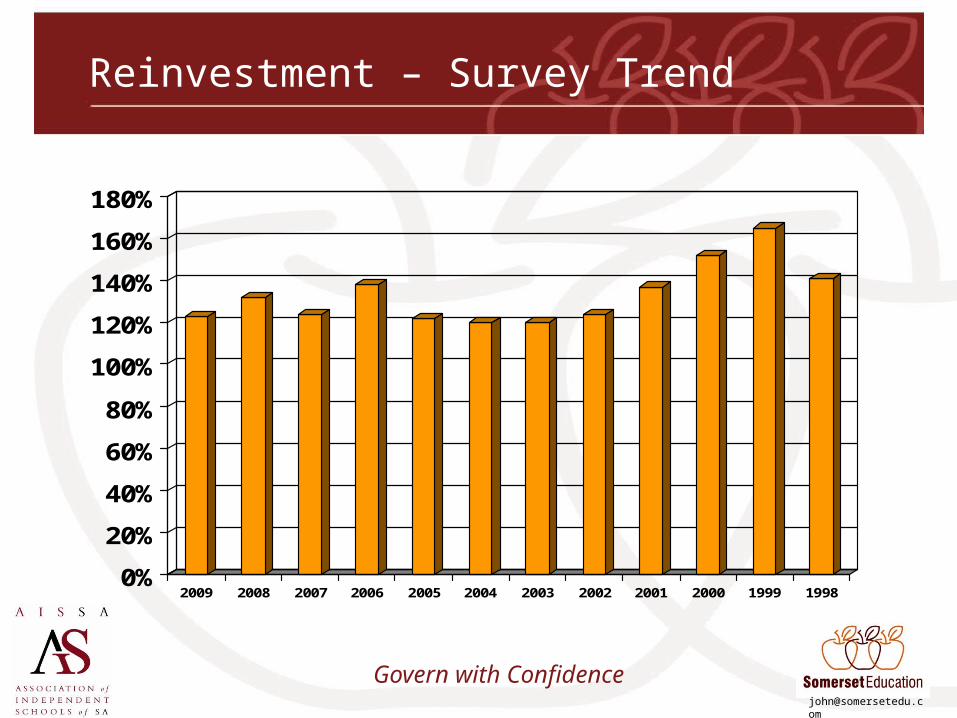
Reinvestment – Survey Trend
0%
20%
40%
60%
80%
100%
120%
140%
160%
180%
2009 2008 2007 2006 2005 2004 2003 2002 2001 2000 1999 1998
Govern with ConfidencePage 84
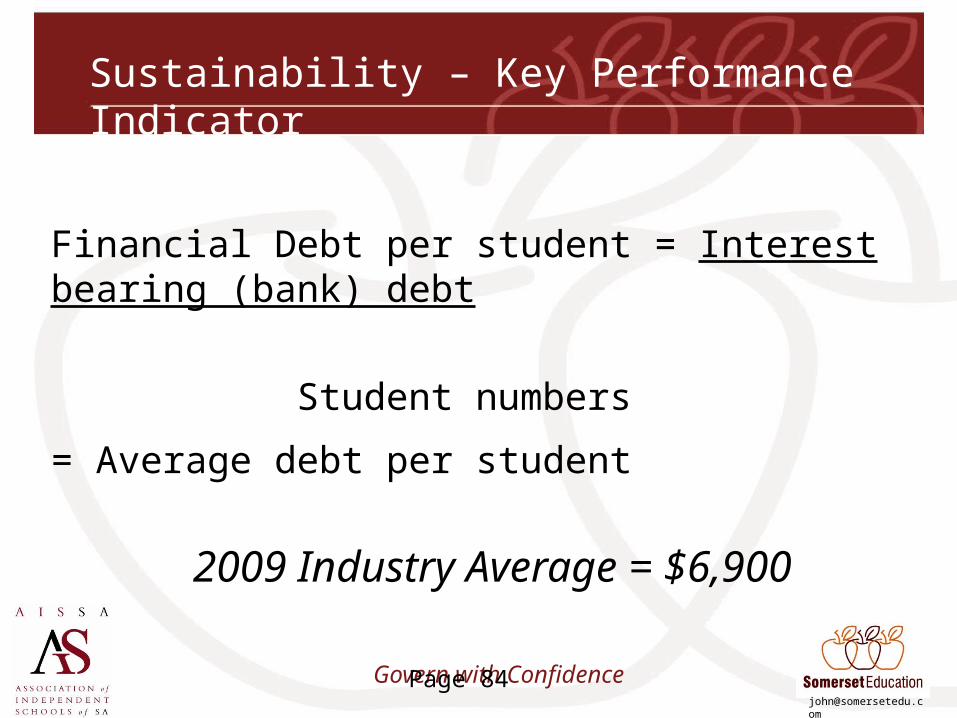
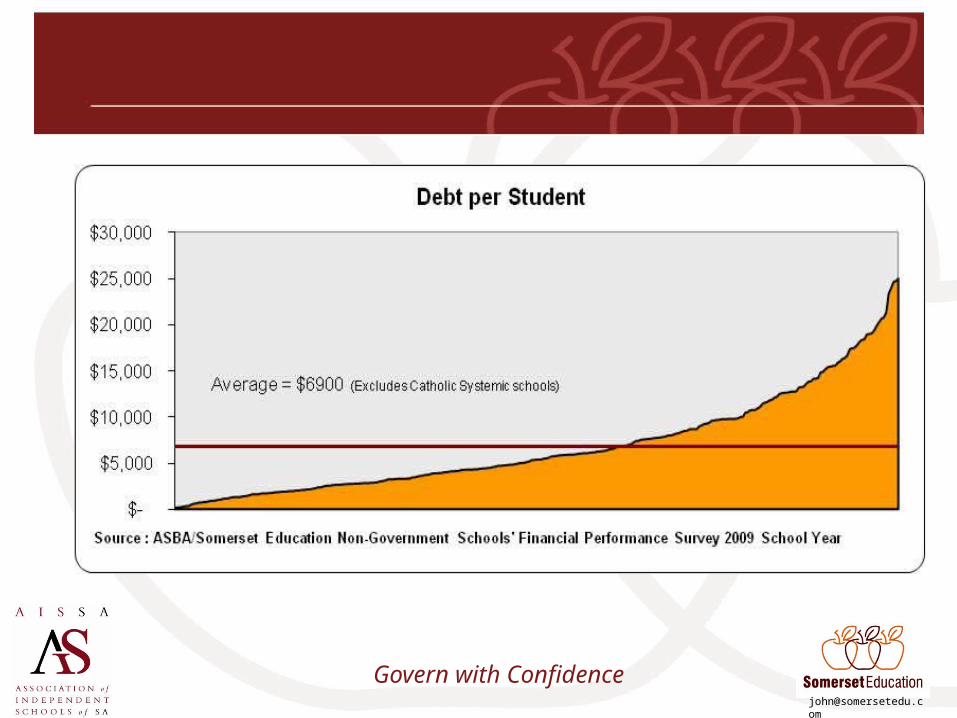
Sustainability – Key Performance Indicator
Financial Debt per student = Interest bearing (bank) debt
Student numbers
= Average debt per student
2009 Industry Average = $6,900
Govern with Confidence
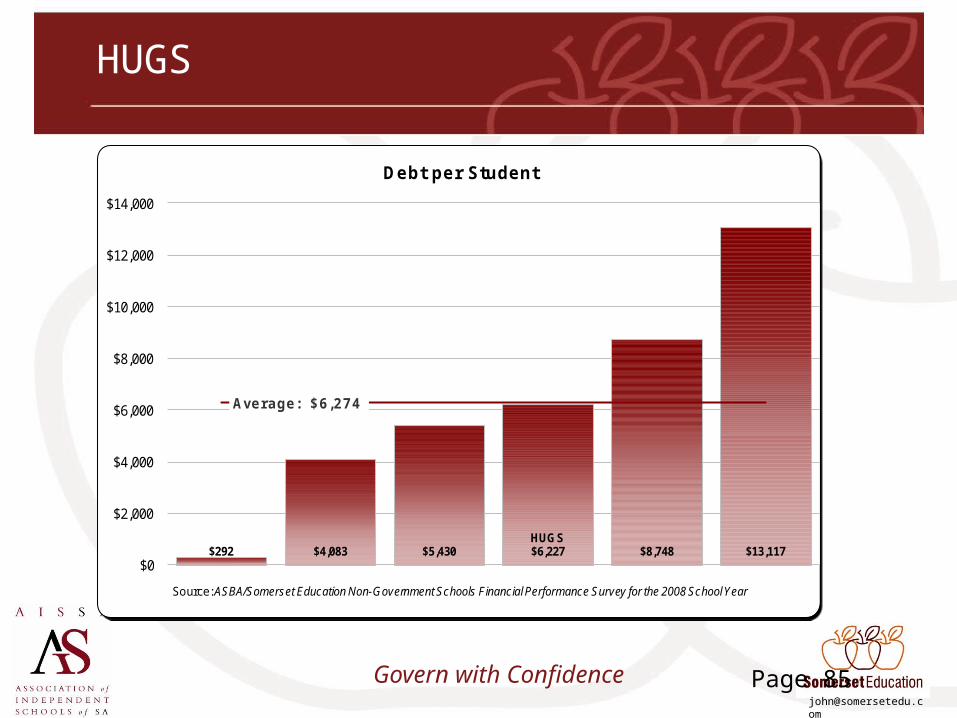
HUGS
Page 85
$292 $4,083 $5,430HUGS$6,227 $8,748 $13,117
Average: $6,274
$0
$2,000
$4,000
$6,000
$8,000
$10,000
$12,000
$14,000
Debt per Student
Source: ASBA/Somerset Education Non-Government Schools Financial Performance Survey for the 2008 School Year
Govern with Confidence
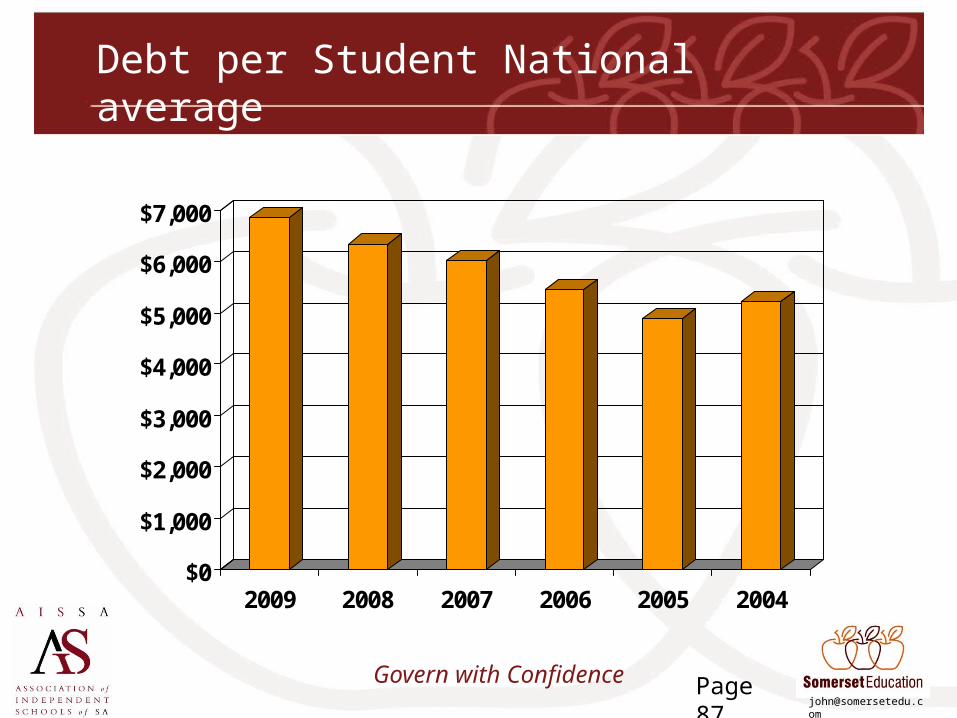
Debt per Student National average
$0
$1,000
$2,000
$3,000
$4,000
$5,000
$6,000
$7,000
2009 2008 2007 2006 2005 2004
Page 87
Govern with ConfidencePage 88
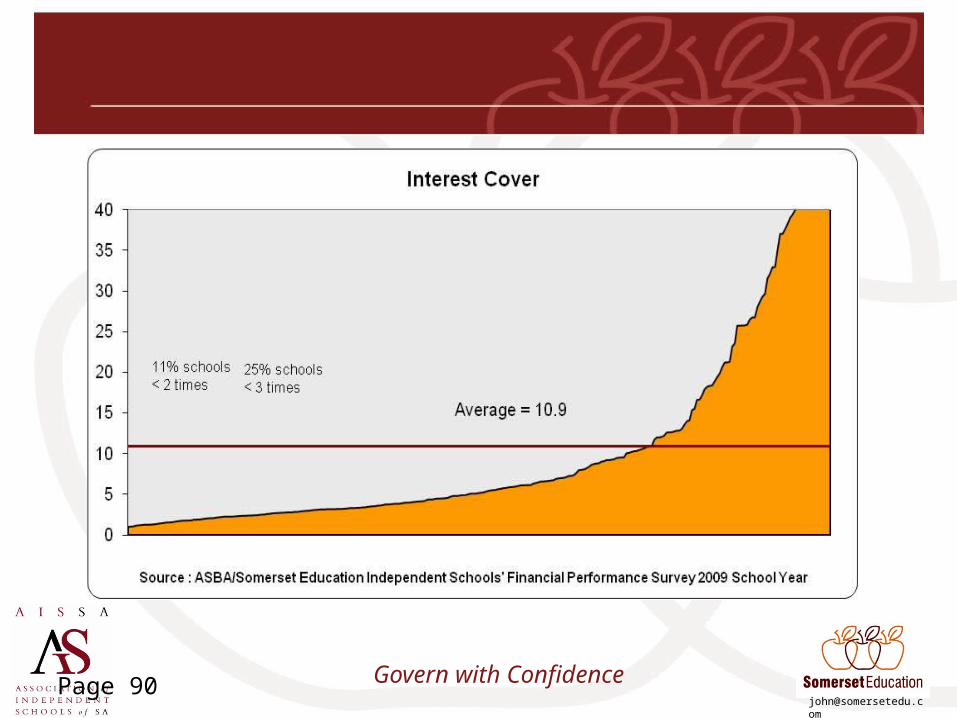
Sustainability – Interest Cover
Earnings before interest and depreciation Interest expense
= Number of times the school can meet its interest expense
Rule of thumb 2 to 3 times (refer to you bank’s policies)
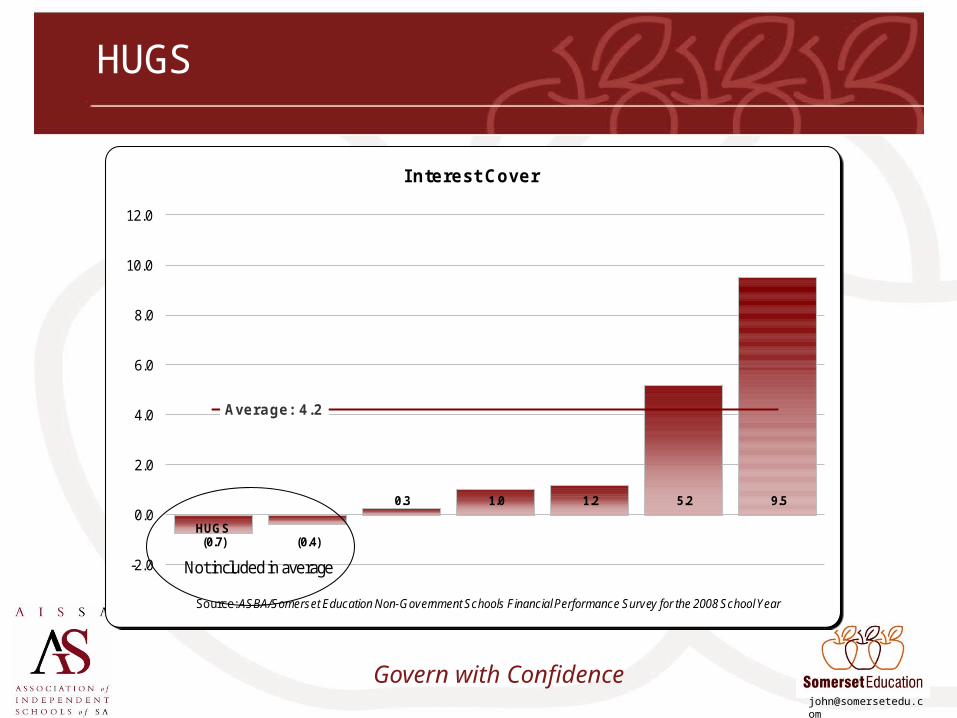
Govern with Confidence
HUGS(0.7) (0.4)
0.3 1.0 1.2 5.2 9.5
Average: 4.2
-2.0
0.0
2.0
4.0
6.0
8.0
10.0
12.0
I nterest Cover
Source: ASBA/Somerset Education Non-Government Schools Financial Performance Survey for the 2008 School Year
Not included in average
HUGS
Govern with Confidence
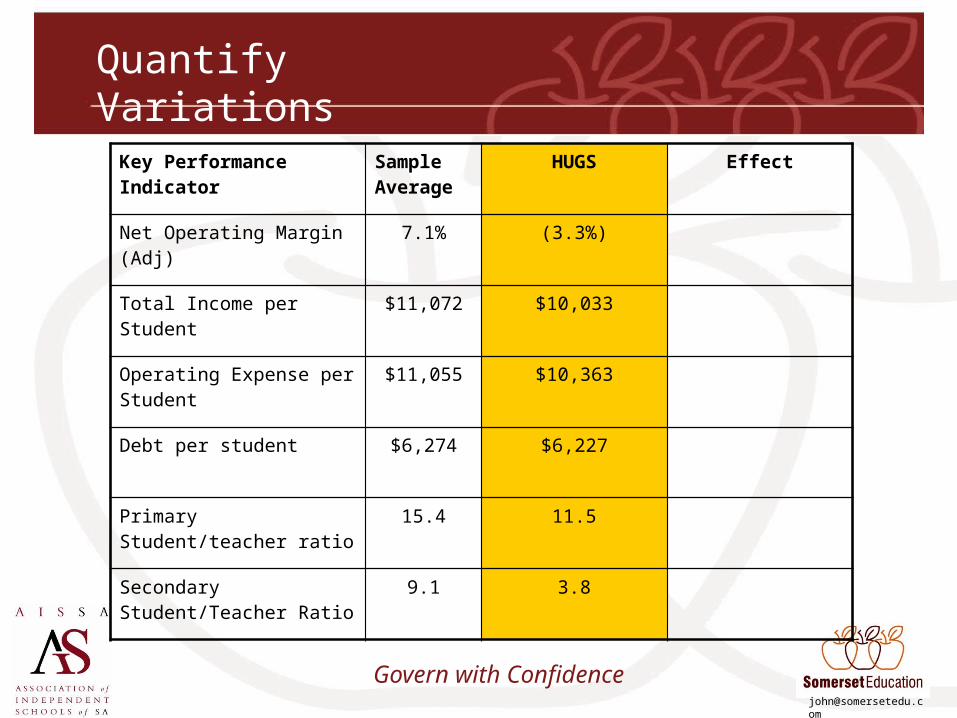
Quantify Variations
Key Performance Indicator Sample Average
HUGS Effect
Net Operating Margin (Adj) 7.1% (3.3%)
Total Income per Student $11,072 $10,033
Operating Expense per Student
$11,055 $10,363
Debt per student $6,274 $6,227
Primary Student/teacher ratio
15.4 11.5
Secondary Student/Teacher Ratio
9.1 3.8
Govern with Confidence
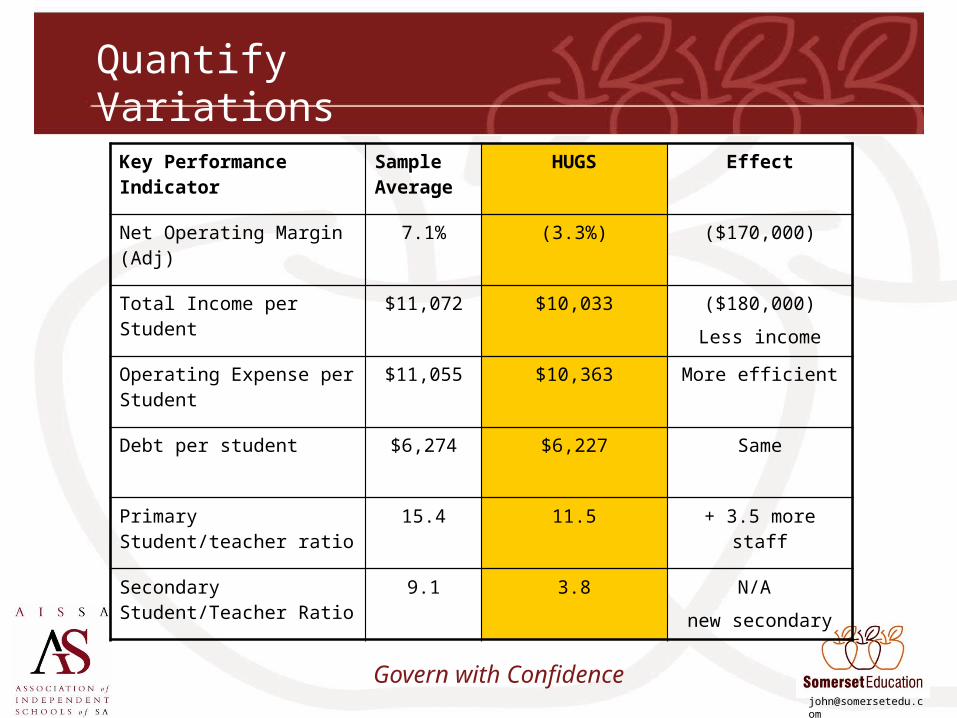
Quantify Variations
Key Performance Indicator Sample Average
HUGS Effect
Net Operating Margin (Adj) 7.1% (3.3%) ($170,000)
Total Income per Student $11,072 $10,033 ($180,000)
Less income
Operating Expense per Student
$11,055 $10,363 More efficient
Debt per student $6,274 $6,227 Same
Primary Student/teacher ratio
15.4 11.5 + 3.5 more staff
Secondary Student/Teacher Ratio
9.1 3.8 N/A
new secondary
Govern with Confidence
Limitations of Benchmarks
• Different participants at different stages of development and with different ranges of services.
• Consistency in accounting.
• Ratios only as good as data (Garbage In Garbage Out)
Govern with Confidence
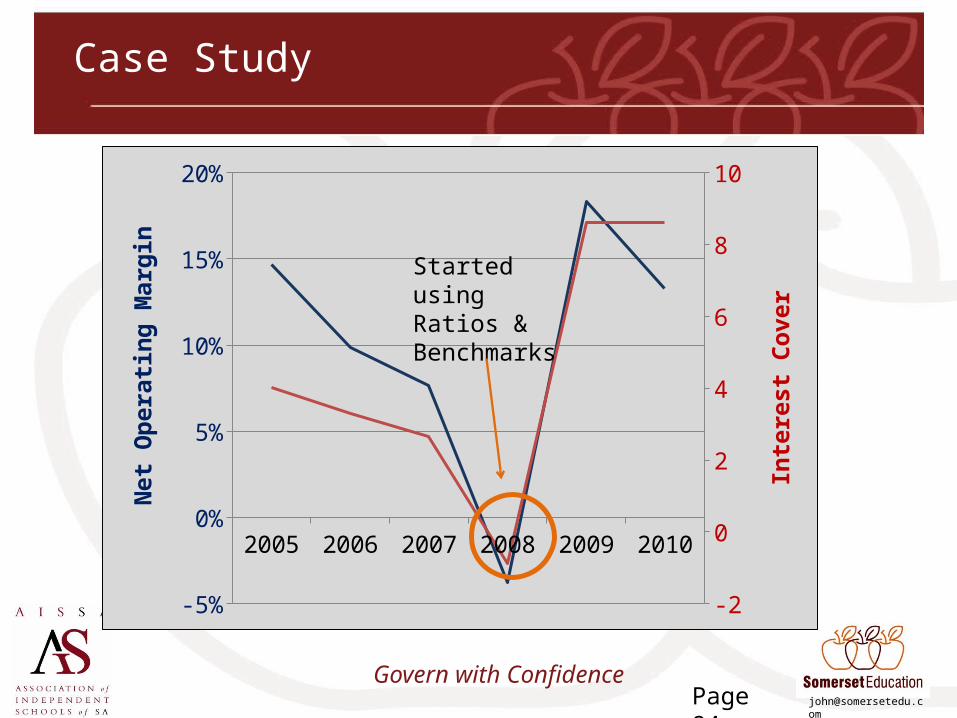
Case Study
Page 94
2005 2006 2007 2008 2009 2010
-5%
0%
5%
10%
15%
20%
-2
0
2
4
6
8
10N
et O
pera
ting
Mar
gin
Inte
rest
Cov
er
Started using Ratios & Benchmarks
Govern with ConfidencePage 95
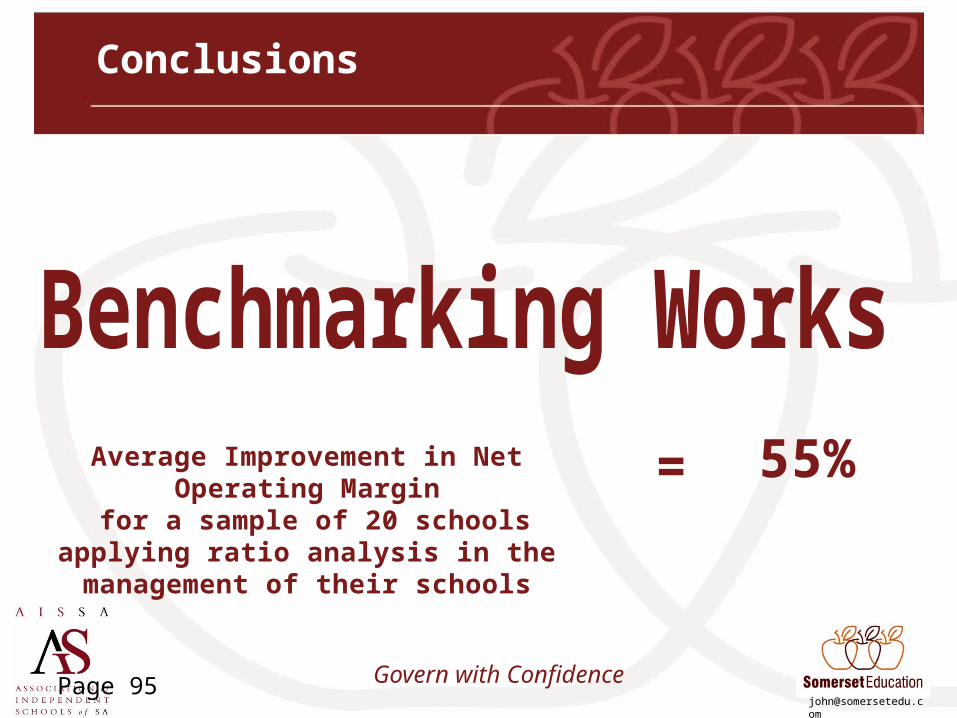
Conclusions
Average Improvement in Net Operating Margin for a sample of 20 schools applying ratio
analysis in the management of their schools
= 55%
Govern with Confidence
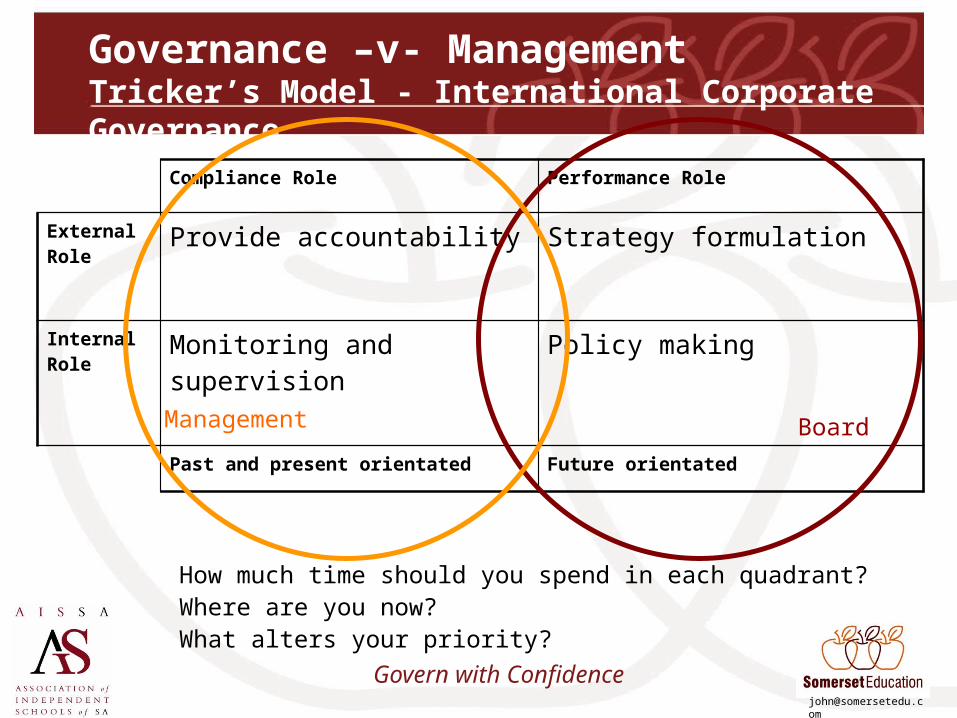
Governance –v- ManagementTricker’s Model - International Corporate Governance
Compliance Role Performance Role
External Role
Provide accountability Strategy formulation
Internal Role
Monitoring and supervision Policy making
Past and present orientated Future orientated
How much time should you spend in each quadrant?Where are you now?What alters your priority?
BoardManagement
Govern with Confidence
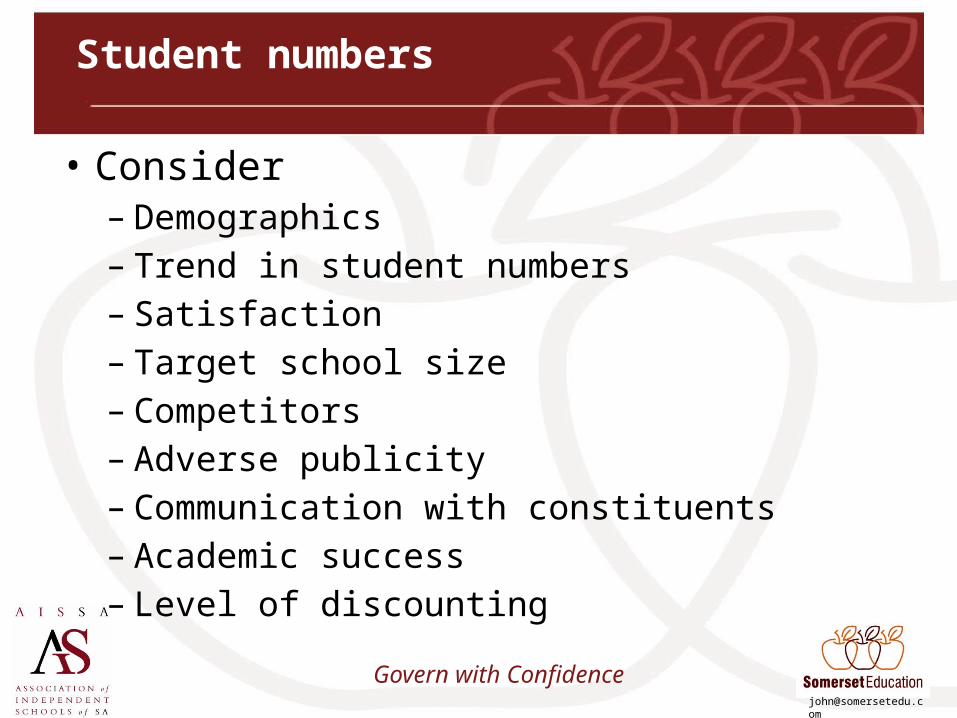
Student numbers
• Consider – Demographics– Trend in student numbers– Satisfaction– Target school size– Competitors– Adverse publicity– Communication with constituents– Academic success– Level of discounting
Govern with Confidence
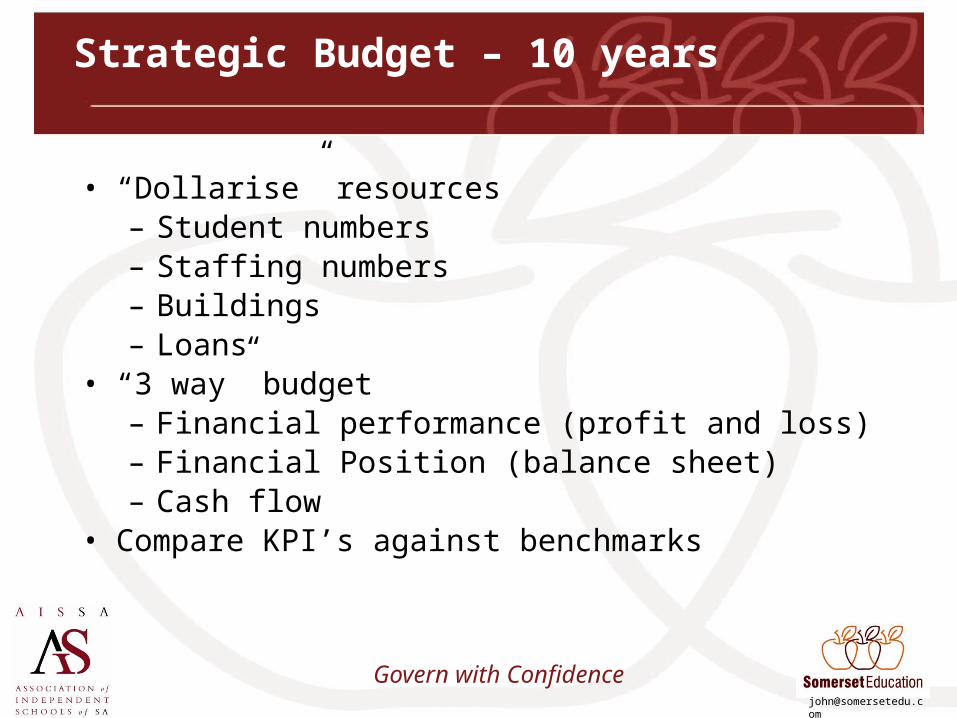
Strategic Budget – 10 years
• “Dollarise” resources– Student numbers– Staffing numbers– Buildings– Loans
• “3 way” budget– Financial performance (profit and loss)– Financial Position (balance sheet)– Cash flow
• Compare KPI’s against benchmarks
Govern with Confidence
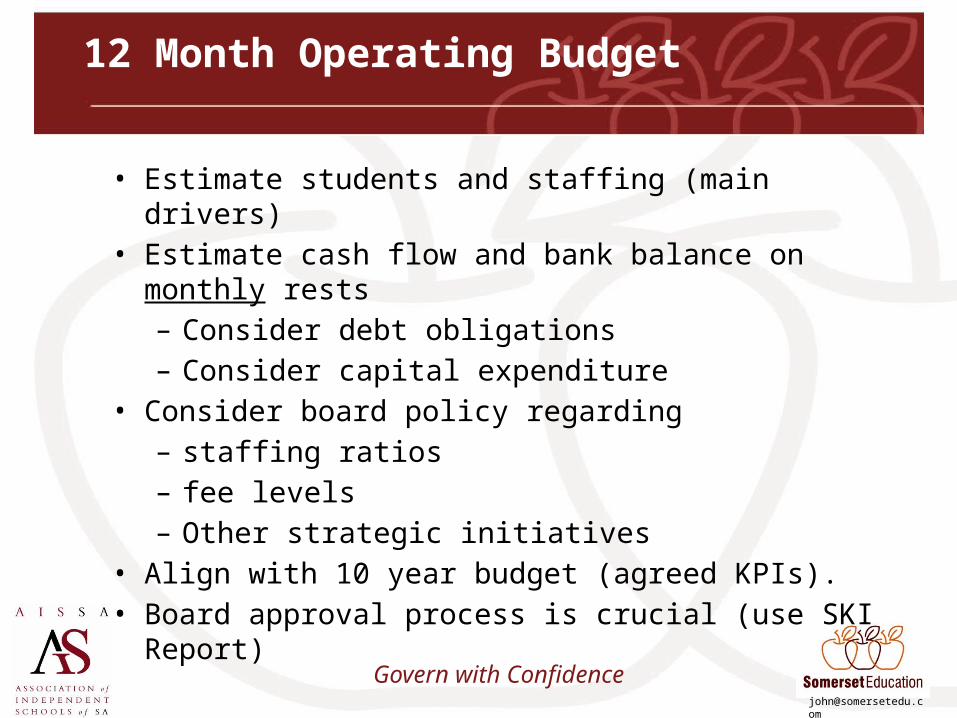
12 Month Operating Budget
• Estimate students and staffing (main drivers)• Estimate cash flow and bank balance on monthly rests
– Consider debt obligations– Consider capital expenditure
• Consider board policy regarding – staffing ratios– fee levels– Other strategic initiatives
• Align with 10 year budget (agreed KPIs).• Board approval process is crucial (use SKI Report)
Govern with Confidence
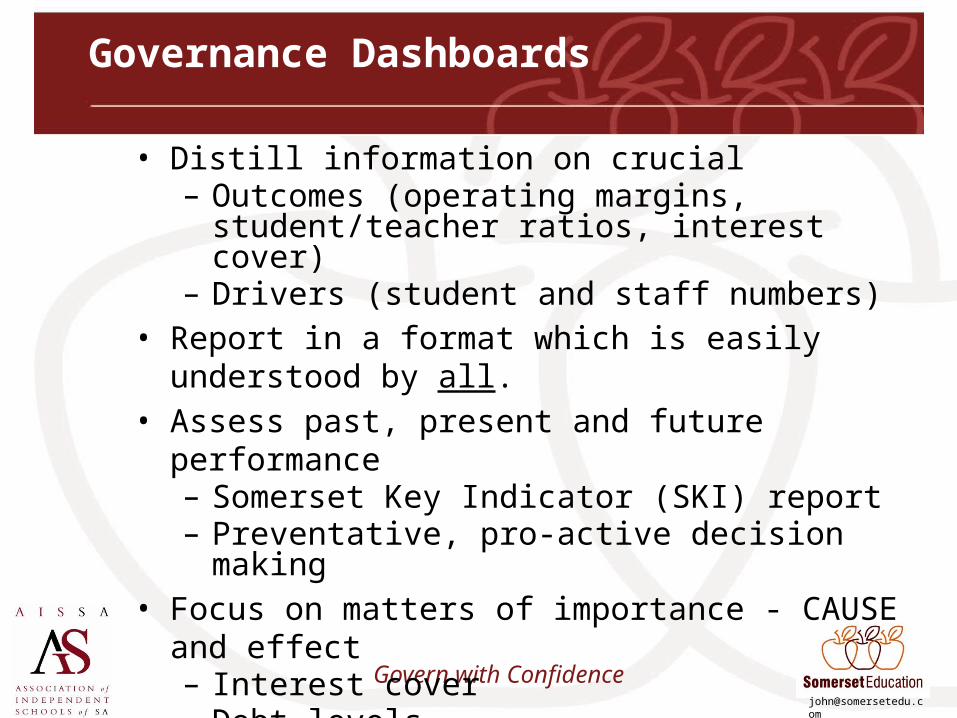
Governance Dashboards
• Distill information on crucial– Outcomes (operating margins, student/teacher ratios,
interest cover)– Drivers (student and staff numbers)
• Report in a format which is easily understood by all.• Assess past, present and future performance
– Somerset Key Indicator (SKI) report– Preventative, pro-active decision making
• Focus on matters of importance - CAUSE and effect– Interest cover– Debt levels– Operating margins– Staffing ratios
Page 102
Developed by
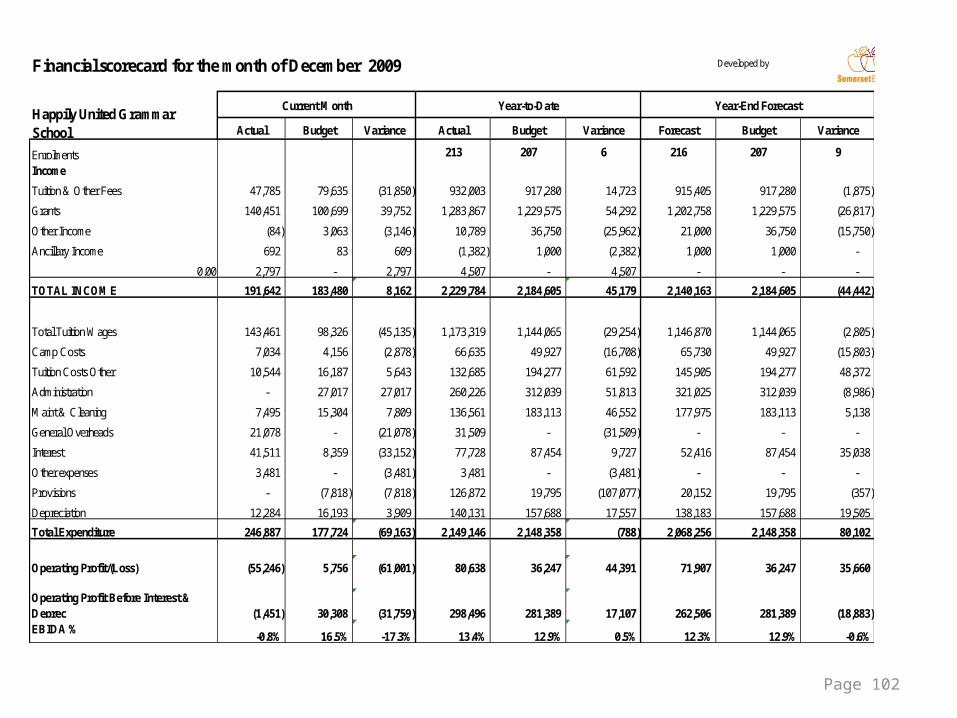
Actual Budget Variance Actual Budget Variance Forecast Budget Variance
Enrolments 213 207 6 216 207 9
Income
Tuition & Other Fees 47,785 79,635 (31,850) 932,003 917,280 14,723 915,405 917,280 (1,875)
Grants 140,451 100,699 39,752 1,283,867 1,229,575 54,292 1,202,758 1,229,575 (26,817)
Other Income (84) 3,063 (3,146) 10,789 36,750 (25,962) 21,000 36,750 (15,750)
Ancillary Income 692 83 609 (1,382) 1,000 (2,382) 1,000 1,000 -
0.00 2,797 - 2,797 4,507 - 4,507 - - -
TOTAL INCOME 191,642 183,480 8,162 2,229,784 2,184,605 45,179 2,140,163 2,184,605 (44,442)
Total Tuition Wages 143,461 98,326 (45,135) 1,173,319 1,144,065 (29,254) 1,146,870 1,144,065 (2,805)
Camp Costs 7,034 4,156 (2,878) 66,635 49,927 (16,708) 65,730 49,927 (15,803)
Tuition Costs Other 10,544 16,187 5,643 132,685 194,277 61,592 145,905 194,277 48,372
Administration - 27,017 27,017 260,226 312,039 51,813 321,025 312,039 (8,986)
Maint & Cleaning 7,495 15,304 7,809 136,561 183,113 46,552 177,975 183,113 5,138
General Overheads 21,078 - (21,078) 31,509 - (31,509) - - -
Interest 41,511 8,359 (33,152) 77,728 87,454 9,727 52,416 87,454 35,038
Other expenses 3,481 - (3,481) 3,481 - (3,481) - - -
Provisions - (7,818) (7,818) 126,872 19,795 (107,077) 20,152 19,795 (357)
Depreciation 12,284 16,193 3,909 140,131 157,688 17,557 138,183 157,688 19,505
Total Expenditure 246,887 177,724 (69,163) 2,149,146 2,148,358 (788) 2,068,256 2,148,358 80,102
Operating Profit/(Loss) (55,246) 5,756 (61,001) 80,638 36,247 44,391 71,907 36,247 35,660
Operating Profit Before Interest & Deprec (1,451) 30,308 (31,759) 298,496 281,389 17,107 262,506 281,389 (18,883) EBIDA %
-0.8% 16.5% -17.3% 13.4% 12.9% 0.5% 12.3% 12.9% -0.6%
Financial scorecard for the month of December 2009
Current Month Year-to-Date Year-End ForecastHappily United Grammar School
Page 103
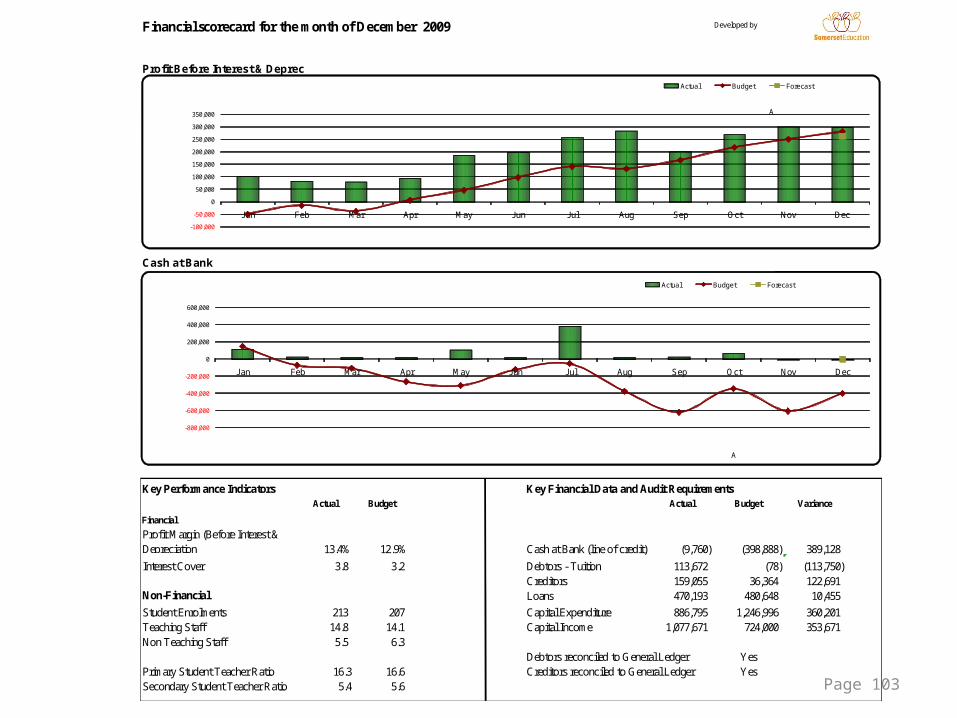
Developed by
Profit Before Interest & Deprec
Cash at Bank
Key Performance Indicators Key Financial Data and Audit RequirementsActual Budget Actual Budget Variance
Financial
Profit Margin (Before Interest & Depreciation 13.4% 12.9% Cash at Bank (line of credit) (9,760) (398,888) 389,128
Interest Cover 3.8 3.2 Debtors - Tuition 113,672 (78) (113,750) Creditors 159,055 36,364 122,691
Non-Financial Loans 470,193 480,648 10,455
Student Enrolments 213 207 Capital Expenditure 886,795 1,246,996 360,201 Teaching Staff 14.8 14.1 Capital Income 1,077,671 724,000 353,671 Non Teaching Staff 5.5 6.3
Debtors reconciled to General Ledger YesPrimary Student Teacher Ratio 16.3 16.6 Creditors reconciled to General Ledger YesSecondary Student Teacher Ratio 5.4 5.6
Financial scorecard for the month of December 2009
-100,000
-50,000
0
50,000
100,000
150,000
200,000
250,000
300,000
350,000
Jan Feb Mar Apr May Jun Jul Aug Sep Oct Nov Dec
Actual Budget Forecast
A
-800,000
-600,000
-400,000
-200,000
0
200,000
400,000
600,000
Jan Feb Mar Apr May Jun Jul Aug Sep Oct Nov Dec
Actual Budget Forecast
A
Govern with Confidence
Early Warning Systems
1. Learn from the Past – Participate in the Survey
2. Understand the Present – Board Reporting
3. Risk assess the Future – SKI Report
Govern with Confidence
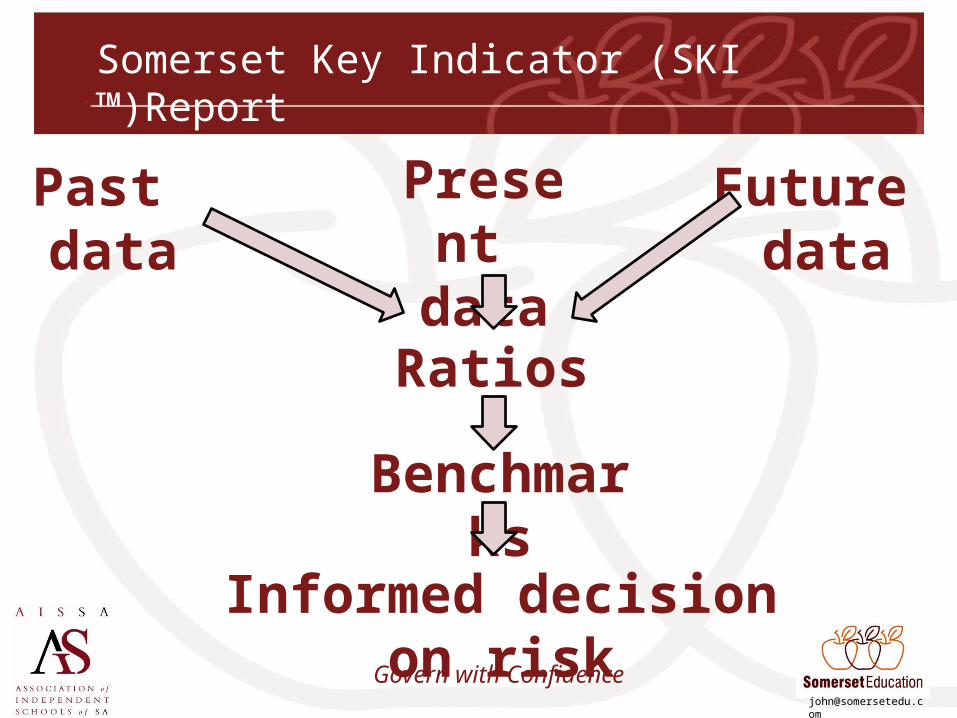
Somerset Key Indicator (SKI ™)Report
Present data
Past data
Future data
Benchmarks
Ratios
Informed decision on risk
Govern with Confidence
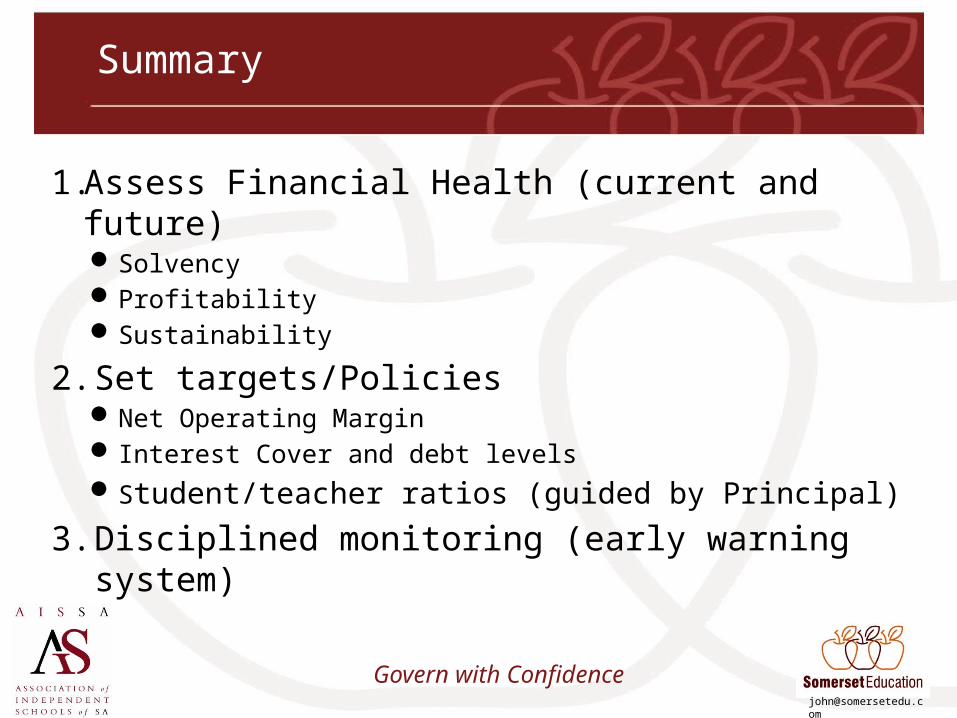
Summary
1. Assess Financial Health (current and future)SolvencyProfitabilitySustainability
2. Set targets/PoliciesNet Operating Margin Interest Cover and debt levelsStudent/teacher ratios (guided by Principal)
3. Disciplined monitoring (early warning system)
Govern with Confidence
For further details contact
John Somerset – Director of Somerset Education
Email [email protected] Internet www.somerseteducation.net
Video http://vimeo.com/24409169
Telephones 1300 781 968 (Australia)+61 7 3263 5300 (International)0417 618 899 (Cell phone)
Address GPO Box 3273Brisbane, QueenslandAustralia 4001


![[Presenticcon Pilot] Skhole pm km itb nayasari aissa](https://img.pdfslide.us/doc/110x75/55920cee1a28ab635e8b4636/presenticcon-pilot-skhole-pm-km-itb-nayasari-aissa.jpg)