Embed Size (px)
Citation preview
John Wood Group PLC Half year results for the six months to 30 June 2010
First half performance in line with expectations; the board looks to the second half and
2011 with increasing confidence
John Wood Group PLC (“Wood Group” or the “Group”) is a market leader in engineering design, production enhancement and support, and industrial gas turbine services for customers in the oil & gas and power generation industries around the world. Wood Group businesses employ approximately 29,000 people1 and operate in 50 countries. Financial Highlights
• Revenue of $2,409.7m (2009: $2,411.4m) • EBITA2 of $153.3m (2009: $187.7m) • Group EBITA margin of 6.4% (2009: 7.8%) • Profit before tax of $122.6m (2009: $160.8m) • Basic earnings per share of 15.8 cents (2009: 21.1 cents) • Adjusted diluted earnings per ordinary share3 of 17.4 cents (2009: 22.3 cents) • Interim dividend of 3.4 cents (2009: 3.1 cents)
Group Highlights
• The Board looks to the second half and 2011 with increasing confidence o Engineering seeing higher bidding volumes and increasing backlog o Production Facilities maintaining good activity levels o Well Support delivering record margin performance o GTS anticipating improvement in performance in the second half
Operating Highlights Engineering & Production Facilities
• Engineering o As anticipated, full year 2010 revenue will be down on 2009, with an
expectation of improvement in the second half and into 2011 o Seeing higher bidding volumes and increasing backlog o Subsea and pipeline activities continue to perform well o Continuing to develop international reach
• Production Facilities
o Maintaining good activity across longer term contracts in the North Sea. Secured contract extensions with Hess and Total, and new contract with Chevron
o Increasing presence in international markets, with contract extensions in Brunei and Equatorial Guinea and new contracts in Australia
Well Support • Strong performance, driven by improved activity and good cost discipline • US gas related activities benefiting from rising US rig count • Electric Submersible Pumps (“ESP”) and Pressure Control developing their
international presence, including strengthening positions in Africa, the Middle East and South America
• Anticipate slightly improved EBITA in the second half
Gas Turbine Services • First half performance impacted by lower Power Solutions activity and reduced
maintenance spending in North America and Europe • Action being taken to reduce cost base • Power Solutions continues to have a good prospect list and hope to achieve
project awards in the second half • Overall, expect improvement in performance in the second half
In their half year report, Sir Ian Wood, Chairman, and Allister Langlands, Chief Executive, of Wood Group, state: “Overall, year to date performance is in line with expectations and we believe results for the full year will also be in line with expectations. The Board looks to the second half and 2011 with increasing confidence. We continue to pursue a number of opportunities to expand our geographic footprint in key growth markets. Looking further ahead, we believe the fundamentals for oil & gas services and gas fired power generation remain strong and we are well positioned to deliver good longer term growth.” Information: Wood Group Alan Semple 01224 851 000 Nick Gilman Carolyn Smith Brunswick Patrick Handley 020 7404 5959 Elizabeth Adams Notes For footnotes see page 15
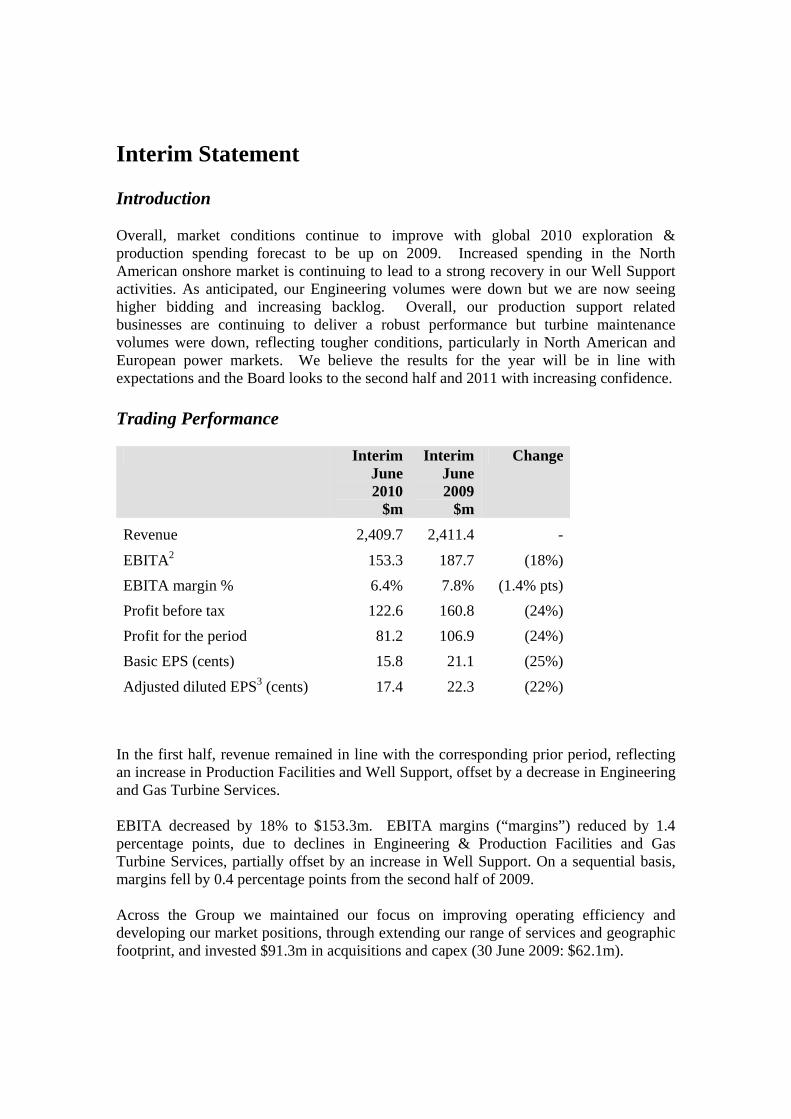
Interim Statement Introduction Overall, market conditions continue to improve with global 2010 exploration & production spending forecast to be up on 2009. Increased spending in the North American onshore market is continuing to lead to a strong recovery in our Well Support activities. As anticipated, our Engineering volumes were down but we are now seeing higher bidding and increasing backlog. Overall, our production support related businesses are continuing to deliver a robust performance but turbine maintenance volumes were down, reflecting tougher conditions, particularly in North American and European power markets. We believe the results for the year will be in line with expectations and the Board looks to the second half and 2011 with increasing confidence. Trading Performance Interim
June 2010
$m
Interim June 2009
$m
Change
Revenue 2,409.7 2,411.4 -
EBITA2 153.3 187.7 (18%) EBITA margin % 6.4% 7.8% (1.4% pts) Profit before tax 122.6 160.8 (24%) Profit for the period 81.2 106.9 (24%) Basic EPS (cents) 15.8 21.1 (25%)
Adjusted diluted EPS3 (cents) 17.4 22.3 (22%)
In the first half, revenue remained in line with the corresponding prior period, reflecting an increase in Production Facilities and Well Support, offset by a decrease in Engineering and Gas Turbine Services. EBITA decreased by 18% to $153.3m. EBITA margins (“margins”) reduced by 1.4 percentage points, due to declines in Engineering & Production Facilities and Gas Turbine Services, partially offset by an increase in Well Support. On a sequential basis, margins fell by 0.4 percentage points from the second half of 2009. Across the Group we maintained our focus on improving operating efficiency and developing our market positions, through extending our range of services and geographic footprint, and invested $91.3m in acquisitions and capex (30 June 2009: $62.1m).
Dividend Reflecting continuing confidence in our longer term outlook, we have declared a 10% increase in the interim dividend to 3.4 cents (2009: 3.1 cents). The dividend will be paid on 23 September 2010 to shareholders on the Register at 3 September 2010. Markets Overall, 2010 E&P spending is forecast to be up on 2009. We are seeing improved activity in shorter term capex projects, in development drilling related areas and increased bidding volumes for longer term upstream projects. Oil prices have remained in the $65- $85 range, which we believe is generally favourable for operators.
Approximately 4% of the Group’s revenue, primarily in topsides and subsea engineering, is related to deepwater Gulf of Mexico operations and we do not anticipate any material financial impact from the drilling moratorium, following the Macondo incident, in the current year. US onshore activity has benefitted from a stronger than anticipated rig count. We believe recovering energy demand, reserve depletion and the development of more challenging reservoirs provide strong longer term market fundamentals for our services and products. The power market has been less active in 2010, particularly in North America and Europe, driven by excess generation capacity and generally poor economics for the electricity generation sector, but the longer term fundamentals for gas fired power generation remain strong.
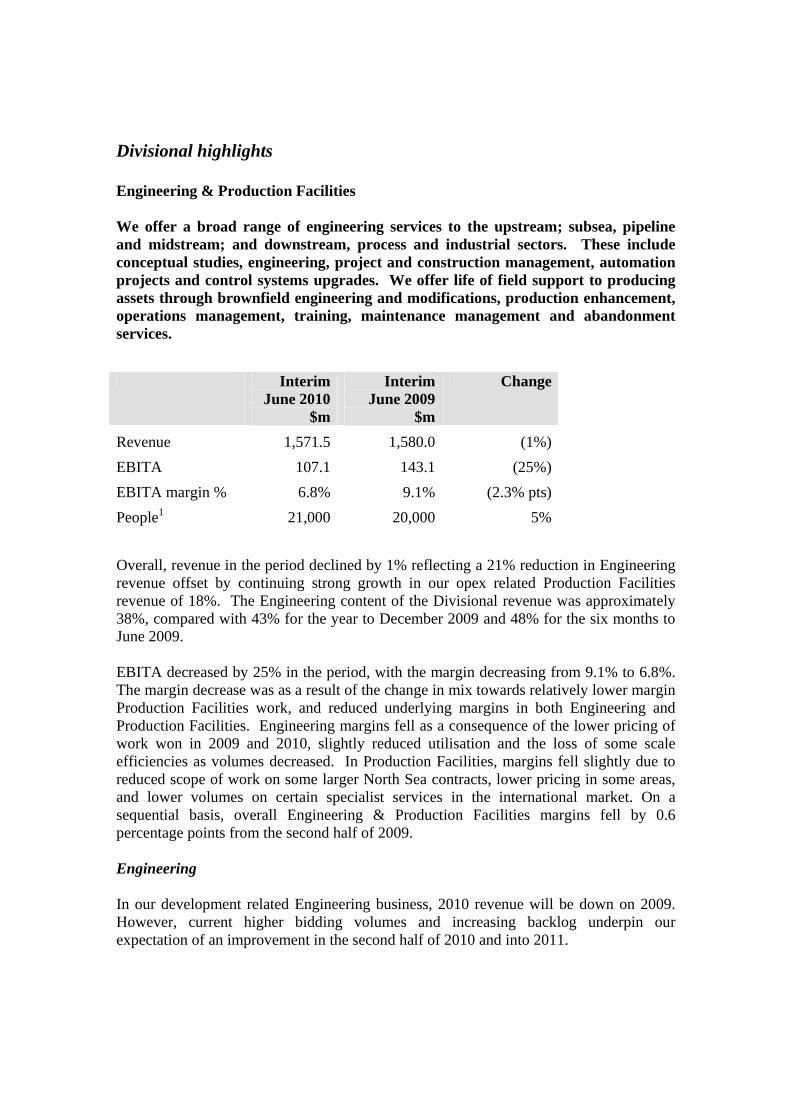
Divisional highlights Engineering & Production Facilities We offer a broad range of engineering services to the upstream; subsea, pipeline and midstream; and downstream, process and industrial sectors. These include conceptual studies, engineering, project and construction management, automation projects and control systems upgrades. We offer life of field support to producing assets through brownfield engineering and modifications, production enhancement, operations management, training, maintenance management and abandonment services. Interim
June 2010 $m
Interim June 2009
$m
Change
Revenue 1,571.5 1,580.0 (1%)EBITA 107.1 143.1 (25%)EBITA margin % 6.8% 9.1% (2.3% pts)People1 21,000 20,000 5% Overall, revenue in the period declined by 1% reflecting a 21% reduction in Engineering revenue offset by continuing strong growth in our opex related Production Facilities revenue of 18%. The Engineering content of the Divisional revenue was approximately 38%, compared with 43% for the year to December 2009 and 48% for the six months to June 2009. EBITA decreased by 25% in the period, with the margin decreasing from 9.1% to 6.8%. The margin decrease was as a result of the change in mix towards relatively lower margin Production Facilities work, and reduced underlying margins in both Engineering and Production Facilities. Engineering margins fell as a consequence of the lower pricing of work won in 2009 and 2010, slightly reduced utilisation and the loss of some scale efficiencies as volumes decreased. In Production Facilities, margins fell slightly due to reduced scope of work on some larger North Sea contracts, lower pricing in some areas, and lower volumes on certain specialist services in the international market. On a sequential basis, overall Engineering & Production Facilities margins fell by 0.6 percentage points from the second half of 2009. Engineering In our development related Engineering business, 2010 revenue will be down on 2009. However, current higher bidding volumes and increasing backlog underpin our expectation of an improvement in the second half of 2010 and into 2011.
Engineering headcount of 6,600 at June was marginally up on December 2009 having dipped slightly in the first quarter of 2010. Headcount at June 2009 was 7,700. Upstream activities represented around 40% of Engineering revenue. Although we are still seeing some project delays, we have a good prospect list and increasing backlog and are active on a number of contracts in the pre-FEED and FEED stages. We are currently working on projects around the world, helping develop our international reach, including projects in Africa for Noble, Tullow and ENI, Asia Pacific for Woodside and the Middle East for Saudi Aramco. In addition, we maintain a market leading position in North America and are active on projects in the US, both onshore and in the deepwater, for Chevron, Exxon and Hess, and in Canada for Cenovus and ConocoPhillips. Our subsea, pipeline and midstream activities have increased to around 40% of Engineering revenue. Spending in the subsea and pipeline area is maintaining its momentum and we have been active across all of our locations. We are currently working on over 20 major subsea projects globally, with recent awards from Apache in Australia, Exxon in the Gulf of Mexico and Total in Nigeria. Investment in onshore pipeline infrastructure to link unconventional gas developments to end markets in the US remains robust. We are working on a number of projects, including a 200+ mile pipeline project in the north east US. We are continuing to broaden our geographic focus for onshore pipeline activity, and are active on a pipeline engineering services project for Ecopetrol in Colombia. Downstream, process and industrial activities have reduced to 20% of Engineering revenue. Excess capacity in the North American refining market continues to suppress demand. However, we are continuing to win projects related to refinery upgrades and revamps across the US. The process and industrial market in the US has been impacted by the wider recession and, although we have seen lower activity levels, we expect conditions to improve in the second half. Our Automation business remains strong as clients focus on opportunities to increase efficiencies and reduce costs. During the period we were awarded a contract to provide front end services to several Canadian oil sands projects, in addition to various control projects for deepwater and process facilities. We continue to progress our geographic expansion, focused on key markets in West Africa, the Middle East, where we completed the acquisition of a controlling interest in Al-Hejailan Consulting, a Saudi engineering company, and Asia Pacific. In clean energy, we continue to be active on a number of CO2 projects in North America and the Middle East. We are also continuing to develop our offshore renewables capability in both wind and wave projects. Production Facilities Production Facilities provides a broad range of services, typically in support of customers’ ongoing production operations. Activity levels are driven by customers’
focus on maintaining production levels, lowering unit production costs and ensuring asset integrity. Headcount of 14,400 at 30 June was broadly flat compared to December 2009. Headcount at 30 June 2009 was 12,300. The increase in headcount as a result of the acquisition of Baker Energy is the principal driver of the movement since June 2009. The North Sea is our largest Production Facilities market, representing around 55% of revenue and we are the leading maintenance, modifications and operations contractor in the region. We continue to be active for a range of clients across the North Sea and successfully renewed contracts with Hess and Total in the period, and secured a new contract with Chevron. In addition, we remain active in our duty holder business, providing support to Centrica, Ithaca and Premier. We are continuing to increase our presence in international markets, which now represent around 45% of revenue. We are seeing strong demand for our services, particularly as new developments come on stream and we can help meet our customers’ need for the skilled resources necessary to commission, operate and maintain their facilities. Baker Energy, acquired last year, has now been integrated with our existing operations, strengthening our US business and expanding international operations, especially in Africa. In Latin America and the Caribbean, we have longer term contracts supporting Chevron and Statoil in Brazil, BP and Ecopetrol in Colombia and BP and BG in Trinidad. In West Africa we have extended longer term contracts with Hess and Marathon in Equatorial Guinea and secured work in Angola with BP and Chevron. We are looking at further steps to develop our business in the region. In Australia, we have a broad capability to deliver engineering and production support services to national and international customers in this important and growing market. We continue to be active on a number of longer term agreements with customers including ENI and Woodside. In addition, our new joint venture with Wagners, focused on the coal seam methane market, has secured its first contract. Elsewhere in Asia Pacific, we have extended our longer term support contract with Brunei Shell Petroleum.
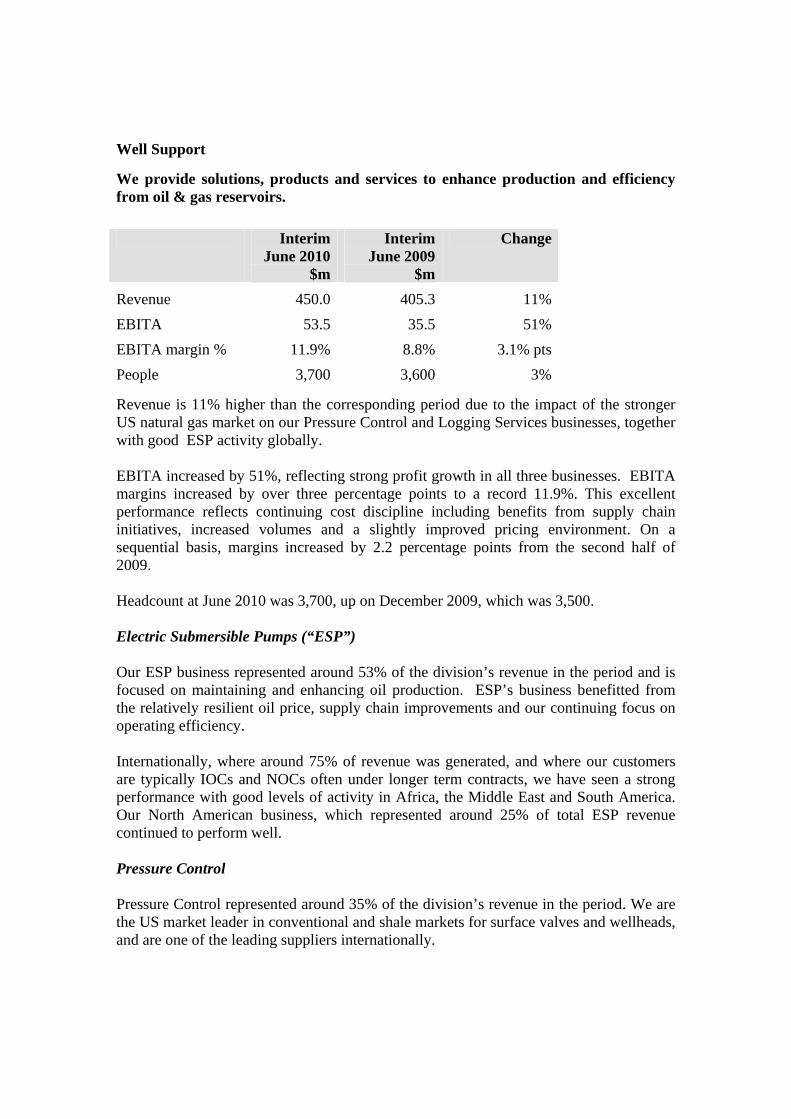
Well Support We provide solutions, products and services to enhance production and efficiency from oil & gas reservoirs. Interim
June 2010 $m
Interim June 2009
$m
Change
Revenue 450.0 405.3 11%EBITA 53.5 35.5 51%EBITA margin % 11.9% 8.8% 3.1% ptsPeople 3,700 3,600 3% Revenue is 11% higher than the corresponding period due to the impact of the stronger US natural gas market on our Pressure Control and Logging Services businesses, together with good ESP activity globally.
EBITA increased by 51%, reflecting strong profit growth in all three businesses. EBITA margins increased by over three percentage points to a record 11.9%. This excellent performance reflects continuing cost discipline including benefits from supply chain initiatives, increased volumes and a slightly improved pricing environment. On a sequential basis, margins increased by 2.2 percentage points from the second half of 2009. Headcount at June 2010 was 3,700, up on December 2009, which was 3,500. Electric Submersible Pumps (“ESP”) Our ESP business represented around 53% of the division’s revenue in the period and is focused on maintaining and enhancing oil production. ESP’s business benefitted from the relatively resilient oil price, supply chain improvements and our continuing focus on operating efficiency. Internationally, where around 75% of revenue was generated, and where our customers are typically IOCs and NOCs often under longer term contracts, we have seen a strong performance with good levels of activity in Africa, the Middle East and South America. Our North American business, which represented around 25% of total ESP revenue continued to perform well. Pressure Control Pressure Control represented around 35% of the division’s revenue in the period. We are the US market leader in conventional and shale markets for surface valves and wellheads, and are one of the leading suppliers internationally.
The US market represented around 65% of revenue in the period. The stronger than anticipated growth in the US rig count contributed to the increased US revenue. We expect the growth in US rig count to flatten in the second half. Activity outside the US contributed around 35% to Pressure Control’s revenue and features a number of longer term contracts, including agreements with both IOCs and NOCs. We are focused on growing our international business and have expanded our presence in Saudi Arabia, where we are continuing with the development of our manufacturing facility which will open in 2010. We are planning to add further manufacturing capacity in China to target increased revenue in the Eastern Hemisphere. Logging Services Our production focused slickline services and development focused cased hole electric wireline services represented around 12% of the division’s revenue in the period.
Markets in the US for onshore and offshore electric wireline services, which represent around half of Logging Services’ activity, improved in the first half contributing to increased revenue. Our slickline operations in the Gulf of Mexico and our electric wireline operations in Argentina continue to perform well. The improved volumes and the cost reduction measures taken in 2009 contributed to improved profitability. The Logging Services performance in the second half may be impacted by somewhat lower offshore activity in the Gulf of Mexico.
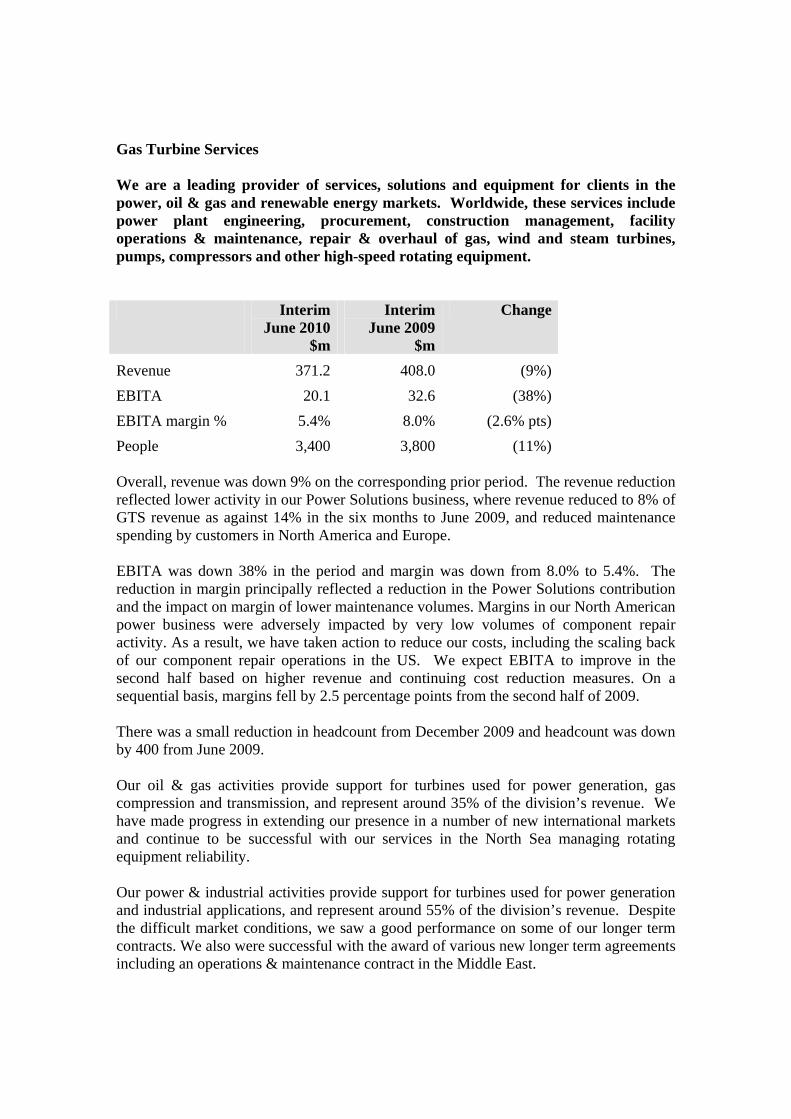
Gas Turbine Services We are a leading provider of services, solutions and equipment for clients in the power, oil & gas and renewable energy markets. Worldwide, these services include power plant engineering, procurement, construction management, facility operations & maintenance, repair & overhaul of gas, wind and steam turbines, pumps, compressors and other high-speed rotating equipment. Interim
June 2010 $m
Interim June 2009
$m
Change
Revenue 371.2 408.0 (9%)EBITA 20.1 32.6 (38%)EBITA margin % 5.4% 8.0% (2.6% pts)People 3,400 3,800 (11%) Overall, revenue was down 9% on the corresponding prior period. The revenue reduction reflected lower activity in our Power Solutions business, where revenue reduced to 8% of GTS revenue as against 14% in the six months to June 2009, and reduced maintenance spending by customers in North America and Europe. EBITA was down 38% in the period and margin was down from 8.0% to 5.4%. The reduction in margin principally reflected a reduction in the Power Solutions contribution and the impact on margin of lower maintenance volumes. Margins in our North American power business were adversely impacted by very low volumes of component repair activity. As a result, we have taken action to reduce our costs, including the scaling back of our component repair operations in the US. We expect EBITA to improve in the second half based on higher revenue and continuing cost reduction measures. On a sequential basis, margins fell by 2.5 percentage points from the second half of 2009. There was a small reduction in headcount from December 2009 and headcount was down by 400 from June 2009. Our oil & gas activities provide support for turbines used for power generation, gas compression and transmission, and represent around 35% of the division’s revenue. We have made progress in extending our presence in a number of new international markets and continue to be successful with our services in the North Sea managing rotating equipment reliability. Our power & industrial activities provide support for turbines used for power generation and industrial applications, and represent around 55% of the division’s revenue. Despite the difficult market conditions, we saw a good performance on some of our longer term contracts. We also were successful with the award of various new longer term agreements including an operations & maintenance contract in the Middle East.

We continue to focus on building up our engineering and operational capability to help increase our volume of work under longer term contracts and we are now supporting around 18,000 MW under longer term contracts (December 2009:17,000 MW). In Power Solutions, which represents around 10% of the division’s revenue, we have continued to see delays in the award of new contracts, in part due to funding issues, and as a result saw a significant reduction in profit contribution in the period. We continue to have a good prospect list and hope to achieve awards in the second half which would contribute to profit recovery in 2011.
Financial Review Financial Performance Interim
June 2010 $m
Interim June 2009
$m
Full year Dec 2009
$m
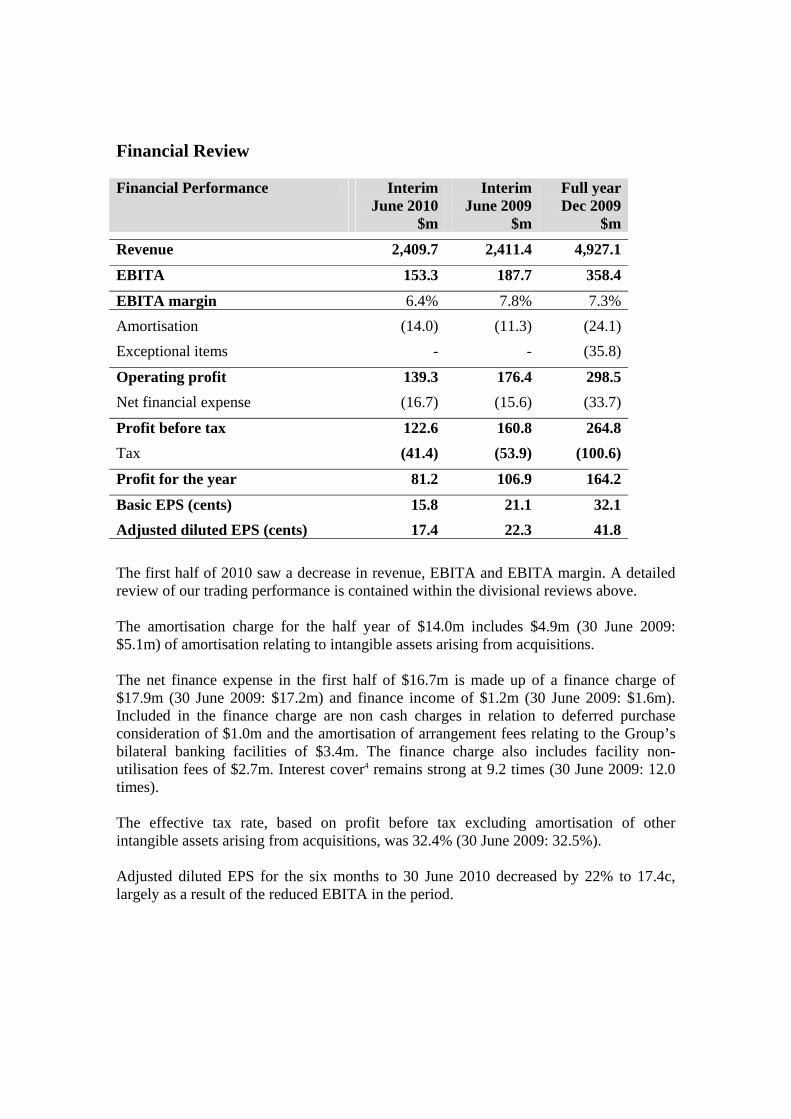
Revenue 2,409.7 2,411.4 4,927.1
EBITA 153.3 187.7 358.4
EBITA margin 6.4% 7.8% 7.3% Amortisation (14.0) (11.3) (24.1) Exceptional items - - (35.8)
Operating profit 139.3 176.4 298.5 Net financial expense (16.7) (15.6) (33.7)
Profit before tax 122.6 160.8 264.8 Tax (41.4) (53.9) (100.6)
Profit for the year 81.2 106.9 164.2
Basic EPS (cents) 15.8 21.1 32.1 Adjusted diluted EPS (cents) 17.4 22.3 41.8 The first half of 2010 saw a decrease in revenue, EBITA and EBITA margin. A detailed review of our trading performance is contained within the divisional reviews above. The amortisation charge for the half year of $14.0m includes $4.9m (30 June 2009: $5.1m) of amortisation relating to intangible assets arising from acquisitions. The net finance expense in the first half of $16.7m is made up of a finance charge of $17.9m (30 June 2009: $17.2m) and finance income of $1.2m (30 June 2009: $1.6m). Included in the finance charge are non cash charges in relation to deferred purchase consideration of $1.0m and the amortisation of arrangement fees relating to the Group’s bilateral banking facilities of $3.4m. The finance charge also includes facility non-utilisation fees of $2.7m. Interest cover4 remains strong at 9.2 times (30 June 2009: 12.0 times). The effective tax rate, based on profit before tax excluding amortisation of other intangible assets arising from acquisitions, was 32.4% (30 June 2009: 32.5%). Adjusted diluted EPS for the six months to 30 June 2010 decreased by 22% to 17.4c, largely as a result of the reduced EBITA in the period.
Cash flow and net debt Interim
June 2010 $m
Interim June 2009
$m
Full year Dec 2009
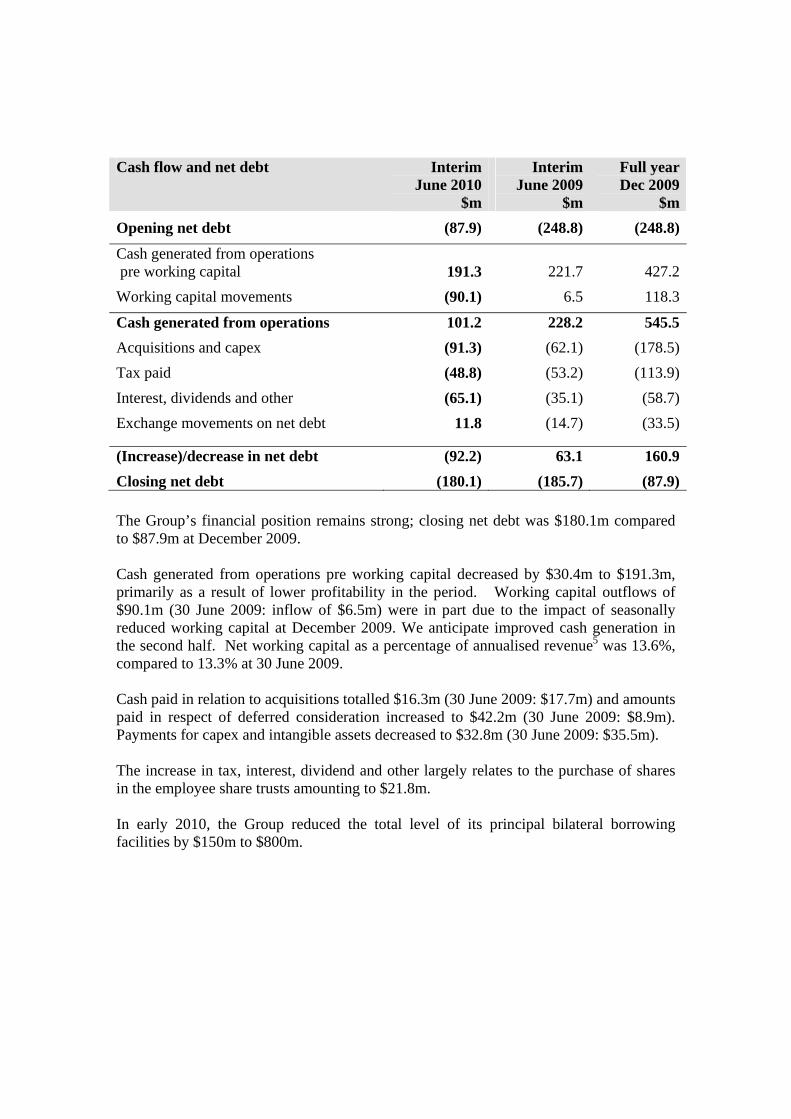
$mOpening net debt (87.9) (248.8) (248.8)
Cash generated from operations pre working capital 191.3
221.7
427.2
Working capital movements (90.1) 6.5 118.3
Cash generated from operations 101.2 228.2 545.5Acquisitions and capex (91.3) (62.1) (178.5)Tax paid (48.8) (53.2) (113.9)Interest, dividends and other (65.1) (35.1) (58.7)Exchange movements on net debt 11.8 (14.7) (33.5)
(Increase)/decrease in net debt (92.2) 63.1 160.9Closing net debt (180.1) (185.7) (87.9) The Group’s financial position remains strong; closing net debt was $180.1m compared to $87.9m at December 2009. Cash generated from operations pre working capital decreased by $30.4m to $191.3m, primarily as a result of lower profitability in the period. Working capital outflows of $90.1m (30 June 2009: inflow of $6.5m) were in part due to the impact of seasonally reduced working capital at December 2009. We anticipate improved cash generation in the second half. Net working capital as a percentage of annualised revenue5 was 13.6%, compared to 13.3% at 30 June 2009. Cash paid in relation to acquisitions totalled $16.3m (30 June 2009: $17.7m) and amounts paid in respect of deferred consideration increased to $42.2m (30 June 2009: $8.9m). Payments for capex and intangible assets decreased to $32.8m (30 June 2009: $35.5m). The increase in tax, interest, dividend and other largely relates to the purchase of shares in the employee share trusts amounting to $21.8m. In early 2010, the Group reduced the total level of its principal bilateral borrowing facilities by $150m to $800m.
Gearing and capital efficiency The Group’s gearing ratio6 has increased from 6.9% at 31 December 2009 to 13.9% and the ratio of closing net debt to annualised EBITDA (earnings before interest, tax, depreciation and amortisation) increased from 0.4 times at 30 June 2009 to 0.5 times. The following key ratios are used by the Group to monitor the efficient use of capital:
• OCER7, used to measure total operating capital employed efficiency, improved from 19.5% at 30 June 2009 to 19.3%;
• ROCE8, used to measure total capital employed, decreased by 5.4% points to
22.1% (30 June 2009: 27.5%), driven primarily by the reduction in Group EBITA margin, partially offset by the slight improvement in OCER referred to above.
Foreign exchange and constant currency reporting
The Group’s revenue and EBITA can be impacted by movements in foreign exchange rates, including the effect of retranslating the results of subsidiaries with various functional currencies into US dollars at different exchange rates. Given there was no significant movement in the average US dollar to other major currencies in which we operate between the first half of 2009 and the first half of 2010, our results in constant currency terms are materially the same as those presented above.
Outlook Overall, year to date performance is in line with expectations and we believe results for the full year will also be in line with expectations. The Board looks to the second half and 2011 with increasing confidence. We continue to pursue a number of opportunities to expand our geographic footprint in key growth markets. Looking further ahead, we believe the fundamentals for oil & gas services and gas fired power generation remain strong and we are well positioned to deliver good longer term growth. Sir Ian Wood Allister G Langlands Chairman Chief Executive 24 August 2010 Footnotes 1 Number of people includes both employees and contractors. 2 EBITA represents operating profit of $139.3m (2009: $176.4m) before the deduction of amortisation of $14.0m (2009: $11.3m) and is provided as it is a key unit of measurement used by the Group in the management of its business. 3 Adjusted diluted earnings per share is calculated by dividing earnings before amortisation, net of tax, by the weighted average number of ordinary shares in issue during the period, excluding shares held by the Group's employee share ownership trusts and adjusted to assume conversion of all potentially dilutive ordinary shares. 4 Interest cover is EBITA divided by net finance costs. 5 Net working capital as a percentage of annualised revenue represents the total of inventories, trade and other receivables, less trade and other payables divided by total revenue. Total revenue for the six month period is multiplied by two to provide an annualised equivalent. 6 Gearing is net debt divided by total shareholders’ equity. 7 Operating Capital Employed to Revenue (“OCER”) is Operating Capital Employed (property, plant and equipment, intangible assets (excluding goodwill and intangibles recognised on acquisition), inventories and trade and other receivables less trade and other payables) divided by Revenue. Total revenue for the six month period is multiplied by two to provide an annualised equivalent. 8 Return on Capital Employed (“ROCE”) is calculated as Group EBITA, divided by average equity plus average net debt, excluding discontinuing activities. Group EBITA for the six months period is multiplied by two to provide an annualised equivalent. 9 Unless stated otherwise, comparisons of financial performance are between the six months to 30 June 2010 and the six months to 30 June 2009.

John Wood Group PLC Interim Financial Statements 2010
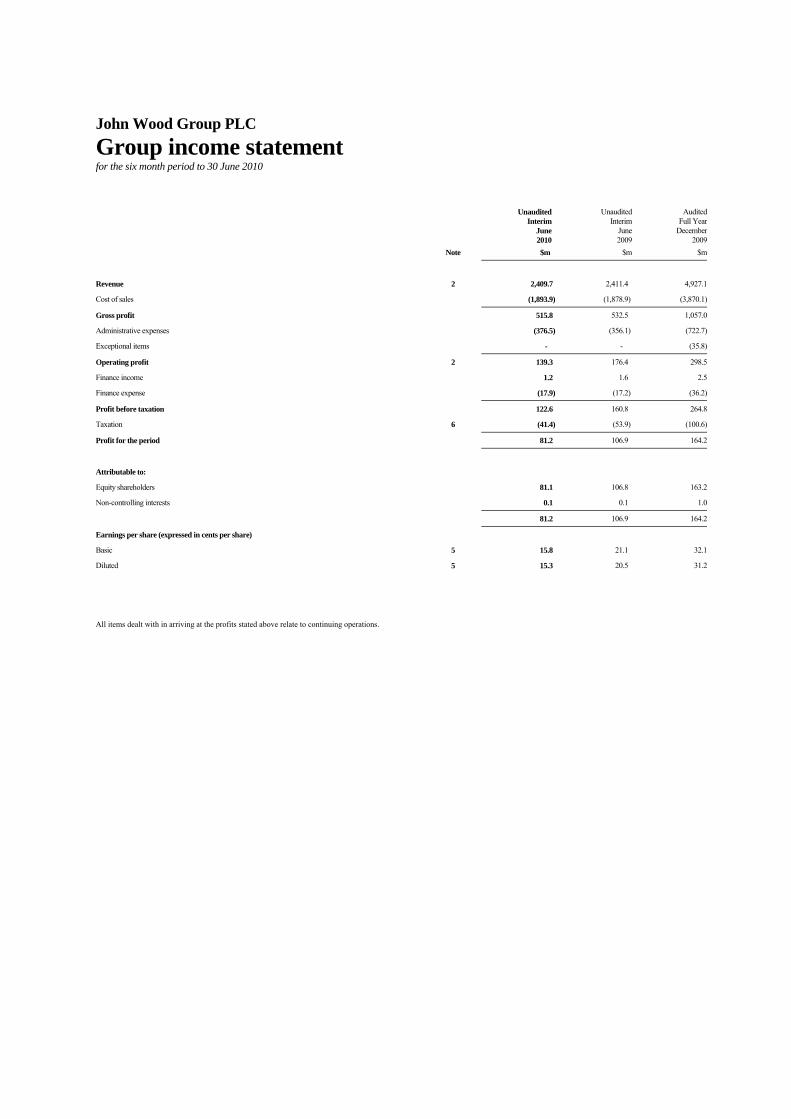
John Wood Group PLC Group income statement for the six month period to 30 June 2010
Unaudited
Interim June 2010
UnauditedInterim
June2009
AuditedFull Year
December2009
Note $m $m $m
Revenue 2 2,409.7 2,411.4 4,927.1
Cost of sales (1,893.9) (1,878.9) (3,870.1)
Gross profit 515.8 532.5 1,057.0
Administrative expenses (376.5) (356.1) (722.7)
Exceptional items - - (35.8)
Operating profit 2 139.3 176.4 298.5
Finance income 1.2 1.6 2.5
Finance expense (17.9) (17.2) (36.2)
Profit before taxation 122.6 160.8 264.8
Taxation 6 (41.4) (53.9) (100.6)
Profit for the period 81.2 106.9 164.2
Attributable to:
Equity shareholders 81.1 106.8 163.2
Non-controlling interests 0.1 0.1 1.0
81.2 106.9 164.2
Earnings per share (expressed in cents per share)
Basic 5 15.8 21.1 32.1
Diluted 5 15.3 20.5 31.2
All items dealt with in arriving at the profits stated above relate to continuing operations.
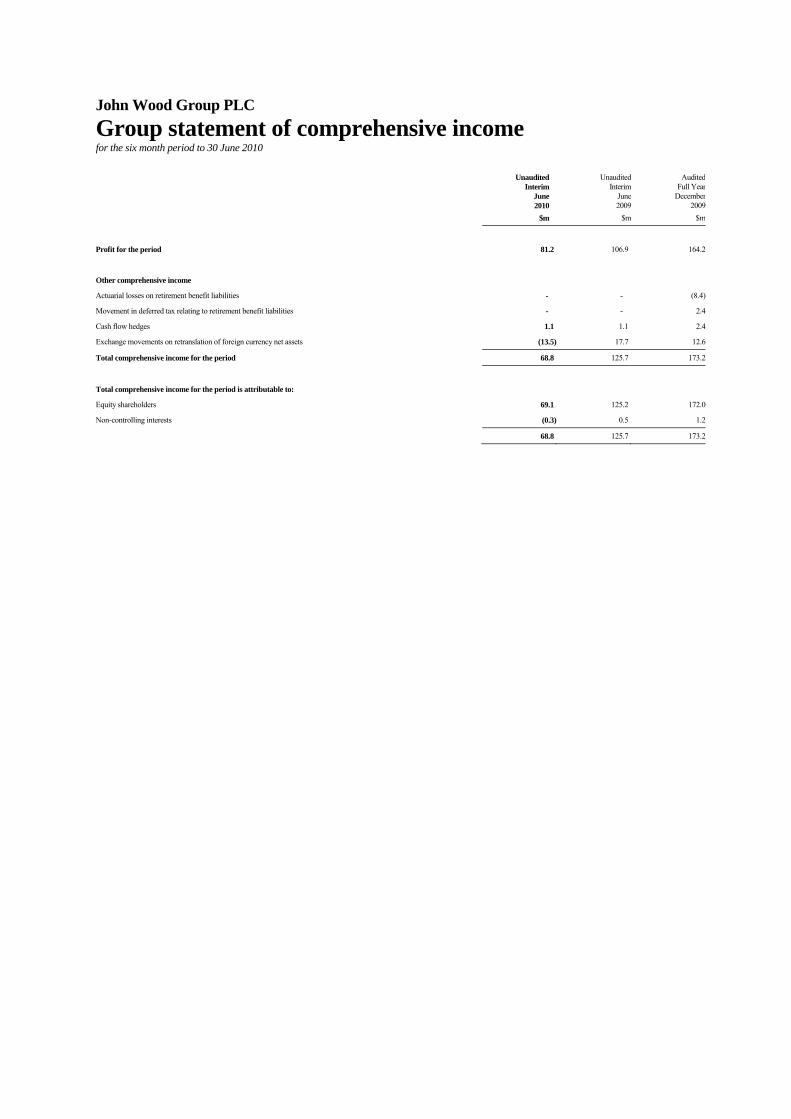
John Wood Group PLC Group statement of comprehensive income for the six month period to 30 June 2010
Unaudited Interim
June 2010
UnauditedInterim
June2009
AuditedFull Year
December2009
$m $m $m
Profit for the period 81.2 106.9 164.2
Other comprehensive income
Actuarial losses on retirement benefit liabilities - - (8.4)
Movement in deferred tax relating to retirement benefit liabilities - - 2.4
Cash flow hedges 1.1 1.1 2.4
Exchange movements on retranslation of foreign currency net assets (13.5) 17.7 12.6
Total comprehensive income for the period 68.8 125.7 173.2
Total comprehensive income for the period is attributable to:
Equity shareholders 69.1 125.2 172.0
Non-controlling interests (0.3) 0.5 1.2
68.8 125.7 173.2
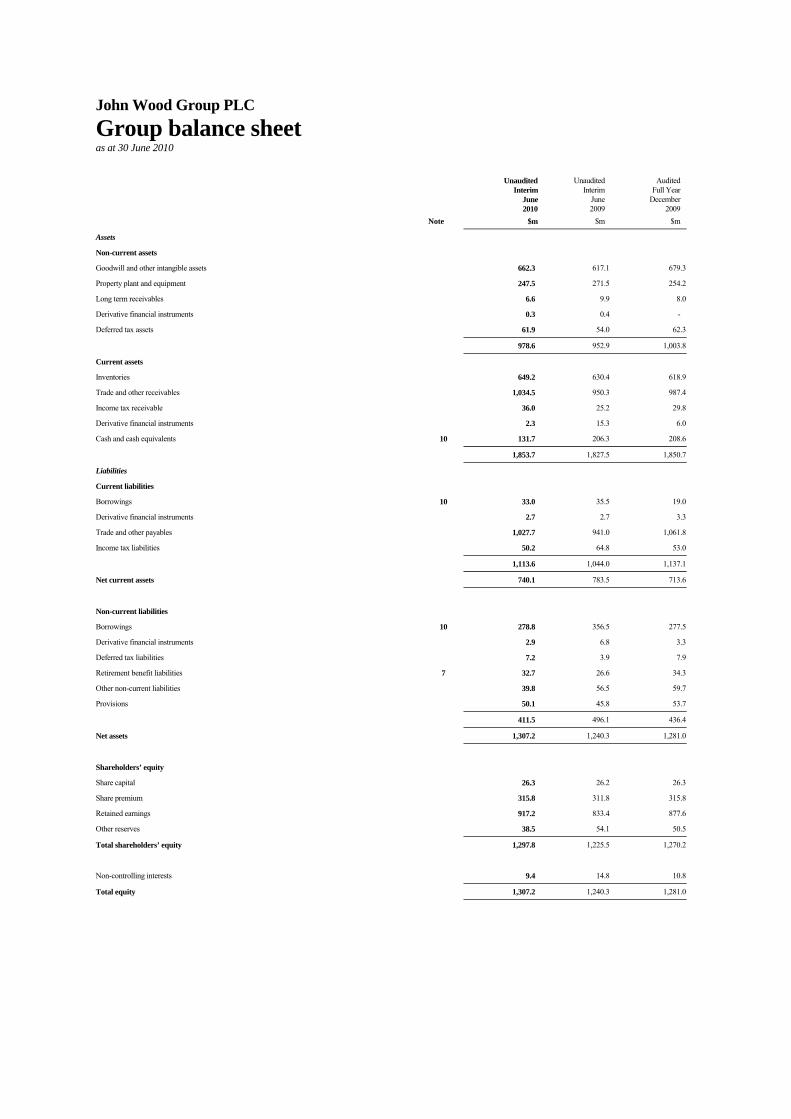
John Wood Group PLC Group balance sheet as at 30 June 2010
Unaudited
InterimJune2010
Unaudited
Interim June 2009
AuditedFull Year
December 2009
Note $m $m $m
Assets
Non-current assets
Goodwill and other intangible assets 662.3 617.1 679.3
Property plant and equipment 247.5 271.5 254.2
Long term receivables 6.6 9.9 8.0
Derivative financial instruments 0.3 0.4 -
Deferred tax assets 61.9 54.0 62.3
978.6 952.9 1,003.8
Current assets
Inventories 649.2 630.4 618.9
Trade and other receivables 1,034.5 950.3 987.4
Income tax receivable 36.0 25.2 29.8
Derivative financial instruments 2.3 15.3 6.0
Cash and cash equivalents 10 131.7 206.3 208.6
1,853.7 1,827.5 1,850.7
Liabilities
Current liabilities
Borrowings 10 33.0 35.5 19.0
Derivative financial instruments 2.7 2.7 3.3
Trade and other payables 1,027.7 941.0 1,061.8
Income tax liabilities 50.2 64.8 53.0
1,113.6 1,044.0 1,137.1
Net current assets 740.1 783.5 713.6
Non-current liabilities
Borrowings 10 278.8 356.5 277.5
Derivative financial instruments 2.9 6.8 3.3
Deferred tax liabilities 7.2 3.9 7.9
Retirement benefit liabilities 7 32.7 26.6 34.3
Other non-current liabilities 39.8 56.5 59.7
Provisions 50.1 45.8 53.7
411.5 496.1 436.4
Net assets 1,307.2 1,240.3 1,281.0
Shareholders’ equity
Share capital 26.3 26.2 26.3
Share premium 315.8 311.8 315.8
Retained earnings 917.2 833.4 877.6
Other reserves 38.5 54.1 50.5
Total shareholders’ equity 1,297.8 1,225.5 1,270.2
Non-controlling interests 9.4 14.8 10.8
Total equity 1,307.2 1,240.3 1,281.0
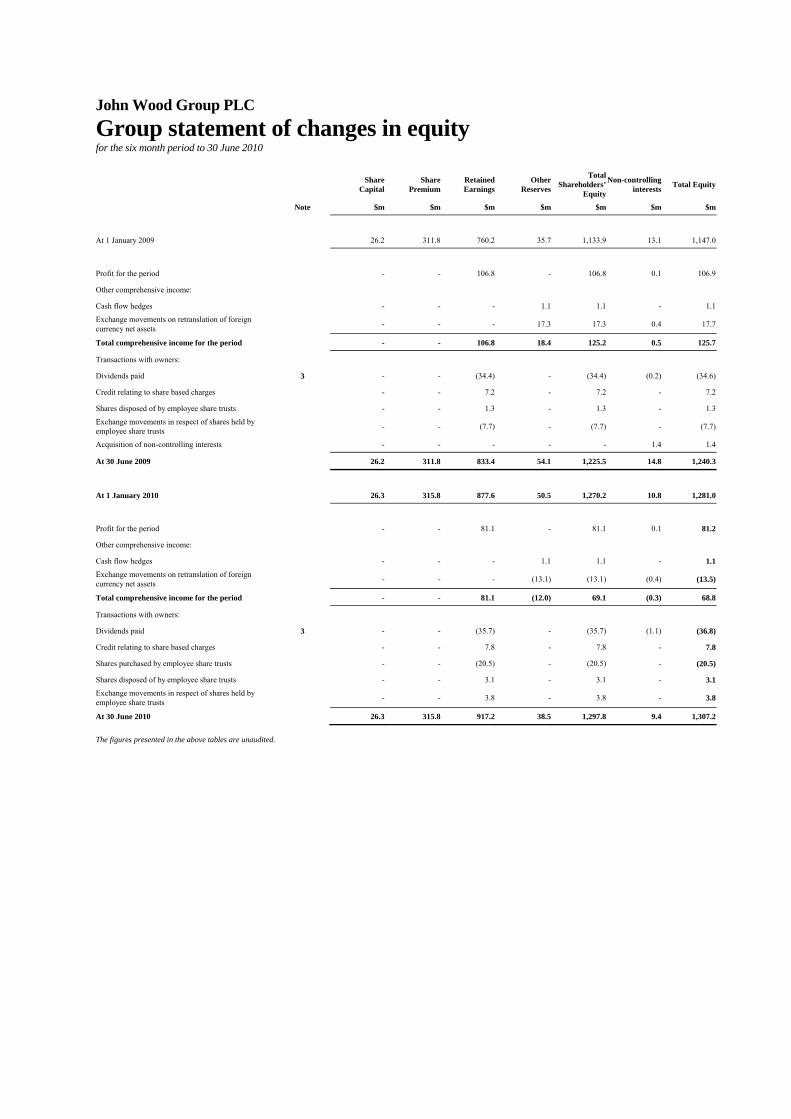
John Wood Group PLC Group statement of changes in equity for the six month period to 30 June 2010
ShareCapital
SharePremium
RetainedEarnings
OtherReserves
TotalShareholders’
Equity
Non-controlling interests Total Equity
Note $m $m $m $m $m $m $m
At 1 January 2009 26.2 311.8 760.2 35.7 1,133.9 13.1 1,147.0
Profit for the period - - 106.8 - 106.8 0.1 106.9
Other comprehensive income:
Cash flow hedges - - - 1.1 1.1 - 1.1
Exchange movements on retranslation of foreign currency net assets - - - 17.3 17.3 0.4 17.7
Total comprehensive income for the period - - 106.8 18.4 125.2 0.5 125.7
Transactions with owners:
Dividends paid 3 - - (34.4) - (34.4) (0.2) (34.6)
Credit relating to share based charges - - 7.2 - 7.2 - 7.2
Shares disposed of by employee share trusts - - 1.3 - 1.3 - 1.3
Exchange movements in respect of shares held by employee share trusts - - (7.7) - (7.7) - (7.7)
Acquisition of non-controlling interests - - - - - 1.4 1.4
At 30 June 2009 26.2 311.8 833.4 54.1 1,225.5 14.8 1,240.3
At 1 January 2010 26.3 315.8 877.6 50.5 1,270.2 10.8 1,281.0
Profit for the period - - 81.1 - 81.1 0.1 81.2
Other comprehensive income:
Cash flow hedges - - - 1.1 1.1 - 1.1
Exchange movements on retranslation of foreign currency net assets - - - (13.1) (13.1) (0.4) (13.5)
Total comprehensive income for the period - - 81.1 (12.0) 69.1 (0.3) 68.8
Transactions with owners:
Dividends paid 3 - - (35.7) - (35.7) (1.1) (36.8)
Credit relating to share based charges - - 7.8 - 7.8 - 7.8
Shares purchased by employee share trusts - - (20.5) - (20.5) - (20.5)
Shares disposed of by employee share trusts - - 3.1 - 3.1 - 3.1
Exchange movements in respect of shares held by employee share trusts - - 3.8 - 3.8 - 3.8
At 30 June 2010 26.3 315.8 917.2 38.5 1,297.8 9.4 1,307.2
The figures presented in the above tables are unaudited.
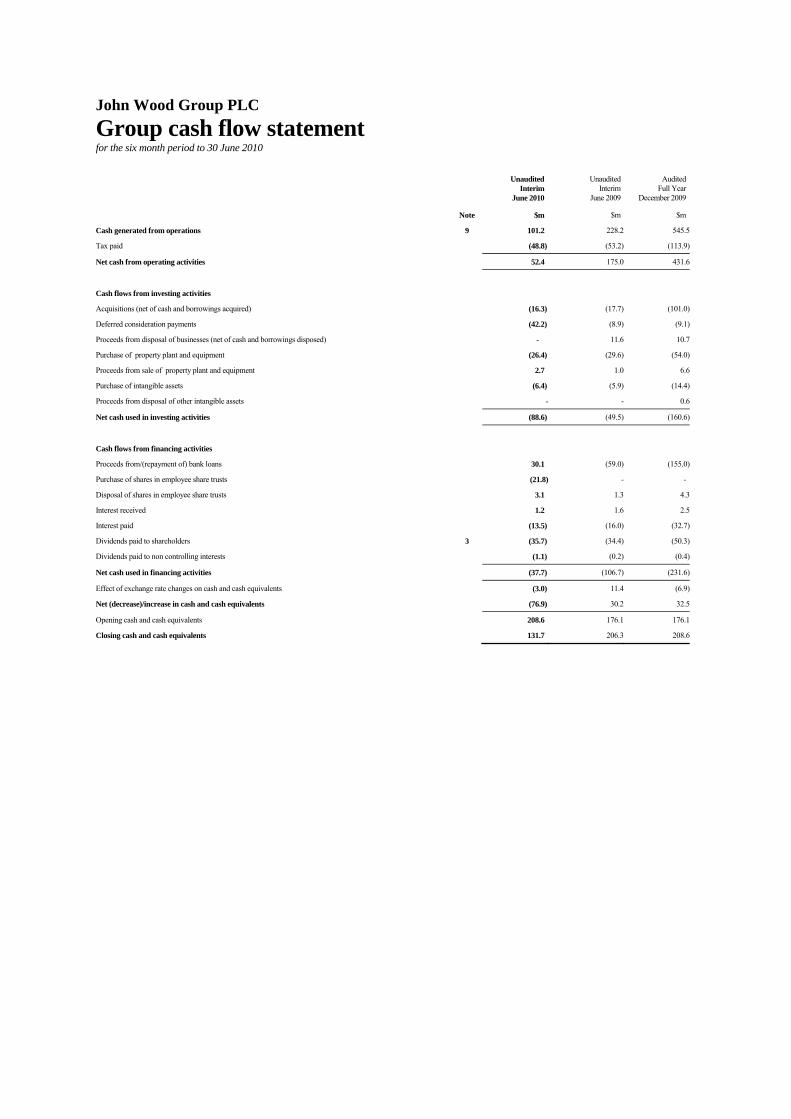
John Wood Group PLC Group cash flow statement for the six month period to 30 June 2010
Unaudited
InterimJune 2010
Unaudited Interim
June 2009
Audited Full Year
December 2009
Note $m $m $m
Cash generated from operations 9 101.2 228.2 545.5
Tax paid (48.8) (53.2) (113.9)
Net cash from operating activities 52.4 175.0 431.6
Cash flows from investing activities
Acquisitions (net of cash and borrowings acquired) (16.3) (17.7) (101.0)
Deferred consideration payments (42.2) (8.9) (9.1)
Proceeds from disposal of businesses (net of cash and borrowings disposed) - 11.6 10.7
Purchase of property plant and equipment (26.4) (29.6) (54.0)
Proceeds from sale of property plant and equipment 2.7 1.0 6.6
Purchase of intangible assets (6.4) (5.9) (14.4)
Proceeds from disposal of other intangible assets - - 0.6
Net cash used in investing activities (88.6) (49.5) (160.6)
Cash flows from financing activities
Proceeds from/(repayment of) bank loans 30.1 (59.0) (155.0)
Purchase of shares in employee share trusts (21.8) - -
Disposal of shares in employee share trusts 3.1 1.3 4.3
Interest received 1.2 1.6 2.5
Interest paid (13.5) (16.0) (32.7)
Dividends paid to shareholders 3 (35.7) (34.4) (50.3)
Dividends paid to non controlling interests (1.1) (0.2) (0.4)
Net cash used in financing activities (37.7) (106.7) (231.6)
Effect of exchange rate changes on cash and cash equivalents (3.0) 11.4 (6.9)
Net (decrease)/increase in cash and cash equivalents (76.9) 30.2 32.5
Opening cash and cash equivalents 208.6 176.1 176.1
Closing cash and cash equivalents 131.7 206.3 208.6
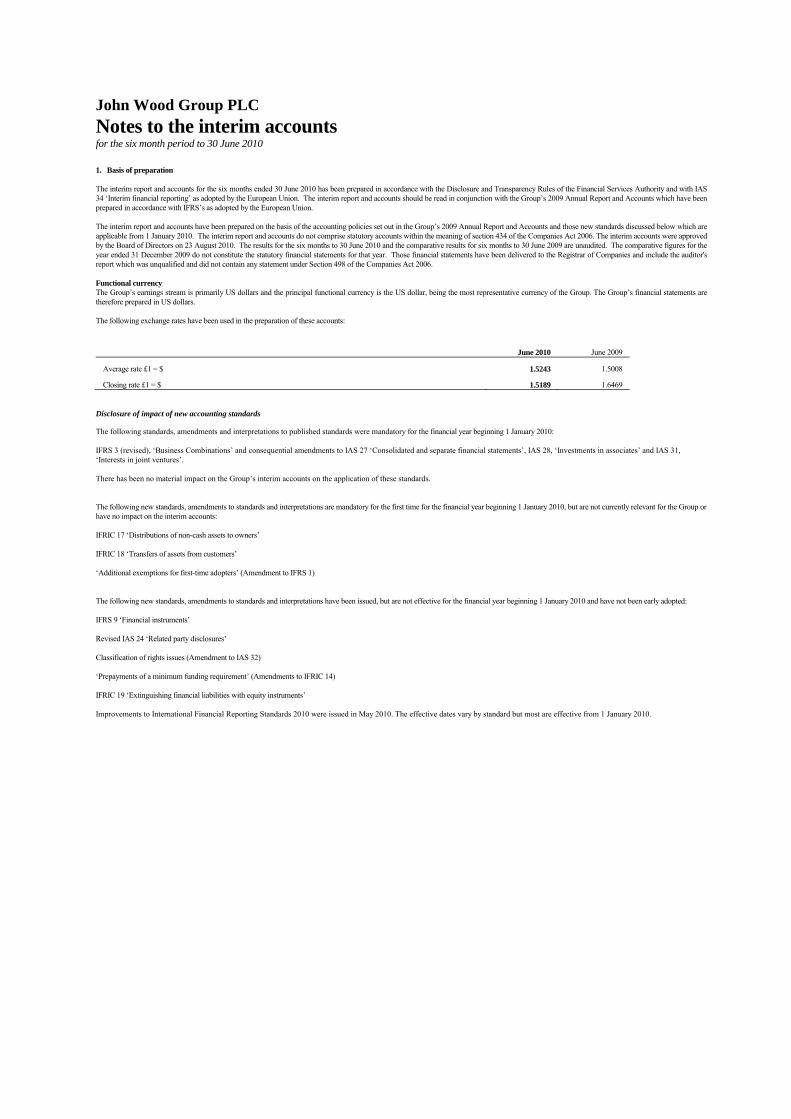
John Wood Group PLC Notes to the interim accounts for the six month period to 30 June 2010 1. Basis of preparation The interim report and accounts for the six months ended 30 June 2010 has been prepared in accordance with the Disclosure and Transparency Rules of the Financial Services Authority and with IAS 34 ‘Interim financial reporting’ as adopted by the European Union. The interim report and accounts should be read in conjunction with the Group’s 2009 Annual Report and Accounts which have been prepared in accordance with IFRS’s as adopted by the European Union. The interim report and accounts have been prepared on the basis of the accounting policies set out in the Group’s 2009 Annual Report and Accounts and those new standards discussed below which are applicable from 1 January 2010. The interim report and accounts do not comprise statutory accounts within the meaning of section 434 of the Companies Act 2006. The interim accounts were approved by the Board of Directors on 23 August 2010. The results for the six months to 30 June 2010 and the comparative results for six months to 30 June 2009 are unaudited. The comparative figures for the year ended 31 December 2009 do not constitute the statutory financial statements for that year. Those financial statements have been delivered to the Registrar of Companies and include the auditor's report which was unqualified and did not contain any statement under Section 498 of the Companies Act 2006. Functional currency The Group’s earnings stream is primarily US dollars and the principal functional currency is the US dollar, being the most representative currency of the Group. The Group’s financial statements are therefore prepared in US dollars. The following exchange rates have been used in the preparation of these accounts:
June 2010 June 2009
Average rate £1 = $ 1.5243 1.5008
Closing rate £1 = $ 1.5189 1.6469 Disclosure of impact of new accounting standards The following standards, amendments and interpretations to published standards were mandatory for the financial year beginning 1 January 2010: IFRS 3 (revised), ‘Business Combinations’ and consequential amendments to IAS 27 ‘Consolidated and separate financial statements’, IAS 28, ‘Investments in associates’ and IAS 31, ‘Interests in joint ventures’. There has been no material impact on the Group’s interim accounts on the application of these standards. The following new standards, amendments to standards and interpretations are mandatory for the first time for the financial year beginning 1 January 2010, but are not currently relevant for the Group or have no impact on the interim accounts: IFRIC 17 ‘Distributions of non-cash assets to owners’ IFRIC 18 ‘Transfers of assets from customers’ ‘Additional exemptions for first-time adopters’ (Amendment to IFRS 1) The following new standards, amendments to standards and interpretations have been issued, but are not effective for the financial year beginning 1 January 2010 and have not been early adopted: IFRS 9 ‘Financial instruments’ Revised IAS 24 ‘Related party disclosures’ Classification of rights issues (Amendment to IAS 32) ‘Prepayments of a minimum funding requirement’ (Amendments to IFRIC 14) IFRIC 19 ‘Extinguishing financial liabilities with equity instruments’ Improvements to International Financial Reporting Standards 2010 were issued in May 2010. The effective dates vary by standard but most are effective from 1 January 2010.
John Wood Group PLC
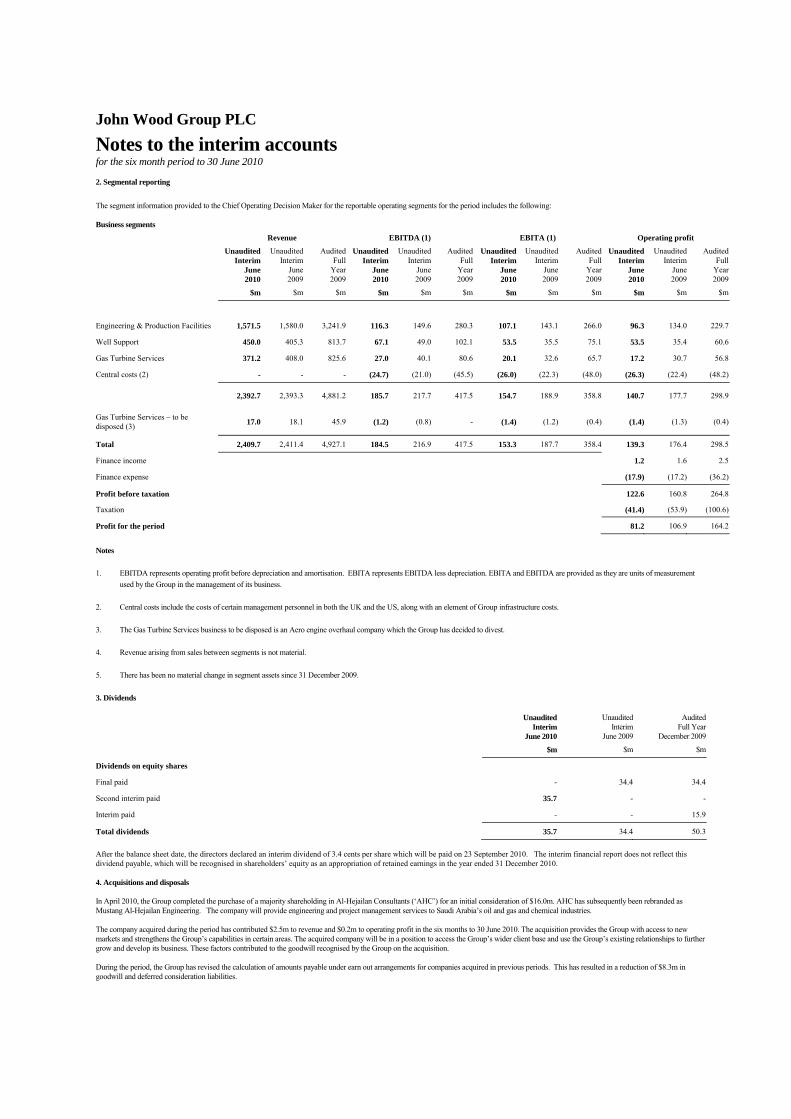
Notes to the interim accounts for the six month period to 30 June 2010 2. Segmental reporting The segment information provided to the Chief Operating Decision Maker for the reportable operating segments for the period includes the following: Business segments Revenue EBITDA (1) EBITA (1) Operating profit
UnauditedInterim
June 2010
UnauditedInterim
June 2009
AuditedFull
Year2009
UnauditedInterim
June 2010
UnauditedInterim
June 2009
AuditedFull
Year2009
UnauditedInterim
June 2010
UnauditedInterim
June2009
AuditedFull
Year2009
UnauditedInterim
June 2010
UnauditedInterim
June 2009
AuditedFull
Year2009
$m $m $m $m $m $m $m $m $m $m $m $m
Engineering & Production Facilities 1,571.5 1,580.0 3,241.9 116.3 149.6 280.3 107.1 143.1 266.0 96.3 134.0 229.7
Well Support 450.0 405.3 813.7 67.1 49.0 102.1 53.5 35.5 75.1 53.5 35.4 60.6
Gas Turbine Services 371.2 408.0 825.6 27.0 40.1 80.6 20.1 32.6 65.7 17.2 30.7 56.8
Central costs (2) - - - (24.7) (21.0) (45.5) (26.0) (22.3) (48.0) (26.3) (22.4) (48.2)
2,392.7 2,393.3 4,881.2 185.7 217.7 417.5 154.7 188.9 358.8 140.7 177.7 298.9
Gas Turbine Services – to be disposed (3) 17.0 18.1 45.9 (1.2) (0.8) - (1.4) (1.2) (0.4) (1.4) (1.3) (0.4)
Total 2,409.7 2,411.4 4,927.1 184.5 216.9 417.5 153.3 187.7 358.4 139.3 176.4 298.5
Finance income 1.2 1.6 2.5
Finance expense (17.9) (17.2) (36.2)
Profit before taxation 122.6 160.8 264.8
Taxation (41.4) (53.9) (100.6)
Profit for the period 81.2 106.9 164.2 Notes 1. EBITDA represents operating profit before depreciation and amortisation. EBITA represents EBITDA less depreciation. EBITA and EBITDA are provided as they are units of measurement
used by the Group in the management of its business. 2. Central costs include the costs of certain management personnel in both the UK and the US, along with an element of Group infrastructure costs. 3. The Gas Turbine Services business to be disposed is an Aero engine overhaul company which the Group has decided to divest. 4. Revenue arising from sales between segments is not material. 5. There has been no material change in segment assets since 31 December 2009. 3. Dividends
Unaudited
InterimJune 2010
UnauditedInterim
June 2009
AuditedFull Year
December 2009
$m $m $m
Dividends on equity shares
Final paid - 34.4 34.4
Second interim paid 35.7 - -
Interim paid - - 15.9
Total dividends 35.7 34.4 50.3 After the balance sheet date, the directors declared an interim dividend of 3.4 cents per share which will be paid on 23 September 2010. The interim financial report does not reflect this dividend payable, which will be recognised in shareholders’ equity as an appropriation of retained earnings in the year ended 31 December 2010. 4. Acquisitions and disposals In April 2010, the Group completed the purchase of a majority shareholding in Al-Hejailan Consultants (‘AHC’) for an initial consideration of $16.0m. AHC has subsequently been rebranded as Mustang Al-Hejailan Engineering. The company will provide engineering and project management services to Saudi Arabia’s oil and gas and chemical industries. The company acquired during the period has contributed $2.5m to revenue and $0.2m to operating profit in the six months to 30 June 2010. The acquisition provides the Group with access to new markets and strengthens the Group’s capabilities in certain areas. The acquired company will be in a position to access the Group’s wider client base and use the Group’s existing relationships to further grow and develop its business. These factors contributed to the goodwill recognised by the Group on the acquisition. During the period, the Group has revised the calculation of amounts payable under earn out arrangements for companies acquired in previous periods. This has resulted in a reduction of $8.3m in goodwill and deferred consideration liabilities.
John Wood Group PLC
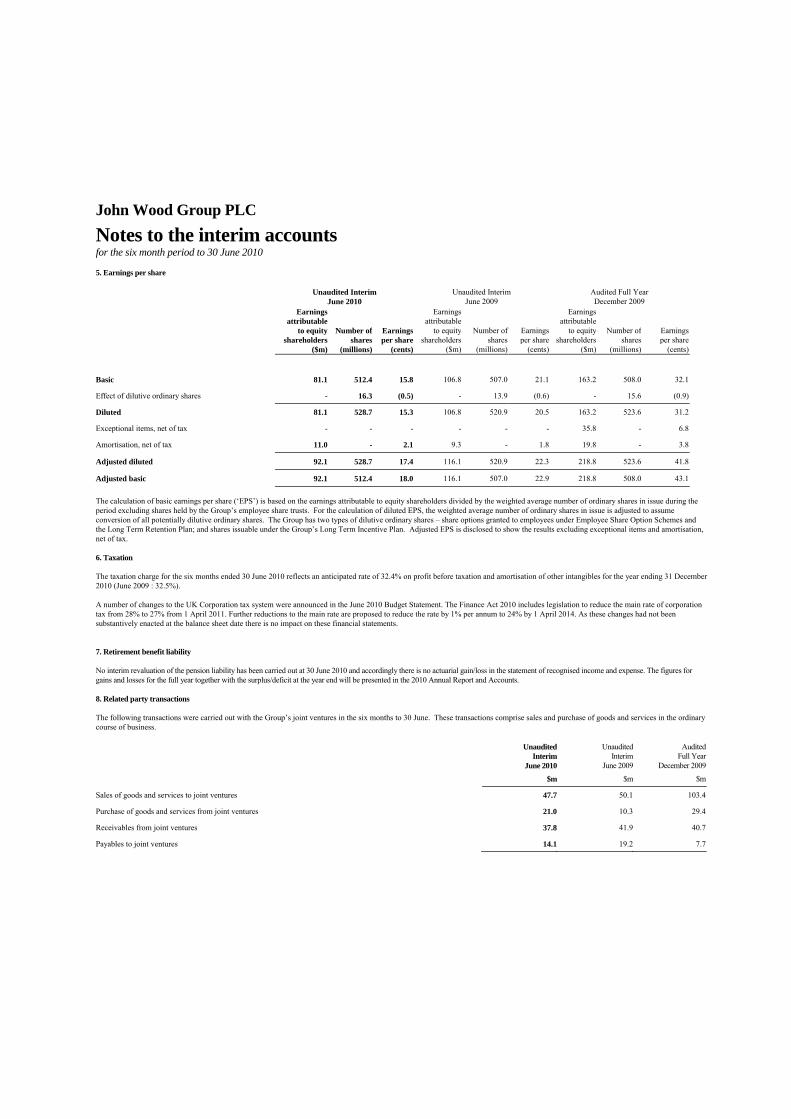
Notes to the interim accounts for the six month period to 30 June 2010 5. Earnings per share
Unaudited Interim June 2010
Unaudited Interim June 2009
Audited Full Year December 2009
Earnings attributable
to equity shareholders
($m)
Number of shares
(millions)
Earnings per share
(cents)
Earnings attributable
to equity shareholders
($m)
Number of shares
(millions)
Earnings per share
(cents)
Earnings attributable
to equity shareholders
($m)
Number of shares
(millions)
Earnings per share
(cents)
Basic 81.1 512.4 15.8 106.8 507.0 21.1 163.2 508.0 32.1
Effect of dilutive ordinary shares - 16.3 (0.5) - 13.9 (0.6) - 15.6 (0.9)
Diluted 81.1 528.7 15.3 106.8 520.9 20.5 163.2 523.6 31.2
Exceptional items, net of tax - - - - - - 35.8 - 6.8
Amortisation, net of tax 11.0 - 2.1 9.3 - 1.8 19.8 - 3.8
Adjusted diluted 92.1 528.7 17.4 116.1 520.9 22.3 218.8 523.6 41.8
Adjusted basic 92.1 512.4 18.0 116.1 507.0 22.9 218.8 508.0 43.1 The calculation of basic earnings per share (‘EPS’) is based on the earnings attributable to equity shareholders divided by the weighted average number of ordinary shares in issue during the period excluding shares held by the Group’s employee share trusts. For the calculation of diluted EPS, the weighted average number of ordinary shares in issue is adjusted to assume conversion of all potentially dilutive ordinary shares. The Group has two types of dilutive ordinary shares – share options granted to employees under Employee Share Option Schemes and the Long Term Retention Plan; and shares issuable under the Group’s Long Term Incentive Plan. Adjusted EPS is disclosed to show the results excluding exceptional items and amortisation, net of tax. 6. Taxation The taxation charge for the six months ended 30 June 2010 reflects an anticipated rate of 32.4% on profit before taxation and amortisation of other intangibles for the year ending 31 December 2010 (June 2009 : 32.5%). A number of changes to the UK Corporation tax system were announced in the June 2010 Budget Statement. The Finance Act 2010 includes legislation to reduce the main rate of corporation tax from 28% to 27% from 1 April 2011. Further reductions to the main rate are proposed to reduce the rate by 1% per annum to 24% by 1 April 2014. As these changes had not been substantively enacted at the balance sheet date there is no impact on these financial statements. 7. Retirement benefit liability No interim revaluation of the pension liability has been carried out at 30 June 2010 and accordingly there is no actuarial gain/loss in the statement of recognised income and expense. The figures for gains and losses for the full year together with the surplus/deficit at the year end will be presented in the 2010 Annual Report and Accounts. 8. Related party transactions The following transactions were carried out with the Group’s joint ventures in the six months to 30 June. These transactions comprise sales and purchase of goods and services in the ordinary course of business.
Unaudited
InterimJune 2010
UnauditedInterim
June 2009
AuditedFull Year
December 2009
$m $m $m
Sales of goods and services to joint ventures 47.7 50.1 103.4
Purchase of goods and services from joint ventures 21.0 10.3 29.4
Receivables from joint ventures 37.8 41.9 40.7
Payables to joint ventures 14.1 19.2 7.7
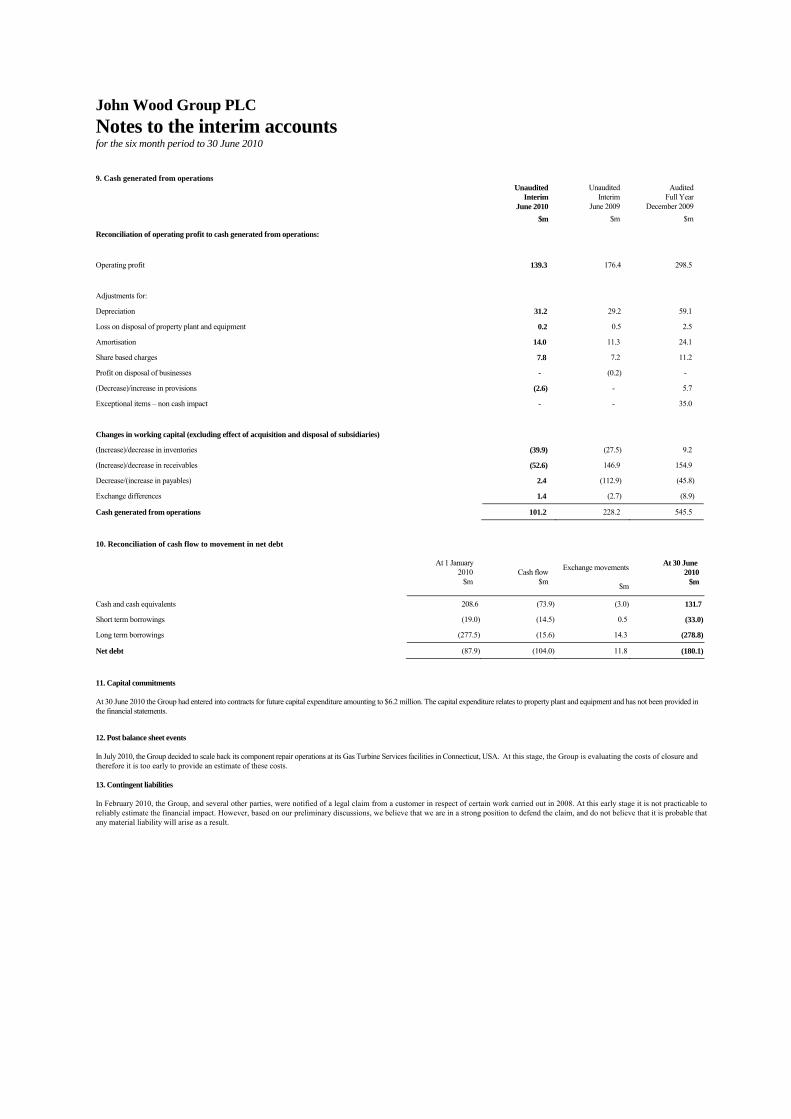
John Wood Group PLC Notes to the interim accounts for the six month period to 30 June 2010 9. Cash generated from operations
Unaudited
Interim June 2010
Unaudited Interim
June 2009
Audited Full Year
December 2009 $m $m $m
Reconciliation of operating profit to cash generated from operations:
Operating profit 139.3 176.4 298.5
Adjustments for:
Depreciation 31.2 29.2 59.1
Loss on disposal of property plant and equipment 0.2 0.5 2.5
Amortisation 14.0 11.3 24.1
Share based charges 7.8 7.2 11.2
Profit on disposal of businesses - (0.2) -
(Decrease)/increase in provisions (2.6) - 5.7
Exceptional items – non cash impact - - 35.0
Changes in working capital (excluding effect of acquisition and disposal of subsidiaries)
(Increase)/decrease in inventories (39.9) (27.5) 9.2
(Increase)/decrease in receivables (52.6) 146.9 154.9
Decrease/(increase in payables) 2.4 (112.9) (45.8)
Exchange differences 1.4 (2.7) (8.9)
Cash generated from operations 101.2 228.2 545.5
10. Reconciliation of cash flow to movement in net debt
At 1 January
2010 $m
Cash flow $m
Exchange movements
$m
At 30 June 2010
$m
Cash and cash equivalents 208.6 (73.9) (3.0) 131.7
Short term borrowings (19.0) (14.5) 0.5 (33.0)
Long term borrowings (277.5) (15.6) 14.3 (278.8)
Net debt (87.9) (104.0) 11.8 (180.1) 11. Capital commitments At 30 June 2010 the Group had entered into contracts for future capital expenditure amounting to $6.2 million. The capital expenditure relates to property plant and equipment and has not been provided in the financial statements. 12. Post balance sheet events In July 2010, the Group decided to scale back its component repair operations at its Gas Turbine Services facilities in Connecticut, USA. At this stage, the Group is evaluating the costs of closure and therefore it is too early to provide an estimate of these costs. 13. Contingent liabilities In February 2010, the Group, and several other parties, were notified of a legal claim from a customer in respect of certain work carried out in 2008. At this early stage it is not practicable to reliably estimate the financial impact. However, based on our preliminary discussions, we believe that we are in a strong position to defend the claim, and do not believe that it is probable that any material liability will arise as a result.
Statement of directors’ responsibilities for the six month period to 30 June 2010 The directors confirm that the interim report and accounts have been prepared in accordance with IAS 34 as adopted by the European Union and that the interim report includes a fair review of the information required by DTR 4.2.7 and DTR 4.2.8, namely: ● an indication of impairment events that have occurred during the first six months and their impact on the accounts and a description of the principal risks and
uncertainties for the remaining six months of the year; and ● material related party transactions in the first six months and any material changes in the related party transactions described in the last annual report. The directors of John Wood Group PLC are listed in the Group’s 2009 Annual Report and Accounts. A G Langlands Chief Executive A G Semple Group Finance Director 23 August 2010
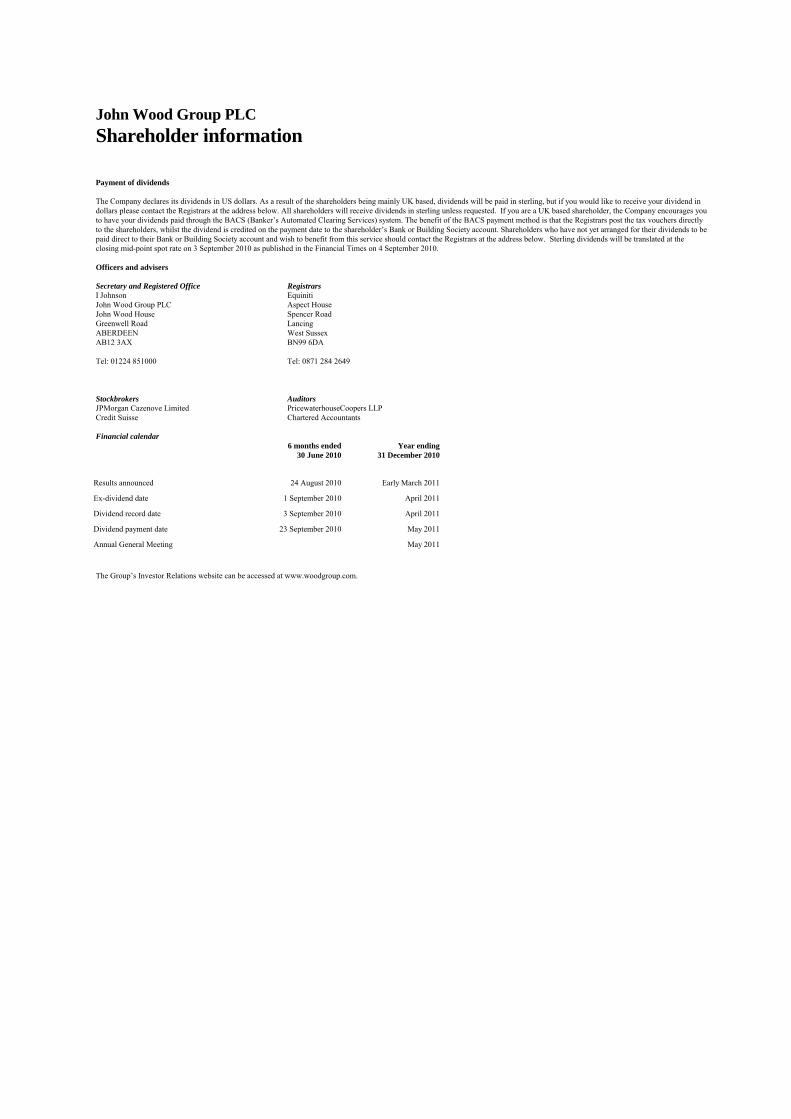
John Wood Group PLC Shareholder information Payment of dividends The Company declares its dividends in US dollars. As a result of the shareholders being mainly UK based, dividends will be paid in sterling, but if you would like to receive your dividend in dollars please contact the Registrars at the address below. All shareholders will receive dividends in sterling unless requested. If you are a UK based shareholder, the Company encourages you to have your dividends paid through the BACS (Banker’s Automated Clearing Services) system. The benefit of the BACS payment method is that the Registrars post the tax vouchers directly to the shareholders, whilst the dividend is credited on the payment date to the shareholder’s Bank or Building Society account. Shareholders who have not yet arranged for their dividends to be paid direct to their Bank or Building Society account and wish to benefit from this service should contact the Registrars at the address below. Sterling dividends will be translated at the closing mid-point spot rate on 3 September 2010 as published in the Financial Times on 4 September 2010. Officers and advisers Secretary and Registered Office Registrars I Johnson Equiniti John Wood Group PLC Aspect House John Wood House Spencer Road Greenwell Road Lancing ABERDEEN West Sussex AB12 3AX BN99 6DA
Tel: 01224 851000 Tel: 0871 284 2649 Stockbrokers Auditors JPMorgan Cazenove Limited PricewaterhouseCoopers LLP Credit Suisse Chartered Accountants Financial calendar
6 months ended 30 June 2010
Year ending31 December 2010
Results announced 24 August 2010 Early March 2011
Ex-dividend date 1 September 2010 April 2011
Dividend record date 3 September 2010 April 2011
Dividend payment date 23 September 2010 May 2011
Annual General Meeting May 2011 The Group’s Investor Relations website can be accessed at www.woodgroup.com.