Embed Size (px)
Citation preview
Risk and Reward:the Economics of LEDs
John Selander, LC, LEED APNortheast Regional Sales ManagerThe Lighting Quotient West Haven, Connecticut, USA

A Short Course on Lighting EconomicsRP-31 and Seminar 3
Examples of several methodsof Lighting Economics
HID vs. fluorescent
Fluorescent vs. LED

IES Seminar 3-IM-09

Where the Lighting Dollar Goes
4, 8, 88

A Review of Economic Terms Relative to Lighting
Higher initial costs
Long term cash flows
Time value of money
Risk and return (or reward)

Energy Management for Lighting
Energy Management
Design Considerations
Equipment Considerations
System Maintenance
• Lumen depreciation factors
• Group relamping• Demand side
management/ energy credits or rebates
• Light sources• Ballasts• Luminaires• Controls• Other considerations
(thermal issues, etc.)
• Physical characteristics
• Daylighting• Task location• Electrical codes,
safety & energy standards

Levels of Rigor in Lighting Analysis

Life Cycle Costing
Includes allsignificant costs
Costs considered over life of system
Costs expressedin equivalent dollars

The Time Value of Money
FV (1 + k)n
Where …
PV is Present Value
FV is Future Value
k is Discount Rate
n is time period over which FV is discounted
PV =

Present Value Table (partial)
YR 3.0% 3.5% 4.0% 4.5%
1 0.970874 0.966184 0.961538 0.956938
2 0.942596 0.933511 0.924556 0.915730
3 0.915142 0.901943 0.888996 0.876297
4 0.888487 0.871442 0.854804 0.838561
5 0.862609 0.841973 0.821927 0.802451
6 0.837484 0.813501 0.790315 0.767896
7 0.813092 0.785991 0.759918 0.734828
8 0.789409 0.759412 0.730690 0.703185
9 0.766417 0.733731 0.702587 0.672904
10 0.744094 0.708919 0.675564 0.643928

Example of a Present Value Calculation
Let’s do an example…
If a lighting system has an annual cost of energy of $1000.00 in year one, with a 7% annual increase presented in average cost per kWh and assuming the burning hours and system energy use stay the same, the negative cash flows look like this:
Yr. 1: $1000.00 Yr. 6: $1402.56
Yr. 2: $1070.00 Yr. 7: $1500.73
Yr. 3: $1144.90 Yr. 8: $1605.79
Yr. 4: $1225.04 Yr. 9: $1718.19
Yr. 5: $1310.80 Yr.10: $1838.46
Etc.

PV Calculation, continued
If we use the basic formula we need to discount all of these cash flows using the formula on the preceding slide:
FV (1 + k)n Where …
PV is Present ValueFV is Future Valuek is Discount Raten is time period over which FV is discounted
Question: What is the Present Value of the energy cost for year five?The discount rate (or cost of money) in year five is estimated to be 5%.
PV =

Converting an FV to a PV
$ 1310.80 = $ 1310.80 = $ 1027.30 = PV
(1 + .05)5 1.276

PV Calculation, continued
Discounting every cash flow using the formula is tedious.
This time, let’s use the Present Value table to find the multiplier of the money in year 5, which is $1,310.80.
Let’s use acost of moneyof 4%.
$ 1310.80 × 0.821927 = $ 1077.38
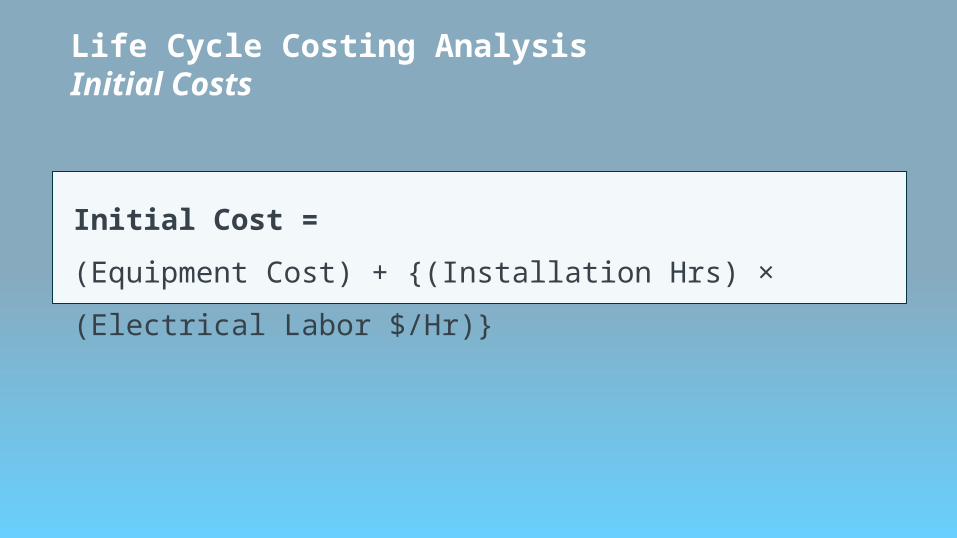
Life Cycle Costing AnalysisInitial Costs
Initial Cost =
(Equipment Cost) + {(Installation Hrs) × (Electrical Labor $/Hr)}

Life Cycle Costing AnalysisAdditional Initial Costs SYSTEM 1 SYSTEM 2
System, labor & material (luminaire, lamps, ballasts, controls) = _______ ________
Total kw lighting = _______ ________
Tons of air conditioning required to dissipate heat of lighting = _______ ________
First cost of air conditioning tons in line 3@ $_____ / ton = _______ ________
Reduction in first cost of heating equipment = _______ ________
Utility incentives = _______ ________
Other first costs = _______ ________
Subtotal mechanical and electrical installed cost = _______ ________
Initial taxes = _______ ________
Total costs = _______ ________
Installed cost per square foot (memo) = _______ ________
Watts of lighting per square foot (memo) = _______ ________
Salvage value at end of economic life = _______ ________

Life Cycle Costing AnalysisAnnual Power and Maintenance Costs
SYSTEM 1 SYSTEM 2
Lighting utility costs = (burning hours)(kw)($/kWh) ________ ________
Air conditioning = (operating hours)(tons)(kw/ton)($/kWh) ________ ________
Air conditioning maintenance = (tons)($/ton) ________ ________
Reduction in heating cost = ________ ________
Reduced heating maintenance = (Btus)($/Btu) ________ ________
Other annual costs = ________ ________
Lamp replacement costs (see notes) = ________ ________
Ballast replacement costs (see notes) = ________ ________
Luminaire cleaning costs = (# of luminaires)($/luminaire) ________ ________
Annual insurance cost = ________ ________
Annual property tax cost = ________ ________
Income tax effect, T (see notes) = ________ ________
Total annual maintenance costs = ________ ________

Energy Costs
Annual Energy Cost =
N × (kW/Luminaire) × ($/kWh) × (Hours/Year)
Where…N = total number of luminaires
kW/Luminaire = kilowatts per luminaire (1 kW = 1000 Watts)
$/kWh = energy rate in dollars per kilowatt-hour
Hours/Year = the number of hours the lighting system will operateover the period of a year
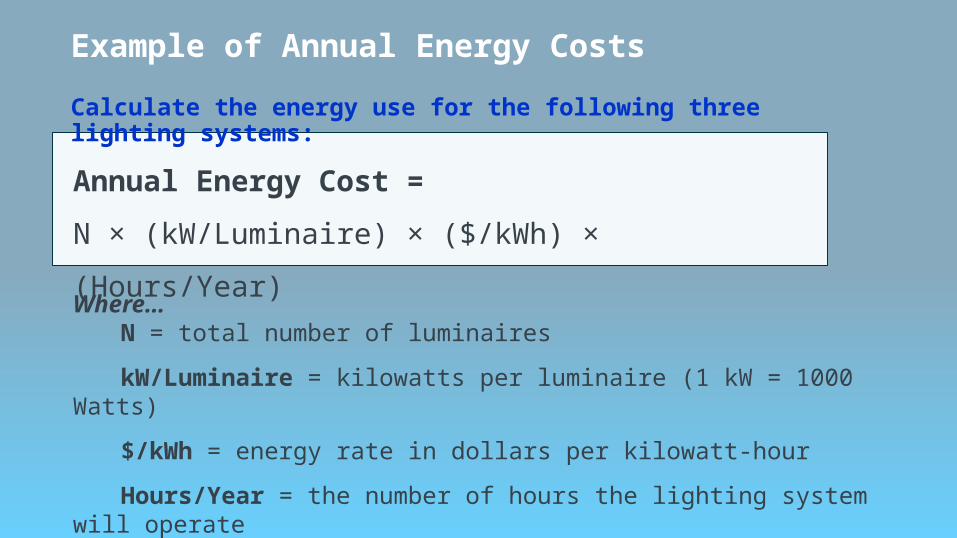
Example of Annual Energy Costs
Annual Energy Cost =
N × (kW/Luminaire) × ($/kWh) × (Hours/Year)
Where…N = total number of luminaires
kW/Luminaire = kilowatts per luminaire (1 kW = 1000 Watts)
$/kWh = energy rate in dollars per kilowatt-hour
Hours/Year = the number of hours the lighting system will operateover the period of a year
Calculate the energy use for the following three lighting systems:

Example of Annual Energy Costs Warehouse or Industrial ApplicationAnnual Energy Cost = N × (kW/Luminaire) × ($/kWh) × (Hours/Year)Energy rate: $ .09/ kWhAnnual Burning hours: 5500
System One: 400 watt probe start metal halide highbayTotal luminaire wattage: 458 wattsNumber of luminaires needed for 30 maintained fcs: 46
System Two: 320 watt pulse start metal halide highbayTotal luminaire wattage: 368 wattsNumber of luminaires needed for 30 maintained fcs: 52
System Three: six lamp 54 watt HO/T5 highbay Total luminaire wattage: 354 wattsNumber of luminaires needed for 30 maintained fcs: 50

Example of Annual Energy Costs Warehouse or Industrial ApplicationAnnual Energy Cost = N × (kW/Luminaire) × ($/kWh) × (Hours/Year)Energy rate: $ .09/ kWhAnnual Burning hours: 5500
System One: 458 × 46 × .09 × 5500 / 1000 = $ 10,428.66
System Two: 368 × 52 × .09 × 5500 / 1000 = $ 9,472.32
System Three: 354 × 50 × .09 × 5500 / 1000 = $ 8,761.50

Energy Cost Components
Power consumed by equipment
Energy rate from utility company
Demand charge discount from utility company
Burning hours per year

Annual Maintenance Costs
Maintenance Costs =
(Materials) + {(Maint. Hrs) × (Maint. Labor/Hr)}
Maintenance Cost =
(Cost of Materials Required for Maintenance) +
{(Hours Required for Maintenance) × (Maintenance Labor $/Hr)}

Replacement Lamp Costs
Number of Lamps Replaced Per Year =
(Total Number of Lamps) × (Operating Hrs/Yr)
(Lamp Life in Hrs)
Determine the AVERAGE number of lamps that will fail each year:

Simple Payback
Payback = Incremental Initial Cost
Annual Operating + Maintenance Savings
Period of time for savings to equal the additional initial investment for lighting system

Simple Payback Example
As an example:The incremental initial cost of a fluorescent downlight over an incandescent downlight is:
$14,416 – 9,125 = $5,291
The annual operating & maintenance savings of the fluorescent downlight over the incandescent downlight is:
$7,486 – 2,114 = $5,372/yr.
The simple payback is determined by simply dividing:
$5,291 / 5,372 = 0.98 years
incrementalinitial cost
annual operating &maintenance savings/

The “Perils” of Using Payback
Base System 100 watt Incandescent “A” Lamp System A: 95 watt
“Energy Saving” LampPayback = < 30 days
System B: 18 watt CFL Lamp
Payback = < 5 months

Retrofit and Renovation: $ Billion Market
Most of the same rules apply
Time Value of Money and discounting all future cash flows very important
Generally use adders: Δ cost of system and Δ of energy use and Δ of maintenance vs. base
Simple Payback will not always predict the best Life-Cycle Cost-Benefit Analysis

Keep Your Terms Consistent!
You will sound like a fool if you say something like this: “This project has an ROI of under three years!” ROI is based upon Return on Dollars invested. It is expressed in terms of a percentage.
What do you make in a savings account? 0.25% or less?
How about with a mutual fund? 16% in a very good year?
If your lighting systems has a discounted ROI of 25% a year, why can’t we think of that as a really good Return and buy the new lighting? The stock market may go down next year but if you are still in business, that 25% might actually go up.

LCCBA Example
SCENARIO: A produce merchandise area at a high-end
grocery store
ASHRAE/IES 90.1 2010 has been adopted by the State Energy Code
Total allowance for retail store sales area: 1.68 watts/ft2. Allowance for accent lighting: an additional 1.6 watts/ft2. Total lighting power density for produce area at 3.28 watts/ft2 or below
Select the best available lighting system while keeping at or below ASHRAE/IESNA 90.1
In other stores, owner has used high CRI fluorescents for general lighting, with merchandise accented by recessed downlights with 75PAR30 halogen flood lamps; the store will be open 24 hours a day

System One — Base 6" recessed accent with 75 watt PAR30 120V halogen lamp3
Rated Average Life: 3000 hrs
Initial Lumens: 1050
Mean Lumens: (not published)
Maximum Beam Candlepower: NFL 25° 4200
Luminaire Efficiency: 86.1%
Distributor Price1: $120.00
Lamp cost: $6.00
Multiplier to create equal illuminance between all three systems2: 1.00
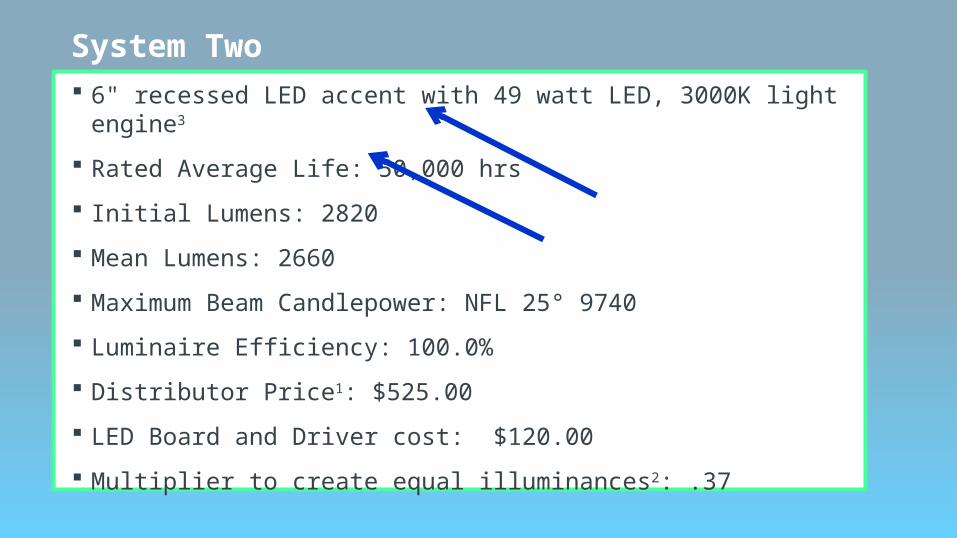
System Two 6" recessed LED accent with 49 watt LED, 3000K light engine3
Rated Average Life: 50,000 hrs
Initial Lumens: 2820
Mean Lumens: 2660
Maximum Beam Candlepower: NFL 25° 9740
Luminaire Efficiency: 100.0%
Distributor Price1: $525.00
LED Board and Driver cost: $120.00
Multiplier to create equal illuminances2: .37

System Three 6" recessed accent with 18 watt PAR30 Long Neck 40º LED floodlamp
by Lighting Sciences3
Rated Average Life: 30,000 hrs
Initial Lumens: NA
Mean Lumens: NA
Maximum Beam Candlepower: 1950
Luminaire Efficiency: 100.0%
Distributor Price1: $120.00
Lamp cost: $37.00
Multiplier to create equal illuminances2: 1.86

A Look at the Three SystemsSystem THREE
6" recessed accent with 18 watt PAR30 Long Neck 40º LED floodlamp by Lighting Sciences3
Rated Average Life: 30,000 hrs
Initial Lumens: NA
Mean Lumens: NA
Max. Beam Candlepower: 1950
Luminaire Efficiency: 100.0%
Distributor Price1: $120.00
Lamp cost: $37.00
Multiplier to create equal illuminances2: 1.86
System TWO
6" recessed LED accent with 49 watt LED, 3000K light engine3
Rated Average Life: 50,000 hrs
Initial Lumens: 2820
Mean Lumens: 2660
Max. Beam Candlepower: NFL 25° 9740
Luminaire Efficiency: 94.1%
Distributor Price1: $525.00
Replacement Board & Driver cost: $80.00
Multiplier to create equal illuminances2: .37
System ONE — Base
6" recessed accent with 75 watt PAR30 120V halogen lamp3
Rated Average Life: 3000 hrs
Initial Lumens: 1050
Mean Lumens: (not published)
Max. Beam Candlepower: NFL 25° 4200
Luminaire Efficiency: 86.1%
Distributor Price1: $120.00
Lamp cost: $6.00
Multiplier to create equal illuminance between all three systems2: 1.00
1,2,3 See footnotes on next slide

LCCBA Example Footnotes: Multiplier1 Distributor cost reflects a 10% margin for luminaire and lamp.
2 Multiplier allows comparison between different lighting systems with dramatically different efficacies. In order to compare “apples to apples,” we can use a multiplier to assure an equal measure of illuminance from each system.
In this scenario, the accent lighting in Base System One would require 100 luminaires; System Two would require only 37 luminaires; and System Three would require 186 luminaires to provide similar lighting levels.
3 Distributor cost reflects a 10% margin for luminaire and lamp.

System One System Two System Three
Initial Costs:
Luminaire Cost $ 120.00 $ 525.00 $ 120.00
Lamp Cost 6.00 included 37.00
Installation Costs 60.00 65.00 60.00
TOTAL: $ 186.00 $ 590.00 $ 217.00
Initial Costs of a Single Luminaire

Annual Costs, 1st yr System One System Two System Three
Lamps $ 17.52 $ 14.024 $ 10.844
Labor ($6/lamp spot) relamping; $60/board and driver
17.52 10.514 1.754
Energy Costs (8760 hrs@ 12/kWh)
78.84 51.51 18.92
Air Conditioning 15.77 10.30 3.78
TOTAL: $ 129.65 $ 86.34 $ 22.70
Annual Costs for a Single LuminaireAnnual Costs, First Year (not discounted to current dollar values)
4 There are no expected lamp failures for Systems Two and Three for the first year. Average rated lamp life exceeds annual burning hours of 8760 hours. Figures listed are long-term averages of lamps per year.

10 Yr Life Cycle Costs System One System Two System Three
Lamps $ 175.20 $ 140.20 $ 108.40
Labor (spot relamping) 175.20 105.10 17.50
Energy Costs 788.40 515.10 189.20
Air Conditioning 157.70 103.00 37.80
Total 10 yr costsper fixture $1296.50 $ 863.40 $ 352.90
Total costs discounted (x .61391) $ 795.93 $ 530.05 $ 216.65
Ten Year Life Cycle Costs for One Luminaire(future cash flows discounted to current dollar value, interest rate 5%)
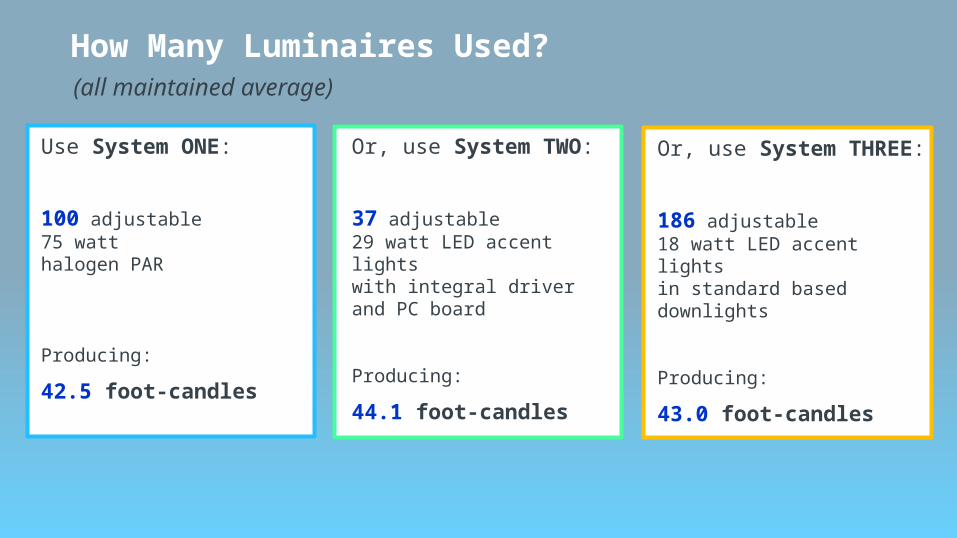
How Many Luminaires Used?
Or, use System THREE:
186 adjustable 18 watt LED accent lightsin standard based downlights
Producing:
43.0 foot-candles
Or, use System TWO:
37 adjustable 29 watt LED accent lightswith integral driverand PC board
Producing:
44.1 foot-candles
Use System ONE:
100 adjustable75 watthalogen PAR
Producing:
42.5 foot-candles
(all maintained average)

Simple Payback
System THREE
Initial Installed Cost:
$217.00 x 186 =
$40,362 - $18,600 =$21,762 / $39,296 =
.55 year payback
System TWO
Initial Installed Cost:
$590.00 x 37 =
$21,830 - $18,600 =$3230 / $18,816 =
.17 year payback
System ONE
Initial Installed Cost:
$186.00 x 100 = $18,600
(all maintained average)
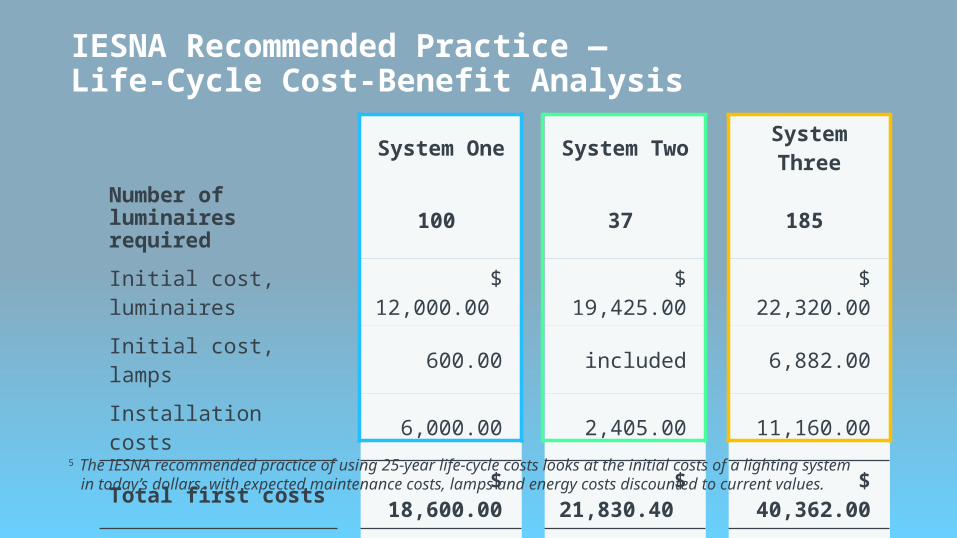
System One System Two System Three
Number of luminaires required 100 37 185
Initial cost, luminaires $ 12,000.00 $ 19,425.00 $ 22,320.00
Initial cost, lamps 600.00 included 6,882.00
Installation costs 6,000.00 2,405.00 11,160.00
Total first costs $ 18,600.00 $ 21,830.40 $ 40,362.00
Total life-cycle cost5 $ 79,593.00 $ 19,611.00 $ 40,297.00
TOTAL $ 98,193.00 $ 41,441.00 $ 80,650.00
IESNA Recommended Practice —Life-Cycle Cost-Benefit Analysis
5 The IESNA recommended practice of using 25-year life-cycle costs looks at the initial costs of a lighting system in today’s dollars, with expected maintenance costs, lamps and energy costs discounted to current values.

Lighting Power Density Criteria
System THREE
0.9 w/ft2 plus 0.9 for the fluorescent =
2.3+ (Very good)
System TWO
.76 w/ft2 plus 0.9 for the fluorescent =
1.66+ (Excellent),50% better than ASHRAE / IESNA 90.1-2010
System ONE
3.1 w/ft2 plus 0.9 for the fluorescent =
4.0+ (No good)
Limits for general merchandise retail spaces: 1.68 watts/ft2 general plus 1.6 w/ft2 accent.Total area: 2,400 ft2. The total allowable area for this space would be 3.28 w/ft2.
From ANSI/ASHRAE/IES 90.1-2010
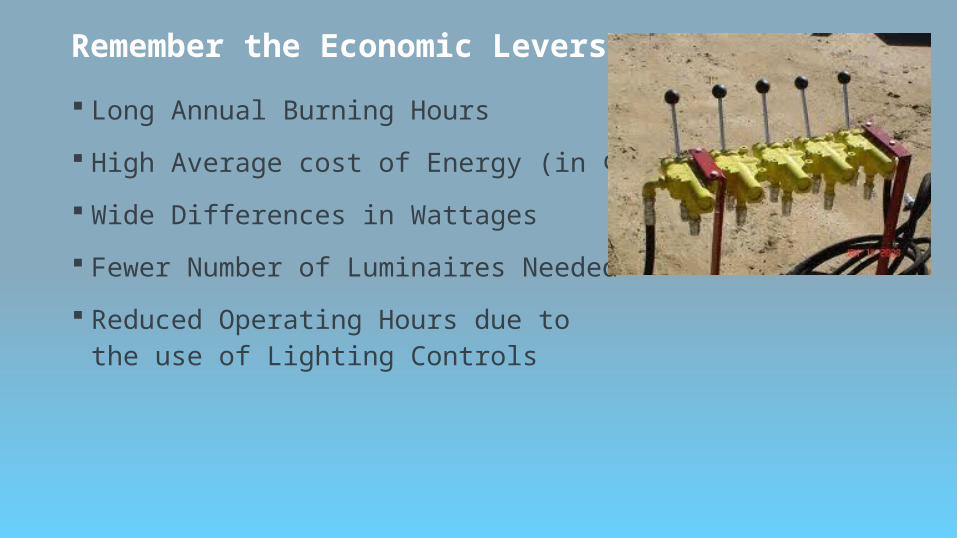
Remember the Economic Levers
Long Annual Burning Hours
High Average cost of Energy (in ¢/kWh)
Wide Differences in Wattages
Fewer Number of Luminaires Needed
Reduced Operating Hours due to the use of Lighting Controls
LED Differences
Are LEDs really all that different?
Why do we treat them differently than any other source?
Do some of these new methods of analysis give LEDs an unfair advantage: New CQS? LM-79 and absolute photometry? 100% efficiency? Really?
The short answer is NO.
But there are some differences that we need to consider…

Progress in LED performance has been rapid and has been described by Haitz as a logarithmic law: Light output levels from packaged LED devices have roughly doubled every two years while the cost has
halved."Solid State Lighting", Phys. Status Solidi A 208(1), 17-29 (2011)"The story of a new light source", Nature Photonics, 1, 25 (2007).
http://en.wikipedia.org/wiki/Light-emitting_diode
LED Performance (data to 2010)
LPW +35%
a year!
Cost –20%
a year!

Other Factors
Longer life, financial incentives DLC and Energy Star, controls, hours burned
Efficacy improvements, distribution improvements, quality of light
Apples to apples?
Microsoft Office Excel Worksheet

End of Life Questions
When is it, and how do I know when it happens?
What if it is ten years from now and nobody from the original staff is still in the building?
What do I do?

Upgrading LED Boards and Drivers
What will the future be like?
Where do I get replacement components?

Evaluating the Economics of LightingFactors to Consider
Initial cost
Installation labor and other costs
Total connected load (wattage including the drivers)
Maintenance
Cost to replace components
Costs of operation: energy, A/C effects, MRO

Important Principals of Financial Management
The Time Value of Money
Interest Rates / Cost of Capital
Risk and Return

risknoun \ˈrisk\
: the possibility that something bad or unpleasant (such as an injury or a loss) will happen
: someone or something that may cause something bad or unpleasant to happen
: a person or thing that someone judges to be a good or bad choice for insurance, a loan, etc.
from Merriam Webster online Dictionary

risknoun
In economics and finance, an allowance for the hazard (risk) in an investment or loan. Default risk refers to the chance that a borrower will not repay a loan. If a banker believes that a borrower may not repay a loan, the banker will charge the true INTEREST plus a premium for the default risk, the premium depending on the degree of presumed risk. All stock investment carries an implicit risk since there is no guarantee of return on investment. Trading or variability risk is the amount that the return may vary, up or down, from the expected return on investment.
from Merriam Webster online Concise Encyclopedia

Risk and Return
In order from safest (lower return) to riskiest (higher returns)…
o 1.1 Short-term loans to good government bodies
o 1.2 Mid- and long-term loans to good government bodies
o 1.3 Short-term loans to blue-chip corporations
o 1.4 Mid- and long-term loans to blue-chip corporations
o 1.5 Rental property
o 1.6 High-yield debt
o 1.7 Equity
o 1.8 Options and futures

So, What Are the Financial Risks When Making a Lighting Decision?
You have been oversold. The single lamp LED retrofit tube that only costs a dollar a year to operate does a terrible job of lighting your factory.
The company that sold you the new lighting system won’t be around in the future.
The LED color shifts and looks awful.
I can’t get replacement parts and I had some failures.
The luminaires I bought are designed to be throw-away units.There are no user serviceable parts, i.e., LED boards.

So, What Are the Financial Risks When Making a Lighting Decision?
I’ve never dealt with this company before. They sound promising,but will they support their product past the warranty period?What about honoring their warranty?
I was told by the salesman that since these LEDs are 6500 Kelvin and have a very high S/P ration, that half the foot-candles on the work surface or parking lot still meets IES because of the Scotopic Photopic multiplier published by the company.
No Nationally Recognized Testing lab (NRTL) report; company produced photometry; no IES reports; no LM-79 or TM-21 Report.
“Simulated IES Files” Jody Good, see LD+A Letters, April 2014

So, What Are the Financial Risks When Making a Lighting Decision?
Non-recognized test results: Anything over “calculated to L70 > 100,000 hrs” is suspect. Have they tested that same chipset for 16,667 hours? (2 years x 6). Possible, but… the “248,000 hours life” is a dead giveaway because the same chipset has not been tested for 4+ years. Predicted L70 is OK as long as the calculated value is also published on spec sheets.

So, What Are the Financial Risks When Making a Lighting Decision?
Errors: DLC and Energy Star on a brand new chipset or version. Obvious photometry mistakes, often copied from others or their own earlier fixture. Remember, updated testing takes time to generate! Generally, the integrity of the company means the most. A “No” answer to a question actually enhances a company’s credibility. “No DLC on this one yet as it is a higher lumen package, but it should meet it as soon as the test results come back.”
Whose drivers are you using? What is the estimated life of the driver according to IES LM-82? What milliamp (drive current) rating, and can you replace them with other off-the-shelf components?

So, What Are the Financial Risks When Making a Lighting Decision?
Risks: the Lighting Rep. Once sold, will they support you if something goes wrong?
Applications assistance: a major help in preventing pitfalls and with factory experience, sharing hints to make the application work with the luminaires (a BIG value). This gives the specifier someone to share the risk. A cord of three strands is not easily broken: the local Rep, the Factory, and the Specifier.
Warranty

Rewards or Return
Why are you using LEDs or OLEDs in the first place? Lower wattage, shorter hours, longer life (less maintenance), FEWER FIXTURES (potentially). LEDs often have much better distribution.
Award winning designs: A value to the design firm? Absolutely. It will help enhance their status among architects and clients and ultimately get them more work.

Risk: Complexity of Systems
Multiple components that can fail in a proprietary technology…
“More things that can break” — R.A. Selander
Example: the first electronic ballasts. 87 electrical components
Value Engineering: A value? To whom? The owner? The Distributor and Contractor?

Risk: Replaceable Components
Choose companies with a history of supporting their products.
If something does go wrong, what will be done about it? If a specifier isn’t really sure, they may be working with the wrong manufacturer. Again, integrity.
Venture capital funded startups have strong incentives to generate income and a disincentive to support problems in the field (as expenses come out of revenues).
However, startups invested in the long haul will support their early specifiers to establish their reputation and gain a loyal following.

Risk: Replaceable Components
Upgradability as better components become availableor if there are failures…
Every company has quality issues over time. How they handle them indicates integrity. Witness GM and the faulty ignition switches. Financial uncertainty at the time caused them to cover up their problems and not take care of them.
Pioneer products will always have a higher failure rate than second generation products.

Risk: Replaceable Components
Reducing the risks…
UL, CSA, ETL and other Nationally Recognized Testing Labs (NRTL) Certification.
An LM-79, LM-80, and TM-21 report for each new driver/chip set.
Design Lights Consortium, Lighting Facts, Energy Star listings all add credibility.
Awards for new products: Next Gen LED, PIA awards, LFI Innovation awards, IES Progress Report recognition, etc., add credence by being recognized by specifiers and industry experts sitting on the judging panels.

Risks Associated with Organic LEDs (OLEDs)
Very expensive per lumen
Shorter life than LEDs: 12,000 hrs vs. 50,000 hrs
Lower efficacies than LEDs
Very few suppliers currently
New design challenges to use OLEDs
Not a strong ROI story… yet

The Upside of Using OLEDs
Can create an elegant, low-luminance and comfortable design
They will only…
– Come down in price
– Improve in efficacy
– Increase their calculated lifetimes
They may never catch up to LEDs in life or efficacies, but they are a different form factor. And they may still make sense financially when compared to traditional sources. A totally different way to light a space.

What Do We Do with the Risks Associated with LEDs and OLEDs?
Factoring in a percentage value for each point of risk…
For example:
Manufacturer’s reputation rated 1-10, “10” being impeccable, with a long history of standing by their products with the specifier, financially strong, quality products. No risk surcharge.
A rating of “5” would reflect being less certain from personal history with this specifier or occasions in the past when they have not supported the specifier fully when problems occurred. In some cases, the rep is more significant in this situation. A 2% risk surcharge is deducted from the NPV or added to the LCCBA analysis, with a rating of 5 or lower.

What Do We Do with the Risks Associated with LEDs and OLEDs?
If this seems cumbersome, if there is real or perceived risk though the use of a relatively new source, this extra analysis may be all the more important for the specifier to include in their economic review.
Mark Rea, Director of Lighting Programs at the Lighting Research Center has written a new book: Value Metrics for Better Lighting, SPIE Publishing, 2012. Dr. Rea’s premise is that everything can be monetized or valued in dollars and cents, from labor rates to color. Once a value has been placed on a feature, or risk factor, intelligent conclusions can be made through the use of analytical tools like the ones in this presentation. Available through the IES and Amazon.

Some Observations from Lighting Professionals
“With LEDs, you get what you pay for” Ardra Zinkon, TEC Lighting Columbus
“It's unwise to pay too much, but it's worse to pay too little. Whenyou pay too much, you lose a little money - that's all. When you paytoo little, you sometimes lose everything, because the thing youbought was incapable of doing the thing it was bought to do. Thecommon law of business balance prohibits paying a little and getting alot - it can't be done. If you deal with the lowest bidder, it is wellto add something for the risk you run, and if you do that you willhave enough to pay for something better.” John Ruskin, quote shared by Diane Rodriguez, Circle Design Indianapolis

Final Observations from Lighting Professionals
“You might think that you can save money by buying a very inexpensive off-shore outdoor LED unit but remember to include the price of a new replacement in your cost analysis” Willard Warren, Willard L Warren Associates, New York
“There are places where LED doesn’t make sense at the present time” Chip Israel, Lighting Design Alliance, Long Beach

Summary of Formulae
Cost of Light
Time Valueof Money
Initial Costs
Energy Costs
Annual Costs of Maintenance
ReplacementLamp Costs
Initial Costs =(Equipment Cost) + {(Installation Hrs) × (Electrical Labor$/Hr)}
Annual Energy Costs =N × (kW/Luminaire) × ($/kWh) × (Hours/Year)
Maintenance Costs =(Materials) + {(Maint. Hrs) × (Maint. Labor $/Hr)}
Cost per million = (1,000,000) × (Total Cost)lumen-hours (Total Lumens) × (Hours of Operation)
Number of Lamps Replaced Per Year =(Total Number of Lamps) × (Operating Hrs/Yr) (Lamp Life in Hrs)
FVPV = (1 + k)n