Embed Size (px)
Citation preview

Consumer & Retail M&A Report
Q4 2016
HYDE PARK CAPITAL
Member FINRA/SIPC
Investment Banking | Mergers & Acquisitions | Capital Raising Integrity | Expertise | Results
Hyde Park Capital Advisors, LLC 701 N. Franklin Street
Tampa, FL 33602 Tel: 813-383-0202
www.hydeparkcapital.com
John Hill Senior Managing Director [email protected] (813) 383-0205 John McDonald Senior Managing Director [email protected] (813) 383-0206 Keith Hodgdon Managing Director [email protected] (813) 383-0208 Jami Gold Vice President [email protected] (813) 383-0203 Greg Bosl Vice President [email protected] (813) 597-2649 Jeffrey Hendricks Vice President [email protected] (678) 523-3073 Kenneth Burnside Business Development Officer [email protected] (864) 905-9633

HYDE PARK CAPITAL Investment Banking | Mergers & Acquisitions | Capital Raising
80%
90%
100%
110%
120%
Dec-15 Mar-16 Jun-16 Sep-16 Dec-16
S&P 500 S&P 500 Retailing Index S&P 500 Consumer Durables & Apparel Index
Public Market Performance (LTM)
Commentary Select Public Offerings – Consumer & Retail (Q4 2016)
Public Company Market Performance by Sector
Source: S&P Capital IQ
2
Capital Markets Overview – Consumer & Retail
The S&P 500 and S&P 500 Retailing Index increased 11.2% and 6.9% respectively, while the S&P 500 Consumer Durables & Apparel Index decreased 6.1% for the twelve month period ending December 31, 2016.
The table on the right illustrates select public offerings completed in Q4 2016. Acushnet Holdings Corp. (NYSE:GOLF), which develops, manufactures and distributes golf products, raised $329 million in the largest IPO during the quarter.
The Beverages and Packaged Foods sectors were the industry’s leaders with respect to valuation during the 4th quarter, trading at EBITDA multiples of 14.8x and 13.2x, respectively.
6.9%
11.2%
6.1%
Industry Sector 3 Months 12 months Revenue EBITDA
Specialty Retail 0.6% (3.3%) 0.6x 7.4x
Department Store Retail 0.1% (3.9%) 0.5x 6.6x
Discount Stores & Mass Merchants (0.5%) 6.9% 0.6x 10.4x
Apparel, Accessories & Footwear Retail 0.6% (0.7%) 0.6x 6.2x
Apparel, Accessories & Footwear (6.4%) (13.0%) 1.1x 9.7x
Furniture & Furnishings Retail 0.9% 3.5% 0.7x 7.0x
Furniture & Furnishings Manufacturers 20.3% 19.9% 1.2x 9.7x
Personal Care Products (6.4%) 3.9% 1.5x 11.6x
Household Products (1.9%) 9.5% 2.7x 12.0x
Recreational & Leisure Products 1.3% 11.3% 1.4x 10.0x
Restaurants 1.2% 2.1% 1.7x 11.0x
Packaged Foods (7.8%) 3.1% 2.3x 13.2x
Beverages (3.5%) 0.0% 5.1x 14.8x
Food Retail 8.4% (4.1%) 0.6x 8.4x
Change in Stock Price Enterprise Value / LTM
Median
Offer Date Issuer Industry Sector Transaction Type
Transaction
Value ($mm)
12/12/16 The Michaels Companies, Inc. Speciality Retail Secondary $264
11/30/16 Bojangles', Inc. Restaurants Secondary $104
11/29/16 Constellation Brands, Inc. Beverages Fixed Income $599
11/07/16 Kellogg Co. Packaged Foods Fixed Income $599
11/02/16 Wingstop, Inc. Restaurants Secondary $178
11/01/16 Walgreens Boots Alliance, Inc. Speciality Retail Secondary $1,668
10/27/16 Acushnet Holdings Corp. Recreational & Leisure Products IPO $329
10/24/16 Netflix, Inc. Recreational & Leisure Products Fixed Income $1,000
10/18/16 NIKE, Inc. Apparel, Accesseries & Footwear Fixed Income $1,493
10/03/16 Pepsico, Inc. Beverages Fixed Income $4,487

HYDE PARK CAPITAL Investment Banking | Mergers & Acquisitions | Capital Raising
As detailed in the charts below, Middle Market M&A activity in the Consumer & Retail industry declined during the twelve month period ended December 31, 2016, with 141 closed transactions, a 26% decrease from the 190 transactions that closed during the prior year period.
Despite a significant drop in deal volume, the total value of
completed Middle Market M&A transactions in the Consumer & Retail industry during 2016 fell only 5% to $20.9 billion, down from $22.1 billion during 2015.
Although Middle Market Consumer & Retail M&A activity declined throughout the year, completed deal volume and deal value increased for transactions valued between $500 million and $1 billion, rising 50% and 45%, respectively.
Commentary
U.S. M&A Activity – Annual Trends: VALUE
To
tal T
ran
sact
ion
Vo
lum
e
To
tal T
ran
sact
ion
Val
ue
($ i
n b
illi
ons)
Annual M&A Activity – Consumer & Retail
3
U.S. M&A Activity – Annual Trends: VOLUME
($ in billions)
Completed U.S. M&A Transactions by Deal Size
Less than $100M $100 - $499M $500 - $999MLess than $100M $100 - $499M $500 - $999M
Source: S&P Capital IQ (middle market includes all closed deals with disclosed deal value between $10 million and $1 billion)
Deal Size Volume Value Volume Value Volume Value
Less than $100M 125 $4.4 85 $3.5 (32%) (21%)
$100 - $499M 57 $12.4 44 $9.7 (23%) (21%)
$500 - $999M 8 $5.3 12 $7.7 50% 45%
Total Middle Market 190 $22.1 141 $20.9 (26%) (5%)=
% of Total Market
Less than $100M 66% 20% 60% 17%
$100 - $499M 30% 56% 31% 46%
$500 - $999M 4% 24% 9% 37%
Total Middle Market 100% 100% 100% 100%
2015 2016 % Change
190
231
221
192
131
151
176
212
140
195
190
141
0
50
100
150
200
250
2005 2006 2007 2008 2009 2010 2011 2012 2013 2014 2015 2016
$26.3
$28.2
$30.2
$22.1
$13.9
$21.7 $21.2
$27.3
$17.8
$26.1
$22.1$20.9
$0
$5
$10
$15
$20
$25
$30
$35
2005 2006 2007 2008 2009 2010 2011 2012 2013 2014 2015 2016

HYDE PARK CAPITAL Investment Banking | Mergers & Acquisitions | Capital Raising
Quarterly M&A Activity – Consumer & Retail
U.S. M&A Activity – Quarterly Trends: VALUE U.S. M&A Activity – Quarterly Trends: VOLUME
Completed U.S. M&A Transactions by Deal Size
To
tal T
ran
sact
ion
Vo
lum
e
To
tal T
ran
sact
ion
Val
ue
($ i
n b
illi
ons)
4
Commentary
As detailed in the charts below, Middle Market M&A activity in the Consumer & Retail industry decreased during Q4 2016 compared with Q4 2015. Middle Market M&A transaction volume decreased to 35 transactions, down 38% from 56 transactions in the prior year period.
The total value of completed Middle Market M&A transactions in the Consumer & Retail industry fell 17% to $5.6 billion, down from $6.8 billion in Q4 2015.
Transactions valued between $100 million and $499 million had
the steepest declines during Q4 2016, as deal volume fell 61% and completed deal value dropped 55% compared with the prior year period.
Less than $100M $100 - $499M $500 - $999MLess than $100M $100 - $499M $500 - $999M
Source: S&P Capital IQ (middle market includes all closed deals with disclosed deal value between $10 million and $1 billion)
($ in billions)
Deal Size Volume Value Volume Value Volume Value
Less than $100M 35 $1.1 23 $0.8 (34%) (26%)
$100 - $499M 18 $3.6 7 $1.6 (61%) (55%)
$500 - $999M 3 $2.1 5 $3.3 67% 52%
Total Middle Market 56 $6.8 35 $5.6 (38%) (17%)
% of Total Market
Less than $100M 63% 16% 66% 14%
$100 - $499M 32% 52% 20% 28%
$500 - $999M 5% 32% 14% 58%
Total Middle Market 100% 100% 100% 100%
Q4 2015 Q4 2016 % Change
25 25
43
47
37
5653
49
41
4647
56
40
28
3835
0
10
20
30
40
50
60
Q1'13 Q2'13 Q3'13 Q4'13 Q1'14 Q2'14 Q3'14 Q4'14 Q1'15 Q2 '15 Q3 '15 Q4 '15 Q1 '16 Q2 '16 Q3'16 Q4 '16
$2.6$2.9
$6.4
$5.9
$5.0
$6.1
$7.5 $7.5
$2.8
$6.7
$5.7
$6.8$6.6
$3.9
$4.8
$5.6
$0
$2
$4
$6
$8
Q1'13 Q2'13 Q3'13 Q4'13 Q1'14 Q2'14 Q3'14 Q4'14 Q1'15 Q2 '15 Q3 '15 Q4 '15 Q1'16 Q2 '16 Q3'16 Q4 '16

HYDE PARK CAPITAL Investment Banking | Mergers & Acquisitions | Capital Raising
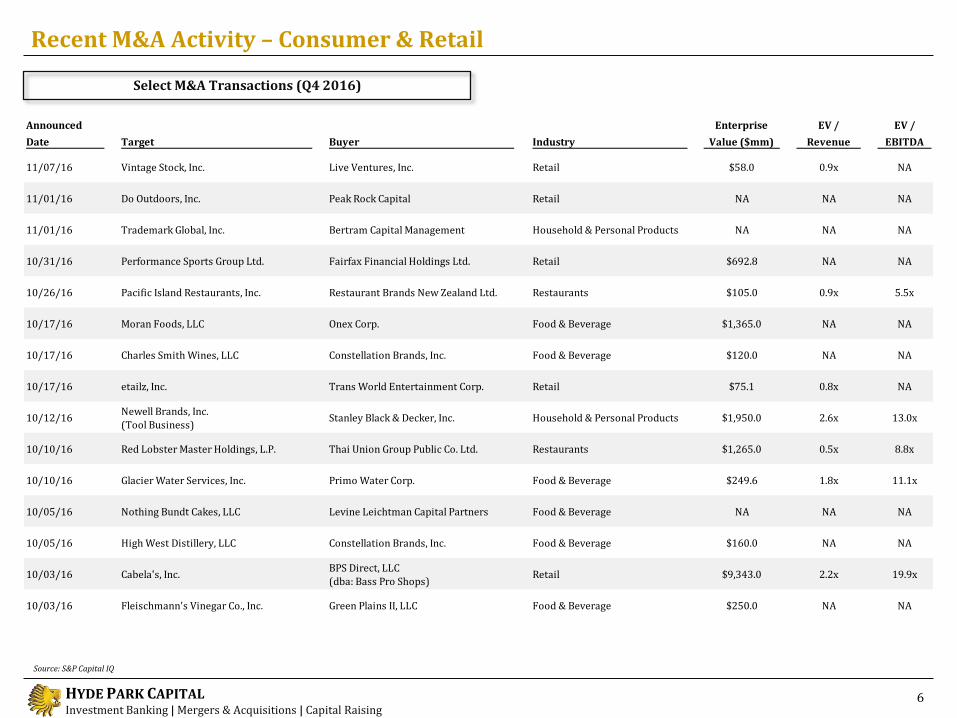
Recent M&A Activity – Consumer & Retail
Select M&A Transactions (Q4 2016)
5
Source: S&P Capital IQ
Announced
Date Target Buyer Industry
Enterprise
Value ($mm)
EV /
Revenue
EV /
EBITDA
12/19/16 Brown Jordan International, Inc. Littlejohn & Co. LLC Household & Personal Products NA NA NA
12/14/16 Innocor, Inc. Bain Capital Private Equity Household & Personal Products NA NA NA
12/13/16 Allen Edmonds Corp. Caleres, Inc. Apparel, Accessories & Footwear $255.0 NA NA
12/12/16 Smith Mountain Industries, Inc. Newell Brands, Inc. Household & Personal Products $100.0 NA NA
11/29/16 GNP Co. Pilgrim's Pride Corp. Food & Beverage $350.0 NA NA
11/22/16 BAI Brands, LLC Mott's, LLP Food & Beverage NA NA NA
11/22/16 PersonalizationMall.com, Inc. Bed Bath & Beyond, Inc. Retail $190.0 NA NA
11/21/16 Clougherty Packing, LLC Smithfield Foods, Inc. Food & Beverage $145.0 NA NA
11/20/16 LifeLock, Inc. Symantec Corp. Retail $2,362.1 3.6x 50.0x
11/17/16 Bellisio Foods, Inc. Charoen Pokphand Foods Public Co. Ltd. Food & Beverage $1,075.0 NA NA
11/14/16 Harman International Industries, Inc. Samsung Electronics America, Inc. Retail $8,854.4 1.3x 10.4x
11/14/16 Too Faced Cosmetics, LLC The Estée Lauder Co., Inc. Retail $1,450.0 NA NA
11/14/16 Peacock Foods, LLC Greencore Group plc Food & Beverage $747.5 0.8x 15.8x
11/07/16 Golfsmith Int. Holdings, Inc. Dick's Sporting Goods, Inc. Retail $43.0 NA NA
11/07/16 Blue Nile, Inc. Bain Capital Private Equity Retail $456.0 1.0x 27.8x
HYDE PARK CAPITAL Investment Banking | Mergers & Acquisitions | Capital Raising
Recent M&A Activity – Consumer & Retail
Select M&A Transactions (Q4 2016)
6
Source: S&P Capital IQ
Announced
Date Target Buyer Industry
Enterprise
Value ($mm)
EV /
Revenue
EV /
EBITDA
11/07/16 Vintage Stock, Inc. Live Ventures, Inc. Retail $58.0 0.9x NA
11/01/16 Do Outdoors, Inc. Peak Rock Capital Retail NA NA NA
11/01/16 Trademark Global, Inc. Bertram Capital Management Household & Personal Products NA NA NA
10/31/16 Performance Sports Group Ltd. Fairfax Financial Holdings Ltd. Retail $692.8 NA NA
10/26/16 Pacific Island Restaurants, Inc. Restaurant Brands New Zealand Ltd. Restaurants $105.0 0.9x 5.5x
10/17/16 Moran Foods, LLC Onex Corp. Food & Beverage $1,365.0 NA NA
10/17/16 Charles Smith Wines, LLC Constellation Brands, Inc. Food & Beverage $120.0 NA NA
10/17/16 etailz, Inc. Trans World Entertainment Corp. Retail $75.1 0.8x NA
10/12/16Newell Brands, Inc. (Tool Business)
Stanley Black & Decker, Inc. Household & Personal Products $1,950.0 2.6x 13.0x
10/10/16 Red Lobster Master Holdings, L.P. Thai Union Group Public Co. Ltd. Restaurants $1,265.0 0.5x 8.8x
10/10/16 Glacier Water Services, Inc. Primo Water Corp. Food & Beverage $249.6 1.8x 11.1x
10/05/16 Nothing Bundt Cakes, LLC Levine Leichtman Capital Partners Food & Beverage NA NA NA
10/05/16 High West Distillery, LLC Constellation Brands, Inc. Food & Beverage $160.0 NA NA
10/03/16 Cabela's, Inc.BPS Direct, LLC (dba: Bass Pro Shops)
Retail $9,343.0 2.2x 19.9x
10/03/16 Fleischmann's Vinegar Co., Inc. Green Plains II, LLC Food & Beverage $250.0 NA NA
HYDE PARK CAPITAL Investment Banking | Mergers & Acquisitions | Capital Raising
Q4 2015 Q4 2016
Q4 2015 Q4 2016
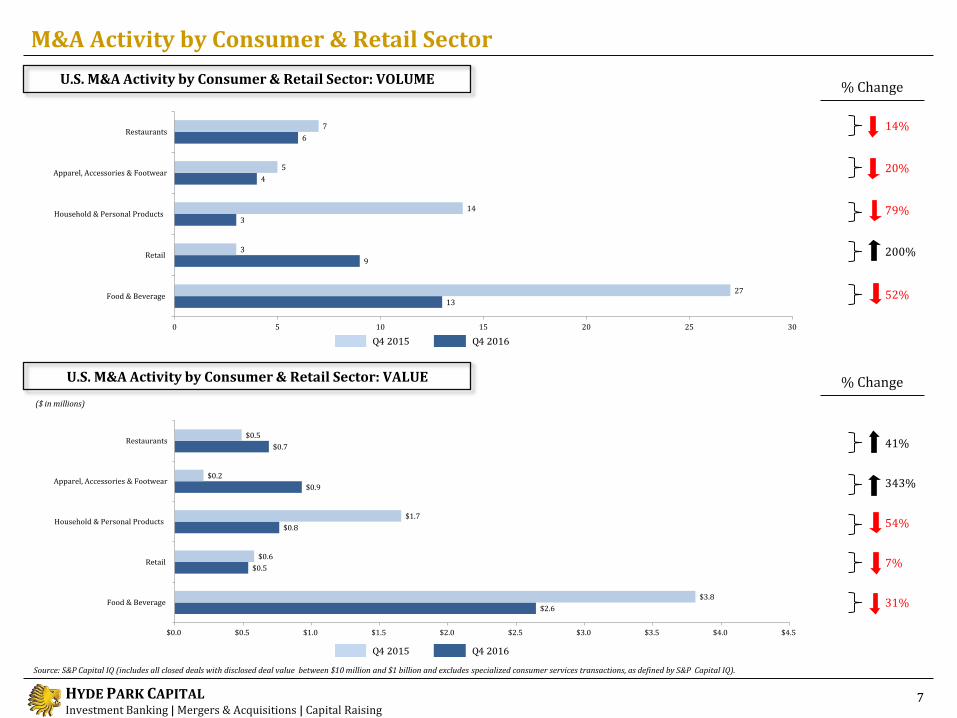
M&A Activity by Consumer & Retail Sector
7
($ in millions)
Source: S&P Capital IQ (includes all closed deals with disclosed deal value between $10 million and $1 billion and excludes specialized consumer services transactions, as defined by S&P Capital IQ).
U.S. M&A Activity by Consumer & Retail Sector: VOLUME
U.S. M&A Activity by Consumer & Retail Sector: VALUE
% Change
% Change
54%
31%
41%
7%
343%
79%
52%
14%
20%
$2.6
$0.5
$0.8
$0.9
$0.7
$3.8
$0.6
$1.7
$0.2
$0.5
$0.0 $0.5 $1.0 $1.5 $2.0 $2.5 $3.0 $3.5 $4.0 $4.5
Food & Beverage
Retail
Household & Personal Products
Apparel, Accessories & Footwear
Restaurants
13
9
3
4
6
27
3
14
5
7
0 5 10 15 20 25 30
Food & Beverage
Retail
Household & Personal Products
Apparel, Accessories & Footwear
Restaurants
200%

HYDE PARK CAPITAL Investment Banking | Mergers & Acquisitions | Capital Raising
Financial sponsors were active investors across many sectors of the Consumer & Retail industry in Q4 2016, as shown in the table on the right.
Several notable financial sponsor led transactions were
announced during Q4 2016, including the Onex Corp.’s acquisition of Moran Foods, LLC for over $1.3 billion; Bain Capital Private Equity’s acquisition of Blue Nile, Inc. for $456 million; and Berkshire Partners’ proposed purchase of Kendra Scott Design, Inc.
During Q4 2016, financial sponsors were most active in the Restaurants sector, announcing 15 deals.
Commentary Select Private Equity Transactions (Q4 2016)
Financial Sponsors Industry Transactions
Private Equity Activity – Consumer & Retail
8
Source: S&P Capital IQ
To
tal T
ran
sact
ion
Vo
lum
e
0
2
4
6
8
10
12
14
16
Household & PersonalProducts
Restaurants Food & Beverage Retail Apparel, Accessories &Footware
Announced Date Target Buyer Industry
Enterprise
Value ($mm)
12/22/16 Gabriel Brothers, Inc. Warburg Pincus Apparel, Accessories &
FootwearNA
12/21/16 Kendra Scott Design, Inc. Berkshire PartnersApparel, Accessories &
FootwearNA
12/20/16 PepperJax Development, Inc. TA Associates Management Restaurants NA
12/19/16 Brown Jordan International, Inc. Littlejohn & Co.Household & Personal
ProductsNA
12/14/16 Innocor, Inc. Bain Capital Private EquityHousehold & Personal
ProductsNA
11/29/16 Pyramyd Air, Ltd. Gen Cap America Retail NA
11/28/16 Snyder's-Lance, Inc. Blue Road Management Food & Beverage NA
11/28/16 BioMatrix, LLC Acon Investments Retail NA
11/22/16 Stanton Carpet Corp. Quad-C Management, Inc.Household & Personal
ProductsNA
11/21/16 Lasko Products, Inc. Comvest PartnersHousehold & Personal
ProductsNA
11/10/16 Mercer Foods, Inc. Graham Partners Food & Beverage NA
11/10/16 Cardenas Market, Inc. KKR & Co. /
Victory Park Capital Food & Beverage NA
11/07/16 Blue Nile, Inc. Bain Capital Private Equity Retail $456
11/01/16 Trademark Global, Inc. Bertram Capital Household & Personal
ProductsNA
10/31/16 Hillside Candy, LLC Highlander Partners Food & Beverage NA
10/24/16 Stonefire Grill, Inc. Goode Partners Restaurants NA
10/17/16 Moran Foods, LLC Onex Corp. Food & Beverage $1,365
10/10/16 Forman Mills, Inc. Goode PartnersApparel, Accessories & Footwear
NA
10/04/16 The Worth Collection, Ltd. New Water CapitalApparel, Accessories &
FootwearNA
10/04/16 Kronos Foods, Inc. Grey Mountain Partners Food & Beverage NA

HYDE PARK CAPITAL Investment Banking | Mergers & Acquisitions | Capital Raising
70%
80%
90%
100%
110%
120%
Dec-15 Mar-16 Jun-16 Sep-16 Dec-16
S&P 500 Department Store Retail Index
80%
90%
100%
110%
120%
Dec-15 Mar-16 Jun-16 Sep-16 Dec-16
S&P 500 Discount Stores & Mass Merchants Index
80%
90%
100%
110%
120%
Dec-15 Mar-16 Jun-16 Sep-16 Dec-16
S&P 500 Specialty Retail Index - Large/Mid Cap Specialty Retail Index - Small/Micro Cap
Industry Sector Overview – Recent Stock Price Performance
9
Source: S&P Capital IQ
The charts on the following pages detail the recent stock price performance by sector for the leading public companies within the Consumer & Retail industry for the trailing 12-month period ended December 31, 2016. The shaded section is the most recent 3-month period (Q4) for each sector index relative to the S&P 500.
The sectors in the Consumer and Retail industry had mixed results during
the 12-month period ended December 31, 2016. The Furniture and Furnishings Manufacturers and Household Products sectors increased the most, rising 19.9% and 11.3%, respectively. The Apparel, Accessories & Footwear Retail sector had the largest decline, falling 14.5%.
During Q4 2016, sector performance was mixed. Furniture and Furnishings Manufacturers and Food Retail led the industry, increasing 20.3% and 8.4%, respectively. Packaged Foods and Personal Care Products had the worst performances, falling 7.8% and 6.4%, respectively.
6.4%
3.9%
Specialty Retail
Department Store Retail
Commentary
Discount Stores & Mass Merchants
11.2%
3.4%
11.2%
6.9%
11.2%

HYDE PARK CAPITAL Investment Banking | Mergers & Acquisitions | Capital Raising
80%
90%
100%
110%
120%
130%
Dec-15 Mar-16 Jun-16 Sep-16 Dec-16
S&P 500 Furniture & Furnishings Retail
80%
90%
100%
110%
120%
130%
Dec-15 Mar-16 Jun-16 Sep-16 Dec-16
S&P 500 Furniture & Furnishings Manufacturers
80%
90%
100%
110%
120%
Dec-15 Mar-16 Jun-16 Sep-16 Dec-16S&P 500Apparel, Accessories & Footwear Index - Large/Mid CapApparel, Accessories & Footwear Index - Small/Micro Cap
80%
90%
100%
110%
120%
Dec-15 Mar-16 Jun-16 Sep-16 Dec-16
S&P 500Apparel, Accessories & Footwear Retail Index - Large/Mid CapApparel, Accessories & Footwear Retail Index - Small/Micro Cap
Industry Sector Overview – Recent Stock Price Performance
10
Source: S&P Capital IQ
Furniture & Furnishings Retail
Apparel, Accessories & Footwear Retail Apparel, Accessories & Footwear
Furniture & Furnishings Manufacturers
14.5%
11.4%
11.2%
11.2% 11.2%
11.2%
0.1%
13.0%
3.5%
19.9%

HYDE PARK CAPITAL Investment Banking | Mergers & Acquisitions | Capital Raising
80%
90%
100%
110%
120%
Dec-15 Mar-16 Jun-16 Sep-16 Dec-16
S&P 500 Restaurants Index - Large/Mid Cap Restaurants Index - Small/Micro Cap
80%
90%
100%
110%
120%
Dec-15 Mar-16 Jun-16 Sep-16 Dec-16
S&P 500 Recreational & Leisure Products Index
80%
90%
100%
110%
120%
Dec-15 Mar-16 Jun-16 Sep-16 Dec-16
S&P 500 Household Products Index
80%
90%
100%
110%
120%
Dec-15 Mar-16 Jun-16 Sep-16 Dec-16
S&P 500 Personal Care Products Index
Industry Sector Overview – Recent Stock Price Performance
11
Source: S&P Capital IQ
9.5%
2.0%
Recreational & Leisure Products
Personal Care Products Household Products
Restaurants
11.2%
3.9%
11.2%
11.2%
11.2%
11.3%
6.5%

HYDE PARK CAPITAL Investment Banking | Mergers & Acquisitions | Capital Raising
80%
90%
100%
110%
120%
Dec-15 Mar-16 Jun-16 Sep-16 Dec-16
S&P 500 Food Retail Index
80%
90%
100%
110%
120%
Dec-15 Mar-16 Jun-16 Sep-16 Dec-16
S&P 500 Beverages Index
90%
100%
110%
120%
Dec-15 Mar-16 Jun-16 Sep-16 Dec-16
S&P 500 Packaged Foods Index
Industry Sector Overview – Recent Stock Price Performance
12
Source: S&P Capital IQ
0.0%
3.1%
Packaged Foods Beverages
Food Retail
11.2% 11.2%
11.2%
4.1%

HYDE PARK CAPITAL Investment Banking | Mergers & Acquisitions | Capital Raising
Industry Sector Overview – Public Company Analysis
($ in millions, except per share)
13
Specialty Retail
Large & Mid Cap
Source: S&P Capital IQ. * Excluded from the average and median calculation.
Closing Price % of 52 Equity Enterprise
Company Ticker 12/30/16 Week High Value Value Revenue Gross Profit EBITDA Gross Profit EBITDA Revenue EBITDAThe Home Depot, Inc. HD $134.08 96.5% $167,198 $186,490 $93,368 $31,916 $14,932 34.2% 16.0% 2.0x 12.5xCVS Caremark Corp. CVS $78.91 74.0% $86,012 $110,487 $172,701 $28,567 $12,839 16.5% 7.4% 0.6x 8.6xWalgreens Boots Alliance, Inc. WBA $82.76 94.0% $90,086 $99,727 $116,819 $29,571 $7,886 25.3% 6.8% 0.9x 12.6xLowe's Companies, Inc. LOW $71.12 85.0% $63,457 $77,678 $62,469 $21,620 $7,536 34.6% 12.1% 1.2x 10.3xBest Buy Co., Inc. BBY $42.67 86.4% $14,004 $12,090 $39,544 $9,360 $2,479 23.7% 6.3% 0.3x 4.9x
Tractor Supply Co. TSCO $75.81 78.0% $10,216 $10,484 $6,510 $2,240 $809 34.4% 12.4% 1.6x 13.0xTiffany & Co. TIF $77.43 90.6% $9,776 $10,111 $3,986 $2,467 $935 61.9% 23.5% 2.5x 10.8xCabela's, Inc. CAB $58.55 92.1% $4,033 $8,780 $4,199 $1,737 $470 41.4% 11.2% 2.1x 18.7x*Dick's Sporting Goods, Inc. DKS $53.10 84.4% $5,989 $6,170 $7,679 $2,318 $725 30.2% 9.4% 0.8x 8.5xStaples, Inc. SPLS $9.05 79.6% $5,858 $5,837 $20,476 $5,310 $1,359 25.9% 6.6% 0.3x 4.3xOffice Depot, Inc. ODP $7.10 75.5% $3,941 $4,381 $14,485 $3,502 $674 24.2% 4.7% 0.3x 6.5x
GNC Holdings, Inc. GNC $11.04 30.8% $797 $2,308 $2,555 $918 $415 35.9% 16.2% 0.9x 5.6xFossil, Inc. FOSL $25.86 49.8% $1,248 $1,750 $3,076 $1,615 $286 52.5% 9.3% 0.6x 6.1xConns, Inc. CONN $12.65 53.9% $392 $1,593 $1,621 $306 NM 18.9% NM 1.0x NM
Average 76.5% $33,072 $38,420 $39,249 $10,103 $4,612 32.8% 10.9% 1.1x 8.6x
Median 82.0% $7,882 $9,445 $11,082 $2,984 $1,453 32.2% 7.4% 0.9x 8.6x
Enterprise Value /
LTM LTM Margins LTM

HYDE PARK CAPITAL Investment Banking | Mergers & Acquisitions | Capital Raising
Closing Price % of 52 Equity Enterprise
Company Ticker 12/30/16 Week High Value Value Revenue Gross Profit EBITDA Gross Profit EBITDA Revenue EBITDA
Barnes & Noble, Inc. BKS $11.15 81.8% $820 $1,000 $4,063 $1,290 $170 31.8% 4.2% 0.2x 5.9x
Hibbett Sports, Inc. HIBB $37.30 81.4% $844 $806 $972 $343 $126 35.3% 12.9% 0.8x 6.4x
Vitamin Shoppe, Inc. VSI $23.75 71.1% $600 $723 $1,278 $535 $126 41.9% 9.9% 0.6x 5.7x
Regis Corp. RGS $14.52 87.7% $681 $652 $1,772 $555 $87 31.3% 4.9% 0.4x 7.5x
Marinemax, Inc. HZO $19.35 87.8% $480 $610 $942 $226 $48 24.0% 5.1% 0.6x 12.6x*
Movado Group, Inc. MOV $28.75 90.0% $668 $506 $565 $305 $70 54.0% 12.4% 0.9x 7.2x
Lumber Liquidators Holdings, Inc. LL $15.74 78.3% $427 $438 $950 $277 ($82) 29.2% (8.7%) 0.5x NM
Big 5 Sporting Goods Corp. BGFV $17.35 85.3% $378 $399 $1,030 $323 $43 31.4% 4.2% 0.4x 9.2x
Build-A-Bear Workshop, Inc. BBW $13.75 86.8% $217 $205 $372 $175 $28 47.2% 7.5% 0.6x 7.4x
Average 83.3% $568 $593 $1,327 $448 $149 36.2% 5.8% 0.6x 7.1x
Median 85.3% $600 $610 $972 $323 $70 31.8% 4.5% 0.6x 7.2x
Enterprise Value /
LTM LTM Margins LTM
Industry Sector Overview – Public Company Analysis
Specialty Retail
($ in millions, except per share)
14
Small & Micro Cap
Source: S&P Capital IQ. * Excluded from the average and median calculation.

HYDE PARK CAPITAL Investment Banking | Mergers & Acquisitions | Capital Raising
Closing Price % of 52 Equity Enterprise
Company Ticker 12/30/16 Week High Value Value Revenue Gross Profit EBITDA Gross Profit EBITDA Revenue EBITDA
Wal-Mart Stores, Inc. WMT $69.12 91.9% $216,812 $262,597 $484,604 $124,092 $33,006 25.6% 6.8% 0.5x 8.0x
Costco Wholesale Corp. COST $160.11 94.4% $70,616 $71,232 $119,598 $16,030 $5,035 13.4% 4.2% 0.6x 14.1x
Target Corp. TGT $72.23 85.8% $42,995 $54,341 $70,431 $21,079 $7,471 29.9% 10.6% 0.8x 7.3x
Dollar Tree, Inc. DLTR $77.18 77.2% $18,251 $24,238 $20,449 $7,260 $2,268 35.5% 11.1% 1.2x 10.7x
Dollar General Corp. DG $74.07 76.5% $21,141 $24,131 $21,264 $6,564 $2,373 30.9% 11.2% 1.1x 10.2x
Big Lots, Inc. BIG $50.21 88.8% $2,360 $2,665 $5,205 $2,093 $385 40.2% 7.4% 0.5x 6.9x
PriceSmart, Inc. PSMT $83.50 88.0% $2,501 $2,396 $2,933 $462 $181 15.8% 6.2% 0.8x 13.3x
Fred's, Inc. FRED $18.56 85.3% $682 $753 $2,150 $517 ($6) 24.1% (0.3%) 0.4x NM
Tuesday Morning Corp. TUES $5.40 58.5% $236 $255 $966 $346 $16 35.9% 1.7% 0.3x 15.9x
Gordmans Stores, Inc. GMAN $0.69 21.1% $13 $89 $632 $260 $3 41.2% 0.5% 0.1x 26.8x*
Average 76.8% $37,561 $44,270 $72,823 $17,870 $5,073 29.2% 5.9% 0.6x 10.8x
Median 85.5% $10,376 $13,398 $12,827 $4,329 $1,326 30.4% 6.5% 0.6x 10.4x
LTM LTM Margins LTM
Enterprise Value /
Closing Price % of 52 Equity Enterprise
Company Ticker 12/30/16 Week High Value Value Revenue Gross Profit EBITDA Gross Profit EBITDA Revenue EBITDA
Macy's, Inc. M $35.81 78.7% $11,194 $18,225 $26,132 $10,213 $3,007 39.1% 11.5% 0.7x 6.1x
Kohl's Corp. KSS $49.38 82.8% $9,000 $13,123 $18,868 $6,781 $2,375 35.9% 12.6% 0.7x 5.5x
Nordstrom, Inc. JWN $47.93 76.3% $8,479 $10,436 $14,634 $5,182 $1,592 35.4% 10.9% 0.7x 6.6x
J. C. Penney Co., Inc. JCP $8.31 69.3% $2,554 $6,743 $12,582 $4,527 $736 36.0% 5.8% 0.5x 9.2x
Sears Holdings Corp. SHLD $9.29 45.4% $993 $5,169 $23,389 $5,265 ($1,164) 22.5% (5.0%) 0.2x NM
Dillard's, Inc. DDS $62.69 70.8% $2,203 $2,940 $6,551 $2,284 $604 34.9% 9.2% 0.4x 4.9x
Bon-Ton Stores, Inc. BONT $1.47 49.0% $29 $1,120 $2,725 $1,001 $114 36.7% 4.2% 0.4x 9.8x
Stage Stores, Inc. SSI $4.37 46.4% $120 $333 $1,491 $351 $47 23.5% 3.1% 0.2x 7.1x
Average 64.8% $4,322 $7,261 $13,297 $4,450 $914 33.0% 6.6% 0.5x 7.0x
Median 70.0% $2,379 $5,956 $13,608 $4,855 $670 35.7% 7.5% 0.5x 6.6x
LTM LTM Margins LTM
Enterprise Value /
Industry Sector Overview – Public Company Analysis
Department Store Retail
($ in millions, except per share)
15
Discount Stores & Mass Merchants
($ in millions, except per share)
Source: S&P Capital IQ. * Excluded from the average and median calculation.

HYDE PARK CAPITAL Investment Banking | Mergers & Acquisitions | Capital Raising
Industry Sector Overview – Public Company Analysis
Apparel, Accessories & Footwear Retail
($ in millions, except per share)
16
Large & Mid Cap
Source: S&P Capital IQ. * Excluded from the average and median calculation.
Closing Price % of 52 Equity Enterprise
Company Ticker 12/30/16 Week High Value Value Revenue Gross Profit EBITDA Gross Profit EBITDA Revenue EBITDAThe TJX Companies, Inc. TJX $75.13 89.8% $50,237 $49,638 $32,678 $9,511 $4,478 29.1% 13.7% 1.5x 11.1xRoss Stores, Inc. ROST $65.60 94.0% $26,078 $25,595 $12,607 $4,060 $2,036 32.2% 16.1% 2.0x 12.6xL Brands, Inc. LB $65.84 67.6% $19,258 $24,330 $12,480 $5,803 $2,628 46.5% 21.1% 1.9x 9.3x
Gap, Inc. GPS $22.44 73.0% $8,982 $9,204 $15,472 $5,621 $1,983 36.3% 12.8% 0.6x 4.6xFoot Locker, Inc. FL $70.89 89.2% $9,678 $8,941 $7,660 $3,375 $1,137 44.1% 14.8% 1.2x 7.9xLululemon Athletica, Inc. LULU $64.99 79.4% $8,936 $8,456 $2,259 $1,126 $467 49.9% 20.7% 3.7x 18.0x*Urban Outfitters, Inc. URBN $28.48 69.8% $3,353 $3,093 $3,529 $1,261 $498 35.7% 14.1% 0.9x 6.2xTailored Brand, Inc. TLRD $25.55 88.8% $1,240 $2,801 $3,411 $1,467 $350 43.0% 10.2% 0.8x 8.0x
Ascena Retail Group, Inc. ASNA $6.19 55.0% $1,206 $2,536 $7,002 $4,063 $636 58.0% 9.1% 0.4x 4.0xAmerican Eagle Outfitters, Inc. AEO $15.17 77.6% $2,825 $2,533 $3,618 $1,366 $519 37.8% 14.3% 0.7x 4.9xChico's FAS, Inc. CHS $14.39 85.4% $1,892 $1,846 $2,489 $1,353 $263 54.4% 10.6% 0.7x 7.0xThe Children’s Place Retail Stores, Inc. PLCE $100.95 90.8% $1,958 $1,756 $1,763 $661 $183 37.5% 10.4% 1.0x 9.6xGenesco, Inc. GCO $62.10 83.7% $1,287 $1,485 $2,917 $1,423 $226 48.8% 7.8% 0.5x 6.6x
Average 80.3% $10,533 $10,940 $6,566 $2,568 $945 42.6% 13.5% 1.2x 7.6x
Median 83.7% $3,353 $3,093 $3,488 $1,537 $423 43.0% 13.7% 0.9x 7.4x
Enterprise Value /
LTM LTM Margins LTM

HYDE PARK CAPITAL Investment Banking | Mergers & Acquisitions | Capital Raising
Industry Sector Overview – Public Company Analysis
Apparel, Accessories & Footwear Retail
($ in millions, except per share)
17
Small & Micro Cap
Source: S&P Capital IQ. * Excluded from the average and median calculation.
Closing Price % of 52 Equity Enterprise
Company Ticker 12/30/16 Week High Value Value Revenue Gross Profit EBITDA Gross Profit EBITDA Revenue EBITDABuckle, Inc. BKE $22.80 65.1% $1,100 $887 $1,027 $499 $213 48.6% 20.8% 0.9x 4.2x
Express, Inc. EXPR $10.76 49.9% $863 $830 $2,279 $959 $239 42.1% 10.5% 0.4x 3.5xFinish Line, Inc. FINL $18.81 76.7% $784 $767 $1,937 $745 $134 38.5% 6.9% 0.4x 5.7xGuess?, Inc. GES $12.10 53.0% $1,013 $703 $2,188 $749 $147 34.2% 6.7% 0.3x 4.8xAbercrombie & Fitch Co. ANF $12.00 36.6% $819 $694 $3,403 $2,090 $260 61.4% 7.7% 0.2x 2.7xCato Corp. CATO $30.08 74.3% $815 $572 $987 $381 $105 38.6% 10.6% 0.6x 5.5xZumiez, Inc. ZUMZ $21.85 82.3% $552 $515 $815 $266 $67 32.7% 8.2% 0.6x 7.7xShoe Carnival, Inc. SCVL $26.98 84.9% $497 $464 $1,001 $293 $71 29.3% 7.1% 0.5x 6.6xStein Mart, Inc. SMRT $5.48 59.4% $255 $420 $1,369 $377 $58 27.5% 4.2% 0.3x 7.3xStage Stores, Inc. SSI $4.37 46.4% $120 $338 $1,491 $351 $47 23.5% 3.1% 0.2x 7.2xCasual Male Retail Group, Inc. DXLG $4.25 72.3% $210 $287 $452 $207 $28 45.8% 6.2% 0.6x 10.2x*
Citi Trends CTRN $18.84 82.9% $276 $205 $686 $264 $35 38.5% 5.1% 0.3x 5.9xDestination Maternity Corp. DEST $5.17 50.5% $71 $115 $452 $235 $23 52.0% 5.2% 0.3x 4.9xNew York & Company, Inc. NWY $2.27 54.7% $144 $102 $934 $359 $28 38.5% 3.0% 0.1x 3.6x
Average 63.5% $537 $493 $1,359 $555 $104 39.4% 5.7% 0.4x 5.3x
Median 62.2% $525 $489 $1,014 $368 $69 38.5% 6.8% 0.3x 5.5x
Enterprise Value /LTM LTM Margins LTM

HYDE PARK CAPITAL Investment Banking | Mergers & Acquisitions | Capital Raising
Industry Sector Overview – Public Company Analysis
Apparel, Accessories & Footwear
($ in millions, except per share)
18
Large & Mid Cap
Source: S&P Capital IQ. * Excluded from the average and median calculation.
Closing Price % of 52 Equity Enterprise
Company Ticker 12/30/16 Week High Value Value Revenue Gross Profit EBITDA Gross Profit EBITDA Revenue EBITDANike, Inc. NKE $50.83 77.7% $87,247 $84,841 $33,517 $15,214 $5,178 45.4% 15.4% 2.5x 16.4xV.F. Corp. VFC $53.35 79.5% $22,707 $24,567 $12,369 $5,982 $2,013 48.4% 16.3% 2.0x 12.2xHanesbrands, Inc. HBI $21.57 68.8% $8,369 $12,037 $5,862 $2,248 $987 38.3% 16.8% 2.1x 12.2xUnder Armour, Inc. UA $25.17 54.5% $11,167 $11,991 $4,691 $2,219 $572 47.3% 12.2% 2.6x 21.1x*PVH Corp. PVH $90.24 78.2% $7,357 $10,020 $8,208 $4,291 $1,066 52.3% 13.0% 1.2x 9.4xCoach, Inc. COH $35.02 80.1% $9,813 $8,568 $4,499 $3,070 $887 68.2% 19.7% 1.9x 9.7xMichael Kors Holdings, Inc. KORS $42.98 72.2% $7,630 $7,648 $4,672 $2,765 $1,273 59.2% 27.3% 1.6x 6.0xPolo Ralph Lauren Corp. RL $90.32 78.0% $7,618 $7,235 $7,190 $4,109 $1,018 57.1% 14.2% 1.0x 7.1xGildan Activewear, Inc. TSX:GIL $25.38 82.2% $6,092 $6,701 $2,541 $708 $512 27.9% 20.2% 2.6x 13.1xCarter's, Inc. CRI $86.39 76.7% $4,410 $4,850 $3,132 $1,332 $477 42.5% 15.2% 1.5x 10.2xColumbia Sportswear Co. COLM $58.30 91.7% $4,116 $3,600 $2,359 $1,090 $305 46.2% 12.9% 1.5x 11.8xSkechers USA, Inc. SKX $24.58 71.7% $3,807 $3,245 $3,535 $1,621 $464 45.9% 13.1% 0.9x 7.0xWolverine World Wide, Inc. WWW $21.95 85.9% $2,114 $2,644 $2,516 $972 $252 38.6% 10.0% 1.1x 10.5xKate Spade & Co. KATE $18.67 70.6% $2,414 $2,330 $1,340 $806 $211 60.2% 15.8% 1.7x 11.0xDSW, Inc. DSW $44.21 79.1% $2,428 $2,288 $1,979 $643 $275 32.5% 13.9% 1.2x 8.3xSteven Madden, Ltd. SHOO $35.75 88.2% $2,139 $2,046 $1,407 $516 $194 36.7% 13.8% 1.5x 10.5xDeckers Outdoor Corp. DECK $55.39 79.2% $1,809 $1,823 $1,835 $841 $238 45.8% 13.0% 1.0x 7.7xFossil, Inc. FOSL $25.86 49.8% $1,248 $1,677 $3,076 $1,615 $286 52.5% 9.3% 0.5x 5.9xG-III Apparel Group, Ltd. GIII $29.56 52.9% $1,387 $1,434 $2,311 $822 $161 35.6% 7.0% 0.6x 8.9xCaleres, Inc. CAL $32.82 89.6% $1,391 $1,415 $2,549 $1,049 $176 41.2% 6.9% 0.6x 8.0xOxford Industries, Inc. OXM $60.13 77.1% $1,000 $1,137 $1,021 $578 $142 56.6% 13.9% 1.1x 8.0x
Average 75.4% $9,346 $9,624 $5,267 $2,500 $795 46.6% 14.3% 1.5x 9.7x
Median 78.0% $4,116 $3,600 $3,076 $1,332 $464 45.9% 13.9% 1.5x 9.5x
Enterprise Value /
LTM LTM Margins LTM

HYDE PARK CAPITAL Investment Banking | Mergers & Acquisitions | Capital Raising
Closing Price % of 52 Equity Enterprise
Company Ticker 12/30/16 Week High Value Value Revenue Gross Profit EBITDA Gross Profit EBITDA Revenue EBITDA
CROCS, Inc. CROX $6.86 54.7% $503 $535 $1,058 $494 $23 46.7% 2.2% 0.5x 23.6x*
Perry Ellis International, Inc. PERY $24.91 85.9% $372 $438 $871 $320 $32 36.7% 3.6% 0.5x 13.8x
Vera Bradley, Inc. VRA $11.72 56.6% $438 $356 $505 $291 $77 57.5% 15.3% 0.7x 4.6x
Weyco Group, Inc. WEYS $31.30 99.1% $333 $345 $302 $115 $28 37.9% 9.2% 1.1x 12.4x
Rocky Brands, Inc. RCKY $11.55 82.8% $87 $114 $259 $77 $9 29.8% 3.4% 0.4x 13.0x
Summer Infant, Inc. SUMR $2.00 82.0% $37 $84 $200 $63 $9 31.6% 4.7% 0.4x 9.0x
Average 76.9% $295 $312 $532 $227 $92 40.0% 6.4% 0.6x 10.6x
Median 82.4% $353 $350 $404 $203 $26 37.3% 4.2% 0.5x 12.4x
Enterprise Value /
LTM LTM Margins LTM
Industry Sector Overview – Public Company Analysis
Apparel, Accessories & Footwear
($ in millions, except per share)
19
Small & Micro Cap
Source: S&P Capital IQ. * Excluded from the average and median calculation.

HYDE PARK CAPITAL Investment Banking | Mergers & Acquisitions | Capital Raising
Closing Price % of 52 Equity Enterprise
Company Ticker 12/30/16 Week High Value Value Revenue Gross Profit EBITDA Gross Profit EBITDA Revenue EBITDA
The Sherwin-Williams Co. SHW $268.74 86.0% $28,918 $29,441 $11,856 $5,922 $1,948 50.0% 16.4% 2.6x* 15.1x*
Bed Bath & Beyond, Inc. BBBY $40.64 77.1% $10,348 $9,875 $12,100 $4,553 $1,499 37.6% 12.4% 0.8x 6.6x
Williams-Sonoma, Inc. WSM $48.39 78.1% $5,270 $5,203 $5,089 $1,869 $666 36.7% 13.1% 1.0x 7.8x
Aaron's, Inc. AAN $31.99 93.5% $2,611 $2,332 $3,234 $1,617 $463 50.0% 14.3% 0.7x 5.0x
La-Z-Boy, Inc. LZB $31.05 94.4% $1,623 $1,547 $1,518 $594 $152 39.1% 10.0% 1.0x 10.2x
Rent-A-Center, Inc. RCII $11.25 68.7% $725 $1,256 $3,073 $2,019 $253 65.7% 8.2% 0.4x 5.0x
Select Comfort Corp. SCSS $22.62 79.8% $1,255 $1,204 $1,213 $733 $72 60.5% 5.9% 1.0x 16.7x*
Ethan Allen Interiors, Inc. ETH $36.85 95.0% $1,067 $1,175 $784 $438 $97 55.9% 12.4% 1.5x 12.1x*
Pier 1 Imports, Inc. PIR $8.54 88.3% $1,008 $932 $1,842 $981 $111 53.2% 6.0% 0.5x 8.4x
Haverty Furniture Companies, Inc. HVT $23.70 96.5% $520 $453 $817 $438 $71 53.6% 8.7% 0.6x 6.4x
Bassett Furinture Industries, Inc. BSET $30.40 90.3% $351 $302 $432 $265 $40 61.2% 9.4% 0.7x 7.5x
Lifetime Brands, Inc. LCUT $17.75 91.7% $224 $299 $585 $211 $39 36.0% 6.7% 0.5x 7.7x
Kirkland's, Inc. KIRK $15.51 85.3% $319 $291 $590 $274 $46 46.5% 7.7% 0.5x 6.4x
Average 86.5% $4,172 $4,178 $3,318 $1,532 $420 49.7% 10.1% 0.8x 7.1x
Median 88.3% $1,067 $1,204 $1,518 $733 $111 50.0% 9.4% 0.7x 7.0x
LTM LTM Margins LTM
Enterprise Value /
Closing Price % of 52 Equity Enterprise
Company Ticker 12/30/16 Week High Value Value Revenue Gross Profit EBITDA Gross Profit EBITDA Revenue EBITDA
Leggett & Platt, Inc. LEG $48.88 89.5% $6,875 $7,649 $3,791 $929 $600 24.5% 15.8% 2.0x 12.8x
Tempur Pedic International, Inc. TPX $68.28 82.9% $4,187 $5,745 $3,125 $1,305 $487 41.8% 15.6% 1.8x 11.8x
HNI Corp. HNI $55.92 98.2% $2,540 $2,746 $2,219 $847 $245 38.2% 11.1% 1.2x 11.2x
Herman Miller, Inc. MLHR $34.20 93.8% $2,071 $2,243 $2,295 $881 $262 38.4% 11.4% 1.0x 8.6x
Steelcase, Inc. SCS $17.90 98.7% $2,142 $2,241 $3,011 $996 $249 33.1% 8.3% 0.7x 9.0x
Knoll, Inc. KNL $27.93 98.3% $1,360 $1,550 $1,177 $449 $160 38.1% 13.6% 1.3x 9.7x
Libbey, Inc. LBY $19.46 91.6% $428 $800 $810 $185 $116 22.9% 14.4% 1.0x 6.9x
Average 93.3% $2,800 $3,282 $2,347 $799 $303 33.8% 12.9% 1.3x 10.0x
Median 93.8% $2,142 $2,243 $2,295 $881 $249 38.1% 13.6% 1.2x 9.7x
Enterprise Value /
LTM LTM Margins LTM
Industry Sector Overview – Public Company Analysis
Furniture & Furnishings Manufacturers
Furniture & Furnishings Retail
($ in millions, except per share)
20
($ in millions, except per share)
Source: S&P Capital IQ. * Excluded from the average and median calculation.

HYDE PARK CAPITAL Investment Banking | Mergers & Acquisitions | Capital Raising
Closing Price % of 52 Equity Enterprise
Company Ticker 12/30/16 Week High Value Value Revenue Gross Profit EBITDA Gross Profit EBITDA Revenue EBITDA
Procter & Gamble Co. PG $84.08 93.1% $238,220 $257,599 $65,290 $33,206 $17,517 50.9% 26.8% 3.9x 14.7x
Kimberly-Clark Corp. KMB $114.12 82.2% $41,417 $48,425 $18,197 $6,622 $4,010 36.4% 22.0% 2.7x 12.1x
Estee Lauder Companies, Inc. EL $76.49 78.5% $28,697 $29,525 $11,292 $9,095 $2,169 80.5% 19.2% 2.6x 13.6x
Ulta Salon, Cosmetics & Fragrance, Inc. ULTA $254.94 91.5% $16,109 $15,866 $4,542 $1,641 $797 36.1% 17.5% 3.5x 19.9x
Sally Beauty Holdings, Inc. SBH $26.42 80.2% $3,931 $5,621 $3,953 $1,964 $599 49.7% 15.2% 1.4x 9.4x
Herbalife, Ltd. HLF $48.14 66.7% $4,142 $4,797 $4,542 $2,405 $541 53.0% 11.9% 1.1x 8.9x
Revlon, Inc. REV $29.15 76.7% $1,534 $4,198 $2,055 $1,296 $334 63.0% 16.3% 2.0x 12.6x
Avon Products, Inc. AVP $5.04 72.4% $2,199 $4,088 $5,757 $3,459 $469 60.1% 8.1% 0.7x 8.7x
Nu Skin Enterprises, Inc. NUS $47.78 72.4% $2,715 $2,612 $2,249 $1,767 $336 78.6% 14.9% 1.2x 7.8x
USANA Health Sciences, Inc. USNA $61.20 81.6% $1,550 $1,375 $986 $812 $155 82.3% 15.7% 1.4x 8.9x
Inter Parfums, Inc. IPAR $32.75 90.0% $1,020 $1,010 $505 $280 $75 55.6% 14.9% 2.0x 13.5x
Medifast, Inc. MED $41.63 96.5% $496 $414 $273 $204 $39 74.5% 14.2% 1.5x 10.6x
Nature's Sunshine Products, Inc. NATR $15.00 91.2% $285 $254 $337 $249 $22 73.8% 6.5% 0.8x 11.6x
Average 82.5% $26,332 $28,907 $9,229 $4,846 $2,082 61.1% 15.6% 1.9x 11.7x
Median 81.6% $2,715 $4,198 $3,953 $1,767 $469 60.1% 15.2% 1.5x 11.6x
Enterprise Value /
LTM LTM Margins LTM
Household Products
Personal Care Products
($ in millions, except per share)
21
($ in millions, except per share)
Industry Sector Overview – Public Company Analysis
Source: S&P Capital IQ.
Closing Price % of 52 Equity Enterprise
Company Ticker 12/30/16 Week High Value Value Revenue Gross Profit EBITDA Gross Profit EBITDA Revenue EBITDANewell Rubbermaid, Inc. NWL $44.65 80.5% $16,419 $28,647 $10,689 $3,951 $1,781 37.0% 16.7% 2.7x 16.1x
Stanley Black & Decker, Inc. SWK $114.69 90.5% $17,025 $19,934 $11,332 $4,205 $1,881 37.1% 16.6% 1.8x 10.6xWhirlpool Corp. WHR $181.77 93.6% $14,127 $19,386 $20,622 $3,671 $2,176 17.8% 10.6% 0.9x 8.9x
Clorox Corp. CLX $120.02 85.4% $15,838 $17,831 $5,814 $2,613 $1,198 44.9% 20.6% 3.1x 14.9xSnap-on, Inc. SNA $171.27 96.3% $10,173 $11,143 $3,712 $1,909 $927 51.4% 25.0% 3.0x 12.0x
Toro Co. TTC $55.95 96.0% $6,266 $6,346 $2,392 $875 $398 36.6% 16.7% 2.7x 15.9xPrestige Brands Holdings, Inc. PBH $52.10 89.7% $2,776 $4,192 $833 $482 $296 57.9% 35.6% 5.0x 14.1x
Tupperware Brands Corp. TUP $52.62 78.7% $2,668 $3,381 $2,204 $1,495 $372 67.8% 16.9% 1.5x 9.1xCentral Garden & Pet Co. CENT $33.09 95.9% $1,717 $2,106 $1,889 $574 $187 30.4% 9.9% 1.1x 11.3x
Average 89.6% $9,668 $12,552 $6,610 $2,197 $1,024 42.3% 18.7% 2.4x 12.5x
Median 90.5% $10,173 $11,143 $3,712 $1,909 $927 37.1% 16.7% 2.7x 12.0x
Enterprise Value /
LTM LTM Margins LTM

HYDE PARK CAPITAL Investment Banking | Mergers & Acquisitions | Capital Raising
Recreational & Leisure Products
($ in millions, except per share)
22
Industry Sector Overview – Public Company Analysis
Source: S&P Capital IQ.
Closing Price % of 52 Equity Enterprise
Company Ticker 12/30/16 Week High Value Value Revenue Gross Profit EBITDA Gross Profit EBITDA Revenue EBITDA
Harley-Davidson, Inc. HOG $58.34 93.6% $10,715 $17,197 $6,066 $2,157 $1,262 35.6% 20.8% 2.8x 13.6xMattel, Inc. MAT $27.55 79.3% $9,438 $11,002 $5,622 $2,696 $873 48.0% 15.5% 2.0x 12.6xHasbro, Inc. HAS $77.79 87.9% $9,877 $10,779 $5,020 $2,669 $975 53.2% 19.4% 2.1x 11.1x
Polaris Industries, Inc. PII $82.39 79.0% $5,415 $5,724 $4,482 $1,180 $572 26.3% 12.8% 1.3x 10.0xBrunswick Corp. BC $54.54 96.9% $5,057 $5,053 $4,392 $1,195 $557 27.2% 12.7% 1.2x 9.1xPool Corp. POOL $104.34 96.6% $4,523 $4,892 $2,541 $732 $272 28.8% 10.7% 1.9x 18.0x
American Outdoor Brands Corp. AOBC $21.08 67.6% $1,196 $1,317 $872 $367 $259 42.1% 29.7% 1.5x 5.1xSturm, Ruger & Co., Inc. RGR $52.70 67.5% $1,014 $912 $655 $214 $161 32.7% 24.5% 1.4x 5.7x
Callaway Golf Co. ELY $10.96 87.3% $1,026 $911 $861 $373 $48 43.3% 5.6% 1.1x 18.9xJohnson Outdoors, Inc. JOUT $39.69 87.5% $391 $317 $442 $180 $41 40.6% 9.2% 0.7x 7.8xJAKKS Pacific, Inc. JAKK $5.15 52.8% $91 $254 $703 $220 $36 31.4% 5.1% 0.4x 7.0x
Average 81.4% $4,431 $5,305 $2,862 $1,081 $456 37.2% 13.1% 1.5x 10.8x
Median 87.3% $4,523 $4,892 $2,541 $732 $272 35.6% 12.8% 1.4x 10.0x
Enterprise Value /
LTM LTM Margins LTM
HYDE PARK CAPITAL Investment Banking | Mergers & Acquisitions | Capital Raising
Closing Price % of 52 Equity Enterprise
Company Ticker 12/30/16 Week High Value Value Revenue Gross Profit EBITDA Gross Profit EBITDA Revenue EBITDA
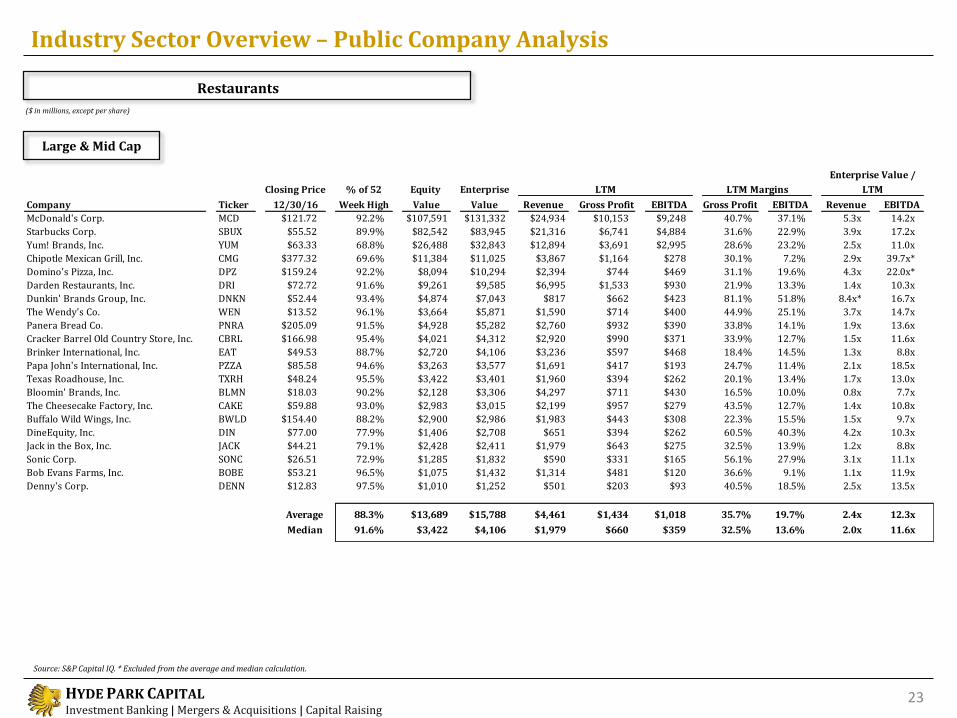
McDonald's Corp. MCD $121.72 92.2% $107,591 $131,332 $24,934 $10,153 $9,248 40.7% 37.1% 5.3x 14.2x
Starbucks Corp. SBUX $55.52 89.9% $82,542 $83,945 $21,316 $6,741 $4,884 31.6% 22.9% 3.9x 17.2x
Yum! Brands, Inc. YUM $63.33 68.8% $26,488 $32,843 $12,894 $3,691 $2,995 28.6% 23.2% 2.5x 11.0x
Chipotle Mexican Grill, Inc. CMG $377.32 69.6% $11,384 $11,025 $3,867 $1,164 $278 30.1% 7.2% 2.9x 39.7x*
Domino's Pizza, Inc. DPZ $159.24 92.2% $8,094 $10,294 $2,394 $744 $469 31.1% 19.6% 4.3x 22.0x*
Darden Restaurants, Inc. DRI $72.72 91.6% $9,261 $9,585 $6,995 $1,533 $930 21.9% 13.3% 1.4x 10.3x
Dunkin' Brands Group, Inc. DNKN $52.44 93.4% $4,874 $7,043 $817 $662 $423 81.1% 51.8% 8.4x* 16.7x
The Wendy's Co. WEN $13.52 96.1% $3,664 $5,871 $1,590 $714 $400 44.9% 25.1% 3.7x 14.7x
Panera Bread Co. PNRA $205.09 91.5% $4,928 $5,282 $2,760 $932 $390 33.8% 14.1% 1.9x 13.6x
Cracker Barrel Old Country Store, Inc. CBRL $166.98 95.4% $4,021 $4,312 $2,920 $990 $371 33.9% 12.7% 1.5x 11.6x
Brinker International, Inc. EAT $49.53 88.7% $2,720 $4,106 $3,236 $597 $468 18.4% 14.5% 1.3x 8.8x
Papa John's International, Inc. PZZA $85.58 94.6% $3,263 $3,577 $1,691 $417 $193 24.7% 11.4% 2.1x 18.5x
Texas Roadhouse, Inc. TXRH $48.24 95.5% $3,422 $3,401 $1,960 $394 $262 20.1% 13.4% 1.7x 13.0x
Bloomin' Brands, Inc. BLMN $18.03 90.2% $2,128 $3,306 $4,297 $711 $430 16.5% 10.0% 0.8x 7.7x
The Cheesecake Factory, Inc. CAKE $59.88 93.0% $2,983 $3,015 $2,199 $957 $279 43.5% 12.7% 1.4x 10.8x
Buffalo Wild Wings, Inc. BWLD $154.40 88.2% $2,900 $2,986 $1,983 $443 $308 22.3% 15.5% 1.5x 9.7x
DineEquity, Inc. DIN $77.00 77.9% $1,406 $2,708 $651 $394 $262 60.5% 40.3% 4.2x 10.3x
Jack in the Box, Inc. JACK $44.21 79.1% $2,428 $2,411 $1,979 $643 $275 32.5% 13.9% 1.2x 8.8x
Sonic Corp. SONC $26.51 72.9% $1,285 $1,832 $590 $331 $165 56.1% 27.9% 3.1x 11.1x
Bob Evans Farms, Inc. BOBE $53.21 96.5% $1,075 $1,432 $1,314 $481 $120 36.6% 9.1% 1.1x 11.9x
Denny's Corp. DENN $12.83 97.5% $1,010 $1,252 $501 $203 $93 40.5% 18.5% 2.5x 13.5x
Average 88.3% $13,689 $15,788 $4,461 $1,434 $1,018 35.7% 19.7% 2.4x 12.3x
Median 91.6% $3,422 $4,106 $1,979 $660 $359 32.5% 13.6% 2.0x 11.6x
Enterprise Value /
LTM LTM Margins LTM
23
Restaurants
($ in millions, except per share)
Industry Sector Overview – Public Company Analysis
Large & Mid Cap
Source: S&P Capital IQ. * Excluded from the average and median calculation.

HYDE PARK CAPITAL Investment Banking | Mergers & Acquisitions | Capital Raising
Restaurants
($ in millions, except per share)
24
Industry Sector Overview – Public Company Analysis
Small & Micro Cap
Source: S&P Capital IQ. * Excluded from the average and median calculation.
Closing Price % of 52 Equity Enterprise
Company Ticker 12/30/16 Week High Value Value Revenue Gross Profit EBITDA Gross Profit EBITDA Revenue EBITDA
Red Robin Gourmet Burgers, Inc. RRGB $56.40 81.8% $773 $1,073 $1,291 $285 $144 22.1% 11.2% 0.8x 7.4xBJ's Restaurants, Inc. BJRI $39.30 82.6% $976 $1,059 $961 $188 $128 19.6% 13.3% 1.1x 8.3x
Bojangles', Inc. BOJA $18.65 92.6% $700 $884 $521 $119 $80 22.7% 15.4% 1.7x 11.0xBiglari Holdings, Inc. BH $473.20 96.2% $584 $778 $859 $186 $57 21.7% 6.6% 0.9x 13.6x
Shake Shack, Inc. SHAK $35.79 81.4% $761 $736 $246 $100 $28 40.5% 11.2% 3.0x* 26.7x*Ruth's Hospitality Group, Inc. RUTH $18.30 93.1% $601 $635 $383 $103 $59 27.0% 15.3% 1.7x 10.8x
Chuy's Holdings, Inc. CHUY $32.45 85.9% $546 $533 $323 $66 $41 20.5% 12.6% 1.7x 13.1xDel Frisco's Restaurant Group, Inc. DFRG $17.00 91.9% $398 $397 $347 $81 $46 23.3% 13.2% 1.1x 8.7x
Ruby Tuesday, Inc. RT $3.23 57.4% $194 $379 $1,022 $163 $48 15.9% 4.7% 0.4x 8.0x
Average 84.8% $615 $719 $661 $143 $120 23.7% 8.8% 1.2x 10.1x
Median 85.9% $601 $736 $521 $119 $59 22.1% 9.4% 1.1x 9.8x
Enterprise Value /
LTM LTM Margins LTM

HYDE PARK CAPITAL Investment Banking | Mergers & Acquisitions | Capital Raising
Closing Price % of 52 Equity Enterprise
Company Ticker 12/30/16 Week High Value Value Revenue Gross Profit EBITDA Gross Profit EBITDA Revenue EBITDA
Danone BN $63.55 85.4% $39,111 $48,613 $24,512 $12,475 $4,250 50.9% 17.3% 2.0x 11.4x
General Mills, Inc. GIS $61.77 84.7% $37,547 $47,355 $15,950 $5,785 $3,383 36.3% 21.2% 3.0x 14.0x
Kellogg Co. K $73.71 84.6% $26,130 $33,689 $13,059 $4,859 $2,034 37.2% 15.6% 2.6x 16.6x
Tyson Foods, Inc. TSN $61.68 80.1% $24,055 $29,997 $36,881 $4,697 $3,567 12.7% 9.7% 0.8x 8.4x
Campbell Soup Co. CPB $60.47 89.1% $18,776 $22,117 $7,960 $2,866 $1,579 36.0% 19.8% 2.8x 14.0x
The J. M. Smucker Co. SJM $128.06 81.4% $15,032 $20,261 $7,511 $2,928 $1,686 39.0% 22.4% 2.7x 12.0x
ConAgra Foods, Inc. CAG $39.55 80.9% $17,449 $19,539 $11,215 $3,110 $1,826 27.7% 16.3% 1.7x 10.7x
Hormel Foods Corp. HRL $34.81 76.1% $18,883 $18,722 $9,523 $2,158 $1,418 22.7% 14.9% 2.0x 13.2x
Mead Johnson Nutrition Co. MJN $70.76 75.0% $13,245 $14,500 $3,808 $2,445 $1,005 64.2% 26.4% 3.8x 14.4x
McCormick & Company, Inc. MKC $93.33 86.5% $11,946 $13,288 $4,412 $1,832 $754 41.5% 17.1% 3.0x 17.6x
The Hain Celestial Group, Inc. HAIN $39.03 68.5% $4,064 $4,856 $2,888 $671 $370 23.2% 12.8% 1.7x 13.1x
Lancaster Colony Corp. LANC $141.39 98.4% $3,873 $3,755 $1,188 $312 $218 26.3% 18.3% 3.2x 17.3x
Dean Foods Co. DF $21.78 98.4% $1,995 $2,863 $7,715 $1,995 $450 25.9% 5.8% 0.4x 6.4x
J&J Snack Foods Corp. JJSF $133.43 98.8% $2,503 $2,337 $996 $307 $154 30.8% 15.4% 2.3x 15.2x
Seneca Foods Corp. SENE.A $40.05 93.9% $397 $770 $1,346 $148 $118 11.0% 8.8% 0.6x 6.5x
Average 85.4% $15,667 $18,844 $9,931 $3,106 $1,521 32.4% 16.1% 2.2x 12.7x
Median 84.7% $15,032 $18,722 $7,715 $2,445 $1,418 30.8% 16.3% 2.3x 13.2x
Enterprise Value /
LTM LTM Margins LTM
Packaged Foods
($ in millions, except per share)
25
Industry Sector Overview – Public Company Analysis
Source: S&P Capital IQ.

HYDE PARK CAPITAL Investment Banking | Mergers & Acquisitions | Capital Raising
Closing Price % of 52 Equity Enterprise
Company Ticker 12/30/16 Week High Value Value Revenue Gross Profit EBITDA Gross Profit EBITDA Revenue EBITDA
Costco Wholesale Corp. COST $160.11 94.4% $70,616 $71,232 $119,598 $16,030 $5,035 13.4% 4.2% 0.6x 14.1x
The Kroger Co. KR $34.51 81.4% $33,354 $46,896 $113,891 $26,358 $5,879 23.1% 5.2% 0.4x 8.0x
George Weston, Ltd. WN $84.57 94.6% $10,848 $24,274 $35,981 $10,385 $2,724 28.9% 7.6% 0.7x 8.9x
Whole Foods Market, Inc. WFM $30.76 86.5% $10,055 $10,481 $15,724 $5,411 $1,368 34.4% 8.7% 0.7x 7.7x
Casey's General Stores, Inc. CASY $118.88 87.3% $4,701 $5,442 $6,221 $1,653 $545 26.6% 8.8% 0.9x 10.0x
SUPERVALU, Inc. SVU $4.67 68.1% $1,248 $3,747 $17,086 $2,557 $742 15.0% 4.3% 0.2x 5.0x
Weis Markets, Inc. WMK $66.84 97.7% $1,798 $1,725 $2,946 $812 $171 27.6% 5.8% 0.6x 10.1x
Village Super Market, Inc. VLGE.A $30.90 84.8% $430 $394 $1,635 $444 $67 27.2% 4.1% 0.2x 5.9x
Average 86.8% $16,631 $20,524 $39,135 $7,956 $2,066 24.5% 6.1% 0.5x 8.7x
Median 86.9% $7,378 $7,962 $16,405 $3,984 $1,055 26.9% 5.5% 0.6x 8.4x
Enterprise Value /
LTM LTM Margins LTM
Closing Price % of 52 Equity Enterprise
Company Ticker 12/30/16 Week High Value Value Revenue Gross Profit EBITDA Gross Profit EBITDA Revenue EBITDA
Anheuser-Busch InBev SA/NV ABI $106.14 84.1% $177,287 $227,788 $42,038 $25,612 $15,415 60.9% 36.7% 5.4x 14.8x
The Coca-Cola Co. KO $41.46 88.0% $181,512 $203,485 $42,454 $25,729 $11,692 60.6% 27.5% 4.8x 17.4x
Pepsico, Inc. PEP $104.63 94.3% $152,551 $173,493 $61,869 $34,464 $12,084 55.7% 19.5% 2.8x 14.4x
Constellation Brands, Inc. STZ $153.31 88.3% $31,492 $39,907 $7,247 $3,441 $2,395 47.5% 33.1% 5.5x 16.7x
Monster Beverage Corp. MNST $44.34 79.9% $27,011 $26,412 $2,941 $1,847 $1,144 62.8% 38.9% 9.0x 23.1x
Molson Coors Brewing Co. TAP $97.31 86.7% $20,036 $19,963 $3,435 $1,389 $606 40.4% 17.6% 5.8x 33.0x*
Dr Pepper Snapple Group, Inc. DPS $90.67 91.8% $17,057 $19,756 $6,408 $3,843 $1,647 60.0% 25.7% 3.1x 12.0x
Cott Corp. BCB $11.32 67.1% $1,370 $3,545 $3,047 $994 $351 32.6% 11.5% 1.2x 10.1x
Average 85.0% $76,040 $89,293 $21,180 $12,165 $5,667 52.6% 26.3% 4.7x 15.5x
Median 87.4% $29,252 $33,159 $6,827 $3,642 $2,021 57.8% 26.6% 5.1x 14.8x
Enterprise Value /
LTM LTM Margins LTM
Beverage
26
Industry Sector Overview – Public Company Analysis
($ in millions, except per share)
Food Retailers
($ in millions, except per share)
Source: S&P Capital IQ. * Excluded from the average and median calculation.

HYDE PARK CAPITAL Investment Banking | Mergers & Acquisitions | Capital Raising
Member FINRA/SIPC
Recent Transactions
HYDE PARK CAPITAL Investment Banking | Mergers & Acquisitions | Capital Raising Integrity | Expertise | Results
Hyde Park Capital Advisors, LLC 701 N. Franklin Street
Tampa, FL 33602 Tel: 813-383-0202
www.hydeparkcapital.com
John Hill Senior Managing Director [email protected] (813) 383-0205 John McDonald Senior Managing Director [email protected] (813) 383-0206 Keith Hodgdon Managing Director [email protected] (813) 383-0208 Greg Bosl Vice President [email protected] (813) 597-2649 Jami Gold Vice President [email protected] (813) 383-0203 Jeffrey Hendricks Vice President [email protected] (678) 523-3073 Kenneth Burnside Business Development Officer [email protected] (864) 905-9633
has been acquired by
a portfolio company of
has been acquired by has been acquired by
has been acquired by
a part of
MTS Markets International Inc.
has been acquired by has been acquired by
has been acquired by
has been acquired by
has been
recapitalized by
Minera del Norte S.A. de
C.V.
has been recapitalized by
&
has been acquired by
has received a growth
equity investment from has been acquired by
has been
recapitalized by
&
has been acquired by