Embed Size (px)
DESCRIPTION
SLIDES . BY. . . . . . . . . . . . John Loucks St . Edward’s University. Chapter 1 Data and Statistics. Statistics. Applications in Business and Economics. Data. Data Sources. Descriptive Statistics. Statistical Inference. Computers and Statistical Analysis. Data Mining. - PowerPoint PPT Presentation
Citation preview
1 Slide© 2014 Cengage Learning. All Rights Reserved. May not be scanned, copied
or duplicated, or posted to a publicly accessible website, in whole or in part.
John LoucksSt. Edward’sUniversity
...........
SLIDES . BY
2 Slide© 2014 Cengage Learning. All Rights Reserved. May not be scanned, copied
or duplicated, or posted to a publicly accessible website, in whole or in part.
Chapter 1 Data and Statistics
Data Data Sources Descriptive
Statistics Statistical Inference Computers and Statistical Analysis Data Mining
Ethical Guidelines for Statistical Practice
Applications in Business and Economics Statistics
3 Slide© 2014 Cengage Learning. All Rights Reserved. May not be scanned, copied
or duplicated, or posted to a publicly accessible website, in whole or in part.
Statistics The term statistics can refer to numerical facts
such as averages, medians, percents, and index numbers that help us understand a variety of business and economic situations.
Statistics can also refer to the art and science of collecting, analyzing, presenting, and interpreting data.
4 Slide© 2014 Cengage Learning. All Rights Reserved. May not be scanned, copied
or duplicated, or posted to a publicly accessible website, in whole or in part.
Applications in Business and Economics
Accounting
Economics
Public accounting firms use statistical samplingprocedures when conducting audits for their clients.
Economists use statistical information in makingforecasts about the future of the economy or someaspect of it.
Financial advisors use price-earnings ratios anddividend yields to guide their investment advice.
Finance
5 Slide© 2014 Cengage Learning. All Rights Reserved. May not be scanned, copied
or duplicated, or posted to a publicly accessible website, in whole or in part.
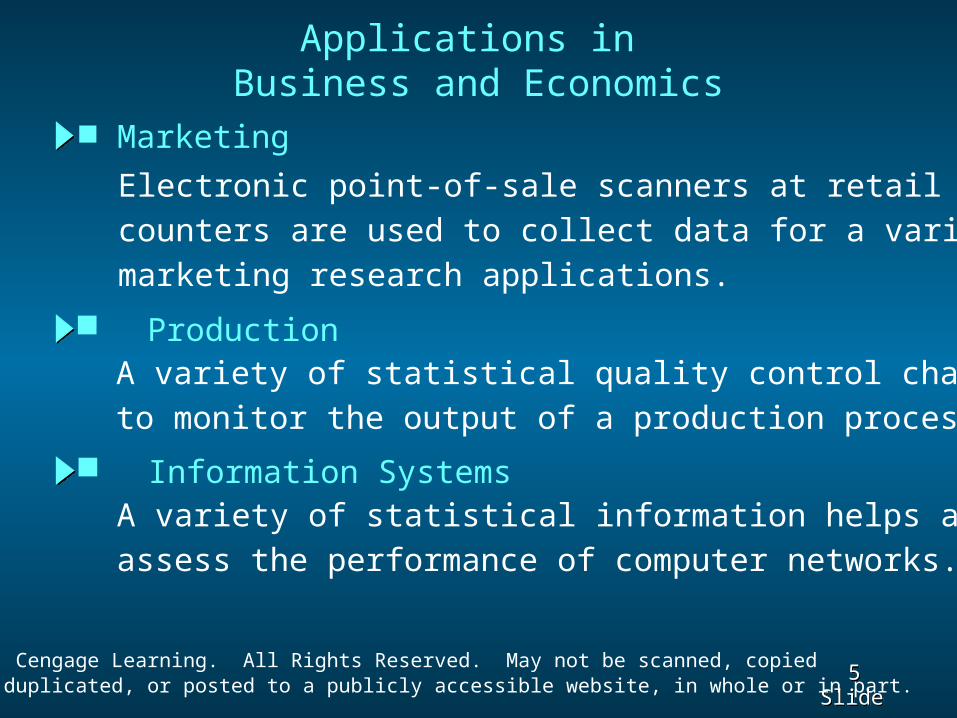
Applications in Business and Economics
A variety of statistical quality control charts are usedto monitor the output of a production process.
Production
Electronic point-of-sale scanners at retail checkoutcounters are used to collect data for a variety ofmarketing research applications.
Marketing
A variety of statistical information helps administratorsassess the performance of computer networks.
Information Systems
6 Slide© 2014 Cengage Learning. All Rights Reserved. May not be scanned, copied
or duplicated, or posted to a publicly accessible website, in whole or in part.
Data and Data Sets Data are the facts and figures collected,
analyzed, and summarized for presentation and
interpretation. All the data collected in a particular study are referred to as the data set for the study.
7 Slide© 2014 Cengage Learning. All Rights Reserved. May not be scanned, copied
or duplicated, or posted to a publicly accessible website, in whole or in part.
Elements are the entities on which data are collected. A variable is a characteristic of interest for the elements. The set of measurements obtained for a particular element is called an observation.
The total number of data values in a complete data set is the number of elements multiplied by the number of variables.
Elements, Variables, and Observations
A data set with n elements contains n observations.
8 Slide© 2014 Cengage Learning. All Rights Reserved. May not be scanned, copied
or duplicated, or posted to a publicly accessible website, in whole or in part.
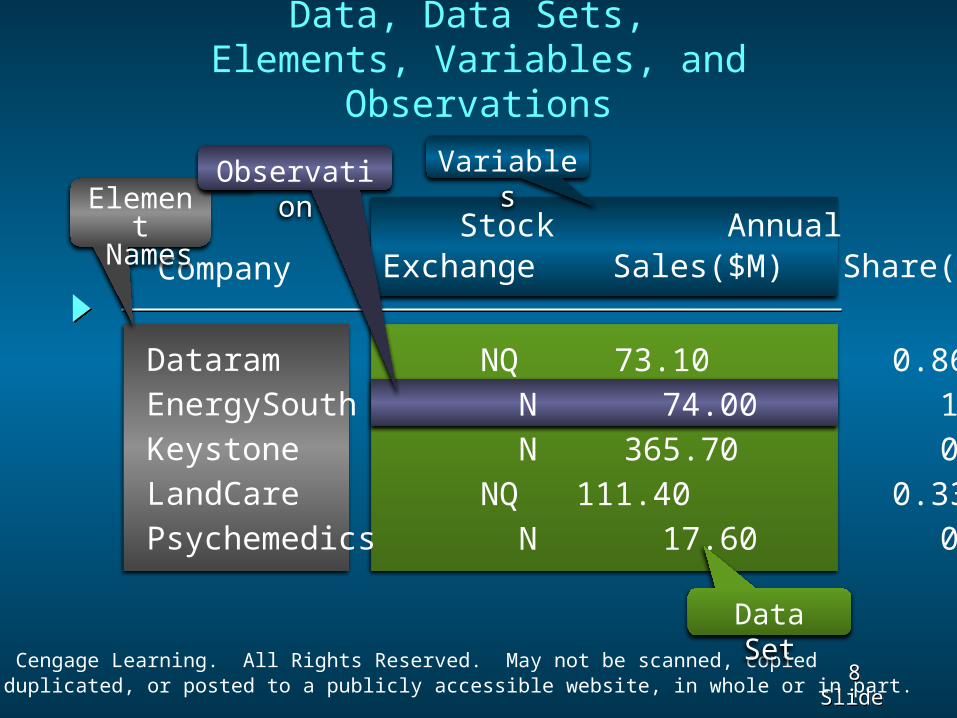
Stock Annual Earn/Exchange Sales($M) Share($)
Data, Data Sets, Elements, Variables, and Observations
Company
Dataram EnergySouth Keystone LandCare Psychemedics
NQ 73.10 0.86 N 74.00 1.67 N 365.70 0.86 NQ 111.40 0.33 N 17.60 0.13
VariablesElemen
t Names
Data Set
Observation
9 Slide© 2014 Cengage Learning. All Rights Reserved. May not be scanned, copied
or duplicated, or posted to a publicly accessible website, in whole or in part.
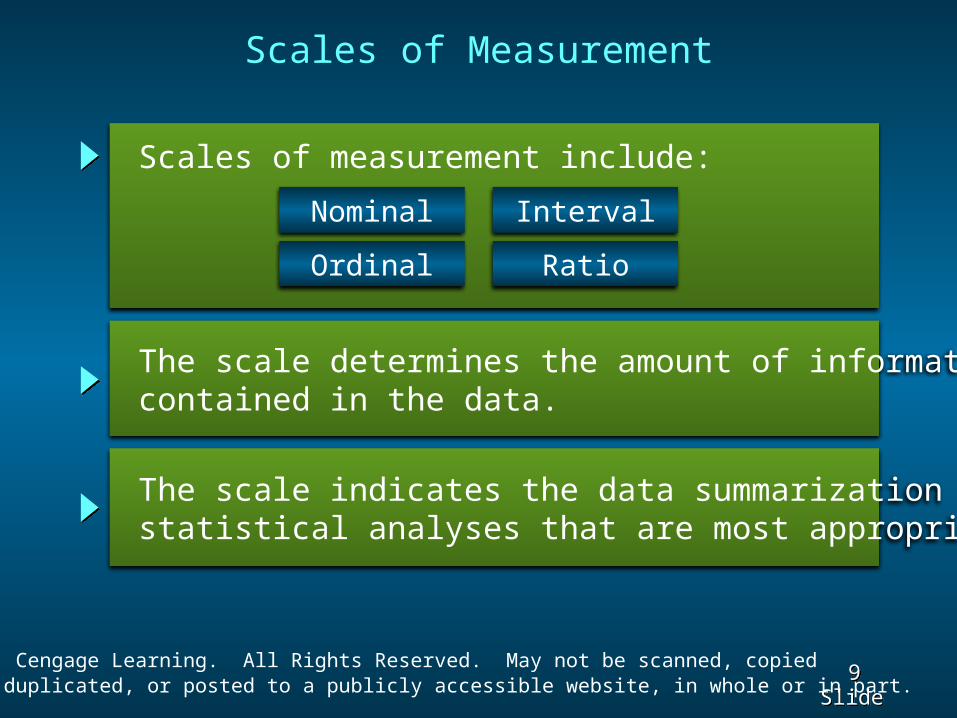
Scales of Measurement
The scale indicates the data summarization and statistical analyses that are most appropriate.
The scale determines the amount of information contained in the data.
Scales of measurement include:NominalOrdinal
IntervalRatio
10 Slide© 2014 Cengage Learning. All Rights Reserved. May not be scanned, copied
or duplicated, or posted to a publicly accessible website, in whole or in part.
Scales of Measurement Nominal
A nonnumeric label or numeric code may be used.
Data are labels or names used to identify an attribute of the element.
11 Slide© 2014 Cengage Learning. All Rights Reserved. May not be scanned, copied
or duplicated, or posted to a publicly accessible website, in whole or in part.
Example: Students of a university are classified by the school in which they are enrolled using a nonnumeric label such as Business, Humanities, Education, and so on. Alternatively, a numeric code could be used for the school variable (e.g. 1 denotes Business, 2 denotes Humanities, 3 denotes Education, and so on).
Scales of Measurement Nominal
12 Slide© 2014 Cengage Learning. All Rights Reserved. May not be scanned, copied
or duplicated, or posted to a publicly accessible website, in whole or in part.
Scales of Measurement Ordinal
A nonnumeric label or numeric code may be used.
The data have the properties of nominal data and the order or rank of the data is meaningful.
13 Slide© 2014 Cengage Learning. All Rights Reserved. May not be scanned, copied
or duplicated, or posted to a publicly accessible website, in whole or in part.
Scales of Measurement Ordinal
Example: Students of a university are classified by their class standing using a nonnumeric label such as Freshman, Sophomore, Junior, or Senior. Alternatively, a numeric code could be used for the class standing variable (e.g. 1 denotes Freshman, 2 denotes Sophomore, and so on).
14 Slide© 2014 Cengage Learning. All Rights Reserved. May not be scanned, copied
or duplicated, or posted to a publicly accessible website, in whole or in part.
Scales of Measurement Interval
Interval data are always numeric.
The data have the properties of ordinal data, and the interval between observations is expressed in terms of a fixed unit of measure.
15 Slide© 2014 Cengage Learning. All Rights Reserved. May not be scanned, copied
or duplicated, or posted to a publicly accessible website, in whole or in part.
Scales of Measurement Interval
Example: Melissa has an SAT score of 1985, while Kevin has an SAT score of 1880. Melissa scored 105 points more than Kevin.
16 Slide© 2014 Cengage Learning. All Rights Reserved. May not be scanned, copied
or duplicated, or posted to a publicly accessible website, in whole or in part.
Scales of Measurement Ratio
The data have all the properties of interval data and the ratio of two values is meaningful.
Variables such as distance, height, weight, and time use the ratio scale.
This scale must contain a zero value that indicates that nothing exists for the variable at the zero point.
17 Slide© 2014 Cengage Learning. All Rights Reserved. May not be scanned, copied
or duplicated, or posted to a publicly accessible website, in whole or in part.
Scales of Measurement Ratio
Example: Melissa’s college record shows 36 credit hours earned, while Kevin’s record shows 72 credit hours earned. Kevin has twice as many credit hours earned as Melissa.
18 Slide© 2014 Cengage Learning. All Rights Reserved. May not be scanned, copied
or duplicated, or posted to a publicly accessible website, in whole or in part.
Data can be further classified as being categorical or quantitative.
The statistical analysis that is appropriate depends on whether the data for the variable are categorical or quantitative.
In general, there are more alternatives for statistical analysis when the data are quantitative.
Categorical and Quantitative Data
19 Slide© 2014 Cengage Learning. All Rights Reserved. May not be scanned, copied
or duplicated, or posted to a publicly accessible website, in whole or in part.
Categorical Data
Labels or names used to identify an attribute of each element
Often referred to as qualitative data
Use either the nominal or ordinal scale of measurement
Can be either numeric or nonnumeric
Appropriate statistical analyses are rather limited
20 Slide© 2014 Cengage Learning. All Rights Reserved. May not be scanned, copied
or duplicated, or posted to a publicly accessible website, in whole or in part.
Quantitative Data
Quantitative data indicate how many or how much:
discrete, if measuring how many
continuous, if measuring how much
Quantitative data are always numeric.
Ordinary arithmetic operations are meaningful for quantitative data.
21 Slide© 2014 Cengage Learning. All Rights Reserved. May not be scanned, copied
or duplicated, or posted to a publicly accessible website, in whole or in part.
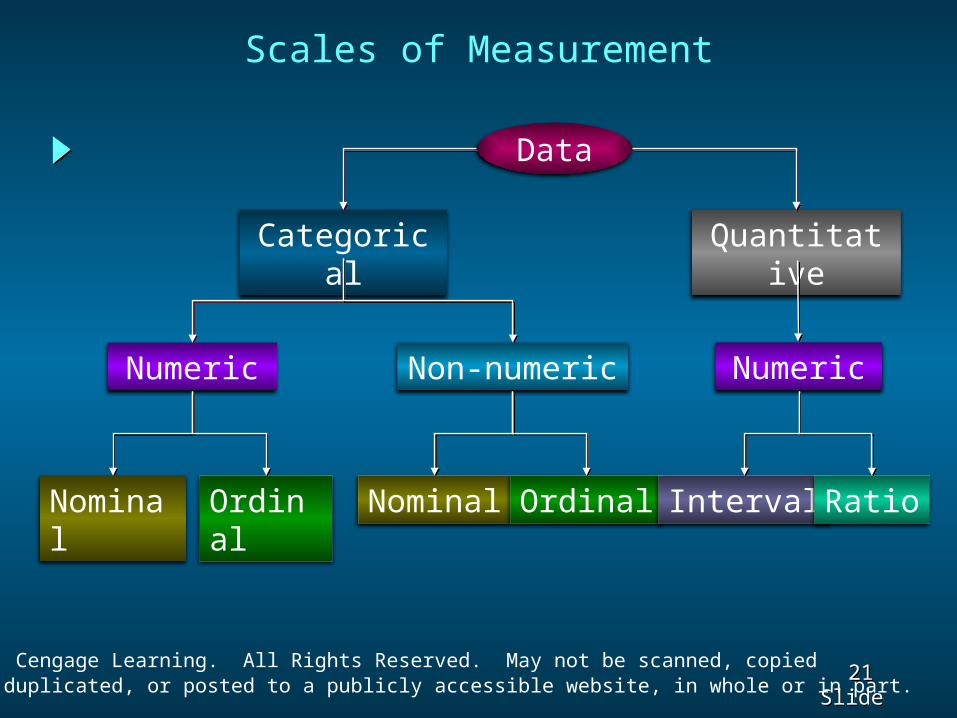
Scales of Measurement
Categorical Quantitative
Numeric NumericNon-numeric
Data
Nominal
Ordinal
Nominal Ordinal Interval Ratio
22 Slide© 2014 Cengage Learning. All Rights Reserved. May not be scanned, copied
or duplicated, or posted to a publicly accessible website, in whole or in part.
Cross-Sectional Data
Cross-sectional data are collected at the same or approximately the same point in time.
Example: data detailing the number of building permits issued in November 2012 in each of the counties of Ohio
23 Slide© 2014 Cengage Learning. All Rights Reserved. May not be scanned, copied
or duplicated, or posted to a publicly accessible website, in whole or in part.
Time Series Data
Time series data are collected over several time periods.
Example: data detailing the number of building permits issued in Lucas County, Ohio in each of the last 36 months
Graphs of time series help analysts understand• what happened in the past,• identify any trends over time, and• project future levels for the time series
24 Slide© 2014 Cengage Learning. All Rights Reserved. May not be scanned, copied
or duplicated, or posted to a publicly accessible website, in whole or in part.
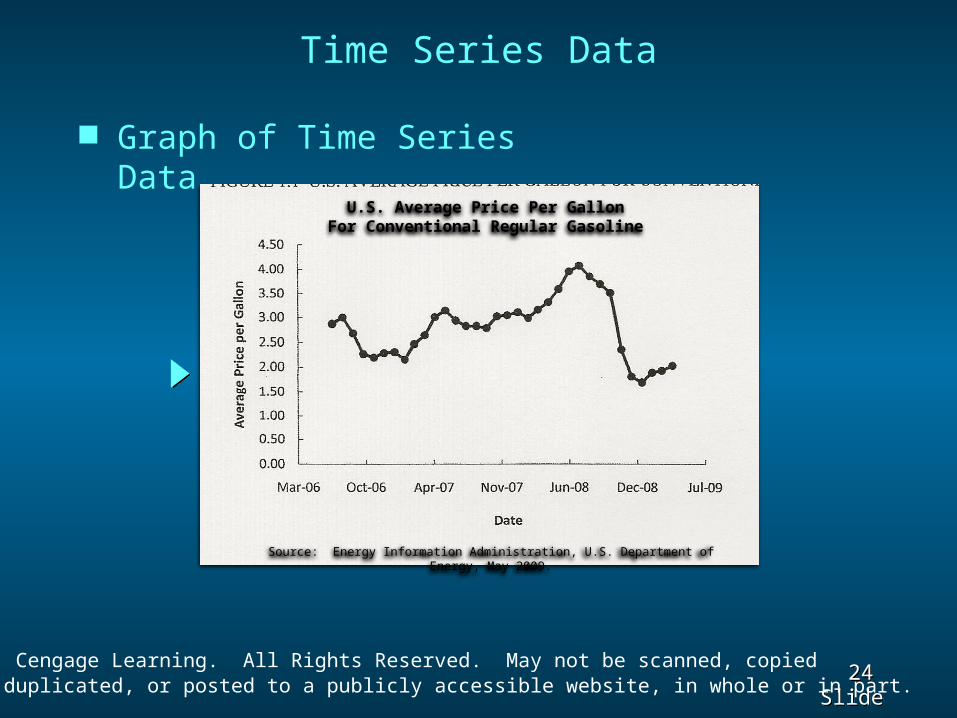
Time Series Data
U.S. Average Price Per GallonFor Conventional Regular Gasoline
Source: Energy Information Administration, U.S. Department of Energy, May 2009.
Graph of Time Series Data
25 Slide© 2014 Cengage Learning. All Rights Reserved. May not be scanned, copied
or duplicated, or posted to a publicly accessible website, in whole or in part.
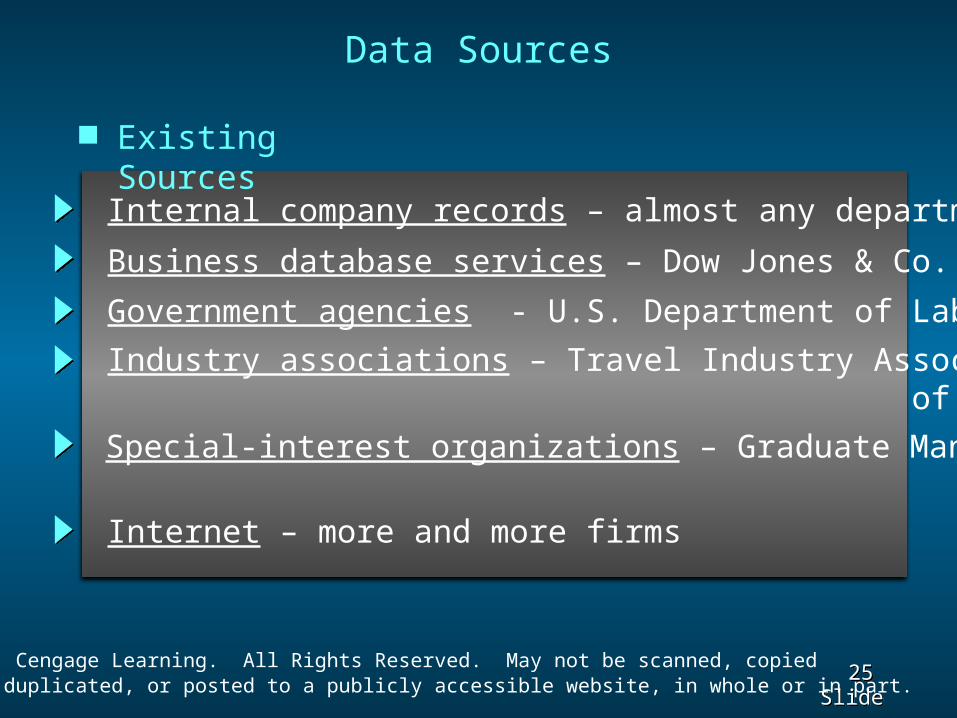
Data Sources
Existing Sources
Internal company records – almost any departmentBusiness database services – Dow Jones & Co.Government agencies - U.S. Department of LaborIndustry associations – Travel Industry Association of AmericaSpecial-interest organizations – Graduate Management Admission CouncilInternet – more and more firms
26 Slide© 2014 Cengage Learning. All Rights Reserved. May not be scanned, copied
or duplicated, or posted to a publicly accessible website, in whole or in part.
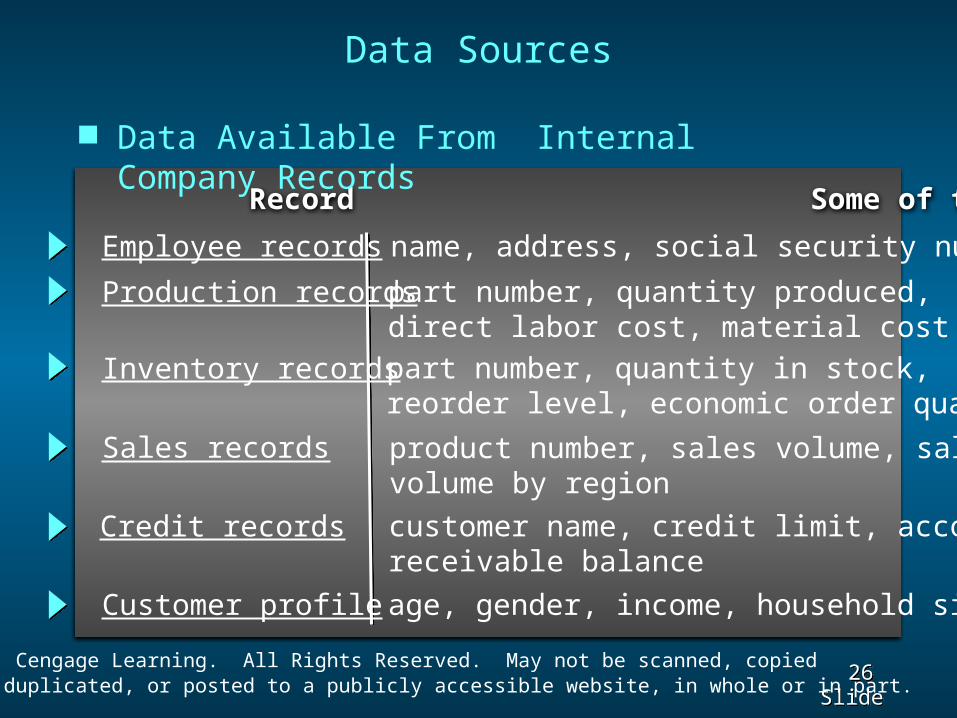
Record Some of the Data Available
Data Sources Data Available From Internal Company
Records Employee recordsProduction records
Inventory records
Sales records
Credit records
Customer profile
name, address, social security numberpart number, quantity produced, direct labor cost, material costpart number, quantity in stock,reorder level, economic order quantityproduct number, sales volume, salesvolume by regioncustomer name, credit limit, accountsreceivable balanceage, gender, income, household size
27 Slide© 2014 Cengage Learning. All Rights Reserved. May not be scanned, copied
or duplicated, or posted to a publicly accessible website, in whole or in part.
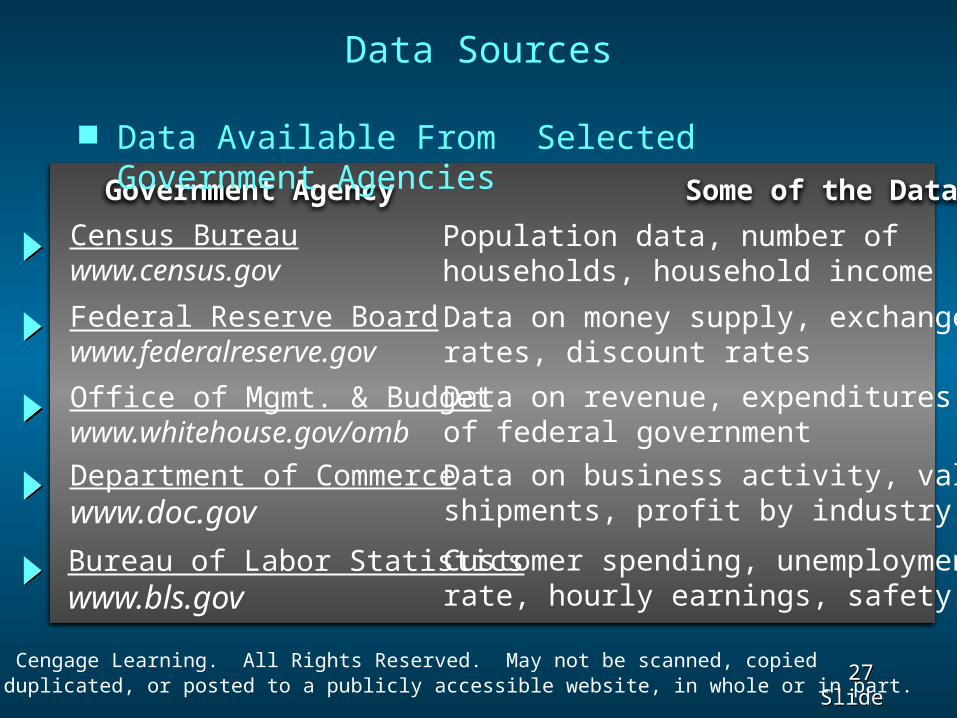
Government Agency Some of the Data Available
Data Sources Data Available From Selected Government
AgenciesCensus Bureauwww.census.govFederal Reserve Boardwww.federalreserve.govOffice of Mgmt. & Budgetwww.whitehouse.gov/ombDepartment of Commercewww.doc.govBureau of Labor Statisticswww.bls.gov
Population data, number ofhouseholds, household incomeData on money supply, exchangerates, discount ratesData on revenue, expenditures, debtof federal governmentData on business activity, value ofshipments, profit by industryCustomer spending, unemploymentrate, hourly earnings, safety record
28 Slide© 2014 Cengage Learning. All Rights Reserved. May not be scanned, copied
or duplicated, or posted to a publicly accessible website, in whole or in part.
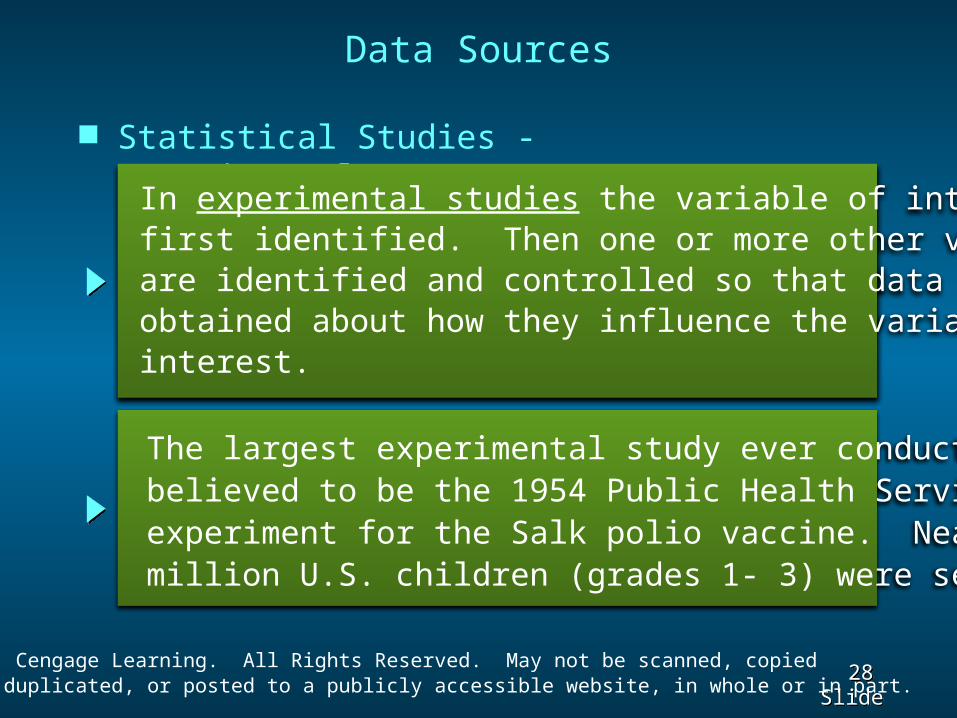
Data Sources Statistical Studies -
ExperimentalIn experimental studies the variable of interest isfirst identified. Then one or more other variablesare identified and controlled so that data can beobtained about how they influence the variable ofinterest.
The largest experimental study ever conducted is believed to be the 1954 Public Health Service experiment for the Salk polio vaccine. Nearly two million U.S. children (grades 1- 3) were selected.
29 Slide© 2014 Cengage Learning. All Rights Reserved. May not be scanned, copied
or duplicated, or posted to a publicly accessible website, in whole or in part.
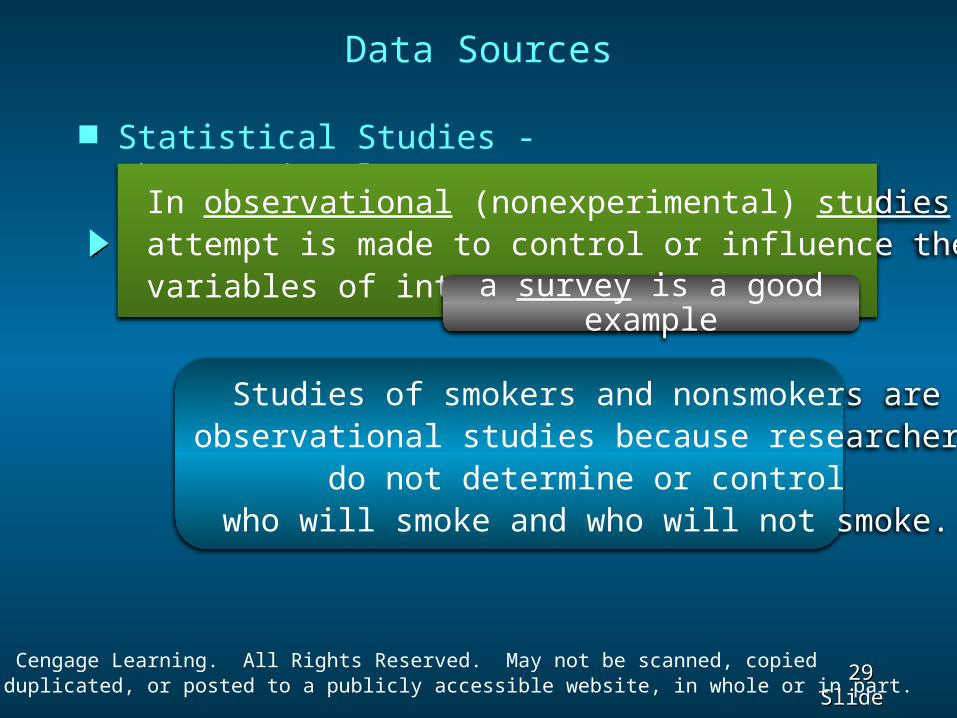
Statistical Studies - Observational
Data Sources
In observational (nonexperimental) studies no attempt is made to control or influence the variables of interest. a survey is a good
example
Studies of smokers and nonsmokers areobservational studies because researchers
do not determine or controlwho will smoke and who will not smoke.
30 Slide© 2014 Cengage Learning. All Rights Reserved. May not be scanned, copied
or duplicated, or posted to a publicly accessible website, in whole or in part.
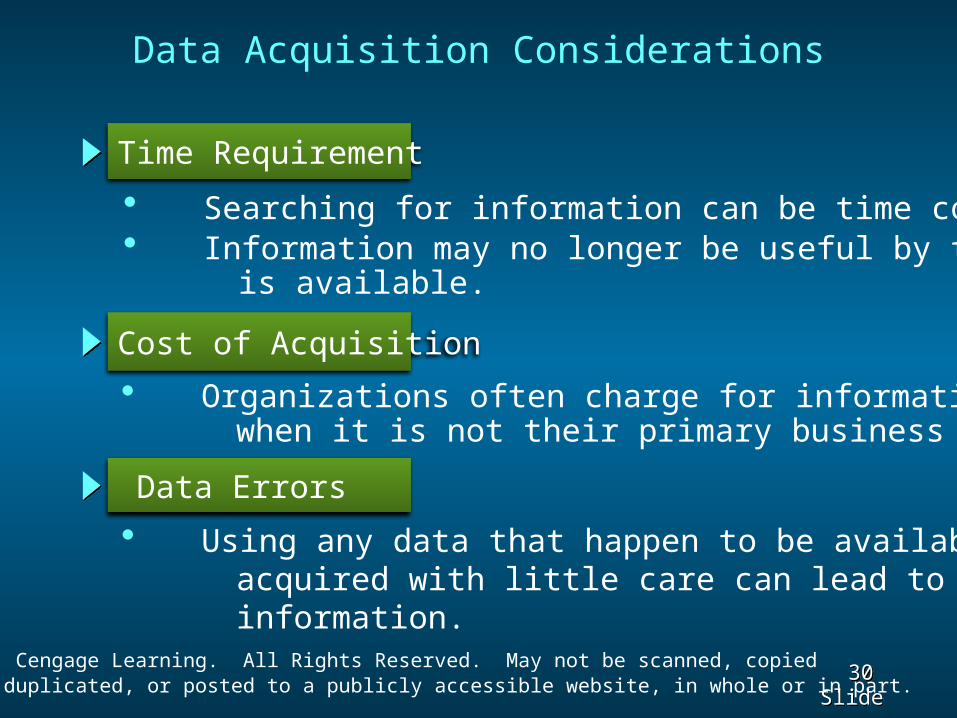
Data Acquisition Considerations
Time Requirement
Cost of Acquisition
Data Errors
• Searching for information can be time consuming.• Information may no longer be useful by the time it is available.
• Organizations often charge for information even when it is not their primary business activity.
• Using any data that happen to be available or were acquired with little care can lead to misleading information.
31 Slide© 2014 Cengage Learning. All Rights Reserved. May not be scanned, copied
or duplicated, or posted to a publicly accessible website, in whole or in part.
Descriptive Statistics
Most of the statistical information in newspapers, magazines, company reports, and other publications consists of data that are summarized and presented in a form that is easy to understand. Such summaries of data, which may be tabular, graphical, or numerical, are referred to as descriptive statistics.
32 Slide© 2014 Cengage Learning. All Rights Reserved. May not be scanned, copied
or duplicated, or posted to a publicly accessible website, in whole or in part.
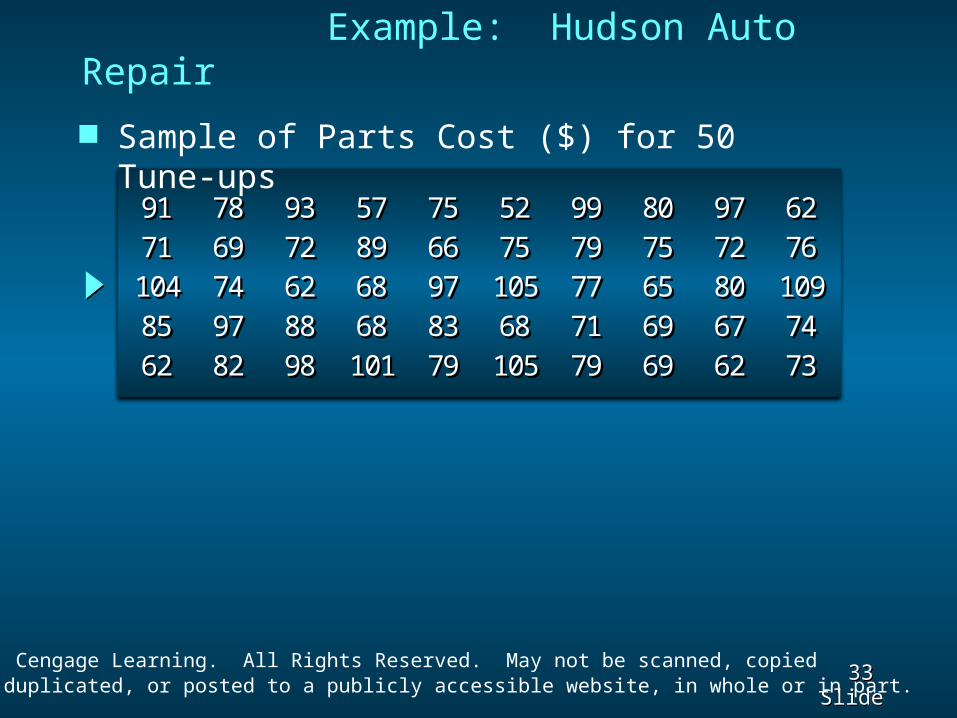
Example: Hudson Auto Repair
The manager of Hudson Auto would like to have a
better understanding of the cost of parts used in the
engine tune-ups performed in her shop. She examines
50 customer invoices for tune-ups. The costs of parts,
rounded to the nearest dollar, are listed on the next
slide.
33 Slide© 2014 Cengage Learning. All Rights Reserved. May not be scanned, copied
or duplicated, or posted to a publicly accessible website, in whole or in part.
Example: Hudson Auto Repair Sample of Parts Cost ($) for 50 Tune-
ups91 78 93 57 75 52 99 80 97 6271 69 72 89 66 75 79 75 72 76104 74 62 68 97 105 77 65 80 10985 97 88 68 83 68 71 69 67 7462 82 98 101 79 105 79 69 62 73
91 78 93 57 75 52 99 80 97 6271 69 72 89 66 75 79 75 72 76104 74 62 68 97 105 77 65 80 10985 97 88 68 83 68 71 69 67 7462 82 98 101 79 105 79 69 62 73
34 Slide© 2014 Cengage Learning. All Rights Reserved. May not be scanned, copied
or duplicated, or posted to a publicly accessible website, in whole or in part.
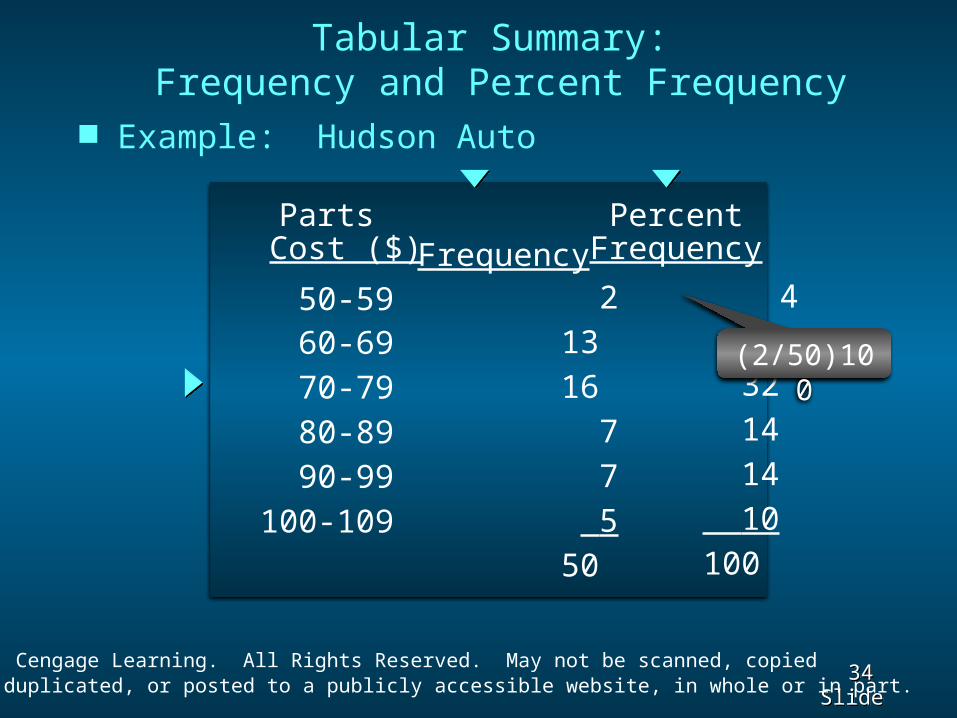
Tabular Summary: Frequency and Percent Frequency
50-59 60-69 70-79 80-89 90-99 100-109
2 13 16 7 7 5 50
4 26 32 14 14 10 100
(2/50)100
Parts Cost ($) Frequency
PercentFrequency
Example: Hudson Auto
35 Slide© 2014 Cengage Learning. All Rights Reserved. May not be scanned, copied
or duplicated, or posted to a publicly accessible website, in whole or in part.
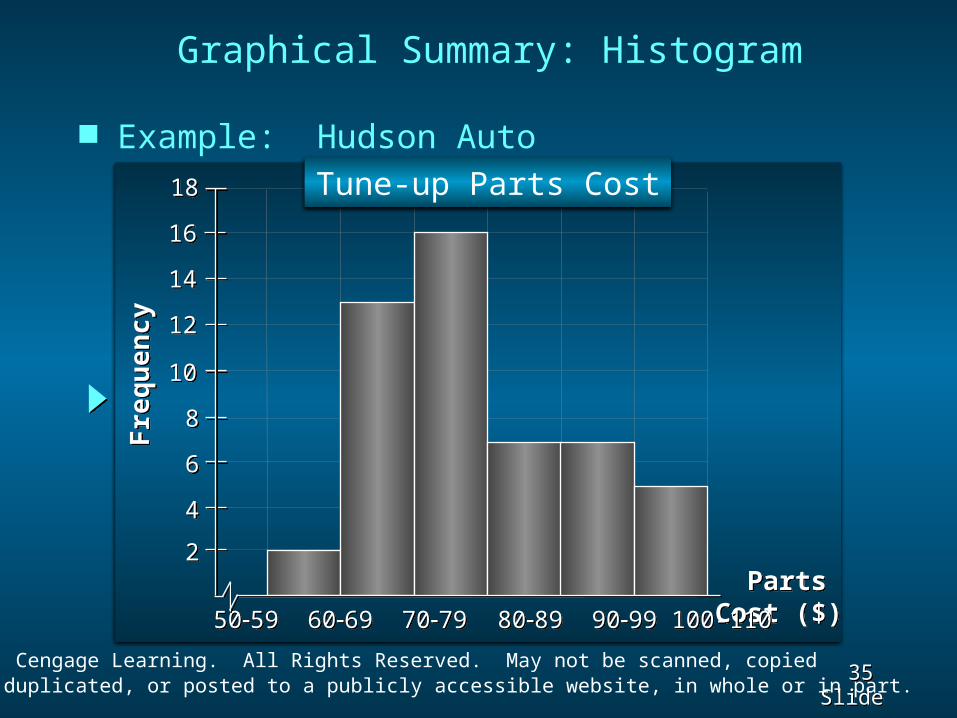
Graphical Summary: Histogram
2468
1012141618
PartsCost ($)
Freq
uenc
y
50-59 60-69 70-79 80-89 90-99 100-110
Tune-up Parts Cost Example: Hudson Auto
36 Slide© 2014 Cengage Learning. All Rights Reserved. May not be scanned, copied
or duplicated, or posted to a publicly accessible website, in whole or in part.
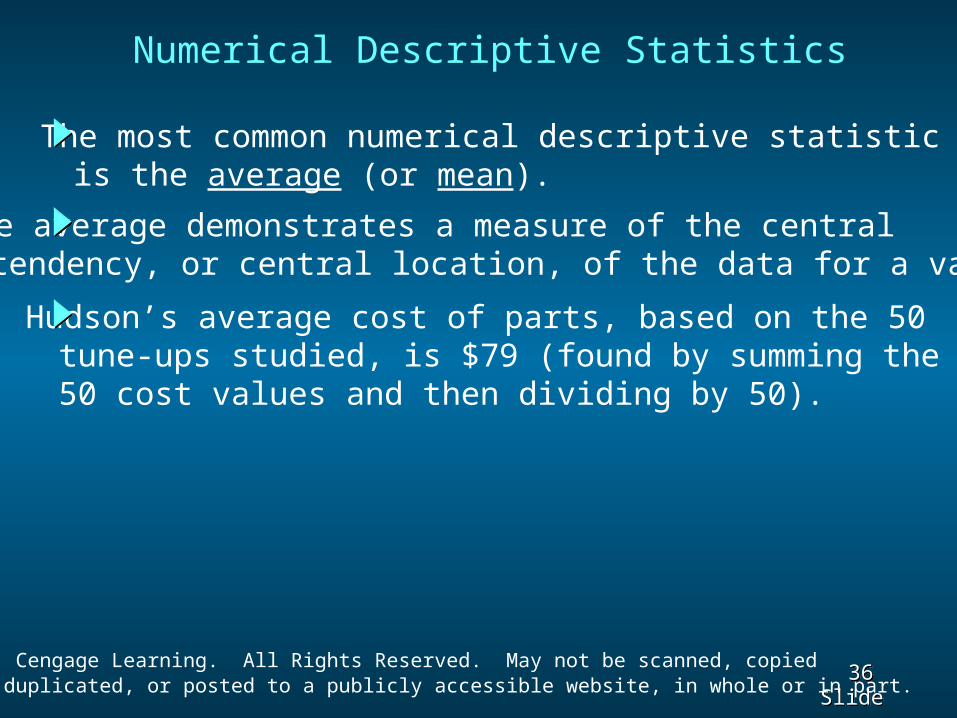
Numerical Descriptive Statistics
Hudson’s average cost of parts, based on the 50 tune-ups studied, is $79 (found by summing the 50 cost values and then dividing by 50).
The most common numerical descriptive statistic is the average (or mean).
The average demonstrates a measure of the central tendency, or central location, of the data for a variable.
37 Slide© 2014 Cengage Learning. All Rights Reserved. May not be scanned, copied
or duplicated, or posted to a publicly accessible website, in whole or in part.
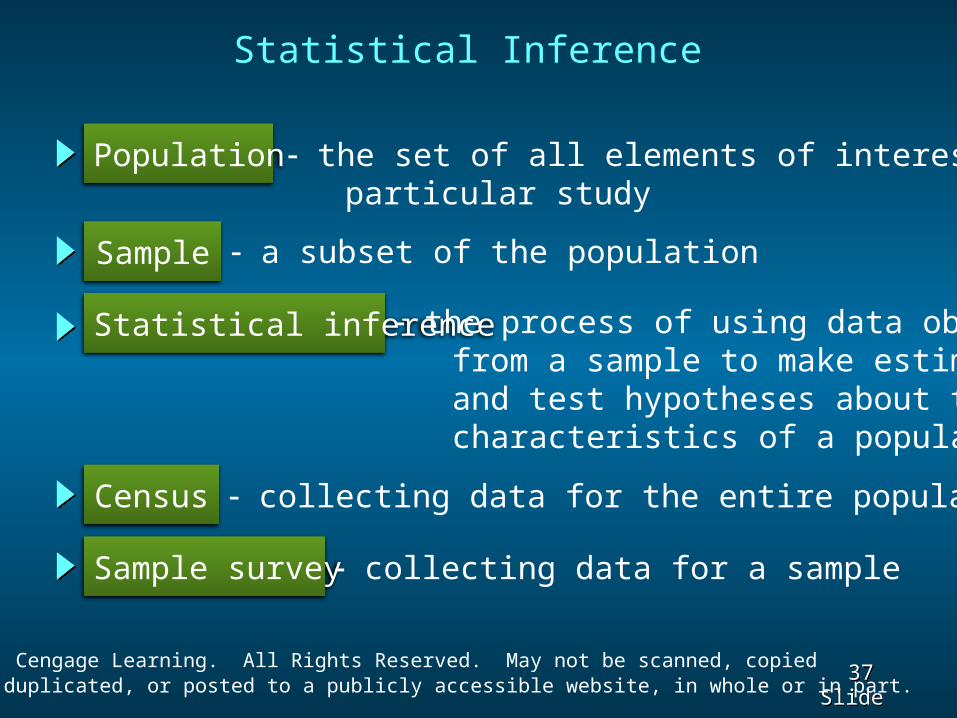
Statistical Inference
Population
Sample
Statistical inference
Census
Sample survey
- the set of all elements of interest in a particular study
- a subset of the population
- the process of using data obtained from a sample to make estimates and test hypotheses about the characteristics of a population
- collecting data for the entire population
- collecting data for a sample
38 Slide© 2014 Cengage Learning. All Rights Reserved. May not be scanned, copied
or duplicated, or posted to a publicly accessible website, in whole or in part.
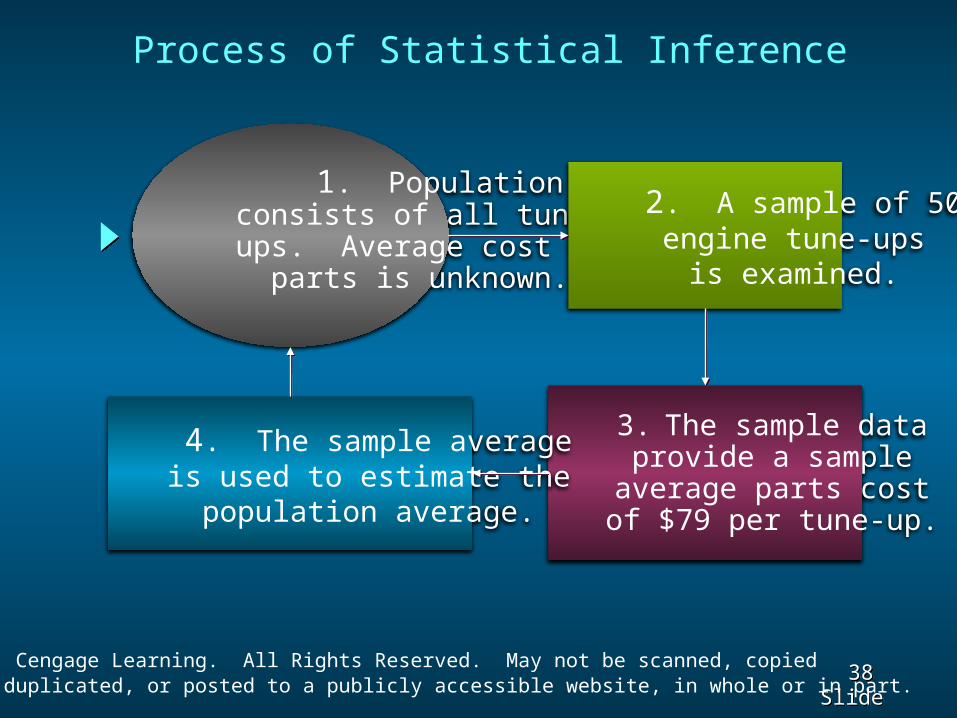
Process of Statistical Inference
1. Population consists of all tune-
ups. Average cost ofparts is unknown.
2. A sample of 50engine tune-ups
is examined.
3. The sample dataprovide a sample
average parts costof $79 per tune-up.
4. The sample averageis used to estimate the
population average.
39 Slide© 2014 Cengage Learning. All Rights Reserved. May not be scanned, copied
or duplicated, or posted to a publicly accessible website, in whole or in part.
Computers and Statistical Analysis
Statisticians often use computer software to perform the statistical computations required with large amounts of data. Many of the data sets in this book are available on
the website that accompanies the book. The data sets can downloaded in either Minitab or Excel format. Also, the Excel add-in StatTools can be downloaded from the website.
40 Slide© 2014 Cengage Learning. All Rights Reserved. May not be scanned, copied
or duplicated, or posted to a publicly accessible website, in whole or in part.
Data Warehousing Organizations obtain large amounts of data on a daily basis by means of magnetic card readers, bar code scanners, point of sale terminals, and touch screen monitors. Wal-Mart captures data on 20-30 million transactions per day. Visa processes 6,800 payment transactions per second. Capturing, storing, and maintaining the data, referred to as data warehousing, is a significant undertaking.
41 Slide© 2014 Cengage Learning. All Rights Reserved. May not be scanned, copied
or duplicated, or posted to a publicly accessible website, in whole or in part.
Data Mining
Analysis of the data in the warehouse might aid in decisions that will lead to new strategies and higher profits for the organization. Using a combination of procedures from statistics, mathematics, and computer science, analysts “mine the data” to convert it into useful information. The most effective data mining systems use automated procedures to discover relationships in the data and predict future outcomes, … prompted by only general, even vague, queries by the user.
42 Slide© 2014 Cengage Learning. All Rights Reserved. May not be scanned, copied
or duplicated, or posted to a publicly accessible website, in whole or in part.
Data Mining Applications
The major applications of data mining have been made by companies with a strong consumer focus such as retail, financial, and communication firms. Data mining is used to identify related products that customers who have already purchased a specific product are also likely to purchase (and then pop-ups are used to draw attention to those related products). As another example, data mining is used to identify customers who should receive special discount offers based on their past purchasing volumes.
43 Slide© 2014 Cengage Learning. All Rights Reserved. May not be scanned, copied
or duplicated, or posted to a publicly accessible website, in whole or in part.
Data Mining Requirements
Statistical methodology such as multiple regression, logistic regression, and correlation are heavily used. Also needed are computer science technologies involving artificial intelligence and machine learning. A significant investment in time and money is required as well.
44 Slide© 2014 Cengage Learning. All Rights Reserved. May not be scanned, copied
or duplicated, or posted to a publicly accessible website, in whole or in part.
Data Mining Model Reliability
Finding a statistical model that works well for a particular sample of data does not necessarily mean that it can be reliably applied to other data. With the enormous amount of data available, the data set can be partitioned into a training set (for model development) and a test set (for validating the model). There is, however, a danger of over fitting the model to the point that misleading associations and conclusions appear to exist. Careful interpretation of results and extensive testing is important.
45 Slide© 2014 Cengage Learning. All Rights Reserved. May not be scanned, copied
or duplicated, or posted to a publicly accessible website, in whole or in part.
Ethical Guidelines for Statistical Practice
In a statistical study, unethical behavior can take a variety of forms including:
• Improper sampling• Inappropriate analysis of the data• Development of misleading graphs• Use of inappropriate summary statistics• Biased interpretation of the statistical results You should strive to be fair, thorough, objective, and neutral as you collect, analyze, and present data. As a consumer of statistics, you should also be aware of the possibility of unethical behavior by others.
46 Slide© 2014 Cengage Learning. All Rights Reserved. May not be scanned, copied
or duplicated, or posted to a publicly accessible website, in whole or in part.
Ethical Guidelines for Statistical Practice
The American Statistical Association developed the report “Ethical Guidelines for Statistical Practice”.
• Professionalism• Responsibilities to Funders, Clients, Employers• Responsibilities in Publications and Testimony• Responsibilities to Research Subjects• Responsibilities to Research Team Colleagues
The report contains 67 guidelines organized into eight topic areas:
• Responsibilities to Other Statisticians/Practitioners• Responsibilities Regarding Allegations of Misconduct• Responsibilities of Employers Including Organizations, Individuals, Attorneys, or Other Clients

47 Slide© 2014 Cengage Learning. All Rights Reserved. May not be scanned, copied
or duplicated, or posted to a publicly accessible website, in whole or in part.
End of Chapter 1


