Embed Size (px)
Citation preview


John L. Grove College of Business Financial Advisory
Council 2019-2020
Jennifer L. Sassani, '93, Chair
Hershey Trust Company
Michelle R. Chopper, '02, CPA
Cohen & Company
Justin J. Ellsesser, '11, CFA, CAIA
AndCo Consulting
Chris J. Jackson, '97, AFIM
truNorth Financial Services
Joshua L. Jenkins, '12, CFP, ChFC
Jenkins Financial
Timothy G. Long, CFP, IAR
The Advisors at Cornerstone Financial, LLC
Louise Wisman Lovell
US Nuclear Regulatory Commission-Retired
Jonathan C. Moats, '10
Capital One Financial, LLC
David J. Morgan ‘80
Farmers Insurance - Retired
Joseph T. Nicholas, III, CFP ‘99
Wilmington Trust
Zach T. Paul, ‘09
Berkshire Hathaway Home Services
Lisa H. Percetti, ’15, CPA
Ernst & Young
Richard Powers, ‘98
Vanguard Group
Christopher S. Weber, '03
DeRock Electric Company, Inc.
Letter to Friends and Affiliates
John L. Grove College of Business Shippensburg University 1871 Old Main Drive Shippensburg, PA 17257-2299
www.ship.edu/business
Office: 717-477-1435
Fax: 717-477-4003 [email protected]
Dear Stakeholders, May 2, 2020 The 2019-20 Investment Management Program (IMP) is honored to share the following report with the friends and
supporters of the Wisman Fund. We are enriched by the educational foundation that is created through our coursework
in the Finance Program of the John L. Grove College of Business, the Finance Advisory Council, Shippensburg
University, and the Shippensburg University Foundation, all whom generously contributes to the program. The Wisman Fund was created by Mr. Frank Wisman through the SU Foundation to provide the undergraduate students
of Shippensburg University an opportunity to actively manage an active fund in the legitimate financial markets, with a
goal to generate returns above the predetermined benchmark. In agreement with the founders of the fund, the class
provides an annual four-year scholarship to an incoming finance student. Over the past year, the IMP has enhanced operational processes, standards of reporting securities and annual and semi-
annual reports that have contributed to our value of constant improvement. We suggest that each new program member
should utilize the Bloomberg terminal training known as Portfolio Management. This will allow new investment
analysts to better understand how to research securities and learn for themselves what kind of investment strategies
prove successful. The year of 2019 proved to be a year of growth. In that time, we saw companies benefit from increased consumer
spending and industrial expansion. We experienced the Federal Open Market Committee lowering rates to try and fuel
the continuing economic growth. The United States and China trade war stood to be a volatile series of events that had
serious impacts on global economic activities. During the spring of 2020, the IMP managers faced adversity due to COVID-19. Not only did the fund experience a
significant loss in value, the managers were forced to adapt to a situation that altered how the program had traditionally
operated. Since Shippensburg University decided to move classes to be 100% online for the remainder of the semester,
the fund’s managers were not able to meet face-to-face, had no access to the Trading room or Bloomberg Terminal, and
eventually left campus. To work around this change, the managers held meetings via video conferencing software (i.e.
Zoom). Finally, through the stress, confusion, and anxiety, the IMP managers made the best use of the limited resources
available to finish the school year strong and present an Annual Report that we are proud of. In addition, the IMP
managers were stripped of the opportunity to have a memorable experience attending the GAME (Global Asset
Management) Forum. GAME is a global financial symposium in New York City that fills the managers with excitement
as it offers a great opportunity to display the fund’s performance, gain valuable knowledge, and improve upon our
current skills. However, we are very honored to report that the Wisman Fund was awarded third place in the
Undergraduate Value Fund category. We would like to extend this honor to the 2019 Spring IMP class who helped
contribute to the 2019 performance.
Nonetheless, the IMP is pleased to report that we have beat our benchmark by 3.77% for the year 2019. The managers
of the Wisman Fund would like to extend our appreciation to the donors of the fund, the SU Foundation, finance faculty,
our faculty member of record Dr. Rim, and additional key stakeholders of the John L. Grove College of Business who
have an integral role in sustaining the fund and program. We are truly grateful for your continued help and support,
The Spring and Fall 2019 IMP Portfolio Managers

Table of Contents
INTRODUCTION ........................................................................................................................................... 2
2019 STATE OF THE ECONOMY .................................................................................................................. 3
EXECUTIVE SUMMARY ................................................................................................................................ 4
INVESTMENT STRATEGY ............................................................................................................................. 5
PORTFOLIO CHARACTERISTICS ................................................................................................................... 6
TOP TEN HOLDINGS .................................................................................................................................... 6
EQUITY SECTOR ALLOCATION ..................................................................................................................... 7
PORTFOLIO PERFORMANCE ........................................................................................................................ 8
2019 TOP 5 CONTRIBUTORS ...................................................................................................................... 9
2019 TOP 5 DETRACTORS ........................................................................................................................ 10
RISK ADJUSTED PERFORMANCE .............................................................................................................. 11
COMMUNICATIONS SERVICES-UNDERWEIGHT .......................................................................................... 12
CONSUMER DISCRETIONARY-OVERWEIGHT ............................................................................................... 16
CONSUMER STAPLES-OVERWEIGHT ......................................................................................................... 19
ENERGY-UNDERWEIGHT ........................................................................................................................... 24
FINANCIALS-UNDERWEIGHT ..................................................................................................................... 27
HEALTHCARE-UNDERWEIGHT ................................................................................................................... 31
INDUSTRIALS-UNDERWEIGHT ................................................................................................................... 37
INFORMATION TECHNOLOGY-OVERWEIGHT .............................................................................................. 41
MATERIALS-OVERWEIGHT ......................................................................................................................... 47
UTILITIES - OVERWEIGHT .......................................................................................................................... 50
REAL ESTATE-OVERWEIGHT ...................................................................................................................... 53
DIVIDENDS ................................................................................................................................................ 61
MERGERS AND ACQUISITIONS .................................................................................................................. 61
PORTFOLIO SNAPSHOT ............................................................................................................................. 62


2 Investment Management Program
INTRODUCTION
Mission Statement
The Investment Management Program (IMP) directs students with the skills, theories, and strategies needed to
become a knowledgeable investment analyst that can lead to becoming a portfolio manager through a pro-active
educational environment. The IMP offers students an opportunity to grow their leadership, communication, and
inter-group skills. Learning from actual experience is at the core of the IMP. The IMP fund’s investment goal is to
achieve a risk-adjusted return greater than that of the benchmark, which is composed of 80% equities and 20%
fixed income securities.
The 2019-2020 IMP is pleased to present the following Annual Report to illustrate the progress of the Wisman
Fund. Managers within the organization obtain real-world experience, having the ability to research and develop
security recommendations that consist of equities, fixed incomes and an increased interest in commodities to add
value to the portfolio. The willingness of students to develop a positive return was substantial and innovative
thinking was highly encouraged. The IMP management team has a focus on how to make profits from real
investments. The value of the portfolio increased from $173,020 at the end of 2018 to $225,950 at the end of
2019, an increase in value of $52,939 (30.59% rate of return).
The management team is composed of a President, Chief Compliance Officer, Accounting Coordinator, Public
Relations Coordinator and two Co-Risk Managers; each of the 11 managers contributed to fund management.
These individuals set each sector’s target weights by doing research and forecasting which sectors will aid us in
beating the benchmark. The IMP allocates resources depending on what will be beneficial in a long-term time
horizon.
Each analyst is required to present two investment proposals with a buy or sell recommendation to aid in
achieving our investment objective. This assessment of investment opportunities teaches individuals the backings
to a solid security presentation, gives them experience to what they will be doing as young professionals, and
provides them with confidence in seeing an investment strategy payoff. The managers communicate through
class discussions, email, and GroupMe (a messaging app) to ensure the group is up-to-date on upcoming
assignments. In terms of content for class discussions, members analyze economic conditions, political issues,
and world news to better understand how various events may impact the market and the IMP portfolio. Our class
had 11 managers, one manager per sector, who kept up with trends in their sectors and reported to the team.
The IMP has the opportunity to participate in the Global Asset Management Education (G.A.M.E.) Forum every
year. The G.A.M.E Forum is a global portfolio competition that provides students the opportunity to showcase their
portfolio and compete against other university portfolios, offers educational sessions to gain knowledge about the
financial industry and current trends, as well as network with financial professionals. This year, the Wisman Fund
placed third in the Undergraduate Value Portfolio division among more than forty portfolios in this category. The
fall 2019 portfolio managers would like to extend this accomplishment and our gratitude to the spring 2019
portfolio managers for contributing to the construction of the portfolio that performed so well in 2019.
The Financial Advisory Council (FAC) oversees the IMP Program. The IMP is extremely grateful for their efforts to
enhance our educational experience. The feedback and guidance from the FAC plays a key part in developing
students into successful financial professionals. The IMP will continue to evolve and grow in a positive direction
with the help of FAC members and other professionals, who provide the critical role in the development of this
program.

2019 Annual Report 3
2019 STATE OF THE ECONOMY
The initial step in evaluating a security using a top-down method is to evaluate the current economy and
industries to discover where our economy will be headed. The consensus of the 2019 IMP class is that the United
States economy is currently in a mid-late stage of the business cycle. While it is difficult to establish a timeline for
the transitioning of stages for the economy, it is important to gear up for the following late and recessionary
phases. The economy of the U.S. is experiencing slow growth, with average growth rate expectations in 2020 and
2021. The key factors that will impact the U.S and global economy moving forward are the Coronavirus (COVID-
19), interest rate changes, and economic growth slowdown. These factors will dictate a great number of other
factors because of their extended impacts. Among others, COVID-19 has created significant instability in the
global economy and will continue to stunt economic growth as more cases in new countries have been reported
on a daily basis. The containment of this dreadful virus will prove to limit the global economic expansion. As the
presidential election ensues, we may experience more volatility. We also believe interest rates will fall as an
attempt to support continuous economic growth. In conclusion, the most realistic possibility may be much slower
growth in 2020 and 2021 because of these head-wind factors and uncertainties.
Fall 2019 IMP Class (back, from left); Andrew Butz, Corbin Chevaux, Sean Fox, yyyy; (front, from left) Kyle McGinnis, Shelby Denlinger, Nicolas Seymour, Destinee Bobo, Tyler Hahn, and John Morey.
Spring 2020 IMP Class (back, from left); Tyler Hahn, John Morey, Corbin Chevaux, Sean Fox, Cedric Adams; (front,
from left) Nicolas Seymour, Madison Eutzy, Hannah Hunt, Morgan Kowalski, Jack Cornely,
and Andrew Butz.
4 Investment Management Program
EXECUTIVE SUMMARY
Investment Objective
To achieve a risk-adjusted return exceeding the
benchmark, which consists of 80% of the S&P 500
Index and 20% of the Bloomberg Barclays U.S.
Aggregate Bond Index.
Investment Strategy
The organization invests in both fixed-income and
equity securities. Members analyze securities using a
top-down approach and select undervalued stocks
based on the following characteristics:
Companies with proper business plans and
strategies
Sound financial fundamentals
Stock trades at a discount to estimates of
intrinsic value
Demonstrates strong executive
management team that has growth in mind
Fixed-income securities are selected based on:
Investment grade bonds that have credit
ratings of BBB or higher as reported by
Standard & Poor’s, Moody’s, and Fitch
Group
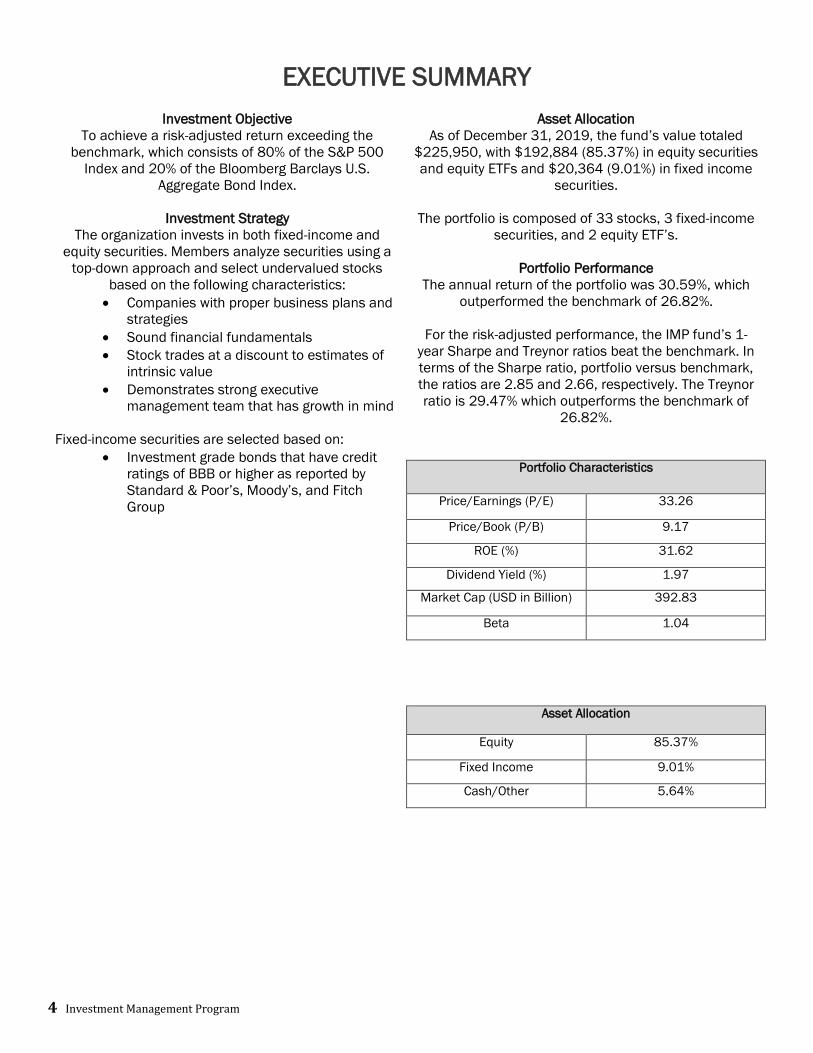
Asset Allocation
As of December 31, 2019, the fund’s value totaled
$225,950, with $192,884 (85.37%) in equity securities
and equity ETFs and $20,364 (9.01%) in fixed income
securities.
The portfolio is composed of 33 stocks, 3 fixed-income
securities, and 2 equity ETF’s.
Portfolio Performance
The annual return of the portfolio was 30.59%, which
outperformed the benchmark of 26.82%.
For the risk-adjusted performance, the IMP fund’s 1-
year Sharpe and Treynor ratios beat the benchmark. In
terms of the Sharpe ratio, portfolio versus benchmark,
the ratios are 2.85 and 2.66, respectively. The Treynor
ratio is 29.47% which outperforms the benchmark of
26.82%.
Portfolio Characteristics
Price/Earnings (P/E) 33.26
Price/Book (P/B) 9.17
ROE (%) 31.62
Dividend Yield (%) 1.97
Market Cap (USD in Billion) 392.83
Beta 1.04
Asset Allocation
Equity 85.37%
Fixed Income 9.01%
Cash/Other 5.64%

2019 Annual Report 5
INVESTMENT STRATEGY
The IMP managers invest in both fixed-income and
equity securities. The managers begin analyzing
with a top-down approach before selecting
undervalued securities that possess some key
characteristics. These key characteristics are as
follows:
The company implements proper
business plans and strategies.
The company offers differentiated
products and/or services.
The company has strategic competitive
advantages over its competitors.
The company demonstrates sound
financial fundamentals.
The security is priced at a discount
when compared to estimates of intrinsic
value.
The company possesses a strong
management team that has growth in
mind.
Fixed-income securities are investment
grade and have a credit rating of BBB or
higher as reported by Standard &
Poor’s, Moody’s, and Fitch Group.
To determine a security’s intrinsic value, the IMP
managers utilize various valuation models. These
models include stable, two-stage, and three-stage
dividend discount models, as well as stable, two-
stage, and three-stage free cash flow-to-equity
models for firms who do not pay dividends. After
obtaining the estimated intrinsic value from any one
of these models, analysts will apply a 15% margin
of safety to develop lower and upper bounds. If the
current market price of the security is below the
lower bound, we conclude that the security is
undervalued and is a potential buy.
To further analyze a security, the IMP mangers
conduct a relative valuation of key financial ratios.
Relative valuation is conducted by taking financial
ratios of the security of interest and comparing
them amongst its industry peers when applicable.
The various categories of financial ratios and the
ratios themselves that analysts focus on are as
follows:
Financial Ratios
o Price-to-earnings ratio
o Price-to-book ratio
o Price-to-sales ratio
o Price-to-earnings growth ratio (PEG)
o Price-to-free cash flow ratio
Financial Health
o Current ratio
o Long-term debt-to-equity ratio
o Debt-to-equity ratio
Efficiency
o Receivables turnover ratio
o Inventory turnover ratio
o Asset turnover ratio
Profitability
o Net profit margin
o Return on assets (ROA)
o Return on equity (ROE)
Growth Rates
o Earnings per share (EPS) growth
o Revenue growth

6 Investment Management Program
PORTFOLIO CHARACTERISTICS
As of December 31, 2019, the value of the IMP portfolio was $225,950, consisting of $192,884
(85.37%) in equities, $20,364 (9.01%) in fixed-income securities, and $12,700 (5.62%) in cash. Some
of the key portfolio characteristics are shown in the table below as weighted averages:
Portfolio Characteristics IMP Asset Allocation
Price/Earnings (P/E) 33.26 Equity 85.37%
Price/Book (P/B) 9.17 Fixed Income 9.01%
ROE (%) 31.62 Cash 5.62%
Dividend Yield (%) 1.97
Market Cap (USD in Billion) 392.83
Beta 1.04
TOP TEN HOLDINGS
The Wisman Fund’s top ten holdings account for 45.1% of the overall portfolio. These holdings include
Amazon, Apple, Microsoft, UnitedHealth Group, PowerShares S&P 500 High Dividend Yield Portfolio ETF,
iShares Core U.S. Aggregate Bond Index ETF, Accenture PLC class A, Vanguard High Dividend Yield ETF,
Visa and Procter & Gamble.
Securities Market Value Weight
Amazon (AMZN) $14,782.72 6.94%
Apple Inc. (AAPL) $12,333.30 5.76%
Microsoft Corp. (MFST) $11,827.50 5.61%
UnitedHealth Group (UNH) $11,759.20 5.17%
PowerShares S&P 500 High Dividend (SPHD) $11,183.62 4.40%
iShares Core U.S. Aggregate Bond Index
ETF(AGG) $8,989.60
3.83%
Accenture PLC Class A (ACN) $8,422.80 3.65%
Vanguard High Dividend Yield (VYM) $7,590.51 3.26%
Visa (V) $7,516.00 3.19%
Procter & Gamble (PG) $7,494.00
3.05%
Total $101,899.25 45.1%
2019 Annual Report 7
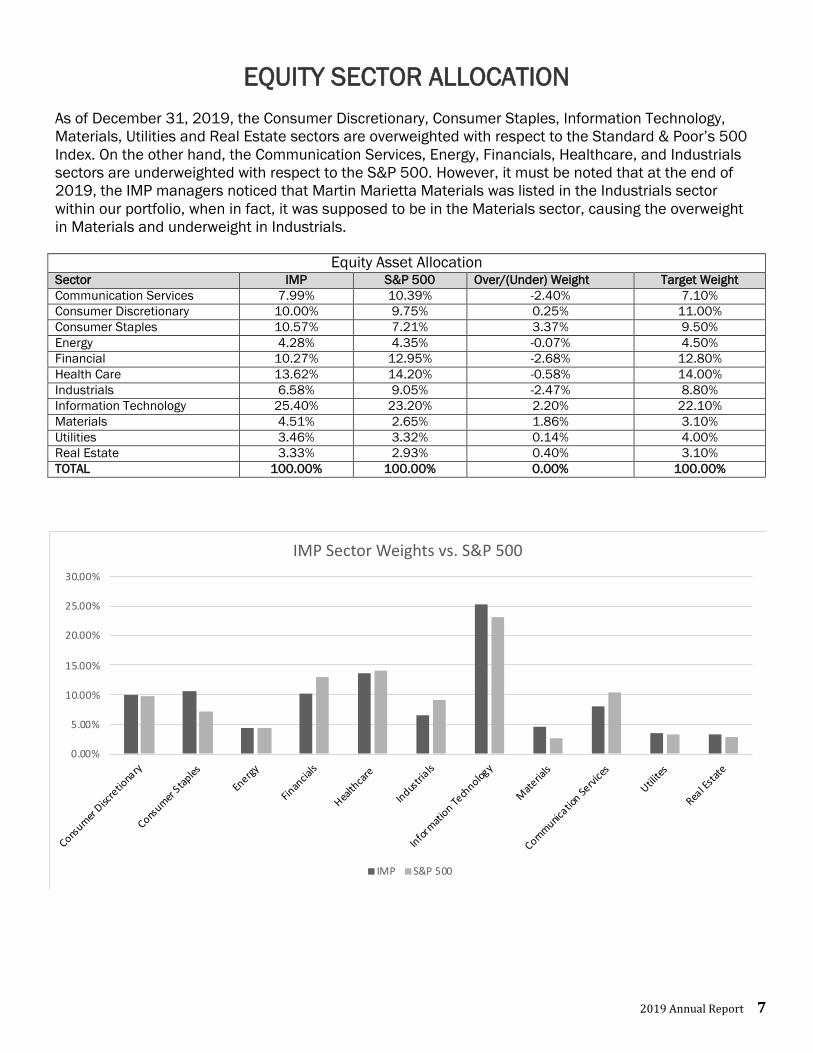
EQUITY SECTOR ALLOCATION
As of December 31, 2019, the Consumer Discretionary, Consumer Staples, Information Technology,
Materials, Utilities and Real Estate sectors are overweighted with respect to the Standard & Poor’s 500
Index. On the other hand, the Communication Services, Energy, Financials, Healthcare, and Industrials
sectors are underweighted with respect to the S&P 500. However, it must be noted that at the end of
2019, the IMP managers noticed that Martin Marietta Materials was listed in the Industrials sector
within our portfolio, when in fact, it was supposed to be in the Materials sector, causing the overweight
in Materials and underweight in Industrials.
Equity Asset Allocation
Sector IMP S&P 500 Over/(Under) Weight Target Weight
Communication Services 7.99% 10.39% -2.40% 7.10%
Consumer Discretionary 10.00% 9.75% 0.25% 11.00%
Consumer Staples 10.57% 7.21% 3.37% 9.50%
Energy 4.28% 4.35% -0.07% 4.50%
Financial 10.27% 12.95% -2.68% 12.80%
Health Care 13.62% 14.20% -0.58% 14.00%
Industrials 6.58% 9.05% -2.47% 8.80%
Information Technology 25.40% 23.20% 2.20% 22.10%
Materials 4.51% 2.65% 1.86% 3.10%
Utilities 3.46% 3.32% 0.14% 4.00%
Real Estate 3.33% 2.93% 0.40% 3.10%
TOTAL 100.00% 100.00% 0.00% 100.00%
0.00%
5.00%
10.00%
15.00%
20.00%
25.00%
30.00%
Consum
er D
iscre
tiona
ry
Consum
er S
taples
Energ
y
Finan
cials
Health
care
Indus
trials
Info
rmat
ion Te
chnolog
y
Mat
erials
Comm
unicatio
n Serv
ices
Utilite
s
Real E
stat
e
IMP Sector Weights vs. S&P 500
IMP S&P 500
8 Investment Management Program
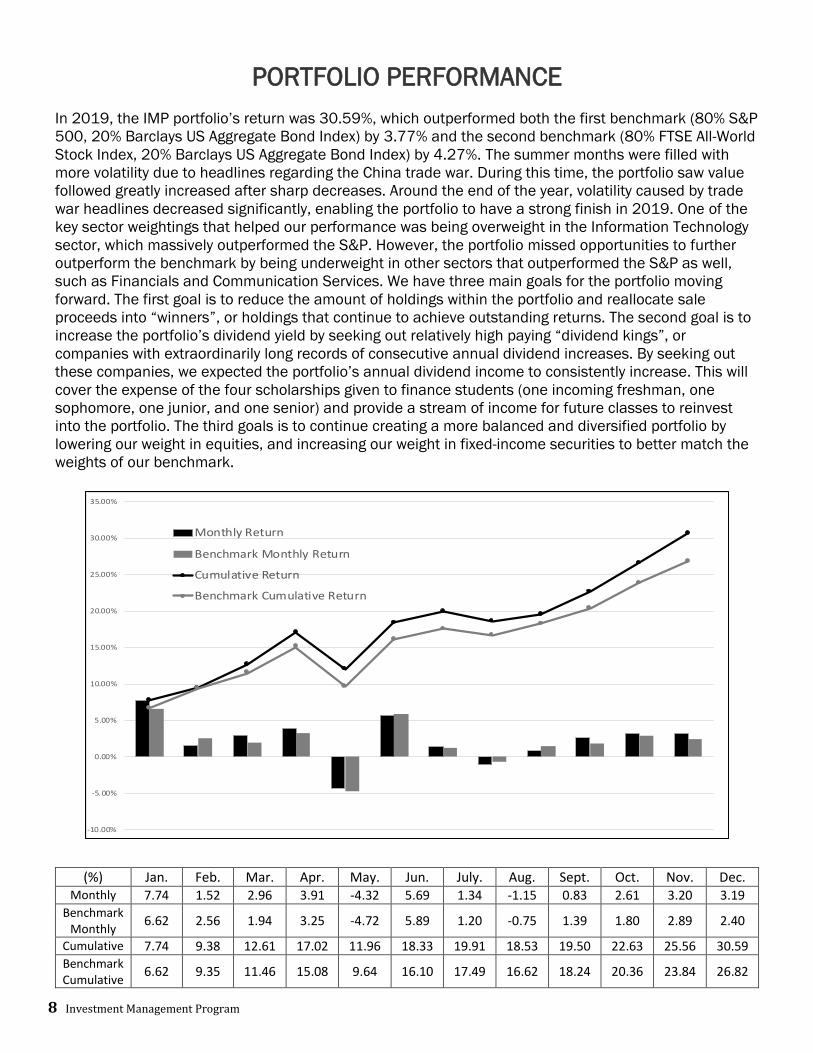
PORTFOLIO PERFORMANCE
In 2019, the IMP portfolio’s return was 30.59%, which outperformed both the first benchmark (80% S&P
500, 20% Barclays US Aggregate Bond Index) by 3.77% and the second benchmark (80% FTSE All-World
Stock Index, 20% Barclays US Aggregate Bond Index) by 4.27%. The summer months were filled with
more volatility due to headlines regarding the China trade war. During this time, the portfolio saw value
followed greatly increased after sharp decreases. Around the end of the year, volatility caused by trade
war headlines decreased significantly, enabling the portfolio to have a strong finish in 2019. One of the
key sector weightings that helped our performance was being overweight in the Information Technology
sector, which massively outperformed the S&P. However, the portfolio missed opportunities to further
outperform the benchmark by being underweight in other sectors that outperformed the S&P as well,
such as Financials and Communication Services. We have three main goals for the portfolio moving
forward. The first goal is to reduce the amount of holdings within the portfolio and reallocate sale
proceeds into “winners”, or holdings that continue to achieve outstanding returns. The second goal is to
increase the portfolio’s dividend yield by seeking out relatively high paying “dividend kings”, or
companies with extraordinarily long records of consecutive annual dividend increases. By seeking out
these companies, we expected the portfolio’s annual dividend income to consistently increase. This will
cover the expense of the four scholarships given to finance students (one incoming freshman, one
sophomore, one junior, and one senior) and provide a stream of income for future classes to reinvest
into the portfolio. The third goals is to continue creating a more balanced and diversified portfolio by
lowering our weight in equities, and increasing our weight in fixed-income securities to better match the
weights of our benchmark.
(%) Jan. Feb. Mar. Apr. May. Jun. July. Aug. Sept. Oct. Nov. Dec. Monthly 7.74 1.52 2.96 3.91 -4.32 5.69 1.34 -1.15 0.83 2.61 3.20 3.19
Benchmark Monthly
6.62 2.56 1.94 3.25 -4.72 5.89 1.20 -0.75 1.39 1.80 2.89 2.40
Cumulative 7.74 9.38 12.61 17.02 11.96 18.33 19.91 18.53 19.50 22.63 25.56 30.59 Benchmark Cumulative
6.62 9.35 11.46 15.08 9.64 16.10 17.49 16.62 18.24 20.36 23.84 26.82
-10.00%
-5.00%
0.00%
5.00%
10.00%
15.00%
20.00%
25.00%
30.00%
35.00%
Monthly Return
Benchmark Monthly Return
Cumulative Return
Benchmark Cumulative Return

2019 Annual Report 9
2019 TOP 5 CONTRIBUTORS
Apple, Inc. (AAPL): Apple Inc. provided our portfolio an outstanding 86.16% return in 2019, making 2019
Apple’s best year in terms of stock performance since 2009. The tech giant surpassed the $1 trillion
market cap as its stock price soared over $290 at the end of 2019. The company saw a drop in iPhone
sales from 2018, however, sales still exceeded expectations. Despite this drop in iPhone sales, Apple
continued to appreciate in price, mainly due to strong performance in their wearable products such as
AirPods and the Apple Watch. IMP holds 42 shares of Apple, Inc.
Martin Marietta Materials, Inc. (MLM): Martin Marietta Materials, Inc. had a strong 2019, with the stock
granting the IMP portfolio a 62.70% return. The firm has managed to grow their earnings every year over
the past five years, while increasing their dividends per share by an average of 5.18% per year in the
same time period, and are positioned to continue its strong earnings. Martin Marietta Materials offers
resiliency to the portfolio. While the market was volatile over the summer months, MLM managed to
beat earnings estimates and appreciate in value. The company experiences above average net margins
in comparison to the industry, showing management’s effectiveness in generating shareholder wealth.
IMP held 7 shares of Martin Marietta Materials, Inc. in 2019.
Facebook (FB): Facebook provided the portfolio with a 56.57% return. Facebook has consistently grown
their daily and monthly active users over the past three years. This increase in users directly benefits
their advertising revenue, ultimately increasing the firms value. Furthermore, the outlook for Facebook
remains positive as more businesses continue to join social media and utilize its advertising benefits,
leading to increased revenues for Facebook. IMP holds 17 shares of Facebook.
Microsoft Corporation (MSFT): Microsoft Corporation continued its extraordinary performance with
another outstanding year in 2019, giving the IMP portfolio a 55.26% return. Microsoft has proven to be
a reliable technology giant based in Redmond, Washington. Microsoft has consistently grown their
revenue year-over-year mainly due to their focus on subscription based services. The firm has an
intelligent cloud infrastructure, which provides the firm with strong long-term growth. Furthermore,
Microsoft focuses on business-to-business sales by introducing products and services to help enhance
the performance of their partners. With their above average valuation ratios in comparison to the S&P
500, it shows investors are less price sensitive of the security. IMP holds 75 shares of Microsoft
Corporation.
Accenture PLC Class A (ACN): Accenture PLC had an encouraging 2019 with a 49.33% return for the
portfolio. ACN has been a key holding within the portfolio since 2014. Since then, the company has
increased its value by over 160%. Accenture PLC provides consulting and outsourcing services primarily
to Fortune 500 companies in various industries such as communications, media and technology,
financial services, health and public services, energy and other resource companies. Having such
diverse business segments make Accenture PLC one of the largest consulting firms in the world.
Furthermore, Accenture PLC is the leading company within the outsourcing segment, positioning the firm
for future growth as demand for outsourcing has been continually increasing. IMP held 40 shares of
Accenture PLC in 2019.

10 Investment Management Program
2019 TOP 5 DETRACTORS
3M (MMM): 3M was a top detractor of the IMP portfolio in 2019, with a -7.41% return. The firm started
off the year strong, rebounding from its disappointing 2018 where it provided the portfolio with a
-16.74% return. However, when headlines about the China trade war started to appear, 3M’s stock price
dropped by over 25% and remained volatile through the summer. This drop in value and volatility did not
come as a surprise as the firm’s revenue comes largely from outside of the United States, with its
industrial segment making up a majority of that revenue. In 2019, IMP held 25 shares of the stock.
Cheniere Energy (LNG): Cheniere Energy provided the IMP portfolio a -4.56% return in 2019. The firm,
who specializes in the liquification and transportation of natural gas, was added to the portfolio in late
October, 2019. Cheniere Energy tends to be a more volatile stock with relatively large price swings in a
short time period. Admittedly, the IMP managers did not enter the position at a beneficial price point,
which we believe contributes to the negative return. However, with Cheniere Energy being a Fortune 500
company that mainly transports and exports liquified natural gas, the company is positioned to have a
bright future as the world shifts to cleaner energy sources. IMP held 40 shares of Cheniere Energy in
2019.
Honeywell International, Inc. (HON): Honeywell International saw a return of -2.55% in 2019. The firm
operates in the same space as 3M, another detractor of the portfolio. However, Honeywell International
started the year off strong and maintained that momentum before becoming flat at the end of the year.
IMP added 20 shares of the company into the portfolio in mid-November. Although the firm provided a
slight negative return, Honeywell has proven its ability to generate shareholder wealth as they have beat
earnings estimates in every quarter of 2019 while increasing their dividend payout.
SPDR Portfolio Aggregate Bond ETF (SPAB): The SPDR Portfolio Aggregate Bond ETF provided the
portfolio with a return of -0.57% in 2019. SPAB is a fixed income ETF that tracks the performance of the
Bloomberg Barclay’s U.S. Aggregate Bond Index. In an effort to increase the fixed income weight, IMP
established a position size of 200 shares. Although there was slight negative performance from the time
SPAB was bought, we believe that the ETF is a key holding for the portfolio as it provides stability, a
stream of income, and helps match the weights of our benchmark.
iShares Core U.S. Aggregate Bond ETF (AGG): iShares Core U.S. Aggregate Bond ETF is another fixed
income ETF that tracks the Bloomberg Barclay’s U.S. Aggregate Bond Index. In 2019, AGG provided the
portfolio with a -0.35% return. The ETF is owned and managed by BlackRock, Inc., the largest asset
management firm in the world. AGG is very similar to SPAB (mentioned above), as it is viewed as a key
holding within the portfolio by providing stability and income to the portfolio. IMP added 80 shares of
AGG in an effort to increases the fixed income weight of the portfolio.

2019 Annual Report 11
RISK ADJUSTED PERFORMANCE
The IMP portfolio’s value grew by 30.59% in 2019, which outperformed the benchmark of 26.82%.
Analyzing the 3-year average annual return, the fund outperformed the benchmark by a total of 1.38%
(14.47% and 13.09%, respectively). However, the 5-year average annual return illustrates a differing
result, as the portfolio underperformed its benchmark by 0.65% (9.42% and 10.07%, respectively).
The IMP portfolio has a beta of 1.04, which is greater than the comparing index (i.e. 1.00), indicating
that the portfolio is exposed to slightly greater risk than the overall market. This assumption of greater
risk exposure is confirmed by the portfolio’s standard deviation of 10.72%, which is also greater than
the benchmark’s standard deviation of 10.08%.
Both the Sharpe and Treynor ratios were used to compare the risk-adjusted performance of the IMP
portfolio and its benchmark. For the 1-year period, the portfolio's Sharpe ratio was greater than its
benchmark by 0.19 (2.85 and 2.66, respectively). The portfolio also saw the 1-year Treynor ratio for the
fund at 29.47% had a higher risk-adjusted return than the opposing index (26.82%). The fund’s 3-year
Sharpe ratio of 1.37 is slightly greater than the benchmark by 0.01. On the other hand, the fund’s 5-year
Sharpe ratio of 0.92 trails the benchmark by 0.14. Lastly, when comparing the 3-year and 5-year Treynor
ratios of the fund to the underlying index, the portfolio exceeds the benchmark by 0.32% for the 3-year
period, and lags by 1.12% for the 5-year period.
1-Year 3-Year 5-Year
IMP BENCHMARK IMP BENCHMARK IMP BENCHMARK
Average Annual Return (%) 30.59 26.82 14.47 13.09 9.42 10.07
Growth from $100
Investment $130.59 $126.82 $150.01 $144.64 $156.82 $161.54
Risk Measure
Standard Deviation (%) 10.72 10.08 10.59 9.61 10.25 9.50
Beta 1.04 1.00 1.08 1.00 1.05 1.00
Risk-Adjusted Performance
Sharpe Ratio 2.85 2.66 1.37 1.36 0.92 1.06
Treynor Ratio (%) 29.47 26.82 13.41 13.09 8.95 10.07

COMMUNICATIONS SERVICES-UNDERWEIGHT
Sector Overview
Entertainment: This industry contains Movies and Entertainment
along with Interactive Home Entertainment. The most notable
items of interest in this industry are gaming and movie producing
companies.
Interactive Media and Services: This industry includes companies
engaged in content and information creation or distribution. These
are companies where revenues are derived in pay-per-click
advertising, which is common among search engines, social
media platforms, online classifieds, and online review companies.
Media: This industry is made up of four sub-categories which are
Advertising, Broadcasting, Cable & Satellite, and Publishing. Major
companies within media are commonly found as major networks,
news outlets, and agents of advertising mediums.
Wireless Telecommunication Services: This industry includes
providers of cellular and wireless telecommunication services.
Mobile service carriers and providers make up this industry.
Communication Services is the newest Global
Industry Classification Standard Sector recognized
by our benchmark, the S&P 500. This sector takes
the place of the former Telecommunications sector
and has captured pieces of the Information
Technology and Consumer Discretionary Sectors.
This sector is comprised of companies that provide
communication services through fixed line, cellular,
wireless, high bandwidth and/or fiber optic cable
network. Additionally, companies within this sector
provide internet services such as access, navigation,
and internet related software and services. The
reason for this adjustment in the GICS stems from
the mergers and acquisitions of Telecom companies
by media and internet companies given the massive
shifts in the consumer markets. The way consumers
define the capabilities of their smartphone has
expanded over the last decade and therefore, the
sector must adjust to accommodate.
Diversified Telecommunication Services: This
industry consists of Alternative Carriers, providers of
communications, and high-density data
transmission services. It also includes Integrated
Communication Services, operators of primarily fixed
line telecommunications networks, and companies
providing both wireless and fixed line
communications services not classified elsewhere.
Performance* 1 Year 3 Year 5 Year
Sector 32.70% 4.65% 7.91%
S&P 500 31.50% 15.26% 11.70%
*Annualized Returns
2019 Annual Report 13
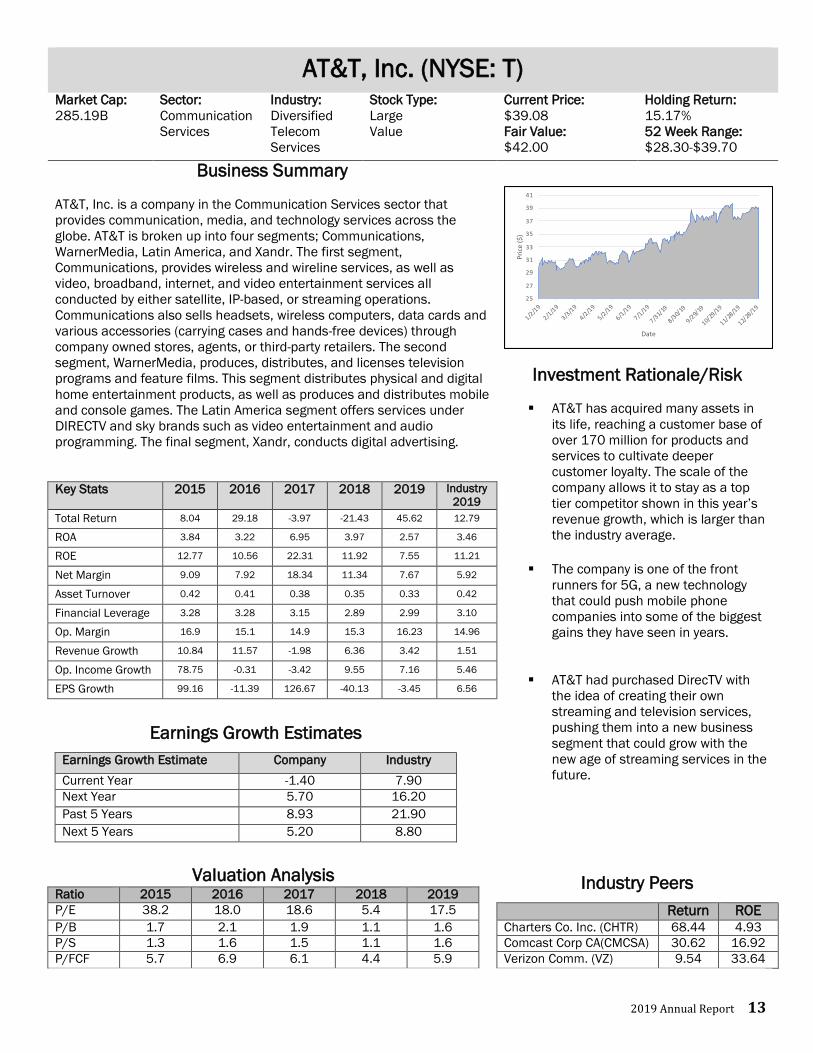
AT&T, Inc. (NYSE: T)
Market Cap:
285.19B
Sector:
Communication
Services
Industry:
Diversified
Telecom
Services
Stock Type:
Large
Value
Current Price:
$39.08
Fair Value:
$42.00
Holding Return:
15.17%
52 Week Range:
$28.30-$39.70
Business Summary
AT&T, Inc. is a company in the Communication Services sector that
provides communication, media, and technology services across the
globe. AT&T is broken up into four segments; Communications,
WarnerMedia, Latin America, and Xandr. The first segment,
Communications, provides wireless and wireline services, as well as
video, broadband, internet, and video entertainment services all
conducted by either satellite, IP-based, or streaming operations.
Communications also sells headsets, wireless computers, data cards and
various accessories (carrying cases and hands-free devices) through
company owned stores, agents, or third-party retailers. The second
segment, WarnerMedia, produces, distributes, and licenses television
programs and feature films. This segment distributes physical and digital
home entertainment products, as well as produces and distributes mobile
and console games. The Latin America segment offers services under
DIRECTV and sky brands such as video entertainment and audio
programming. The final segment, Xandr, conducts digital advertising.
Investment Rationale/Risk
AT&T has acquired many assets in
its life, reaching a customer base of
over 170 million for products and
services to cultivate deeper
customer loyalty. The scale of the
company allows it to stay as a top
tier competitor shown in this year’s
revenue growth, which is larger than
the industry average.
The company is one of the front
runners for 5G, a new technology
that could push mobile phone
companies into some of the biggest
gains they have seen in years.
AT&T had purchased DirecTV with
the idea of creating their own
streaming and television services,
pushing them into a new business
segment that could grow with the
new age of streaming services in the
future.
Key Stats 2015 2016 2017 2018 2019 Industry
2019
Total Return 8.04 29.18 -3.97 -21.43 45.62 12.79
ROA 3.84 3.22 6.95 3.97 2.57 3.46
ROE 12.77 10.56 22.31 11.92 7.55 11.21
Net Margin 9.09 7.92 18.34 11.34 7.67 5.92
Asset Turnover 0.42 0.41 0.38 0.35 0.33 0.42
Financial Leverage 3.28 3.28 3.15 2.89 2.99 3.10
Op. Margin 16.9 15.1 14.9 15.3 16.23 14.96
Revenue Growth 10.84 11.57 -1.98 6.36 3.42 1.51
Op. Income Growth 78.75 -0.31 -3.42 9.55 7.16 5.46
EPS Growth 99.16 -11.39 126.67 -40.13 -3.45 6.56
Earnings Growth Estimates
Earnings Growth Estimate Company Industry
Current Year -1.40 7.90
Next Year 5.70 16.20
Past 5 Years 8.93 21.90
Next 5 Years 5.20 8.80
Valuation Analysis Industry Peers
Ratio 2015 2016 2017 2018 2019
P/E 38.2 18.0 18.6 5.4 17.5 Return ROE P/B 1.7 2.1 1.9 1.1 1.6 Charters Co. Inc. (CHTR) 68.44 4.93
P/S 1.3 1.6 1.5 1.1 1.6 Comcast Corp CA(CMCSA) 30.62 16.92
P/FCF 5.7 6.9 6.1 4.4 5.9 Verizon Comm. (VZ) 9.54 33.64
25
27
29
31
33
35
37
39
41
1/2/1
9
2/1/1
9
3/3/1
9
4/2/1
9
5/2/1
9
6/1/1
9
7/1/1
9
7/31/
19
8/30/
19
9/29/
19
10/29
/19
11/28
/19
12/28
/19
Pri
ce (
$)
Date

Facebook (NASDAQ: FB)
Market Cap:
607.65B
Sector:
Communication
Services
Industry:
Interactive
Media &
Services
Stock Type:
Large
Growth
Current Price:
$205.25
Fair Value:
$220.00
Holding Return:
38.17%
52 Week Range:
$128.56-$208.93
Business Summary
Facebook is the world’s largest social media company with platforms that
extend beyond the Facebook name such as Instagram, Messenger, and
WhatsApp. Facebook has over 2 billion active monthly users, which it
draws back consistently through the platform’s proprietary algorithm of
distributing user content. This algorithm understands and distributes
content based on search history, liked content, connections with other
users and more. The platform’s purpose is to connect people through
written posts, pictures, videos, and messages. In achieving this purpose,
companies pay for advertising placements in coordination with
Facebook’s algorithms to strategically place advertisements in front of
targeted consumers. 90% of Facebooks revenues come from their
advertising business segment.
Investment Rationale/Risk
Facebook is the largest social media
platform, owning many different
popular apps such as Instagram,
Messenger, and WhatsApp.
Facebook’s complex proprietary
algorithms of distribution of user
content promotes daily usage of the
platform, which generates more
value in advertising on the platform.
Facebook’s reach across many
different platforms allows for ad
revenue from multiple different apps
and creates a significant amount of
advertisement sales for the
company.
Key Stats 2015 2016 2017 2018 2019 Industry
2019
Total Return 34.1 9.9 53.4 -25.7 51.66 11.86
ROA 8.2 17.8 21.3 24.3 16.02 13.21
ROE 9.1 19.7 23.8 27.9 19.96 20.21
Net Margin 20.5 36.9 39.2 39.6 26.15 20.85
Asset Turnover 0.40 0.48 0.54 0.61 0.61 0.58
Financial Leverage 1.1 1.1 1.1 1.2 1.32 1.27
Op. Margin 34.7 45.0 49.7 44.6 33.93 23.81
Revenue Growth 43.82 54.16 47.09 37.35 36.76 21.65
Op. Income Growth 24.65 99.63 62.57 23.31 24.51 28.34
EPS Growth 17.27 170.54 54.44 40.45 22.59 -18.48
Earnings Growth Estimates
Earnings Growth Estimate Company Industry
Current Year 28.00 1.80
Next Year 23.60 23.80
Past 5 Years 42.12 12.50
Next 5 Years 14.33 20.30
Valuation Analysis Industry Peers
Ratio 2015 2016 2017 2018 2019
P/E 105.3 44.4 34.2 19.7 32.9 Return ROE P/B 7.2 6.2 7.2 4.7 6.2 Alphabet, Inc. (GOOG) 28.2 18.1
P/S 18.6 13.5 14.3 7.4 8.9 Twitter, Inc. (TWTR) 11.6 18.9
P/FCF 40.3 26.5 24.3 13.1 16.9 Tencent Holdings (TME) -9.5 9.8
120
130
140
150
160
170
180
190
200
210
220
1/2/1
9
2/1/1
9
3/3/1
9
4/2/1
9
5/2/1
9
6/1/1
9
7/1/1
9
7/31/
19
8/30/
19
9/29/
19
10/29
/19
11/28
/19
12/28
/19
Pri
ce (
$)
Date

2019 Annual Report 15
The Walt Disney Co. (NYSE: DIS)
Market Cap:
257.59B
Sector:
Communication
Services
Industry:
Media
Stock Type:
Large
Core
Current Price:
$144.63
Fair Value:
$155.00
Holding Return:
16.69%
52 Week Range:
$105.94-$153.41
Business Summary
The Walt Disney Company, together with its subsidiaries, operates as a
global entertainment company. The company’s Media Networks segment
operates cable programming businesses under ESPN, Disney, and
Freeform brands; broadcast businesses, including ABC TV Network, and
subscription video-on-demand services and in-home entertainment
formats. It’s Parks and Resorts segment owns and operates the Walt
Disney World Resorts in Florida and California. The company also
operates in the Studio Entertainment segment which produces and
acquires live-action and animated motion pictures to be distributed in
theatrical, home entertainment, and television markets. The company
was founded in 1923 and is based in Burbank, California.
Investment Rationale/Risk
Disney’s Park and Resorts segments
have rebounded since the recession,
and they are continuing to look into
international markets for new parks
shown by the Disneyland Shanghai.
Disney has ownership in many
different companies across many
different genres, including Hulu,
ESPN, and Marvel. This allows for
the reach of the company to be
extremely wide and diverse.
Disney+ features a great opportunity
for the company to reach customers
of all ages and expand their share in
the streaming segment
Key Stats 2015 2016 2017 2018 2019 Industry
2019
Total Return 13.02 0.60 4.71 3.59 32.92 15.59
ROA 9.73 10.42 9.56 11.09 6.89 4.97
ROE 18.73 21.39 21.23 23.42 14.81 15.56
Net Margin 15.98 16.88 16.29 18.46 13.81 6.96
Asset Turnover 0.61 0.62 0.59 0.60 0.48 0.43
Financial Leverage 1.98 2.13 2.32 1.99 2.18 2.11
Op. Margin 25.20 25.80 25.20 24.40 17.03 15.47
Revenue Growth 7.48 6.04 -0.89 7.79 7.74 11.47
Op. Income Growth 14.59 8.58 -3.38 6.95 -6.20 3.07
EPS Growth 15.02 16.94 -0.70 46.92 5.04 47.03
Earnings Growth Estimates
Earnings Growth Estimate Company Industry
Current Year -28.80 8.10
Next Year 32.10 37.20
Past 5 Years 5.22 1.50
Next 5 Years 3.20 6.60
Valuation Analysis Industry Peers
Ratio 2015 2016 2017 2018 2019
P/E 18.72 18.23 15.10 15.00 23.07 Return ROE P/B 3.54 3.43 3.37 3.02 2.90 Comcast Corp. (CMCSA) 30.6 16.9
P/S 3.14 2.98 2.97 2.78 3.46 Viacom Inc. (VIAC) -8.1 41.3
P/FCF 11.02 9.12 8.87 7.29 40.27 21st Century FOX (FOXA) -2.6 17.2
95
105
115
125
135
145
155
1/2/1
9
2/1/1
9
3/3/1
9
4/2/1
9
5/2/1
9
6/1/1
9
7/1/1
9
7/31/
19
8/30/
19
9/29/
19
10/29
/19
11/28
/19
12/28
/19
Pri
ce (
$)
Date

CONSUMER DISCRETIONARY-OVERWEIGHT
Sector Overview Household Durables: The Household Durables industry manufactures
products that cannot be consumed immediately and are purchased
infrequently. Some examples would be appliances, and home and
office furnishings.
Hotels, Restaurants and Leisure: This industry contains hotels, fast
food restaurants, resorts, casinos, cruises, and other leisure
activities. Furthermore, hotels and restaurants tend to pursue
franchise business models.
Internet and Catalog Retail: The Internet and Catalog Retail industry
consists of companies who operate through online marketplaces.
This industry has been experiencing rapid growth and has been a
strong point of our portfolio over the past few years as Amazon.com,
Inc. (AMZN) has seen significant growth.
Leisure Products: The Leisure Products industry contains companies
that focus on leisure activities and goods such as outdoor activities,
sporting goods, and toys. This industry is tightly tied to consumers’
discretionary income and confidence. An example of a company
within this industry is Callaway Golf Company (ELY).
Multiline Retail: The Multiline Retail industry includes operators of
department stores and other general merchandise retailers such as
large-scale supercenters that exclude Food and Staples Retailing.
These companies are typically well-known with an example being
Macy’s Inc. (M).
Specialty Retail: The Specialty Retail industry includes retail
companies that specialize in selling specific categories of goods to
consumers. For example, The Home Depot Inc. (HD) sells home
improvement products to consumers.
Textiles, Apparel and Luxury Goods: Companies within this industry,
such as Under Armour, Inc. (UA), manufactures apparel, footwear and
a variety of accessories
The consumer discretionary sector contains eleven
industries of businesses that sell nonessential
products and services where the demand is typically
more elastic. The performance of the sector is
heavily tied to the economic cycle, more specifically,
consumer confidence and discretionary income. As
of recent, the sector is seeing a shift to online
shopping, which helps explains our holdings in the
sector.
Auto Components: The Auto Components industry
consists of companies that supply various auto
parts. The industry is highly competitive and cyclical,
causing demand to fluctuate and high volatility in the
industry’s profitability. The industry is also very
reliant on the ever-changing cost of raw materials
such as copper and steel.
Automobile: The Automobile industry designs,
produces and markets cars, trucks, and other types
of land vehicles. The automobile industry’s demand
is highly sensitive to the economic cycle and is one
of the most capital-intensive industries with high
fixed costs. Because of this, the profit margins within
the industry can be highly volatile.
Diversified Consumer Services: The Diversified
Consumer Services industry consists of companies
that provide specialized services that are not
classified elsewhere. One example of a diversified
consumer service would be H&R Block, Inc. (HRB),
who offers tax services to consumers and
businesses.
Distributors: The Distributor industry includes
distributors and wholesalers of general merchandise
not classified elsewhere, including apparel,
replacement parts, and wholesale electronics.
Performance* 1 Year 3 Year 5 Year
Sector 27.90% 16.61% 13.10%
S&P 500 31.50% 15.26% 11.70%
*Annualized Returns

2019 Annual Report 17
Amazon.com, Inc. (NASDAQ: AMZN)
Market Cap:
920.22B
Sector:
Consumer
Discretionary
Industry:
Internet and
Catalog Retail
Stock Type:
Large
Growth
Current Price:
$1,847.84
Fair Value:
$2,100.00
Holding Return:
208.24%
52 Week Range:
$1,460.93-$2,035.80
Business Summary
Amazon.com, Inc. was founded in 1994 and is headquartered in
Seattle, Washington. Since then, Amazon has become one of the
world’s highest-grossing online retailers, with $280.5 billion in net sales
in 2019. They operate through the following segments: North America,
International, and Amazon Web Services (AWS). It sells general
merchandise and digital media content from third-party sellers through
its online storefront. The company also manufactures and sells
electronic devices such as the Fire Tablet, Fire TV, and Echo devices.
The sale of their general merchandise, digital media content, and fees
collected from third-party sales accounted for 69% of Amazon’s net
revenue in 2019. Additionally, the AWS segment offers cloud space and
cloud computing, and allows for other companies to sell their
merchandise through Amazon. In 2019, AWS became the second
largest business operation of Amazon in terms of revenue, accounting
for 13% of their total revenue. The company also offers Amazon Prime,
a membership program, which provides free shipping, access to
streaming of movies and TV episodes, and other services.
Investment Rationale/Risk
Amazon dominates North American
online retail, and much of the regions’
youth consider it their one-stop-shop
for online retailers.
With more than half of the world’s
Internet users coming from developing
markets, Amazon has sizeable
international growth opportunities for
its marketplaces, advertising, and
hardware assortment in regions like
Europe, Japan, and Southeast Asia.
Amazon’s device portfolio are
intriguing customer acquisition and
retention tools while promoting the
other business segments Amazon
operates through such as the Amazon
Web Services.
Key Stats 2015 2016 2017 2018 2019 Industry
2019
Total Return 117.78 10.95 55.96 28.40 23.03 34.05
ROA 0.99 3.19 2.83 6.85 5.97 5.13
ROE 4.94 14.52 12.91 28.27 21.95 18.63
Net Margin 0.56 1.74 1.71 4.33 4.13 3.83
Asset Turnover 1.78 1.83 1.66 1.58 1.45 1.34
Financial Leverage 4.89 4.32 4.74 3.73 3.63 2.7
Op. Margin 2.10 3.10 2.30 5.30 5.18 5.28
Revenue Growth 20.25 27.08 30.80 30.93 20.45 16.52
Op. Income Growth 1154.49 87.46 -1.91 202.51 17.07 2.11
EPS Growth - 292.00 25.51 227.48 13.44 34.03
Earnings Growth Estimates
Earnings Growth Estimate Company Industry
Current Year 18.90 0.10
Next Year 50.58 26.30
Past 5 Years 112.80 10.20
Next 5 Years 26.00 22.80
Valuation Analysis Industry Peers
Ratio 2015 2016 2017 2018 2019
P/E 951.96 171.60 297.58 84.10 81.87 Return ROE P/B 25.61 20.12 22.96 18.85 16.28 eBay Inc. (EBAY) 30.64 39.03
P/S 3.18 2.83 3.56 3.39 3.50 Alibaba Group Holding LTD(BABA) 54.74 20.42
P/FCF 32.56 24.76 35.32 28.10 26.27 Etsy Inc. (ETSY) -6.87 23.75
1400
1500
1600
1700
1800
1900
2000
2100
1/2/1
9
2/1/1
9
3/3/1
9
4/2/1
9
5/2/1
9
6/1/1
9
7/1/1
9
7/31/
19
8/30/
19
9/29/
19
10/29
/19
11/28
/19
12/28
/19
Pri
ce (
$)
Date

The TJX Companies, Inc. (NYSE: TJX)
Market Cap:
73.47B
Sector:
Consumer
Discretionary
Industry:
Multiline Retail
Stock Type:
Large Core
Current Price:
$61.06
Fair Value:
$73.40
Holding Return:
12.59%
52 Week Range:
$43.80-$61.69
Business Summary
The TJX Companies, Inc. was founded in 1956 and is headquartered in
Framingham, Massachusetts. The company is broken into four segments:
Marmaxx, HomeGoods, TJX Canada, and TJX International. Through these
segments, TJX Companies offers a variety of apparel for the entire family,
including footwear and accessories; home fashions, including home
basics, furniture, decorative accessories, and cookware; jewelry and other
merchandise. The company operates 4,300 stores in 9 different
countries under the names TJ Maxx, Marshalls, HomeGoods, Winners,
HomeSense, T.K. Maxx and Sierra Trading Post. Furthermore, TJK
Companies also operates various e-commerce sites including tjmaxx.com,
tkmaxx.com, and sierratradingpost.com.
Investment Rationale/Risk
TJX Companies’ ability to offer brand
name apparel items at lower costs
than its competitors allows
consumers to continue to buy TJX’s
merchandise even if discretionary
income decreases, while remaining
competitive when discretionary
income increases.
The international and e-commerce
presence that TJX has established
allows for diversification of the
revenue the company receives,
enabling it to be more competitive
and defensive in the retail industry.
TJX’s diversified product range,
affordable pricing, and the various
store brands it operates allows for a
wide range of customers to
continually return to one or more of
the six store brands.
Key Stats 2015 2016 2017 2018 2019 Industry
2019
Total Return 4.57 7.35 3.36 19.97 38.46 30.99
ROA 20.77 20.13 18.85 19.36 21.56 9.97
ROE 52.16 53.15 52.13 54.00 60.01 30.9
Net Margin 7.62 7.36 6.93 7.27 7.85 4.33
Asset Turnover 2.73 2.74 2.72 2.66 2.75 1.45
Financial Leverage 2.61 2.67 2.86 2.73 2.84 1.78
Op. Margin 12.40 11.97 11.60 11.12 10.82 7.52
Revenue Growth 6.04 6.42 7.23 8.08 8.67 8.4
Op. Income Growth 3.65 2.72 3.91 3.58 5.79 -0.98
EPS Growth 7.14 6.34 2.90 16.95 18.36 4.33
Earnings Growth Estimates
Earnings Growth Estimate Company Industry
Current Year 3.00 -1.90
Next Year 10.18 13.50
Past 5 Years 11.40 15.10
Next 5 Years 10.50 10.00
Valuation Analysis Industry Peers
Ratio 2015 2016 2017 2018 2019
P/E 21.62 22.03 20.66 18.34 24.04 Return ROE P/B 10.91 11.31 10.41 10.50 13.26 Macy’s, Inc. (M) -37.84 18.30
P/S 1.61 1.54 1.45 1.46 1.85 Ross Stores, Inc. (ROST) 41.15 49.96
P/FCF 17.19 14.92 14.56 15.86 21.61 Burlington Stores, Inc. (BURL) 40.18 202.5
38
43
48
53
58
63
1/2/1
9
2/1/1
9
3/3/1
9
4/2/1
9
5/2/1
9
6/1/1
9
7/1/1
9
7/31/
19
8/30/
19
9/29/
19
10/29
/19
11/28
/19
12/28
/19
Pri
ce (
$)
Date

2019 Annual Report 19
CONSUMER STAPLES-OVERWEIGHT
Sector Overview
Food & Staples Retailing: The Food and Staples Retailing Industry
in the Consumer Staples Sector includes Drug Retail, Food
Distributors, Food Retail, and Hypermarkets & Super Centers.
Food Products: The Food Products Industry in the Consumer
Staples Sector includes Agricultural Products and Packaged Foods
& Meats.
Household Products: The Household Products Industry in the
Consumer Staples Sector includes producers of non-durable
household products (including detergents, soaps, diapers, and
other tissue and household paper products not classified in the
Paper Products Industry).
Personal Products: The Personal Products Industry in the
Consumer Staples Sector includes manufacturers of personal and
beauty care products (including cosmetics and perfumes).
Tobacco: The Tobacco Industry in the Consumer Staples Sector
includes manufacturers of cigarettes and other tobacco products.
The Consumer Staples Sector tends to perform
relatively well during the late and recessionary
stages of the business cycle. The Consumer Staples
Sector accounts for about 7.21% of the S&P 500
index as of 12/31/2019 (10.57% of the IMP equity
sector). Companies in this sector provide those
goods and services considered essential for typical,
day-to day functions. Given this, competition is
extremely fierce in this sector and companies
compete under cost-leadership and product
differentiation strategies. This sector comprises
many low-price elasticity, red ocean products,
allowing for a very stable (but not remarkable)
growth year-over-year. The following sectors
comprise the Consumer Staples Sector: Beverages,
Food & Staples Retailing, Food Products, Household
Products, Personal Products, and Tobacco.
Beverages: The Beverages Industry in the
Consumer Staples Sector includes Brewers,
Distillers & Vintners, and Soft Drinks.
Performance* 1 Year 3 Year 5 Year
Sector 27.60% 9.88% 8.31% S&P 500 31.50% 15.26% 11.70%
*Annualized Returns

Anheuser-Busch (NYSE: BUD)
Market Cap:
160.75B
Sector:
Consumer
Staples
Industry:
Beverages –
Wineries &
Distilleries
Stock Type:
Large
Value
Current Price:
$82.04
Fair Value:
$70.54
Holding Return:
4.86%
52 Week Range:
$64.98-$102.69
Business Summary
Anheuser-Busch is the world’s largest brewer by volume of alcoholic
beverages, while also producing non-alcoholic beverages. They own over
500 brands (Corona, Stella and Natural Light) and own 28% of the global
market share. The acquisitions of Oriental Brewery and Grupo Modelo
allows them to reach the Asia and Latin America markets. This is an
established company, and its products can be found in almost any bar
around the world. Anheuser-Busch experienced a change in executive
leadership late 2019 and with that brought uncertainty in the direction
the company was going.
Investment Rationale/Risk
Consumer Staples is a non-cyclical
sector that provides stability to a
portfolio through economic
downturn.
Given their wide range in pricing and
large product offering, Anheuser-
Busch’s ability to capture market
share where competitors can’t, helps
them succeed in this industry.
Trends indicate that local firms
dominate niche product categories in
this industry. Given this, Anheuser-
Busch’s acquisition strategy holds
risk of emerging competition to a
minimum.
Government crackdowns and a lull in
demand for alcoholic beverages in
developed areas, are examples of
the risk affecting the industry.
Emerging markets (which are posting
particularly strong performances) are
places were Anheuser-Busch is
gaining market share.
Key Stats 2015 2016 2017 2018 2019 Industry
2019
Total Return 11.29 -15.65 5.80 -41.01 24.66 20.09
ROA 12.12 1.11 6.42 3.71 7.74 9.42
ROE 34.06 4.17 19.54 11.85 22.55 24.44
Net Margin 18.97 2.73 14.17 8.24 17.53 17.42
Asset Turnover 0.27 0.77 0.33 0.24 0.29 0.54
Financial Leverage 0.95 1.40 1.36 1.49 1.15 1.59
Op. Margin 30.99 28.46 30.73 31.13 30.90 22.94
Revenue Growth -8.86 16.56 24.01 -6.03 -1.34 8.60
Op. Income Growth 76.98 -16.32 33.92 -4.80 -2.07 8.02
EPS Growth -111.69 -698.59 460.56 -45.48 108.76 -
Earnings Growth Estimates
Earnings Growth Estimate Company Industry
Current Year -32.4 -11.4
Next Year 35.5 5.0
Past 5 Years -7.0 23.72
Next 5 Years 10.8 3.1
Valuation Analysis Industry Peers
Ratio 2015 2016 2017 2018 2019
P/E 22.23 136.71 26.65 29.78 17.99 Return ROE P/B 3.33 1.94 2.16 1.55 1.64 Diageo (DEO) 18.8 0.0 P/S 4.25 3.65 3.81 2.45 3.13 Brown-Forman (BF.B) 42.1 50.6 P/FCF 14.51 26.92 15.78 11.93 13.85 Ambev S.A (ABEV) 18.9 18.4
55
60
65
70
75
80
85
90
95
100
105
1/2/1
9
2/1/1
9
3/3/1
9
4/2/1
9
5/2/1
9
6/1/1
9
7/1/1
9
7/31/
19
8/30/
19
9/29/
19
10/29
/19
11/28
/19
12/28
/19
Pri
ce (
$)
Date

2019 Annual Report 21
Coca-Cola (NYSE: KO)
Market Cap:
236.91B
Sector:
Consumer
Staples
Industry:
Beverages –
Soft Drinks
Stock Type:
Large
Core
Current Price:
$55.35
Fair Value:
$55.00
Holding Return:
107.95%
52 Week Range:
$44.41-$55.91
Business Summary
The Coca-Cola Company is the largest nonalcoholic beverage company in
the world, with over $30 billion in annual revenue. Its portfolio includes a
variety of carbonated and noncarbonated brands, including Coca-Cola,
Diet Coke, Fanta, Sprite, Minute Maid, PowerAde, and Dasani. The firm
has both concentrate and finished product operations, with concentrate
sales contributing roughly half of its revenues. Trademark Coca-Cola
contributes 45% of unit case volumes worldwide and generates the
majority of its revenue outside of the United States. The company is a
defensive stock during times of downturn. Their brand is highly
recognized, and their product is sold in more than 200 countries
worldwide (58 billion servings consumed per day).
Investment Rationale/Risk
Coca-Cola’s investments in
distribution agreements, including its
relationship with Monster Beverage,
is evidence of the value of its strong
retail relationships; suggesting that
its growth and sales will be stable
into the future and resistant to
downturns in the market.
Sparkling soft drinks account for
more than 60% of the firm's volume
in the U.S., (where per capita soda
consumption has been falling for the
last decade). This represents a
threat to the soft-drink industry.
A large portion of sales stem from
restaurants, bars and similar
venues. This could pose a risk if
these businesses were shut down for
an extended period of time.
Also, with the acquisition of Costa,
there is potential for Coca-Cola to
expand Costa's coffee brands into
the ready-to-drink market and across
a wider range of geographies.
Key Stats 2015 2016 2017 2018 2019 Industry
2019
Total Return 1.75 -3.49 10.66 3.2 16.9 20.09
ROA 8.07 7.36 1.42 7.52 10.5 9.42
ROE 26.31 26.85 6.22 37.79 49.61 24.44
Net Margin 16.60 15.59 3.52 20.20 23.90 17.42
Asset Turnover 0.49 0.47 0.41 0.40 0.44 0.54
Financial Leverage 1.73 1.98 2.79 2.60 2.25 1.59
Op. Margin 23.21 23.40 26.03 29.83 28.26 22.94
Revenue Growth -3.70 -5.31 -15.46 -2.40 9.17 8.60
Op. Income Growth -10.09 -1.17 10.42 18.01 10.21 8.02
EPS Growth 4.38 -10.78 -80.54 417.24 38.00 -
Earnings Growth Estimates
Earnings Growth Estimate Company Industry
Current Year -0.50 -11.4
Next Year 8.10 5.0
Past 5 Years 1.91 23.72
Next 5 Years 5.68 3.1
Valuation Analysis Industry Peers
Ratio 2014 2015 2016 2017 2018
P/E 23.5 27.4 25.1 44.1 64.9 Return ROE P/B 5.5 7.1 6.8 8.8 11.1 PepsiCo Inc (PEP) 23.71 17.59
P/S 4.1 4.2 4.3 5.3 6.3 Keurig Dr Pepper Inc(KDP) 12.91 37.19
P/FCF 17.4 17.2 20.5 24.9 29.4 Monster Beverage Co(MNST) 29.11 30.73
40
42
44
46
48
50
52
54
56
58
1/2/1
9
2/1/1
9
3/3/1
9
4/2/1
9
5/2/1
9
6/1/1
9
7/1/1
9
7/31/
19
8/30/
19
9/29/
19
10/29
/19
11/28
/19
12/28
/19
Pri
ce (
$)
Date
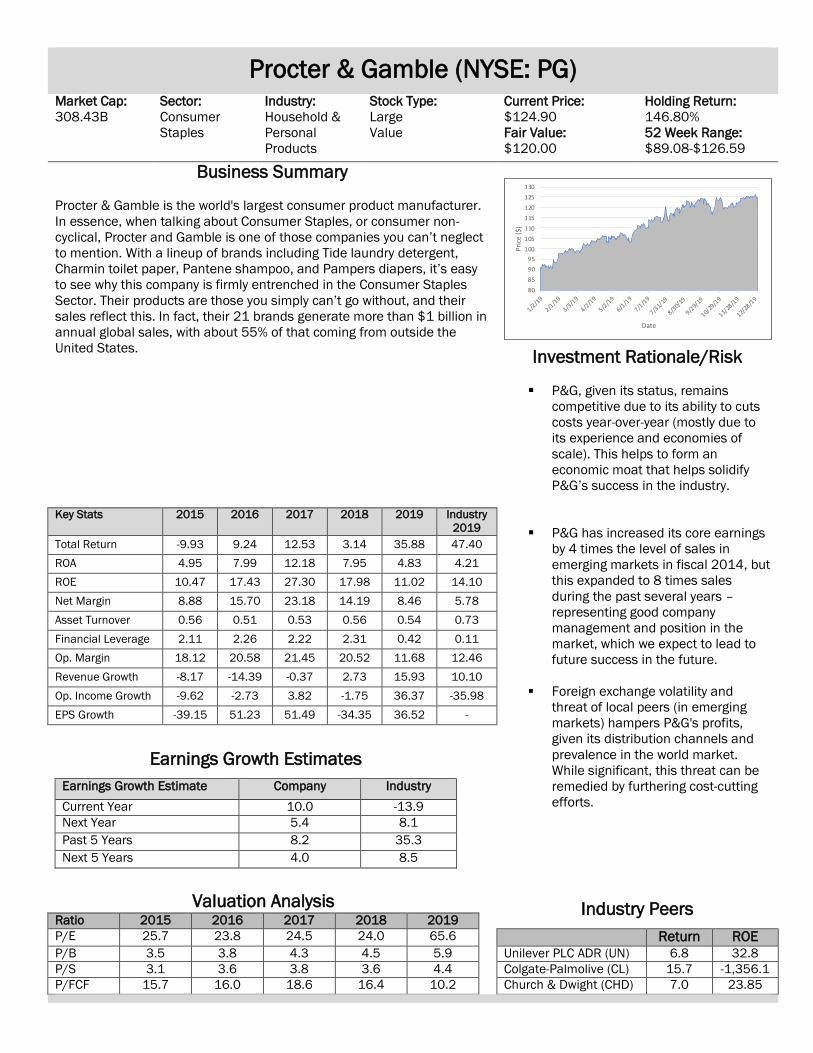
Procter & Gamble (NYSE: PG)
Market Cap:
308.43B
Sector:
Consumer
Staples
Industry:
Household &
Personal
Products
Stock Type:
Large
Value
Current Price:
$124.90
Fair Value:
$120.00
Holding Return:
146.80%
52 Week Range:
$89.08-$126.59
Business Summary
Procter & Gamble is the world's largest consumer product manufacturer.
In essence, when talking about Consumer Staples, or consumer non-
cyclical, Procter and Gamble is one of those companies you can’t neglect
to mention. With a lineup of brands including Tide laundry detergent,
Charmin toilet paper, Pantene shampoo, and Pampers diapers, it’s easy
to see why this company is firmly entrenched in the Consumer Staples
Sector. Their products are those you simply can’t go without, and their
sales reflect this. In fact, their 21 brands generate more than $1 billion in
annual global sales, with about 55% of that coming from outside the
United States.
Investment Rationale/Risk
P&G, given its status, remains
competitive due to its ability to cuts
costs year-over-year (mostly due to
its experience and economies of
scale). This helps to form an
economic moat that helps solidify
P&G’s success in the industry.
P&G has increased its core earnings
by 4 times the level of sales in
emerging markets in fiscal 2014, but
this expanded to 8 times sales
during the past several years –
representing good company
management and position in the
market, which we expect to lead to
future success in the future.
Foreign exchange volatility and
threat of local peers (in emerging
markets) hampers P&G's profits,
given its distribution channels and
prevalence in the world market.
While significant, this threat can be
remedied by furthering cost-cutting
efforts.
Key Stats 2015 2016 2017 2018 2019 Industry
2019
Total Return -9.93 9.24 12.53 3.14 35.88 47.40
ROA 4.95 7.99 12.18 7.95 4.83 4.21
ROE 10.47 17.43 27.30 17.98 11.02 14.10
Net Margin 8.88 15.70 23.18 14.19 8.46 5.78
Asset Turnover 0.56 0.51 0.53 0.56 0.54 0.73
Financial Leverage 2.11 2.26 2.22 2.31 0.42 0.11
Op. Margin 18.12 20.58 21.45 20.52 11.68 12.46
Revenue Growth -8.17 -14.39 -0.37 2.73 15.93 10.10
Op. Income Growth -9.62 -2.73 3.82 -1.75 36.37 -35.98
EPS Growth -39.15 51.23 51.49 -34.35 36.52 -
Earnings Growth Estimates
Earnings Growth Estimate Company Industry
Current Year 10.0 -13.9
Next Year 5.4 8.1
Past 5 Years 8.2 35.3
Next 5 Years 4.0 8.5
Valuation Analysis Industry Peers
Ratio 2015 2016 2017 2018 2019
P/E 25.7 23.8 24.5 24.0 65.6 Return ROE P/B 3.5 3.8 4.3 4.5 5.9 Unilever PLC ADR (UN) 6.8 32.8
P/S 3.1 3.6 3.8 3.6 4.4 Colgate-Palmolive (CL) 15.7 -1,356.1
P/FCF 15.7 16.0 18.6 16.4 10.2 Church & Dwight (CHD) 7.0 23.85
80
85
90
95
100
105
110
115
120
125
130
1/2/1
9
2/1/1
9
3/3/1
9
4/2/1
9
5/2/1
9
6/1/1
9
7/1/1
9
7/31/
19
8/30/
19
9/29/
19
10/29
/19
11/28
/19
12/28
/19
Pri
ce (
$)
Date

2019 Annual Report 23
The Hershey Co. (NYSE:HSY )
Market Cap:
30.69B
Sector:
Consumer
Staples
Industry:
Food
Products
Stock Type:
Large
Value
Current Price:
$146.98
Fair Value:
$150.00
Holding Return:
0.39%
52 Week Range:
$100.80-$162.19
Business Summary
The Hershey Company is a leading confectionary manufacturer that was
founded in 1894 in Derry Township, PA. They control over 45% of the $25
billion domestic chocolate market. Furthermore, they own 80 brands in
80 countries. Their unique taste and product offering creates a loyal
consumer base. Net sales increased every quarter year-over-year in
2019. Revenue continues to grow by about 3% over the past two years as
they expand into different countries. Hershey’s current executive team
has shown the ability to cut cost by moving factories to areas that have
reduced labor cost and expand into markets the company hasn’t had
presence in.
Investment Rationale/Risk
Hershey is a defensive stock in times
of economic downturn. They can be
negatively impacted by such events,
however, the impact tends to be less
significant than other industries and
companies experience.
As the company grows and begins to
expand into foreign nations, taste
and packaging will need to adhere to
cultural differences to remain
competitive.
The implementation of Project Next
Century program (340,000 square
feet addition to their west chocolate
factory) could experience delays and
have more cost than anticipated.
because of this, annual savings
could be less than expected.
Availability of raw materials could
have a negative effect of supply
chain when disrupted, leading to less
than desirable future financial
results.
Key Stats 2015 2016 2017 2018 2019 Industry
2019
Total Return -14.11 15.86 9.75 -5.58 37.13 20.56
ROA 9.25 12.95 14.28 15.56 14.25 4.29
ROE 45.59 84.11 89.85 100.04 69.48 11.03
Net Margin 6.94 9.68 10.42 15.12 14.39 4.74
Asset Turnover 0.50 0.56 0.60 0.60 0.65 0.91
Financial Leverage 1.49 2.84 2.21 2.31 2.02 0.12
Op. Margin 14.04 16.88 17.46 20.84 19.99 6.75
Revenue Growth -1.48 0.73 1.01 3.67 2.51 9.89
Op. Income Growth -23.38 -0.09 4.80 -0.02 1.98 -2.06
EPS Growth -37.69 11.22 9.58 52.46 -2.15 -
Earnings Growth Estimates
Earnings Growth Estimate Company Industry
Current Year 6.7 -10.0
Next Year 5.8 7.0
Past 5 Years 8.8 2.5
Next 5 Years 7.5 5.6
Valuation Analysis Industry Peers
Ratio 2015 2016 2017 2018 2019
P/E 35.59 29.15 29.97 19.08 26.97 Return ROE P/B 17.02 25.04 24.83 15.84 17.55 Tootsie Roll Industries (TR) 2.2 8.8
P/S 2.46 2.83 3.12 2.88 3.88 Simply Good Foods (SMPL) 51.0 3.0
P/FCF 10.13 13.76 12.14 8.04 10.43 HOSTESS BRANDS (TWNK) 32.9 4.0
90
100
110
120
130
140
150
160
170
1/2/1
9
2/1/1
9
3/3/1
9
4/2/1
9
5/2/1
9
6/1/1
9
7/1/1
9
7/31/
19
8/30/
19
9/29/
19
10/29
/19
11/28
/19
12/28
/19
Pri
ce (
$)
Date

ENERGY-UNDERWEIGHT
Sector Overview
Oil, Gas & Consumables: This industry consists of five sub-industries;
integrated oil and gas, oil and gas exploration and production, oil and
gas refining and marketing, oil and gas storage and transportation,
and coal and consumable fuels. The first sub-industry, integrated oil
and gas, consists of companies that conduct exploration and
production of oil and gas and participate in one or more of the
following activities; refining, marketing, transportation, or chemical
manufacturing. The second sub-industry, oil and gas exploration and
production, include the companies that operate by exploring for and
producing oil and gas and do not fall into any of the other sub-
industries. The third sub-industry, oil and gas refining and marketing,
consists of those companies in the sector that refine and market oil
and gas for sale. However, these companies do not necessarily
conduct exploration of oil and gas operations as well as production of
oil and gas. The fourth sub-industry, oil and gas storage and
transportation, is made up of companies that transport/store oil and
gas but do not necessarily produce oil and gas. Pipelines and
shipping services fall into this sub-industry. The fifth sub-industry,
coal and consumable fuels, includes companies that produce and
mine coal, coal related products, as well as other consumable fuels.
This sub-industry does not have companies that produce industrial
gases or mine for coking coal fall within its scope.
The Energy sector is comprised of companies that
produce and refine oil and gas-based products.
Energy companies do not distribute gas as a utility,
rather they conduct drilling, exploration, refinement,
production transportation and storage operations of
gas, oil, and similar consumable fuels. This sector
also includes the manufacturing companies that
produce the drilling equipment for the various
operations conducted in the sector. Energy
securities have historically outperformed the market
in mature stages of the business cycle.
Energy Equipment & Services: This Industry consists
of two sub-industries. The first is, oil and gas drilling.
This sub-industry includes the companies that own
the drills and the contracts for the various drilling
services such as drilling wells. The second sub-
industry is oil and gas equipment and services. This
second sub industry includes the companies that
produce the equipment for the sector. This industry
produces the equipment and services for the
exploration, drilling and production of oil and gas in
the industry. The equipment includes the drills and
rigs for operations of the sector.
Performance* 1 Year 3 Year 5 Year
Sector 11.80% -3.22% -1.84% S&P 500 31.50% 15.26% 11.70%
*Annualized Returns

2019 Annual Report 25
TransCanada Corp. (NYSE:TRP )
Market Cap:
50.03B
Sector:
Energy
Industry:
Oil & Gas
Stock Type:
Large
Growth
Current Price:
$53.31
Fair Value:
$55.00
Holding Return:
24.50%
52 Week Range:
$35.18-$53.95
Business Summary
TransCanada Corp is an energy infrastructure company operating out of
North America. The company conducts operations by utilizing liquids
pipelines, energy segments, U.S. natural gas pipelines, as well as
Canadian and Mexican natural gas pipelines. TransCanada transports
natural gas to power plants, distribution companies, industrial facilities,
interconnecting pipelines, and various other businesses. It owns two
pipelines; one private owned 81,500 kilometers and one partially owned
11,100 kilometers. They also own and manage midstream assets that
provide natural gas producer services. TransCanada operates 10 power
generation facilities powered by natural gas and nuclear fuel. Lastly,
TransCanada Corp owns and operates 118 billion cubic feet of
unregulated natural gas storage, as well as liquid pipelines infrastructure
for the transportation of Alberta crude oil supplies .
Investment Rationale/Risk
TC Energy is pushing forward with
plans to build the Keystone XL
Pipeline, a project to move heavy
crude oil from the tar sands region of
Canada to Nebraska, where it will
then move on to refineries in Illinois
and along the Gulf Coast.
Increasing environmental regulations
could hinder new crude pipeline
production. As these regulations
continue to be created and enacted,
TransCanada Corp could experience
set-backs with their designs of
pipelines, requiring a re-work on
designs for more environmentally
friendly designs in the future.
TC Energy approximately has 95% of
EBITDA being derived from regulated
assets or long-term contracts,
ensuring stable revenue.
Limited Canadian Western natural
gas takeaway capacity could cause
future production growth, as well as
the need for more infrastructure, to
be in jeopardy.
Key Stats 2015 2016 2017 2018 201 Industry
2019
Total Return -30.37 43.77 12.07 -22.31 55.69 -8.35
ROA -2.01 0.16 3.44 3.83 4.01 4.38
ROE -8.06 0.72 15.50 15.25 15.25 10.64
Net Margin -10.97 0.99 22.28 25.87 30.00 -
Asset Turnover 0.18 0.16 0.15 0.15 0.13 -
Financial Leverage 4.63 4.34 4.09 3.90 3.71 -
Op. Margin 31.2 35.5 37.5 45.4 43.65 7.88
Revenue Growth 10.95 10.66 7.55 1.71 -5.33 -3.19
Op. Income Growth 7.26 25.72 13.63 23.06 - -
EPS Growth - - - 14.29 8.93 -20.10
Earnings Growth Estimates
Earnings Growth Estimate Company Industry
Current Year 3.30 2.60
Next Year 14.70 15.80
Past 5 Years 9.18 9.40
Next 5 Years 5.81 7.60
Valuation Analysis Industry Peers
Ratio 2015 2016 2017 2018 2019
P/E 19.1 - 31.3 13.1 16.2 Return ROE P/B 1.9 2.6 2.6 1.9 2.5 Enbridge Inc. (ENB) 28.14 8.87
P/S 2.9 4.3 3.9 3.2 4.6 Pembina Pipeline (PBA) 19.65 10.60
P/FCF 8.7 11.1 9.7 7.4 8.8 Williams Companies
Inc.(WMB) 15.15 6.06
30
35
40
45
50
55
60
1/2/1
9
2/1/1
9
3/3/1
9
4/2/1
9
5/2/1
9
6/1/1
9
7/1/1
9
7/31/
19
8/30/
19
9/29/
19
10/29
/19
11/28
/19
12/28
/19
Pri
ce (
$)
Date

Cheniere Energy, Inc. (NYSE:LNG )
Market Cap:
15.49B
Sector:
Energy
Industry:
Oil & Gas
Stock Type:
Mid
Growth
Current Price:
$61.07
Fair Value:
$71.00
Holding Return:
-4.56%
52 Week Range:
$57.36-$70.59
Business Summary
Cheniere Energy, Inc. is an international energy company headquartered
in Houston, Texas and is the leading producer of liquified natural gas
(LNG) in the United States. They provide clean, secure, and affordable
energy to the world, while responsibly delivering a reliable, competitive,
and integrated source of LNG, in a safe and rewarding work environment.
Cheniere’s operations, construction and development also support
energy and economic development across the United States. Cheniere is
the second largest LNG operator in the world. In February 2016, Cheniere
became the first company to ship LNG from a commercial facility in the
contiguous United States and now delivers to 3 markets worldwide.
Liquified natural gas is produced through a refrigeration process that
drops the temperature of natural gas down to -260 degrees Fahrenheit,
at which point it converts to liquid and its volume shrinks by 600 times,
enabling global transport in LNG carriers. LNG is non-toxic and non-
flammable. When burned, natural gas emits less carbon than coal and oil,
with significantly less traditional air pollutants. Additionally, all mercury is
removed during the LNG process.
Investment Rationale/Risk
Total U.S. LNG export capacity is
expected to rise to 10.0 billion cubic
feet per day by the end of 2020 and
10.7 billion cubic feet per day (bcfd)
by the end of 2021 from the current
8.5 (bcfd).
Cheniere, the nation's biggest
liquified natural gas (LNG) exporter
and biggest consumer of gas,
completed a project, Midship, which
includes nearly 200 miles (322
kilometers) of 36-inch (91-
centimeter) pipe to be put in service
no later than April 2020.
Cheniere serves as a “middleman”
which purchases natural gas and
then sells it in the liquified form.
Cheniere holds long-term contracts
which removes a lot of risk.
The greatest risk facing Cheniere is
the large capacity for expansion. The
expansion has caused the company
to report losses as they continue to
expand, with fear of loss of cost
controls.
Key Stats 2015 2016 2017 2018 2019 Industry
2019
Total Return -47.09 11.22 29.95 9.94 3.18 -8.35
ROA -6.17 -2.86 -1.52 1.57 1.92 4.38
ROE - - - - - 10.64
Net Margin -359.97 -47.54 -7.02 5.90 6.66 -
Asset Turnover 0.02 0.06 0.22 0.27 0.29 -
Financial Leverage - - - - - -
Op. Margin -132.16 3.32 25.23 25.44 24.50 7.88
Revenue Growth - - 336.55 42.6 21.82 -3.19
Op. Income Growth - - - 45.82 16.65 -
EPS Growth -9.99 -10.69 -3.27 3.73 -1.44 -20.10
Earnings Growth Estimates
Earnings Growth Estimate Company Industry
Current Year -4.00 2.60
Next Year 34.90 15.80
Past 5 Years - 9.40
Next 5 Years 9.70 7.60
Valuation Analysis Industry Peers
Ratio 2015 2016 2017 2018 2019 P/E - - - 26.78 15.60 Return ROE P/B - - - - - Southwest Gas Holdings Inc(SWX) -10.39 8.80 P/S 31.44 12.12 2.82 1.95 1.72 New Jersey Resources Corp(NJR) -33.19 10.38 P/FCF - - 15.40 7.79 9.95 Chesapeake Utilities Corp(CPK) -7.57 11.32
50
55
60
65
70
75
1/2/1
9
2/1/1
9
3/3/1
9
4/2/1
9
5/2/1
9
6/1/1
9
7/1/1
9
7/31/
19
8/30/
19
9/29/
19
10/29
/19
11/28
/19
12/28
/19
Pri
ce (
$)
Date

2019 Annual Report 27
FINANCIALS-UNDERWEIGHT
Sector Overview
Consumer Finance: The division of retail banking that deals with lending
money to consumers. This includes wide selection of lines of credit,
such as credit cards, mortgage loans and auto loans. Generally, this type
of bank charges a prime or subprime rate.
Diversified Financial Services: This sector consists of companies that
offer a number of different products and services as to meet the
consumer’s needs. A few services include investment banking, credit
card issuing, and wealth management.
Insurance: An agreement in which an individual or entity acquires a
payment plan which gives them financial protection from unfortunate
events such as financial losses, property and casualty, and liability. The
type of insurance is tied to specific risks which can be costly to the policy
holder. Clients pay a premium for the service and the amount someone
pays depends on the risk level. Interest rates are positively correlated
with insurance company products, meaning that lower rates accounts for
lower sales.
Mortgage REITs: A security vehicle which loans money to owners of real
estate, or individuals who have either acquired an existing mortgage or
mortgage-backed securities. Revenues are produced primarily through
the interest they earn from mortgage loans.
Thrift & Mortgage Finance: These types of financial institutions refer to
credit unions and mutual savings banks who offer saving and loaning
services. The sector differs in the manner that institutions can borrow
funds from the Federal Home Loan Bank System.
In 2019, the financial sector saw a 32.1% return,
which led to investor portfolio earnings increasing
heavily. Rebounding from a poor 2018 return, the
financial sector slightly outperformed the S&P 500.
Additionally, the financial sector does not typically have
a clear pattern when the economy is in the late stage
of its life cycle.
Banks: The banking sector is the section of the
economy devoted to holding financial assets for others,
investing those financial assets as leverage to create
more wealth. It’s also regulated by government
agencies. After the housing market crash in 2008, we
saw tighter restrictions on large banks with the passing
of the Dodd-Frank Act in 2010. Historically, as the
economy enters the late stage of the business cycle,
the banking sector generally performs somewhat
poorly.
Capital Markets: This method of operation pertains to
the activities of gathering funds from parties, then
lending the capital earned to other parties who need
the additional cash flow. The main function is to
optimize the efficiency of transactions and to avoid
needing legal involvement.
Performance* 1 Year 3 Year 5 Year
Sector 32.10% 11.99% 11.18% S&P 500 31.50% 15.26% 11.70%
*Annualized Returns

Bank of America (NYSE: BAC)
Market Cap:
311.21B
Sector:
Financial
Services
Industry:
Banks - Global
Stock Type:
Large
Value
Current Price:
$35.22
Fair Value:
$35.00
Holding Return:
72.50%
52 Week Range:
$24.01-$35.72
Business Summary
Bank of America ranks as one of the top four financial institutions in the
United States, with more than $2.3 trillion in assets. The firm is
segmented into four categories: consumer banking, global banking,
global wealth and investment management, and global markets. Bank of
America's business-to-consumer transactions include deposits,
residential mortgages, credit and debit cards, and small-business
services. The subsidiaries, Merrill Lynch and U.S. Trust private bank,
offers different brokerage and wealth management services to clients.
Looking at their commercial ties, Bank of America incorporates
investment banking, corporate real estate lending, and capital markets
operations.
Investment Rationale/Risk
Bank of America has emphasized
their preparedness for another
economic downturn. The firm has
been updating their risk
management systems and improving
their capital ratios in recent years.
The financial institution has
maintained among the top four
credit card issuers in the United
States and has boosted their
commercial banking services
through their beneficial acquisition
of Merrill Lynch.
Online banking is identified as the
next step for the industry. Digital
competitors are beginning to lure
customers away from the traditional
sense of operations (physical
branches). Bank of America
retention of customers should drop
along with its peers (Wells Fargo,
Chase, BB&T)
Key Stats 2015 2016 2017 2018 2019 Industry
2019
Total Return -4.81 32.80 35.34 -14.70 45.62 29.34
ROA 0.68 0.75 0.74 1.15 1.09 0.68
ROE 6.29 6.82 6.83 10.95 10.73 6.04
Net Margin 17.51 19.38 19.02 29.26 28.49 19.00
Asset Turnover 0.04 0.04 0.04 0.04 0.04 0.04
Financial Leverage 9.17 9.05 9.32 9.69 10.08 7.89
Op. Margin 30.46 34.35 37.33 41.49 25.71 19.73
Revenue Growth -1.05 1.77 4.36 4.46 -0.01 8.66
Op. Income Growth -41.44 24.87 16.75 18.39 -5.29 -40.12
EPS Growth 263.89 14.50 4.00 67.31 5.36 8.50
Earnings Growth Estimates
Earnings Growth Estimate Company Industry
Current Year 4.36 -7.30
Next Year 6.27 7.90
Past 5 Years 26.10 11.40
Next 5 Years 7.00 8.30
Valuation Analysis Industry Peers
Ratio 2015 2016 2017 2018 2019
P/E 12.50 16.00 16.90 11.70 13.00 Return ROE P/B 0.70 0.90 1.20 1.00 1.27 Citigroup Inc. (C) 53.46 10.29
P/S 2.30 3.00 3.70 2.90 3.71 Toronto-Dominion
Bank(TD)
12.59 14.64
P/FCF 10.00 7.70 35.50 5.50 6.74 Wells Fargo & Co.(WFC) 17.01 10.60
20
22
24
26
28
30
32
34
36
38
1/2/1
9
2/1/1
9
3/3/1
9
4/2/1
9
5/2/1
9
6/1/1
9
7/1/1
9
7/31/
19
8/30/
19
9/29/
19
10/29
/19
11/28
/19
12/28
/19
Pri
ce (
$)
Date

2019 Annual Report 29
Capital One Financial Corporation (NYSE: COF )
Market Cap:
46.98B
Sector:
Financial
Services
Industry:
Consumer
Finance
Stock Type:
Large Value
Current Price:
$102.91
Fair Value:
$70.00
Holding Return:
9.24%
52 Week Range:
$74.39-$105.70
Business Summary
Capital One Financial Corporation is a diversified banking company that
treats their consumers as their top priority. They typically operate in
consumer finance, with a focus in local banking and national lending.
Capital One is known for offering personal credit cards, investment
products, loans and online banking services. Located in Virginia, Capital
One’s client based, creative financial solutions have allowed them to
accumulate the eleventh most assets of any bank in the United States.
Investment Rationale/Risk
Upon our purchase of Capital One
Financial Corporation, the company
declared a $0.40/share dividend
payout.
Changes in payment patterns poses
a risk to Captial One, as well as
instability in the financial market.
Both factors greatly affect the
liquidity and profitability of the
company
Amid the recent coronavirus
pandemic, Captial One offered relief
to their credit card holders who are
facing financial hardship. This has
improved their brand image while
also committing to retaining clients
through the recent deprivation
Key Stats 2015 2016 2017 2018 2019 Industry
2019
Total Return -12.56 20.86 14.14 -24.09 36.26 32.85
ROA 1.20 1.02 0.47 1.55 1.36 3.97
ROE 8.39 7.41 3.54 11.37 9.47 26.97
Net Margin 17.10 14.25 6.49 21.01 18.66 29.17
Asset Turnover 0.07 0.07 0.07 0.07 0.07 0.14
Financial Leverage 7.06 7.51 7.50 7.21 6.73 5.79
Op. Margin 23.49 19.93 18.31 22.60 20.36 44.59
Revenue Growth 6.69 7.72 6.49 3.53 2.42 -29.33
Op. Income Growth -10.47 -7.24 0.15 33.25 -6.07 21.99
EPS Growth -8.09 -8.18 -49.35 238.68 -6.51 -16.03
Earnings Growth Estimates
Earnings Growth Estimate Company Industry
Current Year -1.45 1.40
Next Year 8.29 8.90
Past 5 Years 10.10 10.50
Next 5 Years 9.00 11.30
Valuation Analysis Industry Peers
Ratio 2015 2016 2017 2018 2019
P/E 10.15 12.43 13.91 10.20 9.13 Return ROE P/B 0.80 0.87 0.96 0.70 0.81 JP Morgan & Chase (JPM) 42.80 14.07
P/S 2.25 1.80 1.87 1.88 1.36 Discover Financial (DFS) 44.32 25.73
P/FCF 1.54 1.40 1.49 1.34 1.18 American Express (AXP) 31.34 29.80
69
74
79
84
89
94
99
104
109
1/2/1
9
2/1/1
9
3/3/1
9
4/2/1
9
5/2/1
9
6/1/1
9
7/1/1
9
7/31/
19
8/30/
19
9/29/
19
10/29
/19
11/28
/19
12/28
/19
Pri
ce (
$)
Date

Visa, Inc. (NYSE: V)
Market Cap:
416.79B
Sector:
Financial
Services
Industry:
Credit Services
Stock Type:
Large
Growth
Current Price:
$187.90
Fair Value:
$150.00
Holding Return:
187.31%
52 Week Range:
$127.88-$189.89
Business Summary
Visa incorporates a global payment network that links financial
institutions in over 200 countries. Visa’s credit technology has the ability
to notify banks of an electronic payment, then provides an instant
approval/decline decision for the transaction. The firm’s clients include
card-issuing banks, businesses, and consumers, which creates a
network. Visa’s main source of revenue is earned by charging fees to
customers based on both the dollar volume of card activity and the
amount of transactions processed. In addition, the company provides
products such as digital wallets, risk management services, and
tokenization.
Investment Rationale/Risk
Visa has shown strength as it
continues to hold one of the highest
operating margins in the industry.
With their elite knowledge of the
electronic payment marketplace, the
company has begun merging their
separate branches into one global
platform to reduce operating costs.
This will allow the company to
generate a greater return.
Historically, net margins tighten in
the late stage of the business cycle
due to lowered consumer activity.
However, as e-commerce continues
to grow, consumer card usage in
those transactions is likely to ease
the traditional expectation of
tightening margins.
The financial institution has
partnered with some of the largest
retailers in the Asia-Pacific market,
which is expected to boost their
revenues in the future, which in turn
increases total return.
Key Stats 2015 2016 2017 2018 2019 Industry
2019
Total Return 19.07 1.36 47.03 16.49 26.72 32.85
ROA 16.02 11.37 9.80 14.49 17.04 3.97
ROE 22.05 20.79 23.76 35.65 41.83 26.97
Net Margin 45.48 39.31 35.23 48.24 52.57 29.17
Asset Turnover 0.35 0.29 0.28 0.30 0..32 0.14
Financial Leverage 1.35 2.35 2.49 2.43 2.48 5.79
Op. Margin 65.30 64.70 66.20 62.90 67.03 44.59
Revenue Growth 9.27 8.66 21.72 12.26 11.49 -29.33
Op. Income Growth 17.76 7.68 24.43 6.67 15.8 21.99
EPS Growth 19.72 -3.88 12.90 57.94 20.1 -16.03
Earnings Growth Estimates
Earnings Growth Estimate Company Industry
Current Year 6.07 5.60
Next Year 19.24 19.10
Past 5 Years 19.00 12.30
Next 5 Years 14.70 15.00
Valuation Analysis Industry Peers
Ratio 2015 2016 2017 2018 2019
P/E 30.06 31.46 40.72 29.85 35.32 Return ROE P/B 6.24 6.84 9.71 10.48 14.26 eBay Inc. (EBAY) 29.00 29.17
P/S 13.73 12.49 14.88 14.91 18.58 Mastercard Inc. (MA) 57.58 141.43
P/FCF 28.94 33.79 29.66 24.17 33.39 Paypal Holdings Inc.(PYPL) 29.33 15.22
120
130
140
150
160
170
180
190
200
1/2/1
9
2/1/1
9
3/3/1
9
4/2/1
9
5/2/1
9
6/1/1
9
7/1/1
9
7/31/
19
8/30/
19
9/29/
19
10/29
/19
11/28
/19
12/28
/19
Pri
ce (
$)
Date

2019 Annual Report 31
HEALTHCARE-UNDERWEIGHT
Sector Overview The Biotech Industry is a fast-growing industry with increasing
demand for research and development. With that being said, most
biotech companies are forced on partnering with larger firms to
complete product development, due to high costs and little revenues,
in order to remain competitive.
Health Care Equipment and Supplies: The Health Care Equipment
and Supplies industry in the Health Care Sector includes
manufacturers of Health Care equipment, devices, supplies, and
medical products not classified elsewhere.
Health Care Providers and Services: The Health Care Provider and
Services industry includes distributors and wholesalers of healthcare
products not classified within any other industry.
Life Sciences Tools and Services: The Life Sciences Tools and
Services industry includes companies involved in drug discovery,
development, and production continuum by providing analytical tools,
instruments, consumables and supplies, clinical trial services, and
contract research services.
Health Care Technology: The Health Care Technology Industry in the
Health Care Sector, includes companies providing information
technology services primarily to health care providers. It includes
companies providing application, systems and/or data processing
software, internet-based tools, and IT consulting services to doctors,
hospitals or businesses operating primarily in the Health Care Sector.
During an extremely volatile market, Health Care is
one of the top and most consistent performers.
According to the business cycle, Health Care has
consistently outperformed the S&P 500 in the late
and the recessionary stages. The Health Care sector
consists of six industries: Biotechnology, Health Care
Equipment & Supplies, Health Care Providers &
Services, Health Care Technology, Life Sciences
Tools and Services, and Pharmaceuticals.
Pharmaceutical: The Pharmaceutical industry
focuses on companies that take part in the
research, development, and manufacturing of
pharmaceuticals. Current political climates may
create deregulation, allowing pharmaceutical
companies the ability and the chance to have
increased margins and higher revenue streams. The
economy is heading into the late stage within the
business cycle, in which the industry historically
outperforms the S&P 500.
Biotechnology: The Biotechnology Industry in the
Health Care Sector includes companies that are
engaged in research, development, manufacturing,
and/or marketing of products based on genetic
analysis and genetic engineering.
Performance* 1 Year 3 Year 5 Year
Sector 20.80% 16.25% 10.32% S&P 500 31.50% 15.26% 11.70%
*Annualized Returns
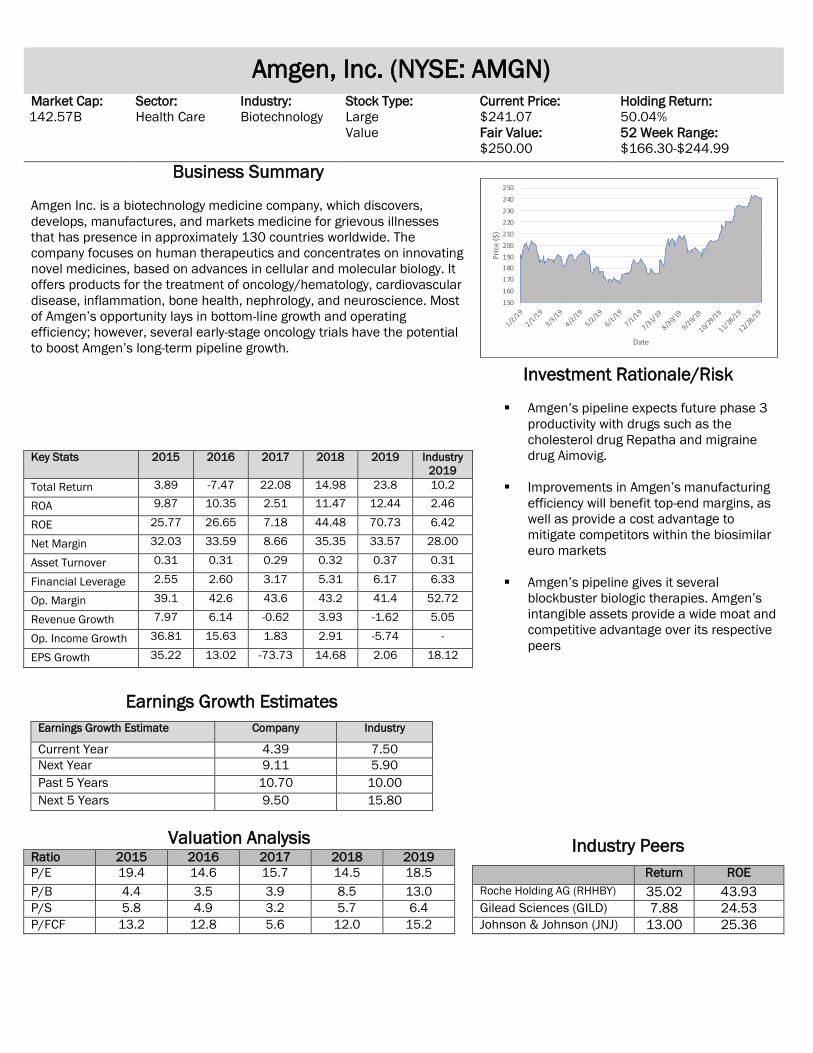
Amgen, Inc. (NYSE: AMGN)
Market Cap:
142.57B
Sector:
Health Care
Industry:
Biotechnology
Stock Type:
Large
Value
Current Price:
$241.07
Fair Value:
$250.00
Holding Return:
50.04%
52 Week Range:
$166.30-$244.99
Business Summary
Amgen Inc. is a biotechnology medicine company, which discovers,
develops, manufactures, and markets medicine for grievous illnesses
that has presence in approximately 130 countries worldwide. The
company focuses on human therapeutics and concentrates on innovating
novel medicines, based on advances in cellular and molecular biology. It
offers products for the treatment of oncology/hematology, cardiovascular
disease, inflammation, bone health, nephrology, and neuroscience. Most
of Amgen’s opportunity lays in bottom-line growth and operating
efficiency; however, several early-stage oncology trials have the potential
to boost Amgen’s long-term pipeline growth.
Investment Rationale/Risk
Amgen’s pipeline expects future phase 3
productivity with drugs such as the
cholesterol drug Repatha and migraine
drug Aimovig.
Improvements in Amgen’s manufacturing
efficiency will benefit top-end margins, as
well as provide a cost advantage to
mitigate competitors within the biosimilar
euro markets
Amgen’s pipeline gives it several
blockbuster biologic therapies. Amgen’s
intangible assets provide a wide moat and
competitive advantage over its respective
peers
Key Stats 2015 2016 2017 2018 2019 Industry
2019
Total Return 3.89 -7.47 22.08 14.98 23.8 10.2
ROA 9.87 10.35 2.51 11.47 12.44 2.46
ROE 25.77 26.65 7.18 44.48 70.73 6.42
Net Margin 32.03 33.59 8.66 35.35 33.57 28.00
Asset Turnover 0.31 0.31 0.29 0.32 0.37 0.31
Financial Leverage 2.55 2.60 3.17 5.31 6.17 6.33
Op. Margin 39.1 42.6 43.6 43.2 41.4 52.72
Revenue Growth 7.97 6.14 -0.62 3.93 -1.62 5.05
Op. Income Growth 36.81 15.63 1.83 2.91 -5.74 -
EPS Growth 35.22 13.02 -73.73 14.68 2.06 18.12
Earnings Growth Estimates
Earnings Growth Estimate Company Industry
Current Year 4.39 7.50 Next Year 9.11 5.90 Past 5 Years 10.70 10.00 Next 5 Years 9.50 15.80
Valuation Analysis Industry Peers
Ratio 2015 2016 2017 2018 2019 P/E 19.4 14.6 15.7 14.5 18.5 Return ROE
P/B 4.4 3.5 3.9 8.5 13.0 Roche Holding AG (RHHBY) 35.02 43.93
P/S 5.8 4.9 3.2 5.7 6.4 Gilead Sciences (GILD) 7.88 24.53
P/FCF 13.2 12.8 5.6 12.0 15.2 Johnson & Johnson (JNJ) 13.00 25.36
150
160
170
180
190
200
210
220
230
240
250
1/2/1
9
2/1/1
9
3/3/1
9
4/2/1
9
5/2/1
9
6/1/1
9
7/1/1
9
7/31/
19
8/30/
19
9/29/
19
10/29
/19
11/28
/19
12/28
/19
Pri
ce (
$)
Date

2019 Annual Report 33
Bristol-Myers Squibb (NYSE: BMY)
Market Cap: 143.02B
Sector: Health Care
Industry: Biopharmaceutic
als
Stock Type: Large Value
Current Price: $64.19 Fair Value: $65.00
Holding Return: 14.83% 52 Week Range: $42.48-$64.75
Business Summary
Bristol-Myers Squibb is one of the leading biopharmacuetical companies
operating in the United States. BMY specializes in producing
biopharmaceuticals, also known as biological medical products or
biologic, which is any pharmaceutical drug product manufactured in,
extracted from, or semi synthesized from biological sources. Bristol-Myers
Squibb operates globally, but more than half of 2019 revenue came from
US biopharmaceutical sales. The main diseases of concern for Bristol-
Myers Squibb in which they produce biologics are hematology, oncology,
immunology, cardiovascular disease, and fibrotic disease. Throughout
2019 Bristol-Myers Squibb has amassed more than $26 Billion in
revenue through their expansive distribution channels for new biologic
drugs.
Investment Rationale/Risk
Bristol-Myers Squibb’s acquisition of
Celgene in November of 2019 was
initiated with the goal of creating a
leading biopharmaceuticals company. The
acquisition intends to increase BMY’s
distribution channels for their top
performing drug industries.
Bristol-Myers Squibb’s top performing
drugs, Eliquis and Opdivo, accounted for
$15 billion in revenue in 2019. BMY looks
to expand on the success of their top
performers, which treat common diseases
such as blood clotting and lung cancer.
A major risk factor to Bristol-Myers Squibb
and its biopharmaceutical developments
is loss of exclusivity (LOE). For BMY’s top
performers, Eliqis and Opdivo, their LOE in
the United States is not until 2026 and
2028 respectively, with other drugs LOE
not arriving until as distant as 2029.
Key Stats 2015 2016 2017 2018 2019 Industry
2019
Total Return 19.24 -13.50 7.72 -12.91 27.86 13.79
ROA 4.78 13.62 2.99 14.36 4.17 5.44
ROE 10.75 29.28 7.21 38.18 10.48 14.58
Net Margin 9.45 22.94 4.85 21.81 13.15 14.22
Asset Turnover 0.51 0.59 0.62 0.66 0.32 0.43
Financial Leverage 2.23 2.08 2.86 2.49 2.52 1.68
Op. Margin 10.40 23.40 16.60 22.70 22.60 16.60
Revenue Growth 4.29 17.31 6.94 8.59 15.89 3.03
Op. Income Growth 0.93 162.37 -23.99 48.35 15.53 31.09
EPS Growth -22.50 184.95 -76.98 393.44 -33.22 0.61
Earnings Growth Estimates
Earnings Growth Estimate Company Industry
Current Year 30.28 6.70 Next Year 19.31 5.90 Past 5 Years 19.60 8.70 Next 5 Years 7.40 7.60
Valuation Analysis Industry Peers
Ratio 2015 2016 2017 2018 2019 P/E 64.9 29.2 24.0 58.4 18.6 Return ROE
P/B 7.6 6.2 6.7 6.2 8.1 AstraZeneca PLC (AZN) 35.65 10.43
P/S 7.0 5.3 5.0 3.9 4.4 Eli Lilly & Co. (LLY) 16.15 133.8
P/FCF 64.3 48.3 18.9 18.4 12.4 Merck & Co Inc. (MRK) 22.26 37.42
36
41
46
51
56
61
66
1/2/1
9
2/1/1
9
3/3/1
9
4/2/1
9
5/2/1
9
6/1/1
9
7/1/1
9
7/31/
19
8/30/
19
9/29/
19
10/29
/19
11/28
/19
12/28
/19
Pri
ce (
$)
Date

Cerner Corp. (NYSE: CERN)
Market Cap:
22.82B
Sector:
Health Care
Industry:
Health Care
Technology
Stock Type:
Large
Growth
Current Price:
$73.39
Fair Value:
$70.00
Holding Return:
26.06%
52 Week Range:
$50.50-$76.47
Business Summary
Cerner Corp. designs, develops, markets, installs, hosts, and supports
health care information technology, health care devices, hardware, and
content solutions for health care organizations and consumers. It also
provides value-added services, including implementation and training,
remote hosting, operational management services, revenue cycle
services, support, and maintenance, health care data analysis, clinical
process optimization, transaction processing, employer health centers,
employee wellness programs, and third party administrator services for
employer-based health plans. It operates through Domestic and Global
segments. The Domestic segment includes revenue contributions and
expenditures associated with business activity in the United States. The
Global segment includes revenue contributions and expenditures that are
linked to business activity in many different countries around the world.
Investment Rationale/Risk
High switching cost create a narrow
economic moat for Cerner Corp. by limiting
bargaining power for purchasers.
Cerner Corp. integrates out distributors by
internally creating and developing software,
as well as providing software services.
Increasing complexity and know-how of
Medicare reporting, strong upward trends of
value-based pay reimbursement
arrangements, and compliance/regulation of
medical records all increase demand for
health care information technology.
Any errors or malfunctions within the
software pose a gigantic risk for Cerner Corp.
Additionally, IT Infrastructure and software
bears risk to security and privacy of
information.
Key Stats 2015 2016 2017 2018 2019 Industry
2019
Total Return -6.94 -21.27 42.26 -22.18 40.00 15.65
ROA 10.69 11.37 14.33 9.56 7.78 11.05
ROE 14.51 16.32 19.90 12.97 11.45 27.35
Net Margin 12.19 13.27 16.86 11.74 9.30 20.36
Asset Turnover 0.88 0.86 0.85 0.81 0.84 0.54
Financial Leverage 1.44 1.43 1.35 1.36 1.59 1.31
Op. Margin 17.65 18.99 18.68 14.44 10.60 20.58
Revenue Growth 30.05 8.39 7.21 4.36 6.08 21.83
Op. Income Growth 2.37 16.63 5.43 -19.33 -22.47 10.37
EPS Growth 2.67 20.13 38.92 -26.46 -12.70 3.60
Earnings Growth Estimates
Earnings Growth Estimate Company Industry
Current Year 14.93 9.60
Next Year 12.01 21.70
Past 5 Years 8.40 10.40
Next 5 Years 12.50 12.20
Valuation Analysis Industry Peers
Ratio 2015 2016 2017 2018 2019 P/E 40.7 25.1 33.6 21.1 47.0 Return ROE
P/B 5.4 3.6 4.9 3.4 5.2 McKesson Corp (MCK) 26.73 0.38 P/S 5.1 3.5 4.5 3.3 4.3 Premier Inc. (PINC) 1.42 - P/FCF 25.8 13.9 18.9 12.6 18.6 Veeva Systems Inc. (VEEV) 57.48 21.44
45
50
55
60
65
70
75
80
1/2/1
9
2/1/1
9
3/3/1
9
4/2/1
9
5/2/1
9
6/1/1
9
7/1/1
9
7/31/
19
8/30/
19
9/29/
19
10/29
/19
11/28
/19
12/28
/19
Pri
ce (
$)
Date

2019 Annual Report 35
Johnson & Johnson (JNJ)
Market Cap:
384.00B
Sector:
Health Care
Industry:
Pharmaceutica
ls
Stock Type:
Large
Core
Current Price:
$145.87
Fair Value:
$150.00
Holding Return:
3.30%
52 Week Range:
$125.00-$147.83
Business Summary
Johnson & Johnson is identified as the largest holder of market share in
the healthcare industry. The firm is made up of three different
departments: consumer products, medical devices and diagnostics, and
pharmaceuticals. Johnson & Johnson's drug and device groups equate up
to 80% of sales and is their main driver of cash flows. Looking at the
firm's drug division, it is comprised of the following specialties: cardiology,
immunology, neurology, oncology, pulmonary, and metabolic diseases.
Their device products are primarily directed to orthopedics, surgery tools,
and vision care. The last segment of consumer focuses on beauty, oral
care, baby care, over-the-counter drugs, and women's health. About half
of the firm's total revenue is generated within the United States.
Investment Rationale/Risk
Within the past five years, Johnson &
Johnson has led the drug manufacturing
industry on multiple categories such as ROE,
ROA, and net margin. Members believe these
are attractive features and a reason to hold
onto the stock.
Being the leader in a competitive healthcare
industry, the firm has looked outside the
United States to build a stronger brand
recognition worldwide. The firm currently
operates in 60 countries worldwide and
continues to expand their outreach through
both acquisition and Greenfield investments.
Effective management and resource
allocation has seen the firm consistently
grow their revenue stream each year since
2015 and is widely believed to continue this
trend in the coming years.
Recently the firm has made questionable
acquisitions in terms of Syntheses and
Actelion, which is not expected to create
much value for shareholders as both
companies had a high takeover price relative
to an estimated fair value.
Key Stats 2015 2016 2017 2018 2019 Industry
2019 Total Return 1.05 15.23 24.16 -5.10 13.00 13.79
ROA 11.65 12.05 0.87 9.86 9.73 5.44
ROE 21.87 23.37 1.99 25.51 25.36 14.58
Net Margin 21.99 23.01 1.7 18.75 18.42 14.22
Asset Turnover 0.53 0.52 0.51 0.53 0.53 0.43
Financial Leverage 1.88 2.01 2.61 2.56 2.65 1.68
Op. Margin 25.78 29.40 24.48 24.58 24.50 16.60
Revenue Growth -5.73 2.59 6.34 6.71 0.59 3.03
Op. Income Growth -13.81 17.00 -11.46 7.13 0.15 31.09
EPS Growth -3.86 8.21 -92.07 0 0.36 0.61
Earnings Growth Estimates
Earnings Growth Estimate Company Industry
Current Year 1.50 6.70
Next Year 7.38 5.90
Past 5 Years 8.00 8.70
Next 5 Years 6.30 7.60
Valuation Analysis Industry Peers
Ratio 2015 2016 2017 2018 2019 P/E 19.7 20.2 24.3 24.9 27.8 Return ROE P/B 4.0 4.3 5.1 5.3 6.6 Roche Holding AG (RHHBY) 35.02 43.93
P/S 4.1 4.5 5.2 4.3 4.8 Gilead Sciences (GILD) 7.88 24.53
P/FCF 15.6 19.0 17.8 16.0 16.9 Amgen Corp (AMGN) 23.8 70.73
120
125
130
135
140
145
150
1/2/1
9
2/1/1
9
3/3/1
9
4/2/1
9
5/2/1
9
6/1/1
9
7/1/1
9
7/31/
19
8/30/
19
9/29/
19
10/29
/19
11/28
/19
12/28
/19
Pri
ce (
$)
Date

UnitedHealth Group, Inc. (UNH)
Market Cap:
278.69B
Sector:
Health Care
Industry:
Health Care
Providers and
Services
Stock Type:
Large
Growth
Current Price:
$293.98
Fair Value:
$300.00
Holding Return:
400.99%
52 Week Range:
$208.07-$300.00
Business Summary
UnitedHealth Group is known as the largest private health insurance
provider in the United States. Overall, UnitedHealth has captured the lead
in self-directed, employer-sponsored, and government-backed insurance
plans. With the health insurance giant’s unrivaled scale in managed care,
peers are known to struggle with competing against the firm. Medical
benefits are offered to nearly 50 million members across its international
platform. Along with its insurance assets, United's continued investment
behind its Optum franchises has created a healthcare services titan that
covers everything from medical and pharmaceutical benefits, to providing
outpatient care and analytics to both affiliated and third-party customers.
Investment Rationale/Risk
United's integrated strategy, in the eyes of
IMP, has been successful as the U.S.
healthcare system slowly shifts from a fee-
for-service model to a more aligned with the
value and outcomes produced for patients.
Being the leader across multiple sectors,
such as government- and employer-
sponsored insurance programs, ambulatory
care, and health analytics, the firm's revenue
and cash flow stream is less reliant on a
single source than many other areas of the
industry which sees the firm constantly
spending large amounts of resources to
continually improve each sector.
With the firm’s long record of success,
UnitedHealthcare’s current executive team
ranks among some the top tier of leaders in
healthcare services. The management team
has been known for gaining impressive
strategic foresight and has developed the
business into what it is today.
Key Stats 2015 2016 2017 2018 2019 Industry
2019 Total Return 3.89 -7.47 22.08 14.98 18.00 24.57
ROA 9.87 10.35 2.51 11.47 8.49 3.16
ROE 25.77 26.65 7.18 44.48 25.32 15.9
Net Margin 32.03 33.59 8.66 35.35 5.76 5.02
Asset Turnover 0.31 0.31 0.29 0.32 .37 0.63
Financial Leverage 2.55 2.60 3.17 5.31 3.02 -
Op. Margin 39.10 42.60 43.60 43.22 7.4 7.01
Revenue Growth 7.97 6.14 -0.62 3.93 6.85 30.94
Op. Income Growth 36.81 15.63 1.83 2.91 11.47 91.99
EPS Growth 35.22 13.02 -73.73 369.15 17.56 -
Earnings Growth Estimates
Earnings Growth Estimate Company Industry
Current Year 9.66 10.30 Next Year 14.36 16.20 Past 5 Years 20.50 18.50 Next 5 Years 12.80 13.20
Valuation Analysis Industry Peers
Ratio 2015 2016 2017 2018 2019
P/E 18.7 23.6 25.1 19.5 21.4 Return ROE
P/B 3.4 4 4.7 4.8 5.1 Cigna (CI) 7.70 11.82
P/S 0.8 0.9 1.1 1.1 1.2 CVS Health Group (CVS) 17.26 10.87
P/FCF 13.2 10.5 14.6 22.9 19.5 Anthem Inc. (ANTM) 16.33 15.95
195
215
235
255
275
295
315
1/2/1
9
2/1/1
9
3/3/1
9
4/2/1
9
5/2/1
9
6/1/1
9
7/1/1
9
7/31/
19
8/30/
19
9/29/
19
10/29
/19
11/28
/19
12/28
/19
Pri
ce (
$)
Date

2019 Annual Report 37
INDUSTRIALS-UNDERWEIGHT
Sector Overview Building Materials: The Building Products industry produces building
components, home improvement products, and equipment.
Commercial Services & Supplies: This industry includes companies
providing commercial printing, environmental and facilities services,
office services and supplies, diversified support service, and security
and alarm services.
Construction & Engineering: The Construction & Engineering industry
engages mainly in non-residential construction.
Electrical Equipment: This industry includes companies that produce
electric cables, electrical components or equipment, and
manufacturers of power-generating equipment and other heavy
electrical equipment.
Diversified Industrials: This industry includes diversified industrial
companies with business activities in three or more sectors, none of
which contributes most revenues.
Machinery: The Machinery industry includes manufacturers of
construction, farm and industrial machinery, and heavy trucks.
Marine: The Marine industry include companies providing goods and
passenger maritime transportation.
Historically, the Industrial sector does not have
strong growth in the late stage and underperforms in
the recession stage. As consumers spend less and
save more, this sector stagnates because these
companies do not expand. The Industrials Sector
has a market cap of $3.41 trillion, which consists of
fourteen industries: Aerospace & Defense, Air
Freight & Logistics, Airlines, Building Products,
Commercial Services & Supplies, Construction &
Engineering, Electrical Engagement, Industrial
Conglomerates, Machinery, Marine, Professional
Services, Road & Rail, Trading Companies &
Distributors, and Transportation Infrastructure.
Aerospace & Defense: The Aerospace & Defense
Industry includes manufacturers of civil or military
aerospace and defense equipment, parts, or
products. Historically, this is one of the stronger
performing industries in the Industrial sector.
Air Freight & Logistics: The Air Freight and Logistics
industry includes companies providing air freight
transportation, as well as courier and logistics
services.
Airlines: The Airlines industry includes companies
offering mainly passenger air transportation.
Trading Companies & Distributers: This industry
includes trading companies and other distributors of
individual equipment and products.
Performance* 1 Year 3 Year 5 Year
Sector 29.40% 10.73% 9.49% S&P 500 31.50% 15.26% 11.70%
*Annualized Returns

Honeywell International, Inc. (NYSE: HON)
Market Cap:
125.86B
Sector:
Industrials
Industry:
Specialty
Industrial
Machinery
Stock Type:
Large Value
Current Price:
$177.00
Fair Value:
$200.00
Holding Return:
-2.55%
52 Week Range:
$129.07-$183.11
Business Summary
Honeywell International, Inc. operates as a diversified technology and
manufacturing company worldwide. The company has operations in the
United States, Europe, Canada, Asia and Latin America. Today, it operates
through four business segments-aerospace, building technologies,
performance materials and technologies, and safety and productivity
solutions. The company is a global leader in refrigerants, aerosols, and
foam-insulation blowing agents that are used to replace ozone-depleting
Chlorofluorocarbon and Hydro Chlorofluorocarbons. These products also
improve the energy efficiency of homes, appliances, and commercial
refrigeration systems
Investment Rationale/Risk
Tariffs, threaten Honeywell’s supply
chain and can impact its cost inputs.
Aerospace segment can have a long
downturn period depending on the
demand for air travel.
Honeywell’s business is split 60/40
between opex and capital
expenditure cycles so they do not
worry as much about the macro
environment.
Rapid changes in technology can
affect the safety and productivity
segment of Honeywell Inc. by
causing diminished returns on
capital projects.
Key Stats 2015 2016 2017 2018 2019 Industry
2019
Total Return 5.80 14.74 34.74 -8.61 36.51 8.34
ROA 10.06 9.30 2.92 11.55 10.55 8.07
ROE 26.53 25.54 9.03 38.16 33.50 20.58
Net Margin 12.36 12.24 4.08 16.18 16.73 10.20
Asset Turnover 0.81 0.76 0.71 0.71 0.63 0.78
Financial Leverage 2.70 2.80 3.44 3.18 3.17 1.55
Op. Margin 17.70 17.00 17.64 16.04 18.66 12.18
Revenue Growth -4.28 1.87 3.13 3.13 -12.18 1.37
Op. Income Growth 17.10 -2.12 7.00 -6.24 2.18 7.98
EPS Growth 13.32 2.65 -65.48 319.63 -6.35 7.25
Earnings Growth Estimates
Earnings Growth Estimate Company Industry
Current Year -1.10 -2.00
Next Year 6.44 12.50
Past 5 Years 8.00 8.10
Next 5 Years 8.20 8.70
Valuation Analysis Industry Peers
Ratio 2015 2016 2017 2018 2019
P/E 18.1 18.1 23.2 37.2 20.7 Return ROE
P/B 4.5 4.6 5.5 5.3 7.0 Carlisle Companies
Inc.(CSL)
62.79 18.05
P/S 2.1 2.3 3.0 2.3 3.5 Danaher Corp (DHR) 49.50 10.58
P/FCF 15.6 16.8 20.3 14.2 22.2 ITT Inc. (ITT) 54.34 16.68
120
130
140
150
160
170
180
190
1/2/1
9
2/1/1
9
3/3/1
9
4/2/1
9
5/2/1
9
6/1/1
9
7/1/1
9
7/31/
19
8/30/
19
9/29/
19
10/29
/19
11/28
/19
12/28
/19
Pri
ce (
$)
Date

2019 Annual Report 39
Lockheed Martin (NYSE: LMT)
Market Cap:
109.42B
Sector:
Industrials
Industry:
Aerospace &
Defense
Stock Type:
Large Core
Current Price:
$389.38
Fair Value:
$429.00
Holding Return:
43.32%
52 Week Range:
$256.79-$399.95
Business Summary
Lockheed Martin is the largest defense contractor worldwide and is the
market leader in next-generation fighter aircrafts. The company is
involved in the research, design, development, integration, and
sustainment of advanced technology products and services. The company
provides services in cybersecurity, system integration, logistics, and
engineering. The applications of the services are in defense, civil, or
commercial needs. The company has contracts with the Department of
Defense, Foreign Military Sales, and a small amount of sales with U.S.
commercial and other customers. The company operates in 4 segments
including Aeronautics, Missiles and Fire Control, Raury and Mission
Systems, and Space.
Investment Rationale/Risk
Lockheed has a strong hold on the
market due to the F-35 fighter
program and missile exposure. Their
contracts have a strong barrier to entry
against competitors, ensuring future
sustainability.
The defense budget caps will return in
2020, hitting Lockheed’s growth. Even
if investors see growth in the increase
in budget in 2019, this cap in 2020
can halt the company’s rapid growth
providing a slower, lower return for
investors.
The slower production process for F-35
will restrain growth and tougher
contracts will hurt margins. This can
hurt quarterly earnings, but the
company has stressed the goal in
improving operations in making these
products, enabling higher sales and
potential contracts. As of now, this can
be seen as a short term threat for
investors.
Key Stats 2015 2016 2017 2018 2019 Industry
2019
Total Return 15.96 18.22 31.44 -15.89 52.15 7.40
ROA 8.36 10.94 4.24 11.04 13.48 3.82
ROE 110.97 230.12 483.57 1419.4
0
275.60 24.68
Net Margin 7.81 11.22 3.92 9.39 10.42 4.94
Asset Turnover 1.07 0.97 1.08 1.18 1.29 0.77
Financial Leverage 15.86 31.64 31.66 32.19 15.20 5.46
Op. Margin 12.00 11.91 11.60 13.82 14.29 7.81
Revenue Growth 1.17 2.42 8.04 5.32 11.25 -1.09
Op. Income Growth -2.79 2.08 6.7 23.86 15.01 -37.50
EPS Growth 2.23 52.62 -60.61 155.30 24.79 -6.53
Earnings Growth Estimates
Earnings Growth Estimate Company Industry
Current Year 9.89 22.60
Next Year 10.28 9.30
Past 5 Years 14.10 13.20
Next 5 Years 6.90 9.50
Valuation Analysis Industry Peers
Ratio 2015 2016 2017 2018 2019
P/E 19.3 18.8 26.0 24.8 18.5 Return ROE
P/B 23.5 31.1 43.7 78.1 28.1 Boeing Co. (BA) 3.56 -70.76
P/S 1.5 1.5 1.9 1.4 1.9 Airbus SE (EADSY) 52.61 -17.35
P/FCF 19.5 13.2 16.5 31.0 13.8 Raytheon Co (RTN) 43.41 13.80
240
260
280
300
320
340
360
380
400
420
1/2/1
9
2/1/1
9
3/3/1
9
4/2/1
9
5/2/1
9
6/1/1
9
7/1/1
9
7/31/
19
8/30/
19
9/29/
19
10/29
/19
11/28
/19
12/28
/19
Pri
ce (
$)
Date

3M Company (NYSE: MMM)
Market Cap:
101.47B
Sector:
Industrials
Industry:
Specialty
Industrial
Machinery
Stock Type:
Large Value
Current Price:
$176.42
Fair Value:
$186.00
Holding Return:
126.41%
52 Week Range:
$150.58-$219.75
Business Summary
3M Company was founded in 1902 and has its headquarters in
Minnesota. 3M has a global presence in diversified technology and its
product segments are safety, graphics, health care, electronics, energy,
and consumer. 3M has a strong emphasis on product development and
research and development among their segments. Each segment,
utilizing similar technology enabling efficient sharing of business
resources. Most of 3M’s revenues are from outside of the United States.
The company employs 96,163 people.
Investment Rationale/Risk
3M has a strong product portfolio,
adding value to the consumers.
These products are created through
intense research & development,
making it difficult for competitors to
recreate. This is evidence the
company will continue innovating,
remaining a top competitor for the
future.
Historical data shows for every dollar
put into R&D, the company will make
$9, which is much higher compared
to its peers. Historically, the
company also puts more capital into
research and development; if these
trends continue, the competitors will
be forced to play catch up with 3M,
making 3M a strong investment
choice.
The company may show a lack of
growth during the upcoming
recessionary phase since it is an
Industrial security. However, 3M has
products in Health Care to hedge
against this risk. This hedge allows
the stock to potentially grow even in
the market downturns.
Key Stats 2015 2016 2017 2018 2019 Industry
2019
Total Return -5.83 21.49 34.44 -16.74 -4.39 8.34
ROA 15.11 15.39 13.71 14.36 11.26 8.07
ROE 38.95 45.90 44.44 50.09 46.02 20.58
Net Margin 15.96 16.77 15.35 16.33 14.22 10.20
Asset Turnover 0.95 0.92 0.89 0.88 0.79 0.78
Financial Leverage 2.79 3.20 3.29 3.73 4.44 1.55
Op. Margin 22.9 24.0 22.9 20.3 18.9 12.18
Revenue Growth -4.86 -0.55 5.14 3.50 -1.92 1.37
Op. Income Growth -2.65 3.99 0.15 -7.93 -9.01
7.98
EPS Growth 1.20 7.65 -2.82 12.11 -12.15 7.25
Earnings Growth Estimates
Earnings Growth Estimate Company Industry
Current Year -4.84 -2.00
Next Year 7.85 12.50
Past 5 Years 4.50 8.10
Next 5 Years 9.50 8.70
Valuation Analysis Industry Peers
Ratio 2015 2016 2017 2018 2019
P/E 19.5 22.5 26.2 25.5 20.9 Return ROE
P/B 7.5 8.9 11.5 10.7 9.5 Honeywell Int. (HON) 36.51 33.50
P/S 3.2 3.7 4.7 3.5 3.2 Siemens AG ADR (SIEGY) 19.73 11.06
P/FCF 15.5 16.3 21.9 19.2 14.8 General Electric Co (GE) 50.07 -18.35
140
150
160
170
180
190
200
210
220
230
1/2/1
9
2/1/1
9
3/3/1
9
4/2/1
9
5/2/1
9
6/1/1
9
7/1/1
9
7/31/
19
8/30/
19
9/29/
19
10/29
/19
11/28
/19
12/28
/19
Pri
ce (
$)
Date

2019 Annual Report 41
INFORMATION TECHNOLOGY-OVERWEIGHT
Sector Overview
IT Services: The IT Services industry includes providers of information
technology and systems integration services not classified in the data
processing and outsourced services or internet software and services
industries. It includes information technology consulting, information
management services, and providers of commercial electronic data
processing and/or business process outsourcing services such as
back-office automation.
Technology Hardware, Storage & Peripherals: This includes
manufacturers of cell phones, personal computers, servers,
electronic computer components and peripherals. These extend to
data storage components, motherboards, audio and video cards,
monitors, keyboards, printers and other peripherals.
Semiconductors & Equipment: This includes manufacturers of
semiconductors and related products. Semiconductors and their
equipment are used in IT as the essential portions of most electronic
circuits and are commonly made from silicon, hence the name Silicon
Valley.
Software: The software industry includes applications, home systems,
and home entertainment software companies that engage in
developing and producing software designed for specialized
applications for the business and/or consumer market.
Information Technology has emerged over the last
two decades as a high growth innovative area in the
market. Relatively young, IT contains multiple
industries highlighted below which encompass the
various facets that play a role in the global sharing
of information. IT has become a vital piece of sector
allocation even for the S&P 500, which many funds
and investors have traditionally sought to mimic and
compete. Looking back at the Great Recession, IT
was the fastest sector to recover, posting
extraordinary annual returns for the better part of
the last decade.
Communications Equipment: This industry is
comprised of producers of the equipment and
products in communications. These items are
known as Local Area Networks, Wide Area Network,
routers, switchboards, and telephones.
Internet Software & Services: The software and
services industry involves companies that develop
and market internet software and and/or provide
internet services. These services include web
address registration services, database
construction, internet design, online databases, and
interactive services.
Performance* 1 Year 3 Year 5 Year
Sector 50.30% 27.65% 20.20% S&P 500 31.50% 15.26% 11.70%
*Annualized Returns

Apple, Inc. (NASDAQ: AAPL)
Market Cap:
1.288T
Sector:
Information
Technology
Industry:
Consumer
Electronics
Stock Type:
Large
Core
Current Price:
$293.65
Fair Value:
$315.00
Holding Return:
1061.33%
52 Week Range:
$142.00-$293.97
Business Summary
Apple Inc. designs consumer electronic devices which consists of
smartphones (IPhone), computers (Mac), tablets (IPad), smartwatches
(Apple Watch), and streaming technology (Apple TV). Apple has also
continued to develop their services to contribute to the diversification of
revenue source. Their services include Apple Pay, iCloud and AppleCare.
Apple integrates devices with software and services to provide one of the
strongest brand ecosystems in the world. Apple has been recognized as a
leading pioneer in the Information Technology sector that shapes
consumer interaction with the latest technological advancements.
Investment Rationale/Risk
Apple has strong brand loyalty
focused around the “Apple
Ecosystem”, which makes entry easy
and exit difficult. This provides
sharper stability in generating cash
flows.
Market saturation for Apple’s
products have been seen recently
with the rapid influx of other
products in the market.
Economic and political turmoil has
become a threat to negatively affect
Apple’s supply chains, and likewise,
their overall revenue stream.
Key Stats 2015 2016 2017 2018 2019 Industry
2019
Total Return -2.08 12.15 48.24 -5.12 88.97 42.54
ROA 20.45 14.93 13.87 16.07 15.69 11.36
ROE 46.25 36.09 36.87 49.36 55.92 55.03
Net Margin 22.58 21.19 21.09 22.41 21.24 15.45
Asset Turnover 0.89 0.70 0.66 0.72 0.74 0.80
Financial Leverage 2.43 2.51 2.80 3.41 3.74 3.95
Op. Margin 30.48 27.84 26.76 26.69 24.57 17.09
Revenue Growth 27.86 -7.73 6.30 15.86 -2.04 0.24
Op. Income Growth 35.67 -15.73 2.20 15.57 11.38 -4.39
EPS Growth 42.95 -9.87 10.83 29.32 -0.17 -1.86
Earnings Growth Estimates
Earnings Growth Estimate Company Industry
Current Year 3.36 8.80
Next Year 24.74 14.60
Past 5 Years 10.70 -1.90
Next 5 Years 10.70 12.60
Valuation Analysis Industry Peers
Ratio 2015 2016 2017 2018 2019
P/E 11.4 13.9 18.4 13.2 24.70 Return ROE P/B 4.89 4.75 6.42 6.96 14.23 Microsoft Corp. (MSFT) 57.57 42.21
P/S 2.61 2.95 3.88 2.97 5.25 Alphabet Inc. (GOOGL) 28.18 18.12
P/FCF 7.5 9.7 14.0 10.2 19.67 Samsung Electronics - 5.46
138
158
178
198
218
238
258
278
298
318
1/2/1
9
2/1/1
9
3/3/1
9
4/2/1
9
5/2/1
9
6/1/1
9
7/1/1
9
7/31/
19
8/30/
19
9/29/
19
10/29
/19
11/28
/19
12/28
/19
Pri
ce (
$)
Date

2019 Annual Report 43
Accenture PLC Class A (NYSE: ACN)
Market Cap:
133.85B
Sector:
Information
Technology
Industry:
IT Services
Stock Type:
Large
Growth
Current Price:
$210.57
Fair Value:
$200.00
Holding Return:
164.73%
52 Week Range:
$135.58-$213.25
Business Summary
Accenture PLC is one of the world’s leading professional services
companies providing services such as management consulting,
technology services, and outsourcing. Accenture operates in North
America, Europe, and Emerging Market countries totaling over 120 total.
Accenture conducts their business with over 80% of Global Fortune 500
companies. This advanced network of insight provides a competitive
advantage in Accenture’s business structure. Though the company’s
business operations and structure classify the company as an
information technology firm, they provide insights and solutions for firms
across all GICS sectors from financials to healthcare. Accenture’s main
practice is to develop industry-specific solutions to enhance and ensure
the efficiency of business practices to produce better results.
Investment Rationale/Risk
Accenture works with primarily
Fortune 500 companies that depend
on Accenture’s services, providing
stable revenue streams for future
years.
Accenture’s dominate market share,
the nature of its services, and the
extensive industry knowledge
needed generates high switching
costs for their competitors.
Outsourcing services, a segment
where ACN is the leader, are
estimated to continue to increase in
future years and is an essential
factor to the company’s outlook on
future revenue growth.
Accenture has proven to deliver on
their clientele’s needs as 97% of
their top revenue generating clients
have been with the company for 10+
years. That figure jumps to 99% for
the past 5 years.
Key Stats 2015 2016 2017 2018 2019 Industry
2019
Total Return 19.4 14.3 32.9 -6.1 51.21 11.88
ROA 16.9 21.2 15.9 17.2 17.62 14.99
ROE 51.5 60.1 41.8 42.0 38.58 34.26
Net Margin 9.3 11.8 9.4 9.8 11.06 12.85
Asset Turnover 1.82 1.79 1.70 1.77 1.59 1.17
Financial Leverage 2.98 2.73 2.54 2.36 2.07 2.59
Op. Margin 13.48 13.82 12.60 14.04 14.59 16.22
Revenue Growth 3.26 5.72 5.66 13.16 3.87 0.00
Op. Income Growth 3.58 8.44 -3.70 26.09 7.94 8.94
EPS Growth 5.31 35.50 -15.66 16.54 16.09 17.89
Earnings Growth Estimates
Earnings Growth Estimate Company Industry
Current Year 2.85 7.80
Next Year 6.61 11.20
Past 5 Years 10.20 8.30
Next 5 Years 10.00 13.00
Valuation Analysis Industry Peers
Ratio 2015 2016 2017 2018 2019
P/E 22.0 17.4 27.1 21.6 28.11 Return ROE
P/B 11.5 10.2 10.7 7.4 8.82 IBM Corp. (IBM) 23.57 50.1
P/S 2.1 2.2 2.7 2.2 3.11 Cognizant Tech. Solutions
(CTSH)
-1.08 16.4
P/FCF 18.5 15.6 20.6 15.2 21.42 Infosys Ltd ADR (INFY) 11.91 22.7
125
135
145
155
165
175
185
195
205
215
225
1/2/1
9
2/1/1
9
3/3/1
9
4/2/1
9
5/2/1
9
6/1/1
9
7/1/1
9
7/31/
19
8/30/
19
9/29/
19
10/29
/19
11/28
/19
12/28
/19
Pri
ce (
$)
Date

Cisco Systems, Inc. (NASDAQ: CSCO)
Market Cap:
203.46B
Sector:
Information
Technology
Industry:
Communication
Equipment
Stock Type:
Large
Value
Current Price:
$47.96
Fair Value:
$49.00
Holding Return:
156.75%
52 Week Range:
$40.95-$58.25
Business Summary
Cisco Systems Inc. is the largest software and hardware supplier in the
networking solutions industry in the world. The company offers
infrastructure platforms of hardware and software for switching, routing,
data center, and wireless applications. In its applications, Cisco offers
collaboration, analytics, and Internet of Things products. Additionally,
their security segment offers Cisco’s firewall and software defined
product, plus hardware to accompany it. Cisco is focused on its software
and services divisions to generate an increase in subscriptions and
recurring sales. While hardware is usually a non-recurring type of sale, it
still accounts for a portion of overall revenue. The company sells its
products directly to customers, as well as through channel partners.
Investment Rationale/Risk
Cisco provides hardware products
that are complimented by various
software and network services
through subscriptions, which provide
re-occurring and steady revenue
streams.
Cisco has historically held roughly
50% of market share in
infrastructure platforms, providing
stable and leading performance for
their top line business performance.
Cisco is challenged by an industry
trend of Cloud-based operations and
declining market share in their
business segments by leading
competitors.
Declining market share for network
services and applications as
consumers start to adopt newer and
more advanced platforms.
Key Stats 2015 2016 2017 2018 2019 Industry
2019
Total Return 0.6 14.9 30.5 15.6 13.82 -14.24
ROA 8.2 9.1 7.6 0.1 11.25 10.7
ROE 15.4 17.4 14.8 0.2 30.27 28.14
Net Margin 18.3 21.8 20.0 0.2 22.39 18.79
Asset Turnover 0.45 0.42 0.38 0.41 0.50 0.57
Financial Leverage 1.9 1.9 2.0 2.5 2.91 1.76
Op. Margin 22.9 26.3 26.5 25.7 28.02 23.61
Revenue Growth 4.28 0.17 -2.52 2.76 5.22 0.98
Op. Income Growth 15.27 14.87 -1.54 -0.49 14.79 4.86
EPS Growth 17.45 20.57 -9.95 -98.95 129.50 6.05
Earnings Growth Estimates
Earnings Growth Estimate Company Industry
Current Year 0.00 10.90
Next Year 3.87 13.00
Past 5 Years 8.40 8.20
Next 5 Years 5.40 8.70
Valuation Analysis Industry Peers
Ratio 2015 2016 2017 2018 2019
P/E 14.5 14.5 20.0 138.9 19.03 Return ROE P/B 2.3 2.4 2.9 4.4 5.91 Nokia Oyj (NOK) -34.92 0.05 P/S 2.8 3.1 4.0 4.1 4.03 Telefonaktiebolaget (ERIC) 0.17 2.62 P/FCF 10.9 11.3 13.6 14.5 13.38 Motorola Solutions Inc. (MSI) 42.19 -
35
40
45
50
55
60
1/2/1
9
2/1/1
9
3/3/1
9
4/2/1
9
5/2/1
9
6/1/1
9
7/1/1
9
7/31/
19
8/30/
19
9/29/
19
10/29
/19
11/28
/19
12/28
/19
Pri
ce (
$)
Date

2019 Annual Report 45
Microsoft Corp. (NASDAQ: MSFT)
Market Cap:
1.200T
Sector:
Information
Technology
Industry:
Software
Stock Type:
Large
Growth
Current Price:
$157.70
Fair Value:
$175.00
Holding Return:
519.40%
52 Week Range:
$97.19-$159.55
Business Summary
Microsoft develops and licenses consumer and enterprise software such
as the Microsoft Office Suite and Windows software. The company
operates within three segments, which are productivity and business
processes (Microsoft Office, Cloud-based Office 365, Exchange,
Sharepoint, Skype, LinkedIn, Dynamics), intelligence cloud infrastructure
and platform as a service offering (Azure, Windows Server OS, SQL
Server) and more personal computing (Windows Client, Xbox, Bing search,
display advertising, Surface laptops/tablets/desktops). Microsoft’s
revenues are split by product and service/other with products accounting
for about 60% of their total revenue. Microsoft has been transitioning
their focus to cloud-based computing which both individuals and
institutions have increased demand for.
Investment Rationale/Risk
Services and subscriptions continue
to increase year over year, which
provides re-occurring sales and
strengthens the stability of the
business structure.
Microsoft’s revenue growth is
expected to nearly double by 2027,
driven by revenue growth inflows
through the development of more
services such as their cloud
computing platform Azure and
several others.
Microsoft holds a competitive
advantage in the computing services
market through its industry leading
Office Suite, which is widely used by
individuals and businesses around
the world.
Poor performing business segments
have the potential to offset revenue
growth and development for
Microsoft’s strong performing
business segments in the future.
Key Stats 2015 2016 2017 2018 2019 Industry
2019
Total Return 22.2 14.7 40.2 20.2 57.6 20.99
ROA 7.0 11.2 11.5 6.5 14.39 11.04
ROE 14.4 27.0 31.9 19.5 42.21 27.27
Net Margin 13.0 22.5 26.4 15.0 31.18 20.33
Asset Turnover 0.54 0.50 0.44 0.43 0.46 0.54
Financial Leverage 2.2 2.7 2.9 3.1 2.80 5.66
Op. Margin 30.1 29.8 30.4 31.8 34.14 20.66
Revenue Growth 7.77 -8.83 5.43 22.69 14.03 8.41
Op. Income Growth 1.03 -24.42 6.29 54.90 22.54 10.36
EPS Growth -43.73 41.89 29.05 -21.40 167.81 15.06
Earnings Growth Estimates
Earnings Growth Estimate Company Industry
Current Year 17.26 2.90
Next Year 11.49 20.40
Past 5 Years 12.40 8.50
Next 5 Years 13.00 14.10
Valuation Analysis Industry Peers
Ratio 2015 2016 2017 2018 2019
P/E 36.8 29.8 30.2 41.8 29.75 Return ROE
P/B 5.7 6.8 7.4 9.1 11.32 Oracle Corp. (ORCL) 19.33 32.52
P/S 5.0 5.8 7.2 6.9 9.40 VMware Inc. (VMW) 10.69 31.46
P/FCF 15.5 13.7 16.6 17.5 23.31 Apple Inc. (AAPL) 88.57 55.92
90
100
110
120
130
140
150
160
170
1/2/1
9
2/1/1
9
3/3/1
9
4/2/1
9
5/2/1
9
6/1/1
9
7/1/1
9
7/31/
19
8/30/
19
9/29/
19
10/29
/19
11/28
/19
12/28
/19
Pri
ce (
$)
Date

NVIDIA Corporation (NASDAQ: NVDA)
Market Cap:
144.00B
Sector:
Information
Technology
Industry:
Semiconductors
& Equipment
Stock Type:
Large
Value
Current Price:
$235.30
Fair Value:
$283.00
Holding Return:
23.67%
52 Week Range:
$127.69-$241.80
Business Summary
NVIDIA is a leading designer and producer of graphics cards, chips, and
computer technology. The application of their products ranges from
gaming PC’s, automotive infotainment systems, and data centers. The
company has ventured into other categories like autonomous driving and
artificial intelligence. The graphics cards and units are also widely desired
and used by “miners” in regards to cryptocurrencies like Bitcoin,
Ethereum and Litecoin. NVIDIA has been said to have technology that is
years ahead of its competitors.
Investment Rationale/Risk
High market share in cloud and
processing technologies will deliver
strong revenue sources for NVIDIA
for years to come.
NVIDIA claims that automotive and
gaming devices are expected to
become their biggest growth drivers
in the future.
Potential decreases in GPU sales. as
well as higher taxes and R&D costs,
can drive down NVIDIA’s
performance.
Economic turmoil in countries such
as China, which account for roughly
to 50% of NVIDIAs’ sales, prove to be
a leading risk factor for future
performance and revenue growth.
Key Stats 2015 2016 2017 2018 2019 Industry
2019
Total Return 67.09 226.9 81.98 -30.82 76.95 18.20
ROA - 8.43 19.36 28.91 33.76 10.83
ROE - 13.82 32.57 46.05 49.26 19.76
Net Margin - 12.26 24.11 31.37 35.34 22.27
Asset Turnover - 0.69 0.80 0.92 0.96 0.54
Financial Leverage - 1.65 1.71 1.50 1.42 2.94
Op. Margin - 17.53 28.03 33.05 32.47 21.89
Revenue Growth - 37.92 40.58 20.61 -6.81 -2.74
Op. Income Growth - 120.62 65.72 18.50 -25.18 -21.92
EPS Growth - 137.96 79.38 31.02 -25.17 -29.09
Earnings Growth Estimates
Earnings Growth Estimate Company Industry
Current Year 22.11 -12.70
Next Year 17.26 13.80
Past 5 Years 34.40 33.50
Next 5 Years 14.70 9.30
Valuation Analysis Industry Peers
Ratio 2015 2016 2017 2018 2019
P/E 30.80 54.74 48.01 17.85 60.18 Return ROE
P/B 3.97 10.81 18.46 8.59 12.84 Advanced Micro Devices
(AMD) 148.4 16.66
P/S 3.80 10.85 13.94 6.74 14.52 Intel Corp (INTC) 30.70 27.58
P/FCF 16.70 45.54 43.68 19.91 34.69 Texas Instrument (TXN) 39.56 56.05
120
140
160
180
200
220
240
260
1/2/1
9
2/1/1
9
3/3/1
9
4/2/1
9
5/2/1
9
6/1/1
9
7/1/1
9
7/31/
19
8/30/
19
9/29/
19
10/29
/19
11/28
/19
12/28
/19
Pri
ce (
$)
Date

2019 Annual Report 47
MATERIALS-OVERWEIGHT
Sector Overview The Construction Materials Industry is expected to experience
growth into 2020 due to the expansion in both domestic and
foreign construction industry, driving demand for construction
materials.
Containers and Packaging: This industry is comprised of
companies which manufacture metal, glass, plastic, paper, and
cardboard containers. The Containers and Packaging Industry
relies heavily on food and beverage, pharmaceutical, and
household items industries to drive sales.
Metals and Mining: The Metals and Mining Industry includes
producers of mining related products as well as companies
specializing in the extraction of base and precious metals.
Paper and Forest Products: Companies that are included in the
Paper and Forest Products Industry are manufactures of timber
and related wood products as well as producers of all grades of
paper. Some companies specializing in paper packaging are
excluded.
As the United States economy moves along the late
stage of the business cycle, the materials Sector
thrives. Historically, the Materials Sector
outperforms the S&P 500 due to the increase in
prices of raw materials during this time. The
Materials Sector has a market cap of $1.81 Trillion
and includes the following industries: Chemicals,
Construction Materials, Containers and Packaging,
Metals and Mining, and Paper and Forest Products.
Chemicals: The Chemicals Industry encompasses
the producers of commodity, fertilizers, diversified,
agricultural, and specialty chemicals. Industrial
gases manufacturers are also included in the
Chemicals Industry.
Construction Materials: The Construction Materials
Industry includes companies involved with the
procurement of raw materials used in construction.
These materials include: clay, cement, concrete,
bricks, and sand.
Performance* 1 Year 3 Year 5 Year
Sector 24.60% 9.58% 7.06% S&P 500 31.50% 15.26% 11.70%
*Annualized Returns

Franco Nevada Corp. (NYSE: FNV)
Market Cap:
19.56B
Sector:
Materials
Industry:
Gold
Stock Type:
Large
Growth
Current Price:
$103.30
Fair Value:
$99.42
Holding Return:
47.50%
52 Week Range:
$67.97-104.87
Business Summary
Franco-Nevada Corp is focused on precious metals royalties and
investments. FNV owns a portfolio of royalty streams and precious metals
that they actively manage to generate revenue. The majority of its
revenue comes from gold, silver, and platinum. FNV helps illiquid mining
companies fund exploration and production projects and takes a claim
(royalty) of an agreed upon amount of metal once ore has been mined.
The success, or failure, of royalty companies is based upon the success
of the projects they fund and the market price of the various
commodities.
Investment Rationale/Risk
Historically, with a maturing business
cycle, commodity prices strengthen.
This presents an opportunity for FNV
to fund more projects and generate
more return on their portfolio of
metal in the short-term. In the long-
term, FNV will be affected by the
availability of development capital.
One key risk associated with royalty
companies is the decline of
production. Since 2000, the amount
of gold ore produced has been
steadily declining, leading to supply
constraints. While this may drive up
the price, if less mines are being
built, FNV and its peers could be in
serious financial distress.
The ROA and ROE figures being so
similar signifies that Franco-Nevada
Corp is not taking on much debt. This
prudent capital structure leads to
increased Current and Quick Ratios,
showing that the firm can remain
liquid in a financial emergency.
Key Stats 2015 2016 2017 2018 2019 Industry
2019
Total Return -6.77 27.56 31.35 -12.05 48.62 11.06
ROA 0.69 3.10 4.32 4.46 6.58 -.29
ROE 0.75 3.34 4.40 4.54 7.06 8.36
Net Margin 5.55 20.03 28.84 31.81 40.71 2.89
Asset Turnover 0.12 0.15 0.15 0.14 .17 .76
Financial Leverage 1.16 1.02 1.02 - 1.04 1.53
Op. Margin 26.24 33.84 34.83 40.05 40.47 -64.10
Revenue Growth 0.45 37.39 10.65 - 29.23 16.11
Op. Income Growth -38.02 77.41 13.85 - 54.91 -43.9
EPS Growth -77.46 337.50 51.43 - 145.83 69.78
Earnings Growth Estimates
Earnings Growth Estimate Company Industry
Current Year 21.98 26.50
Next Year 8.56 18.30
Past 5 Years 17.50 10.50
Next 5 Years 4.00 7.40
Valuation Analysis Industry Peers
Ratio 2015 2016 2017 2018 2019
P/E 130.71 114.92 99.94 61.55 56.45 Return ROE P/B 2.50 2.55 3.19 2.76 3.86 Alamos Gold Inc. (AGI) 5.83 4.81
P/S 16.20 17.78 21.79 19.54 22.98 B2Gold Corp. (BTG) 18.45 13.43
P/FCF 27.25 27.45 29.85 26.10 45.95 Barrick Gold Corp. (GOLD) 13.61 3.80
60
65
70
75
80
85
90
95
100
105
110
1/2/1
9
2/1/1
9
3/3/1
9
4/2/1
9
5/2/1
9
6/1/1
9
7/1/1
9
7/31/
19
8/30/
19
9/29/
19
10/29
/19
11/28
/19
12/28
/19
Pri
ce (
$)
Date

2019 Annual Report 49
Martin Marietta Materials, Inc. (NYSE: MLM)
Market Cap:
17.45B
Sector:
Industrials
Industry:
Building
Materials
Stock Type:
Mid Core
Current Price:
$279.64
Fair Value:
$230
Holding Return:
32.00%
52 Week Range:
$167.62-$281.17
Business Summary
Martin Marietta Materials Inc. is one of the largest producers of
construction aggregates in the United States. Martin Marietta is a natural
resource-based building materials company. The company has a network
of over 300 quarries in 31 states, Canada, and the Bahamas. Martin
Marietta also provides ready mixed concrete, asphalt and paving
services. The company’s building materials are utilized in infrastructure,
nonresidential, and residential construction. The company also operates
a Magnesia Specialties business with production facilities in Michigan
and Ohio. The company was formed in 1993 as a North Carolina
corporation, and since then has completed over 90 smaller acquisitions.
Investment Rationale/Risk
The company’s geographic footprint
is heavy in states that have a high
need and the financial capability for
an increase in road work. This
illustrates the potential for strong
and continued growth into the future.
The company boasts a healthy
balance sheet that allows it to
consider large acquisitions. As
mentioned in the business summary,
it has over 90 successful
acquisitions, allowing the company
to grow in different markets, while
eliminating competitors.
The company’s earnings depend on
volatile outside factors like economic
performance, government budgets,
and lending availability. If the
economic market takes a downturn,
this can be harmful to the growth in
the company and stock.
Key Stats 2015 2016 2017 2018 2019 Industry
2019
Total Return 25.3 63.4 0.6 --21.4 63.9 23.24
ROA 4.1 5.9 8.7 5.1 6.0 4.7
ROE 6.8 10.3 16.1 9.8 11.8 10.6
Net Margin 8.1 11.1 17.9 11.1 12.9 3.8
Asset Turnover 0.50 0.54 0.49 0.46 .48 .86
Financial Leverage 1.7 1.8 1.9 1.9 1.89 1.25
Op. Margin 11.6 12.5 13.5 13.6 12.9 17.11
Revenue Growth 1.17 2.42 8.04 5.32 7.46 7.47
Op. Income Growth 14.1 17.8 17.9 16.6 28.1 -29.39
EPS Growth 58.30 54.55 69.68 33.96 25.90 22.31
Earnings Growth Estimates
Earnings Growth Estimate Company Industry
Current Year 8.52 9.20
Next Year 16.75 24.10
Past 5 Years 21.60 11.90
Next 5 Years 8.50 12.10
Valuation Analysis Industry Peers
Ratio 2015 2016 2017 2018 2019
P/E 33.8 35.0 32.3 14.5 28.7 Return ROE
P/B 2.1 3.4 3.2 2.2 3.3 Summit Materials Inc (SUM) 1.82 8.01
P/S 2.6 3.8 3.5 2.6 3.7 Eagle Materials Inc (EXP) -6.76 1.67
P/FCF 18.5 21.4 20.7 15.9 16.6 Vulcan Materials Co (VMC) 7.17 11.55
155
175
195
215
235
255
275
295
1/2/1
9
2/1/1
9
3/3/1
9
4/2/1
9
5/2/1
9
6/1/1
9
7/1/1
9
7/31/
19
8/30/
19
9/29/
19
10/29
/19
11/28
/19
12/28
/19
Pri
ce (
$)
Date
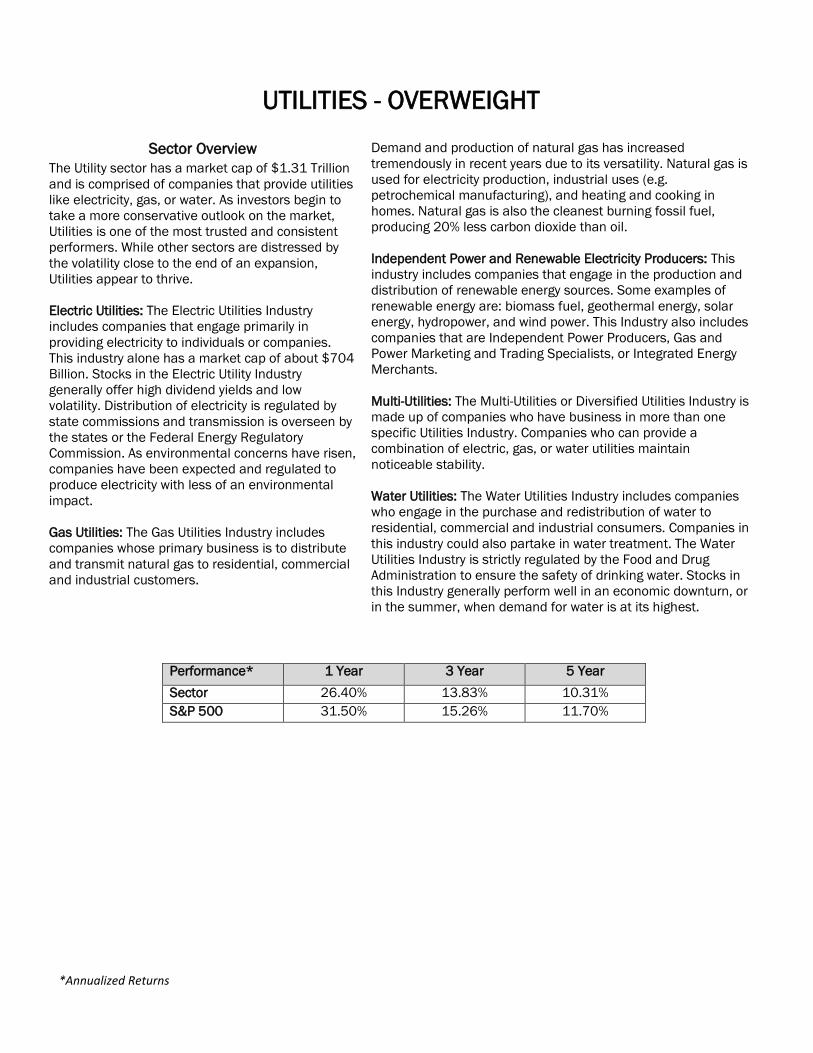
UTILITIES - OVERWEIGHT
Sector Overview Demand and production of natural gas has increased
tremendously in recent years due to its versatility. Natural gas is
used for electricity production, industrial uses (e.g.
petrochemical manufacturing), and heating and cooking in
homes. Natural gas is also the cleanest burning fossil fuel,
producing 20% less carbon dioxide than oil.
Independent Power and Renewable Electricity Producers: This
industry includes companies that engage in the production and
distribution of renewable energy sources. Some examples of
renewable energy are: biomass fuel, geothermal energy, solar
energy, hydropower, and wind power. This Industry also includes
companies that are Independent Power Producers, Gas and
Power Marketing and Trading Specialists, or Integrated Energy
Merchants.
Multi-Utilities: The Multi-Utilities or Diversified Utilities Industry is
made up of companies who have business in more than one
specific Utilities Industry. Companies who can provide a
combination of electric, gas, or water utilities maintain
noticeable stability.
Water Utilities: The Water Utilities Industry includes companies
who engage in the purchase and redistribution of water to
residential, commercial and industrial consumers. Companies in
this industry could also partake in water treatment. The Water
Utilities Industry is strictly regulated by the Food and Drug
Administration to ensure the safety of drinking water. Stocks in
this Industry generally perform well in an economic downturn, or
in the summer, when demand for water is at its highest.
The Utility sector has a market cap of $1.31 Trillion
and is comprised of companies that provide utilities
like electricity, gas, or water. As investors begin to
take a more conservative outlook on the market,
Utilities is one of the most trusted and consistent
performers. While other sectors are distressed by
the volatility close to the end of an expansion,
Utilities appear to thrive.
Electric Utilities: The Electric Utilities Industry
includes companies that engage primarily in
providing electricity to individuals or companies.
This industry alone has a market cap of about $704
Billion. Stocks in the Electric Utility Industry
generally offer high dividend yields and low
volatility. Distribution of electricity is regulated by
state commissions and transmission is overseen by
the states or the Federal Energy Regulatory
Commission. As environmental concerns have risen,
companies have been expected and regulated to
produce electricity with less of an environmental
impact.
Gas Utilities: The Gas Utilities Industry includes
companies whose primary business is to distribute
and transmit natural gas to residential, commercial
and industrial customers.
Performance* 1 Year 3 Year 5 Year
Sector 26.40% 13.83% 10.31% S&P 500 31.50% 15.26% 11.70%
*Annualized Returns

2019 Annual Report 51
Dominion Energy, Inc. (NYSE: D)
Market Cap:
$69.40B
Sector:
Utilities
Industry:
Multi-Utilities
Stock Type:
Large
Value
Current Price:
$82.82
Fair Value:
$80.00
Holding Return:
24.35%
52 Week Range:
$67.41-$83.93
Business Summary
Dominion Energy Inc. was founded in 1909 and is headquartered in
Richmond, Virginia. Dominion operates in 3 segments: Power Generation,
Gas Infrastructure and Southeast Energy. The company has 26,000
megawatts of generating capacity with 6,700 miles of electric
transmission lines and 58,300 miles of electric distribution lines. In
addition, Dominion has 14,800 miles of natural gas transmission with
52,300 miles of natural gas distribution pipelines. It serves over 5 million
utility and retail customers, as well as sells electricity to wholesale
markets.
Investment Rationale/Risk
Dominion Energy has significant
infrastructure in several states and
is currently expanding with the
Atlantic Coast Pipeline. The new
pipeline is expected to increase
revenue.
Dominion’s stock offers a dividend
yield of 5.07% along with a history of
consistent dividend growth.
Dominion has established a wide
economic moat through efficient
scale and conservative strategies.
This secures future revenue growth
and discourages competitors.
Regulation of the natural gas
industry is the primary concern for
Dominion, however, they have
signed long term contracts and
supported constructive regulation to
ensure steady growth
Key Stats 2015 2016 2017 2018 2019 Industry
2019
Total Return -8.67 17.37 9.80 -7.72 13.05
10.43
ROA 3.36 3.26 4.05 3.17 1.48 2.71
ROE 15.68 15.57 18.89 13.14 5.39 9.65
Net Margin 16.25 18.09 23.83 18.31 8.09 10.19
Asset Turnover 0.21 0.18 0.17 0.17 0.18 0.27
Financial Leverage 4.64 4.9 4.47 3.88 3.51 2.05
Op. Margin 30.30 30.9 32.80 27.10 23.46 17.31
Revenue Growth -6.06 -.46 7.23 6.20 23.99 .31
Op. Income Growth 29.95 2.57 13.87 -12.25 7.23 29.49
EPS Growth 42.86 7.50 37.21 -20.76 56.68 16.70
Earnings Growth Estimates
Earnings Growth Estimate Company Industry
Current Year 1.65 4.20
Next Year 5.57 4.40
Past 5 Years 4.70 5.40
Next 5 Years 4.70 6.90
Valuation Analysis Industry Peers
Ratio 2015 2016 2017 2018 2019 P/E 22.50 23.10 24.00 14.80 60.90 Return ROE P/B 3.20 3.20 3.20 2.60 2.51 Exelon Corp. (EXC) 1.90 9.32 P/S 3.30 4.20 4.10 3.50 4.11 Sempra Energy (SRE) 41.21 12.61 P/FCF 8.90 10.60 11.60 10.10 13.32 National Grid PLC (NGG) 29.30 7.69
62
67
72
77
82
87
1/2/1
9
2/1/1
9
3/3/1
9
4/2/1
9
5/2/1
9
6/1/1
9
7/1/1
9
7/31/
19
8/30/
19
9/29/
19
10/29
/19
11/28
/19
12/28
/19
Pri
ce (
$)
Date

Public Service Enterprise Group, Inc. (NYSE: PEG)
Market Cap:
29.76B
Sector:
Utilities
Industry:
Multi-Utilities
Stock Type:
Large
Value
Current Price:
$52.05
Fair Value:
$47.00
Holding Return:
78.87%
52 Week Range:
$49.97 - $63.88
Business Summary
Public Service Enterprise Group Incorporated was incorporated in 1985
and is based in Newark, New Jersey. Through its subsidiaries, the firm
operates as an energy company primarily in the Northeastern and Mid-
Atlantic regions in the United States. It operates through two segments,
PSE&G and PSEG Power. The PSE&G segment transmits electricity;
distributes electricity and gas to residential, commercial, and industrial
customers, as well as invests in solar generation projects, and energy
efficiency and related programs; and offers appliance services and
repairs. PEG has electric transmission and distribution system of 25,000
circuit miles and 858,000 poles. The Power segment operates nuclear,
coal, gas, oil-fired, solar, and renewable generation facilities.
Investment Rationale/Risk
Government regulations pose a risk
to PEG due to possible cost
increases or requiring new
equipment. Increases in these costs
could have a large impact on their
net income and an investors
valuation of PEG’s stock.
Regulation could be a growth
opportunity for PEG through clean
energy projects, like residential solar
installation. PEG is already ahead of
competition in clean energy,
investing in solar energy since 2009.
Clean energy is a growing portion of
PEG’s revenue.
Volatile power and gas market prices
in New Jersey and Long Island can
have a tremendous impact on PEG’s
revenue.
Innovation, customer service and
infrastructure provides PEG with a
substantial competitive advantage in
the Northeast and Mid-Atlantic
Regions. The limited number of
competitors in their geographical
area makes their stock very
dependable.
Key Stats 2015 2016 2017 2018 2019 Industry
2019
Total Return -2.80 17.65 21.29 4.56 15.04 10.43
ROA 4.61 2.29 3.80 3.27 3.64 2.71
ROE 13.30 6.77 11.67 10.19 11.49 9.65
Net Margin 16.12 9.79 17.33 14.83 16.80 1019
Asset Turnover 0.29 0.23 0.22 0.22 0.22 0.27
Financial Leverage 2.87 3.05 3.08 3.15 3.16 2.05
Op. Margin 28.71 17.39 15.73 23.70 23.27 17.31
Revenue Growth -4.33 -13.00 0.25 6.74 3.92 0.31
Op. Income Growth 10.61 -47.17 77.45 -8.64 2.05 29.49
EPS Growth 10.37 -46.97 77.14 -8.71 17.67 16.70
Earnings Growth Estimates
Earnings Growth Estimate Company Industry
Current Year 1.83 4.20
Next Year 3.29 4.40
Past 5 Years 3.60 5.40
Next 5 Years 3.20 6.90
Valuation Analysis Industry Peers
Ratio 2015 2016 2017 2018 2019
P/E 10.60 17.30 50.00 12.00 20.65 Return ROE
P/B 1.50 1.60 2.00 1.80 1.99 National Grid PLC (NGG) 29.30 7.69
P/S 1.80 2.40 2.90 2.80 2.97 Exelon Corp. (EXC) 1.90 9.32
P/FCF 5.10 6.50 8.00 8.70 9.57 Entergy Corp. (ETR) 39.77 13.02
45
47
49
51
53
55
57
59
61
63
65
1/2/1
9
2/1/1
9
3/3/1
9
4/2/1
9
5/2/1
9
6/1/1
9
7/1/1
9
7/31/
19
8/30/
19
9/29/
19
10/29
/19
11/28
/19
12/28
/19
Pri
ce (
$)
Date

2019 Annual Report 53
REAL ESTATE-OVERWEIGHT
Sector Overview Residential Real Estate: The residential segment of the
industry focuses on the buying and selling of properties used
as homes or for non-professional purposes. This segment
heavily relies on housing prices within the market to determine
the health of the segment. Construction of new houses
changes the supply and demand for residential real estate.
Firms that manage rentable properties perform well when
renting is attractive, and supply of rentable units is high.
Industrial Real Estate: The industrial real estate segment
focuses on properties that are used for manufacturing and
production. Some examples are the factories and plants that
are involved in vertical supply chain systems to provide
consumer products to retailers or other manufacturing centers.
Consumer spending and supply chain operating costs affect
this industry the most.
Commercial Real Estate: Commercial real estate segment
consists of the properties that are used for business purposes
such as retail and office spaces. The segment tends to perform
cyclically in relation to the economy.
Real Estate Investment Trusts: REITs invest in a variety of
properties in order to achieve returns that can sustain the
company financially. For REITs, the company must distribute
90% of their taxable income in dividends to their investors.
Other income is invested in the development or acquisition of
properties to ensure higher returns for stockholders. They also
can provide mortgages on various real assets.
The real estate sector made a large comeback
after the Recession of 2008 because properties
gained some of their value back after the
economic downturn. After 2008, GDP increased
and, hence, consumers had more household
income. People slowly began to buy houses
instead of renting. In 2010 and 2011, the sector
saw a 27.1% and 32.3% increase, respectively.
Between 2017 and 2019, there has been minimal
increase due to the stage of the business cycle-the
late stage. Each segment within the industry has
different metrics that are used to gauge the health
of the industry. The segments that lie in the real
estate sector are residential real estate, industrial
real estate and commercial real estate. Real
estate investment trusts are another segment
which can encompass all types of properties.
During the late stages of the business cycle, real
estate performs at an average rate compared to
the S&P 500. With recessionary stages upcoming,
it is important to know that the real estate industry
does not perform well when interest rates rise. As
the cost of borrowing for consumers and real
estate carriers increases, the demand for
mortgages and acquisitions may decline. The
industry becomes very defensive in the late stages
of the business cycle in order to prepare for poor
economic activities or a decrease in GDP. Real
estate investment trusts focus on repositioning
and strengthening their portfolio in these stages.
The real estate industry must maintain a workable
supply to feed demand for rentable units when
unattractive factors are involved, such as rising
interest rates. Development of new properties
continues in the late stages to ensure supply is
adequate and higher returns can be achieved.
Performance* 1 Year 3 Year 5 Year
Sector 29.00% 11.85% 8.66% S&P 500 31.50% 15.26% 11.70%
*Annualized Returns

American Tower Corp. (NYSE: AMT)
Market Cap:
101.78B
Sector:
Real Estate
Industry:
Equity REIT
Stock Type:
Aggressive Growth
Current Price:
$229.82
Fair Value:
$195.58
Holding Return:
125.25%
52 Week Range:
$153.92-$242.00
Business Summary
American Tower Corporation (AMT) is a real estate investment trust
founded in 1995 in Boston, Massachusetts. AMT invests in the global real
estate markets as well as being a large independent operator of wireless
and broadcast communication sites. Through its subsidiaries, AMT owns,
operates, and develops wireless and broadcast communications
properties. The company also leases antenna space on multi-tenant
communication sites to wireless service providers, radio, television
broadcast companies, government agencies, municipalities, and other
tenants in a number of industries.
Investment Rationale/Risk
Concentrates investments in
countries that are in earlier stages of
wireless infrastructure. Invests in
projects that accrue in value as the
infrastructure develops.
Has recurring revenue increases,
high operating leverage, predictable
operating costs, and minimal
nondiscretionary capital
expenditures.
Revenue is reliable due to strong
credit quality of tenants, low tenant
turnover, and growing wireless
adoptions.
Operating leverage is high due to the
availability for tenants to invest in
new towers within their current
leases.
Key Stats 2015 2016 2017 2018 2019 Industry
2019
Total Return 19.25 -5.60 11.43 24.25 47.85 6.11
ROA 2.47 2.94 3.59 3.71 4.72 3.98
ROE 11.22 12.66 17.71 21.20 28.41 11.69
Net Margin 12.47 14.68 17.28 16.49 29.25 13.85
Asset Turnover .20 .20 .21 .22 0.19 0.29
Financial Leverage 4.04 4.57 5.32 6.19 6.14 0.84
Op. Margin 33.80 32.00 30.00 25.6 37.79 14.95
Revenue Growth 16.38 21.25 15.18 11.65 6.67 15.78
Op. Income Growth 8.46 14.90 7.85 -4.67 12.57 -
EPS Growth -29.50 40.43 34.85 3.75 52.71 -23.26
Earnings Growth Estimates
Earnings Growth Estimate Company Industry
Current Year 6.40 -3.40
Next Year 13.50 7.90
Past 5 Years 23.52 2.00
Next 5 Years 21.25 5.60
Valuation Analysis Industry Peers
Ratio 2015 2016 2017 2018 2019
P/E 72.5 52.9 48.9 44.30 56.37 Return ROE P/B 6.2 6.7 11.9 15.0 20.94 Healthpeak Properties (PEAK) 17.01 10.0
P/S 8.9 8.2 9.4 10.8 14.05 Howard Hughes Corp. (HHC) 5.69 2.26
P/FCF 19.1 17.3 29.1 21.5 32.15 Brookfield Properties Inc.
(BPO)
15.50 26.97
145
165
185
205
225
245
265
1/2/1
9
2/1/1
9
3/3/1
9
4/2/1
9
5/2/1
9
6/1/1
9
7/1/1
9
7/31/
19
8/30/
19
9/29/
19
10/29
/19
11/28
/19
12/28
/19
Pri
ce (
$)
Date

2019 Annual Report 55
Healthpeak Properties, Inc.(NYSE: PEAK)
Market Cap:
17.41B
Sector:
Real Estate
Industry:
Equity REIT
Stock Type:
Mid Cap Value
Current Price:
$34.47
Fair Value:
$34.00
Holding Return:
15.20%
52 Week Range:
$26.79-$37.93
Business Summary
Healthpeak Properties, Inc. is a multi-billion dollar healthcare REIT based out
of Irvine, California. The company has been public since 1985 and operates
in segments like senior housing, life sciences, medical offices, and hospitals.
The firm participates in many joint ventures with other strong companies in
order to stay diversified and increase shareholder wealth. In 2008, HCP was
the first healthcare REIT to be selected to the S&P 500 index. The real estate
investment trust’s CEO and President is Thomas M. Herzog.
Investment Rationale/Risk
Operates primarily with healthcare
facilities, which is an industry that
performs well in late stages of the
business cycle.
Persistent dividend distribution aligns
with the goals of the fund.
One tenant and operator accounts for
a significant portion of revenue,
imposing a risk to the company.
As with any REIT, PEAK faces
environmental risk caused by the
chance of a natural disaster(s)
damaging properties.
Key Stats 2015 2016 2017 2018 2019 Industry
2019
Total Return -7.53 -8.95 -7.75 13.68 29.11 6.11
ROA -1.16 4.99 4.11 9.47 1.66 3.98
ROE -5.58 8.42 7.61 18.82 .73 11.69
Net Margin -28.79 27.31 18.73 38.17 2.18 13.85
Asset Turnover 0.09 0.15 0.16 0.22 0.14 0.29
Financial Leverage 2.30 2.84 2.66 2.14 2.31 0.84
Op. Margin 13.14 19.03 27.28 42.16 8.31 14.95
Revenue Growth - -16.31 -13.19 -0.09 8.16 15.78
Op. Income Growth - -45.65 -23.43 -11.98 -26.48 -
EPS Growth - -
210.74 -31.34 143.48 -95.98 -23.26
Earnings Growth Estimates
Earnings Growth Estimate Company Industry
Current Year -1.14 -3.40
Next Year 4.02 7.90
Past 5 Years -10.60 2.00
Next 5 Years 1.80 5.60
Valuation Analysis Industry Peers
Ratio 2015 2016 2017 2018 2019
P/E 76.48 - 22.29 77.58 19.68 Return ROE
P/B 1.75 1.51 2.21 2.63 2.94 Safehold, Inc. (SAFE) - 3.83
P/S 7.12 5.28 6.28 7.10 8.79 MGM Growth Properties (MGP) 24.56 4.42
P/FCF 14.32 10.25 14.32 15.58 19.68 CoreCivic, Inc. (CXW) 4.39 13.31
22
24
26
28
30
32
34
36
38
40
1/2/1
9
2/1/1
9
3/3/1
9
4/2/1
9
5/2/1
9
6/1/1
9
7/1/1
9
7/31/
19
8/30/
19
9/29/
19
10/29
/19
11/28
/19
12/28
/19
Pri
ce (
$)
Date

iShares Core U.S. Aggregate Bond Index ETF (NYSE: AGG)
Sector:
US Fund
Intermediate
Core Bond
Expense:
0.06%
P/E:
-
P/B:
-
ROE:
-
Current Price:
$112.37
Net Asset Value (NAV):
$69.24B
Holding Return:
-0.35%
52 Week Range:
$106.28-$114.30
Exchange Traded Fund (ETF) Overview
The iShares Core U.S. Aggregate Bond ETF (AGG) seeks to
track the performance of the overall U.S. investment-grade
bond market. More specifically, AGG attempts to emulate
the investment results of the Bloomberg Barclay’s U.S.
Aggregate Bond Index. AGG has 7,573 holdings, all of
which are rated BBB or higher, with at least 80% of these
holdings being the exact same securities that are within
the underlying index. The fund’s weighted average
maturity is 7.92 years, making it an intermediate-term
bond fund, and has an effective duration of 5.65.
Sector Allocation (%) Treasury/Agency 44.03
Mortgage-Backed Pass-Through 26.49
Industrial 14.36
Financials 7.64
Commercial Mortgage-Backed 2.21
Investment Rationale/Risk
Tracks the same fixed income benchmark as the
IMP portfolio, putting the IMP portfolio in a better
position to beat our overall benchmark.
Offers broad exposure to U.S. investment-grade
bonds.
Low-cost ETF that can diversify the portfolio and
provide stability and income.
Credit Rating Breakdown (%) AAA Rated 72.00
AA Rated 2.66
A Rated 10.77
BBB Rated 14.19
Cash/Derivatives 0.38
Maturity Breakdown (%)
0-5 Years 50.31
5-10 Years 31.46
10+ Years 17.85
Performance AGG U.S. Agg.
1-Year Return % 8.68 8.72
3-Year Return %
(Ann.)
3.99 4.03
5-Year Return %
(Ann.)
3.00 3.05
102
104
106
108
110
112
114
116
1/2/1
9
2/2/1
9
3/2/1
9
4/2/1
9
5/2/1
9
6/2/1
9
7/2/1
9
8/2/1
9
9/2/1
9
10/2/19
11/2/19
12/2/19
NAV
($)
Date

2019 Annual Report 57
Vanguard Total Bond Market Fund (NYSE: BND)
Sector:
US Fund
Intermediate
Core Bond
Expense:
0.035%
P/E:
-
P/B:
-
ROE:
-
Current Price:
$83.77
Net Asset Value (NAV):
$248.66B
Holding Return:
-0.27%
52 Week Range:
$79.14-$85.30
Exchange Traded Fund (ETF) Overview
The Vanguard Total Bond Market Fund (BND) seeks to
track the performance of the Bloomberg Barclay’s U.S.
Aggregate Float Adjusted Index. BND holds over 8,200
bonds with an average coupon of 3.2% and average
duration of 6.3 years. BND focuses on U.S. investment-
grade bonds with maturity dates less than 10 years, with
an even bigger focus on bonds that will mature in less
than 5 years.
Investment Rationale/Risk
Low volatility helps reduce risk while maintaining
relatively high potential for investment income.
Tracks a similar index compared to the IMP fixed
income benchmark, offering greater potential to
beat our benchmark.
With over half of the fund’s bonds having been
issued by the U.S. Government, the risk of default is
relatively low.
Sector Allocation (%) Asset-Backed 0.4
Commercial Mortgage-Backed 2.2
Finance 8.5
Foreign 4.1
Government Mortgage-Backed 22.3
Industrial 16.5
Treasury/Agency 43.3
Utilities 2.0
Other 0.7
Credit Rating Breakdown (%)
U.S. Government 63.3
AAA Rated 3.7
AA Rated 3.4
A Rated 11.4
BBB Rated 18.2
Maturity Breakdown (%)
0-5 Years 57.6
5-10 Years 22.5
10+ Years 19.9
Performance
BND U.S. Agg.
1-Year Return % 8.71 8.72
3-Year Return %
(Ann.)
4.04 4.03
5-Year Return %
(Ann.)
3.00 3.05
76
77
78
79
80
81
82
83
84
85
86
1/2/1
9
2/1/1
9
3/3/1
9
4/2/1
9
5/2/1
9
6/1/1
9
7/1/1
9
7/31/19
8/30/19
9/29/
19
10/29/19
11/28/19
12/28/1
9
NAV
($)
DATE

SPDR Portfolio Aggregate Bond ETF (NYSE: SPAB)
Sector:
US Fund
Intermediate
Core Bond
Expense:
0.04%
P/E:
-
P/B:
-
ROE:
-
Current Price:
$29.34
Net Asset Value (NAV):
$5.06B
Holding Return:
-0.57%
52 Week Range:
$27.79-$29.92
Exchange Traded Fund (ETF) Overview
The SPDR Portfolio Aggregate Bond ETF (SPAB) seeks to
provide investment results that correspond to the price
and yield of the Bloomberg Barclay’s U.S. Aggregate Bond
Index. The fund has over 5,000 holdings with an average
maturity of 7.67 years and an average coupon of 3.09%.
SPAB has managed to match the performance of its
benchmark in 2019.
Sector Allocation (%) Treasury 38.96
Mortgage Backed Securities (MBS) 26.95
Industrial 15.58
Finance 8.22
Utility 2.07
Commercial MBS 2.06
Investment Rationale/Risk
Out of the IMP’s three fixed income ETFs, SPAB
manages to track the Bloomberg Barclay’s U.S.
Aggregate Bond Index the most efficiently.
One of the lowest cost fixed income ETFs on the
market, making it a cheap option to diversify the
portfolio.
Creates a stable stream of income for the portfolio.
Credit Rating Breakdown (%) AAA Rated 71.53
AA Rated 3.06
A Rated 10.68
BBB Rated 14.74
Maturity Breakdown (%)
0-5 Years 52.32
5-10 Years 29.95
10+ Years 17.73
Performance
SPAB U.S. Agg.
1-Year Return % 8.72 8.72
3-Year Return %
(Ann.)
3.97 4.03
5-Year Return %
(Ann.)
2.99 3.05
27
27.5
28
28.5
29
29.5
30
30.5
1/2/1
9
2/1/1
9
3/3/1
9
4/2/1
9
5/2/1
9
6/1/1
9
7/1/1
9
7/31/19
8/30/19
9/29/19
10/29/19
11/28/19
12/28/19
NAV
($)
Date

2019 Annual Report 59
Invesco S&P 500 High Dividend Low Volatility ETF (NYSE: SPHD)
Sector:
Large Cap
Value
Expense:
0.30%
P/E:
15.63
P/B:
2.12
ROE:
13.36%
Current Price:
$44.03
Net Asset Value (NAV):
$44.03
Holding Return:
28.58%
52 Week Range:
$37.88-$44.04
Exchange Traded Fund (ETF) Overview
With 51 holdings, Invesco S&P 500 High Dividend Low
Volatility ETF SPHD delivers a high yield while effectively
keeping risk in check. Although the fund only includes 50
stocks, it has limited exposure to stock-specific risk. The
resulting portfolio lands in large-value territory. It offers a
higher dividend yield and smaller market-cap orientation
than the Russell 1000 Value Index.
Investment Rationale/Risk
Historically, the fund has exhibited low sensitivity to
market fluctuations. It should hold up better than
most of its peers during market downturns.
The fund's holdings offer attractive dividend yields.
Their high dividend payouts should make it harder
for managers to invest in low-return projects.
Individual stocks don't have a big impact on the
fund's performance.
This portfolio can introduce large sector bets, which
can be a source of risk.
Sector Allocation (%) Consumer Discretionary 2.04
Consumer Staples 11.12
Energy 13.98
Financials 15.24
Health Care 5.69
Industrials 1.63
Real Estate 20.81
Information Technology 4.01
Materials 4.35
Communication Services 6.89
Utilities 14.24
Top 5 Holdings (%) Reward and Risk
Iron Mountain Inc 3.16
AT&T Inc 3.11 (FUND) S&P 500
Altria Group Inc 3.00 1-Year Return % 20.32 28.88
Kimco Realty Corp 2.97 3-Year Return % (Ann.) 8.13 13.00
PPL Corp 2.79 3-Year Sharpe Ratio - -
34
35
36
37
38
39
40
41
42
43
44
45
1/1/1
9
2/1/1
9
3/1/1
9
4/1/1
9
5/1/1
9
6/1/1
9
7/1/1
9
8/1/1
9
9/1/1
9
10/1/19
11/1/19
12/1/1
9
NAV
($)
Date

Vanguard High Dividend Yield ETF (NYSE: VYM)
Sector:
Large Cap
Value
Expense:
0.06%
P/E:
16.1
P/B:
2.2
ROE:
15.9%
Current Price:
$93.71
Net Asset Value (NAV):
$93.73
Holding Return:
52.38%
52 Week Range:
$76.68-$94.44
Exchange Traded Fund (ETF) Overview
Vanguard High Dividend Yield ETF seeks to track the
performance of a benchmark index that measures the
investment return of common stocks of companies that
are characterized by high dividend yields. The Fund’s
investment approach is to track the performance of the
FTSE High Dividend Yield Index. They are passively
managed, have large-cap equity with an emphasis on
stocks that are forecasted to have above average dividend
yields, and have low expenses to minimize net tracking
error.
Investment Rationale/Risk
The Fund is an excellent choice for exposure to
stocks with higher than average dividend yields
without taking outsize risk.
The Fund’s broadly diversified portfolio and its low
fee provide a persistent edge over its large-cap
value peers.
The ETF effectively diversifies the risk of solely
focusing on yield by screening holdings based on
dividend yield weighted by market cap.
The ETF stable income and provides a cushion to
stay invested during turbulent markets; however,
high-yielding stocks can be dangerous because the
companies can be under distress and cut dividends.
Sector Allocation (%) Consumer Discretionary 5.04
Consumer Staples 14.86
Energy 7.19
Financials 18.21
Health Care 15.29
Industrials 8.06
Real Estate 0.03
Information Technology 10.75
Materials 3.45
Communication Services 7.54
Utilities 9.58
Top 5 Holdings (%) Reward and Risk
JPMorgan Chase & Co. 3.82
Johnson & Johnson 3.77 VYM S&P 500
Procter & Gamble Co 2.96 1-Year Return % 24.20 28.88
AT&T Inc 2.72 3-Year Return %
(Ann.)
10.82 13.00
Intel Corp 2.55 3-Year Sharpe Ratio - -
$65.00
$70.00
$75.00
$80.00
$85.00
$90.00
$95.00
$100.00
1/2/1
9
2/1/1
9
3/3/1
9
4/2/1
9
5/2/1
9
6/1/1
9
7/1/1
9
7/31/19
8/30/19
9/29/
19
10/29/1
9
11/28/1
9
12/28/19
NAV
($)
Date
NAV

2019 Annual Report 61
DIVIDENDS In 2019, the IMP portfolio received $4,460.29 in dividends, which equated to a 1.97% dividend yield. In comparison
to the S&P500, which yielded roughly 1.80% in dividends as of December 31, 2019, the IMP portfolio has a slightly
higher yield. The holdings with the three highest dividend amounts were VanEck Vectors Emerging Markets High
Yield Bond ETF (HYEM), Invesco S&P500 High Dividend Yield Low Volatility ETF (SPHD), and Vanguard High Dividend
Yield ETF (VYM). As you can see, all three of these holdings were ETFs with a high yield focus. Non-ETF holdings that
paid the highest dividend amounts were TransCanada Corp. (TRP), Proctor & Gamble (PG), and Cisco Systems, Inc.
(CSCO) as well as UnitedHealth Group, Inc. (UNH) both paid $165.60 for the third highest payout.
MERGERS AND ACQUISITIONS
Sold Name Ticker Gain/Loss Return Date
Celgene Corp. CELG ($ 638.64) -45.6% 11/21/2019
Acquired
Name Ticker Shares Share Price Date
Bristol-Meyer Squibb
Co.
BMY 16 $ 55.90 11/21/2019
Ticker Sum of Dividends Ticker Sum of Dividends Ticker Sum of Dividends
AAPL 127.68$ D 82.59$ NVDA 4.00$
CAN 90.40$ DEO 69.05$ PEAK 12.95$
AGG 55.01$ DIS 76.81$ PEG 112.80$
ALGT 31.50$ ET 158.60$ PG 177.28$
AMGN 121.80$ FNV 56.43$ PRI 50.32$
AMT 72.20$ GILD 75.60$ SMG 16.50$
SPD 45.80$ HCP 25.90$ SPAB 13.84$
APTS 33.80$ HON 18.00$ SPHD 454.67$
ATVI 11.10$ HSY 15.46$ Ticker 159.12$
BAC 97.68$ HYEM 486.16$ TJX 29.67$
BLK 99.00$ JNJ 56.25$ TRP 208.97$
BND 35.91$ KO 112.00$ UNH 165.60$
BUD 44.28$ LMT 81.00$ V 42.00$
CERN 18.00$ MLM 14.42$ VYM 230.19$
CI 0.36$ MMM 144.00$ WRC 76.14$
COF 20.00$ MSFT 141.75$
CSCO 165.60$ NTES 22.10$ Grand Total 4,460.29$

PORTFOLIO SNAPSHOT