Embed Size (px)
Citation preview
John J. TysonBiological Sciences & the Biocomplexity Institute
Virginia Tech
Getting Things Right in a Noisy Milieu:
Stochastic Models of Cell Cycle Dynamics
in Budding Yeast

S
DNA synthesis
G2
G1
cell division+
Metaphase
Anaphase
Telophase
Prophase
Balanced growth and division
Alternation of DNA synthesis and mitosis
Checkpoints
Robust yet noisy

S
DNA synthesis
G2
G1
cell division+
Metaphase
Anaphase
Telophase
Prophase
Cdk
Cln2
Clb5
Clb2
APC
Cdh1Cdc14
APC
Cdc20

Deterministic Models
Chen et al (2000) Mol Biol Cell
Chen et al (2004) Mol Biol Cell
Csikasz-Nagy et al (2006) Biophys J
Tyson & Novak (2008) Curr Biol
Kraikivsky et al (2015) npj Syst Biol Appl

Deterministic Models
Chen et al (2000) Mol Biol Cell
Chen et al (2004) Mol Biol Cell
Csikasz-Nagy et al (2006) Biophys J
Tyson & Novak (2008) Curr Biol
Kraikivsky et al (2015) npj Syst Biol Appl
Clb2
Cdh1
Cln2 Cdc14

Clb2
Cln2 Cdc14
G1 G1
S
G2 M A
T
Clb2
Cdh1
Cln2 Cdc14
Is this deterministic model robust in the face of
the inevitable molecular noise in a tiny yeast cell
(volume = 40 fL = 40 x 10-15 L)

Table 1. Numbers of molecules (per haploid yeast cell)
and half-lives for several cell cycle components.
Cell cycle
Gene
# molecules per cell Half-life (min)
Protein mRNA Protein mRNA
CDC28 6700 2.2 300 23
CLN2 1300 1.2 5 10
CLB2 340 1.1 22 13
CLB5 520 0.9 44 9
SWI5 690 0.8
MCM1 9000 1.6 300 14
SIC1 770 1.9
CDC14 8500 1.0 20 11
Molecular Noise
Budding Yeast Cells
Vol = 40 fL

PP
P P
1
1 3%
1000
CVN N
p
P
p
2
P P
kN
N
Birth-Death Process

Transcription-Translation
Coupling
MP
P M P M
1 1
1 1 1 70%
1000 2 1
CVN N
Swain, Paulsson, etc.

How variable is the yeast cell cycle?
Di Talia et al., Nature (2007)
G1 Duration
Mean = 16 min
CV = 48%
Cycle Time
Mother
Daughter
87 min ± 14%
112 min ± 22%
Size @ Div 68 fL ± 19%

Budding: Myo1-GFP
Cell size: ACT1pr-DsRed
Di Talia et al., Nature (2007)
Whi5 exit: Whi5-GFP
Cell size: ACT1pr-DsRed
Daughter Cells
Constant?

Budding: Myo1-GFP
Cell size: ACT1pr-DsRed
Whi5 exit: Whi5-GFP
Cell size: ACT1pr-DsRed
Di Talia et al., Nature (2007)
Whi5
Cyclin
Whi5PStart
Exit
BE
DNA
synth

Daughter cell
Di Talia et al., Nature (2007)
T2 = TG1 – T1 = constant

Debashis Barik & Sandip Kar
Andrea Ciliberto &
Mohsen Sabouri
Jean Peccoud Yang Cao
Mark PaulBill Baumann
Stochastic Modeling

Multisite Phosphorylation Model (Barik, et al.)
Clb2
Cdh1bistable
switch

Multisite Phosphorylation Model (Barik, et al.)
Cell size control
Clb2
Cdh1
Cln2

Multisite Phosphorylation Model (Barik, et al.)
Clb2
Cdh1
Cln2 Cdc14

Multisite Phosphorylation Model (Barik, et al.)
SBF
Transcription-translation coupling?Use simple birth-death processes.
Assume short mRNA half-life.
Assume rapid, reversible binding of SBF to promoter.

Deterministic calculations
The model consists of 58 species, 176 reactions and 68 parameters
Mass-action kinetics for all reactions
At division daughter cells get 40% of total volume and mothers get 60%

Stochastic calculations
The model consists of 58 species, 176 reactions and 68 parameters
Mass-action kinetics for all reactions
Protein populations: ~1000’s of molecules per gene product
mRNA populations: ~10 molecules per gene transcript
mRNA half-lives: ~ 2 min
Reactions are simulated using Gillespie’s SSA

Experimental data from:
Di Talia et al., Nature (2007)
Mother Daughter
Cycle Time (min) Expt 87 ± 14% 112 ± 22%
Model 89 ± 20% 114 ± 22%
G1 duration (min) Expt 16 ± 50% 37 ± 50%
Model 21 ± 48% 41 ± 48%
Size@birth (fL) Expt 40 ± 18% 28 ± 20%
Model 41 ± 23% 28 ± 23%

Daughter cellsModel Di Talia et al.
Mother cellsModel Di Talia et al.

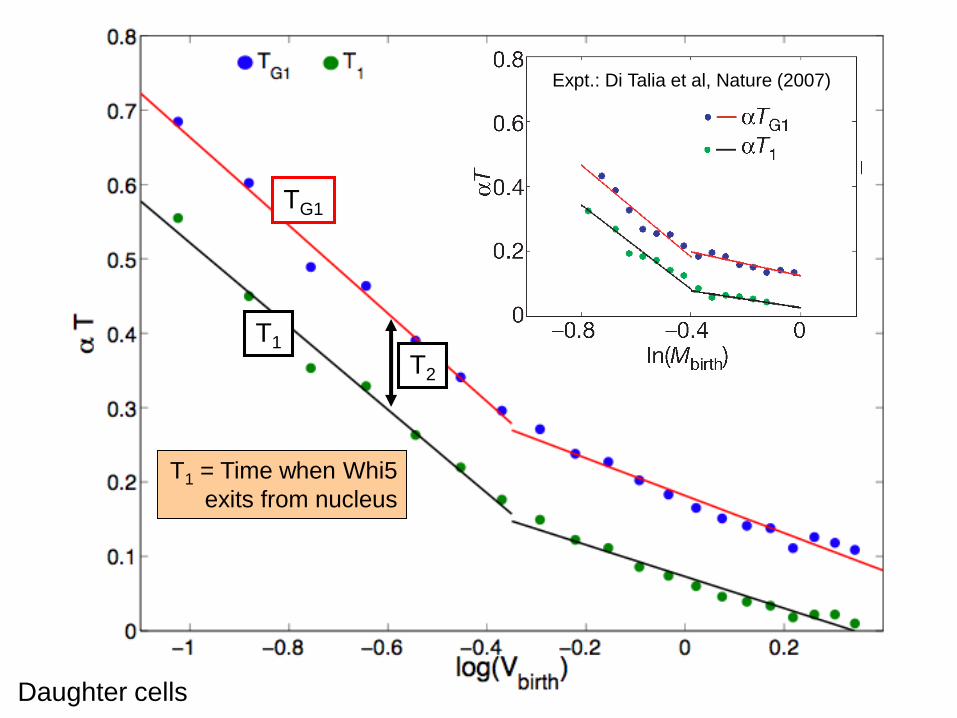
Daughter cellsSize control: Daughter cells

Expt.: Di Talia et al, Nature (2007)

Mother cellsSize control of mother cells?

Expt.: Di Talia et al, Nature (2007)
TG1
T1
Daughter cells
T2
T1 = Time when Whi5
exits from nucleus

CLN3 WHI5
CLN2 CDH1 CLB2
CDC14NET1
Histograms of mRNAs of different genes
SBF

CLN3 WHI5
CLN2 CDH1 CLB2
CDC14NET1
Histograms of mRNAs of different genes
SBF
NET1
David Ball Jean Peccoud
Poisson
FISH = Fluorescence In Situ Hybridization

CLN3 WHI5
CDH1 CLB2
CDC14NET1
Histograms of mRNAs of different genes
SBF
CLN2
David Ball, Jean Peccoud, et al.
CLN2
Debashis Barik, revised model
model

Data from:
David A. Ball; Tae-Hyuk Ahn; Pengyuan
Wang; Katherine C. Chen; Yang Cao; John J.
Tyson; Jean Peccoud; William T. Baumann;
Cell Cycle 2011, 10, 999-1009.
DOI: 10.4161/cc.10.6.14966
Copyright © 2011 Landes Bioscience
Some mutant strains exhibit “partial viability”…a
phenotype inconsistent with deterministic models
Smulations from:
Debashis Barik; David Ball; Jean Peccoud;
John J. Tyson; manuscript in preparation
Mutant strain:
CLB2-dbΔ clb5 Δ
MDT = ln2 / 0.00467 min−1 = 148 min

0 500 1000 1500 200010
0
101
102
103
104
Time (min)
No
. o
f C
ell
140
150
160
Do
ub
lin
g t
ime
0 500 1000 1500 2000 250010
0
101
102
103
104
Time (min)
170
180
190
Do
ublin
g tim
e
WT(Galactose)
WT(Glycerol−Ethanol)
0 500 1000 1500 200010
0
101
102
103
Time (min)
No
. o
f C
ell
180
200
220
Do
ublin
g t
ime (
min
)
CLB2−dbD clb5D (Galactose)
50 150 250 3500
400
800
1200
Tdiv
(min)
Ce
ll C
ou
nt
50 150 250 3500
400
800
1200
1600
2000
Tsg2m
(min)
Ce
ll C
ou
nt
Mother
Daughter
WT:
MDT = ln2 / 0.00467 min−1 = 148 min
NDT = 151 min
Mutant:
MDT = 148 min
NDT = 190 min

WT
mutant
45%

Summary
• Cell cycle control in eukaryotes can be
framed as a dynamical system that gives a
coherent and accurate account of the basic
physiological properties of proliferating cells.
• The control system seems to be operating at
the very limits permitted by molecular
fluctuations in yeast-sized cells.
• A realistic stochastic model is perfectly
consistent with detailed quantitative
measurements of cell cycle variability.

• Tyson & Novak (2008) Curr Biol 18:R759
• Kar et al. (2009) PNAS 106:6471
• Barik et al. (2010) Mol Syst Biol 6:405
• Tyson & Novak (2012) Handb Syst Biol
• Kraikivsky et al. (2015) npj Syst Biol Appl
• Barik et al. (in ppn)
References
![INDEX [meanwell.com]meanwell.com/Upload/PDF/meanwell_LED.pdf · APC-8, APC-12, APC-16, APC-25, APC-35 3 APV-8E, APV-12E, APV-16E 4 APC-8E, APC-12E, APC-16E LP ... Over voltage protection](https://img.pdfslide.us/doc/110x75/5b619e107f8b9a40488c919f/index-apc-8-apc-12-apc-16-apc-25-apc-35-3-apv-8e-apv-12e-apv-16e-4.jpg)