Embed Size (px)
Citation preview
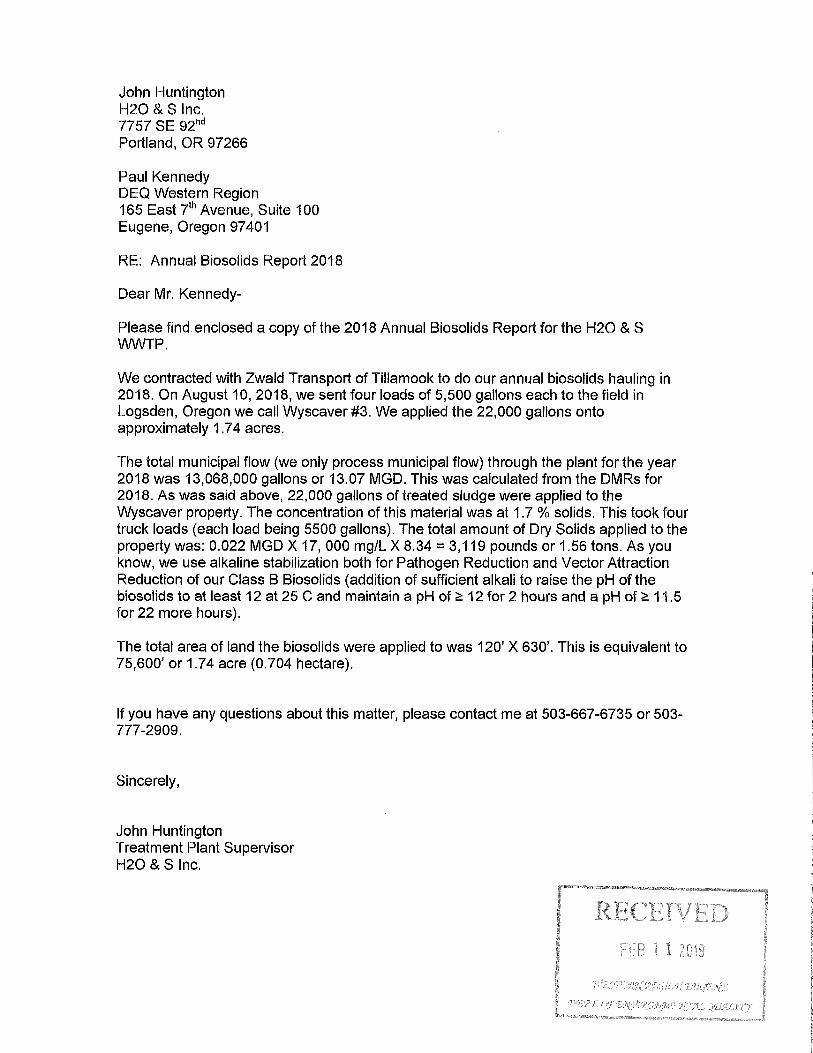
John Huntington H2O & S Inc. 7757 SE 92nd
Portland, OR 97266
Paul Kennedy DEQ Western Region 165 East th Avenue, Suite 100 Eugene, Oregon 97 401
RE: Annual Biosolids Report 2018
Dear Mr. Kennedy-
Please find enclosed a copy of the 2018 Annual Biosolids Report for the H2O & S WWfP.
We contracted with Zwald Transport of Tillamook to do our annual biosolids hauling in 2018. On August 10, 2018, we sent four loads of 5,500 gallons each to the field in Logsden, Oregon we call Wyscaver #3. We applied the 22,000 gallons onto approximately 1. 7 4 acres.
The total municipal flow (we only process municipal flow) through the plant for the year 2018 was 13,068,000 gallons or 13.07 MGD. This was calculated from the DMRs for 2018. As was said above, 22,000 gallons of treated sludge were applied to the Wyscaver property. The concentration of this material was at 1.7 % solids. This took four truck loads (each load being 5500 gallons). The total amount of Dry Solids applied to the property was: 0.022 MGD X 17, 000 mg/L X 8.34 = 3,119 pounds or 1.56 tons. As you know, we use alkaline stabilization both for Pathogen Reduction and Vector Attraction Reduction of our Class B Biosolids (addition of sufficient alkali to raise the pH of the biosolids to at least 12 at 25 C and maintain a pH of~ 12 for 2 hours and a pH of~ 11.5 for 22 more hours).
The total area of land the biosolids were applied to was 120' X 630'. This is equivalent to 75,600' or 1.74 acre (0.704 hectare).
If you have any questions about this matter, please contact me at 503-667-6735 or 503-777-2909.
Sincerely,
John Huntington Treatment Plant Supervisor H2O & S Inc.

State of Oregon Department of Environmental Quality 700 NE Multnomah St. Suite 600, Portland, OR 97232
Wastewater Solids and Biosolids Annual Report Part I: Wastewater solids production and disposition
Part I: Must be completed by all domestic wastewater facilities.
1. Legal name offacility:H2O & S \/1/WfP
Physical address
2. Street Address: Inn at Otter Crest, Otter Crest Loop 1 Mile West of Hwy 101
City:Otter Rock State:Oregon
Mailing address D Same as physical address.
3. Mailing Address:7757 SE 92nd Ave,
City: Portland State: Oregon
Facility Type (check all that apply)
DEQ use only
Zip code:97369
Zip code: 97266
D Major or Tier 1 facility (design flow of 1 mgd or greater, or serving a population of 10,000 or greater) [ii Minor or Tier 2 facility (design flow less than 1 mgd or serving a population less than 10,000)
4. D Class I wastewater treatment facility (i.e., facility with a pre-treatment program) D Biosolids only facility D Lagoon treatment system D Other, please specify:
0. GONT'ACT' INFORMAT'l©N
Responsible official
Name:John P. Huntington Title:Treatment Plant Manager
1. Email Address:[email protected] Telephone: 503-777-2909
Mailing Address:7757 SE 92nd Ave.
City: Portland State: Oregon IZip code:97266
Biosolids contact Ii] Same as responsible official
Name: Title:
2. Email Address: Telephone:
Mailing Address:
City: State: IZip code:
Wastewater solids and biosolids annual report/ Part I: Wastewater solids production and disposition v. 10-26-2018 Page 1

- - - - - - = _,,,_ - - - - ¾ -e. w~smmWJ~ffiEUR: S@U!!IIDS Rc@clNZclD
Please indicate if you received wastewater solids or hauled from other facilities for processing.
Did you receive wastewate1· solids or hauled waste from other facilities? □ Yes □ NO If you received unprocessed wastewater solids, please list sources below. All weight values should be rep01ted in US tons. (US ton= 2,000 lbs) Attach additional pages if necessary.
Name Type Quantity Units (choose one) % solids
1. D septage D sludge D gallons D wet tons D d1y tons 0.00%
D septage D sludge D gallons D wet tons D dty tons 0.00%
D septage D sludge D gallons D wet tons D dry tons 0.00%
D septage D sludge D gallons D wet tons D d1y tons 0.00%
D septage D sludge D gallons D wet tons D dty tons 0.00%
G. w~smew~meR s@mms ffiRE~ffiMENm RR@@ESSEES
Please indicate the solids treatment processes used at your facility (mark all that apply)
Thickening technology Stabilization Technology Dewatering technology
D Gravity Ii] Aerobic digestion D Belt press
0DAF D Anaerobic digestion D Plate and frame press
D Centrifugation Ii] Lime stabilization D Screw press 1. D Other: 0ATAD D Centrifuge
D Composting D Vacuum filter
D Thennal D D1ying beds
D Lagoon D Heat drying
D Other: D Other:
Dry tons = wet tons x %solids Dry tons= (galx%s:~~dsxB.34
) x0. 0005
G. W~SffiEW~ffiER [email protected] IDISR©Slffil©N
Please indicate how wastewater solids were managed at your facility. Please specify reporting units. Al/weight values should be reported in US tons. US ton.= 2,000 lbs
Disposition of wastewater solids Quantity (choose one) % solids
1. Ii] Treated and land applied, sold, or given-away as Gallons Wet tons Dry Tons
biosolids or biosolids-derived products 22,000 70.79 1.56 1.7
2. D Sent to landfill. Gallons Wet tons Dry Tons
Name: 0.00%
3. D Sent to another permitted facility for treatment. Gallons Wet tons Dry Tons Name: 0.00%
4, 0 Long-te1m storage at treatment facility ( e.g., lagoon, Gallons Wet tons Dry Tons drying bed, etc.)* 0.00%
5. 0 Other. Gallons Wet tons Dry Tons
Please specify: 0 * If you operate a lagoon system and do not have accurate data on the quantity of solids in your lagoon, please check the box for long-tenn storage, but you may leave the quantity and other info1mation blank.
Wastewater solids and biosolids annual report I Part I: Wastewater solids production and disposition v. 10-26-2018 Page 2
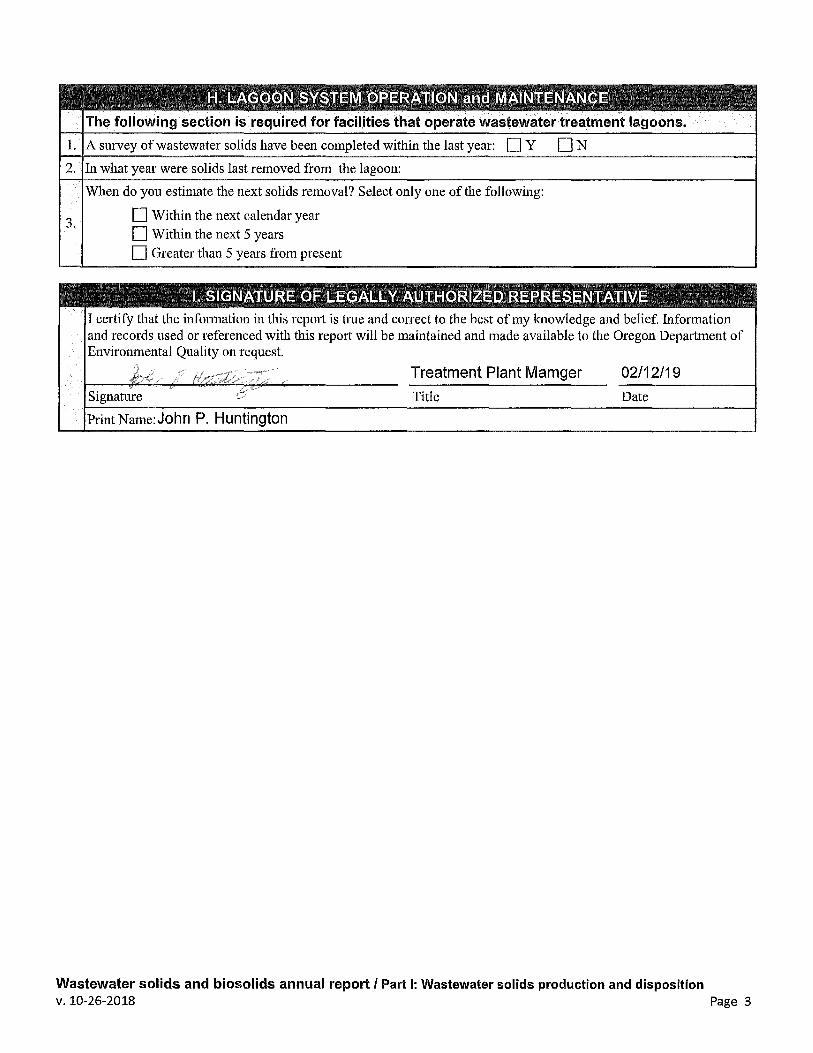
The following section is required for facilities that operate wastewater treatment lagoons.
1. A survey of wastewater solids have been completed within the last year: D Y D N
2. hi what year were solids last removed from the lagoon:
3.
When do you estimate the next solids removal? Select only one of the following:
D Within the next calendar year
D Within the next 5 years
D Greater than 5 years from present
I certify that the information in this rep01t is 1:tue and correct to the best of my knowledge and belief. Information and records used or referenced with this report will be maintained and made available to the Oregon Department of Environmental Quality on request.
Signature
Print Name:John P. Huntington
Treatment Plant Mamger Title
02/12/19
Date
Wastewater solids and biosolids annual report I Part I: Wastewater solids production and disposition v. 10-26-2018 Page 3
State of Oregon Department of Environmental Quality DEQ use only 700 NE Multnomah St. Suite 600, Portland, OR 97232
Wastewater Solids and Biosolids Annual Report Part II: Biosolids production and quality
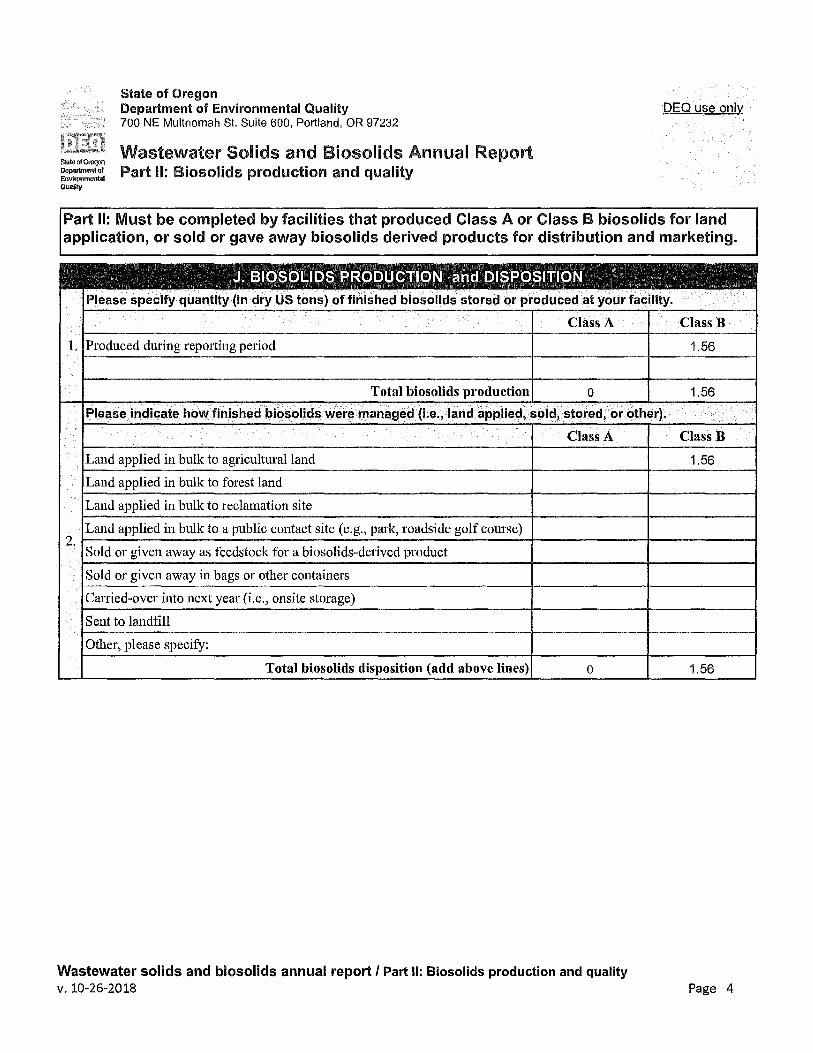
Part II: Must be completed by facilities that produced Class A or Class B biosolids for land application, or sold or gave away biosolids derived products for distribution and marketing.
~- Bl©[email protected] raR©DlLICIBl@NI and 01SB©SIIBl©NI Please specify quantity (in dry US tons) of finished biosolids stored or produced at your facility.
Class A
1. Produced during reporting period
Total biosolids production 0
Please indicate how finished biosolids were managed (i.e., land applied, sold, stored, or other).
Class A
Land applied in bulk to agricultural land
Land applied in bulk to forest land
Land applied in bulk to reclamation site
2. Land applied in bulk to a public contact site (e.g., park, roadside golf course)
Sold or given away as feedstock for a biosolids-derived product
Sold or given away in bags or other containers
Carried-over into next year (i.e., onsite storage)
Sent to landfill
Other, please specify:
Total biosolids disposition (add above lines) 0
Wastewater solids and biosolids annual report/ Part II: Biosolids production and quality v. 10-26-2018
Class B
1.56
1.56
Class B
1.56
1.56
Page 4
" " " " "
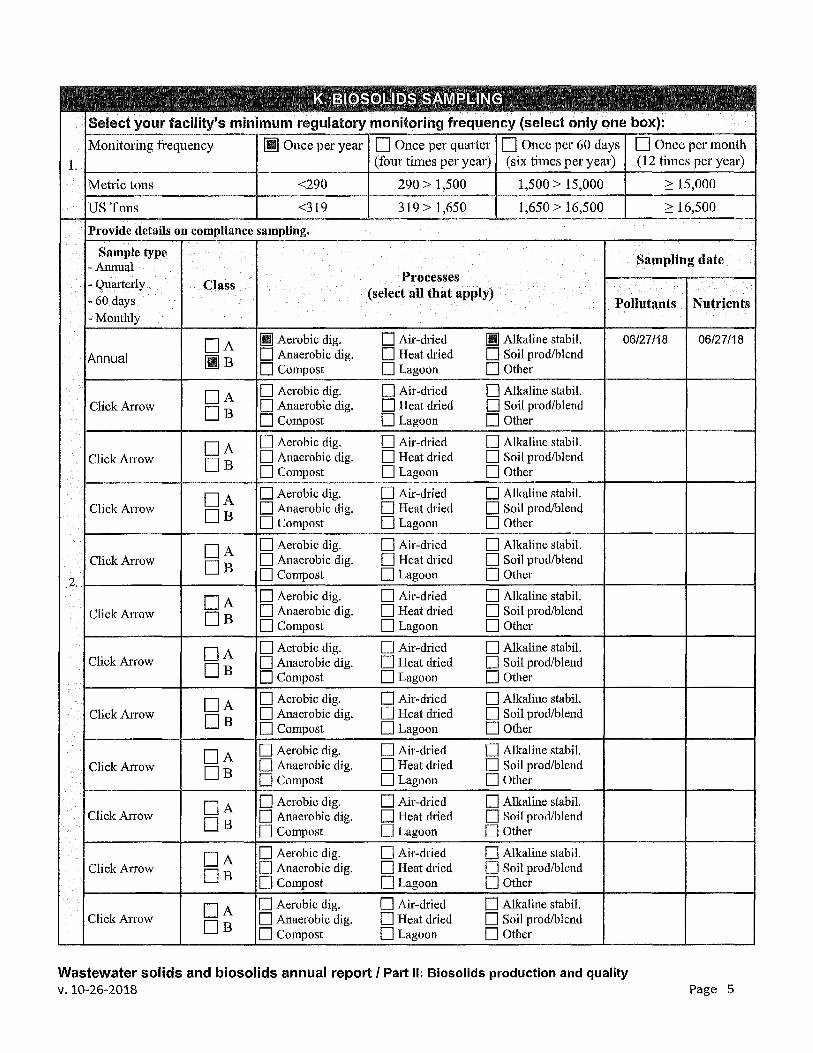
~. Bl@S@mms S~MIII.F:llN@
Select your facility's minimum regulatory monitoring frequency (select only one box):
Monitoring frequency Ii] Once per year 0 Once per quartet 0 Once per 60 days 0 Once per month
1. (four times per year) (six times per year) (12 times per year)
Metric tons <290 290 > 1,500 1,500 > 15,000 2: 15,000
US Tons <319 319 > 1,650 1,650 > 16,500 2: 16,500
Provide details on compliance sampling.
Sample type Sampling date -Annual
- Quaiierly Class Processes
- 60 days (select all that apply)
Pollutants Nutrients - Monthly
0A Ii] Aerobic dig. 0 Air-dried Ii] Alkaline stabil. 06/27/18 06/27/18
Annual li]B D Anaerobic dig. D Heat dried 0 Soil prod/blend D Compost D Lagoon D Other
0A D Aerobic dig. 0 Air-dtied D Alkaline stabiL Click Arrow OB D Anaerobic dig. D Heat dried 0 Soil prod/blend
D Compost D Lagoon D Other
0A D Aerobic dig. D Air-dried D Alkaline stabil. Click Arrow DB D Anaerobic dig. D Heat dried 0 Soil prod/blend
D Compost D Lagoon D Other
DA D Aerobic dig. 0 Air-dried D Alkaline stabil. Click Arrow DB D Anaerobic dig. D Heat dried D Soil prod/blend
D Compost D Lagoon D Other
DA D Aerobic dig. 0 Air-dried D Alkaline stabil. ClickAnow DB D Anaerobic dig. D Heat dried 0 Soil prod/blend
2. D Compost D Lagoon D Other
0A D Aerobic dig. D Air-dried 0 Alkaline stabil.
Click Atrnw DB D Anaerobic dig. D Heat dried 0 Soil prod/blend D Compost D Lagoon D Other
DA D Aerobic dig. D Air-dried 0 Alkaline stabil. Click Arrow DB D Atiaerobic dig. D Heat dried D Soil prod/blend
D Compost D Lagoon D Other
DA D Aerobic dig. 0 Air-dried D Alkaline stabil. Click Arrow DB D Anaerobic dig. D Heat dried 0 Soil prod/blend
D Compost D Lagoon D Other
DA D Aerobic dig. D Air-dried D Alkaline stabil. Click Arrow DB D Anaerobic dig. D Heat dried 0 Soil prod/blend
D Compost D Lagoon D Other
DA D Aerobic dig. D Air-dried D Alkaline stabil. Click Arrow OB D Anaerobic dig. D Heat dried 0 Soil prod/blend
D Compost D Lagoon D Other
DA D Aerobic dig. D Air-dried D Alkaline stabil. Click Arrow OB D Anaerobic dig. D Heat dried 0 Soil prod/blend
D Compost D Lagoon D Other
DA D Aerobic dig. D Air-dried D Alkaline stabil. Click Arrow DB D Anaerobic dig. D Heat dried 0 Soil prod/blend
D Compost D Lagoon D Other
Wastewater solids and biosolids annual report/ Part II: Biosolids production and quality v. 10-26-2018 Page 5
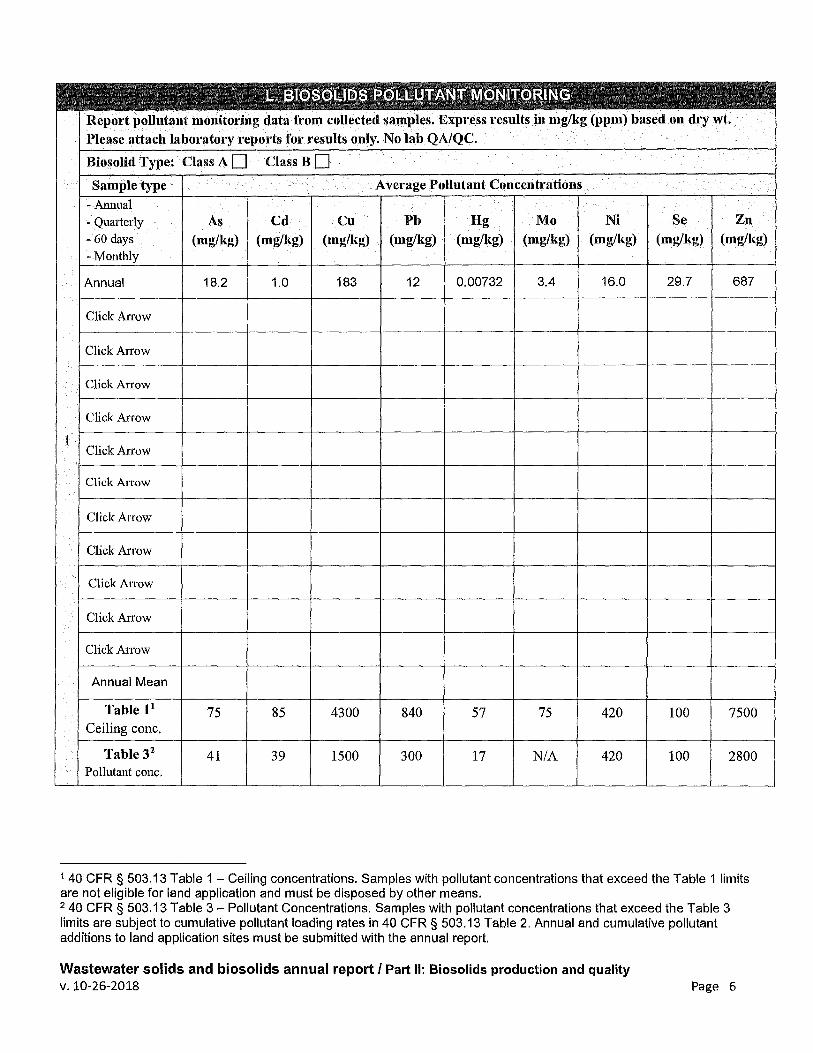
Report pollutant monitoring data from collected samples. Express results in mg/kg (ppm) based on dry wt. Please attach laboratory reports fo1· results only. No lab QAJQC.
Biosolid Type: Class AO ClassB D Sample type Average Pollutant Concentrations
-Annual - Quarterly As Cd Cu Pb Hg Mo Ni Se Zn - 60 days (mg/kg) (mg/kg) (mg/kg) (mg/kg) (mg/kg) (mg/kg) (mg/kg) (mg/kg) (mg/kg) -Monthly
Annual 18.2 1.0 183 12 0.00732 3.4 16.0 29.7 687
Click Arrow
Click Arrow
Click Arrow
Click Arrow
1 Click Arrow
Click Arrow
Click Arrow
Click Arrow
Click Arrow
Click Arrow
ClickAlrnw
Annual Mean
Table 11 75 85 4300 840 57 75 420 100 7500 Ceiling cone.
Table 32 41 39 1500 300 17 NIA 420 100 2800 Pollutant cone.
1 40 CFR § 503.13 Table 1 - Ceiling concentrations. Samples with pollutant concentrations that exceed the Table 1 limits are not eligible for land application and must be disposed by other means. 2 40 CFR § 503.13 Table 3 - Pollutant Concentrations. Samples with pollutant concentrations that exceed the Table 3 limits are subject to cumulative pollutant loading rates in 40 CFR § 503.13 Table 2. Annual and cumulative pollutant additions to land application sites must be submitted with the annual report.
Wastewater solids and biosolids annual report/ Part II: Biosolids production and quality v. 10-26-2018 Page 6
- " "
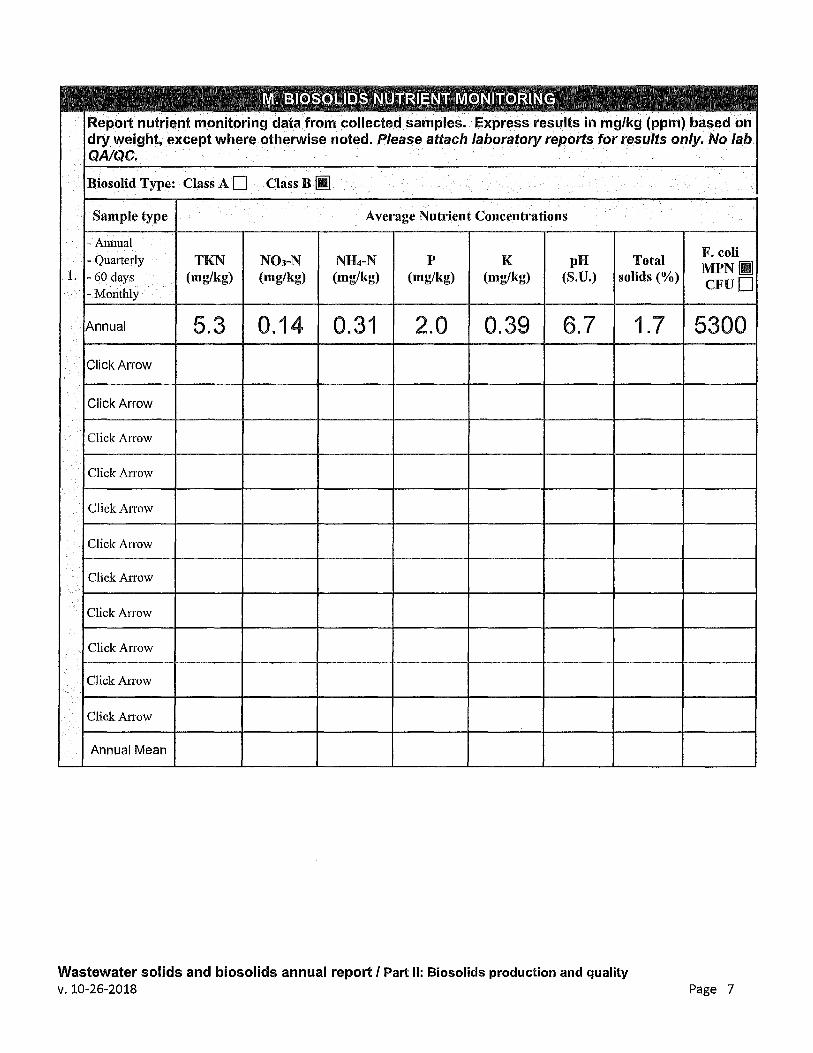
l\t'I. IBl®S©li.lllDS NWffiRll!Uslm l\ll©Nlffi©RIN@
Report nutrient monitoring data from collected samples. Express results in mg/kg (ppm) based on dry weight, except where otherwise noted. Please attach laboratory reports for results only. No lab QA/QC.
Biosolid Type: Class A D Class B lil
Sample type Average Nutrient Concentrations
-Annual - Quatterly TKN N03-N NH4-N p K pH Total
1. - 60 days (mg/kg) (mg/kg) (mg/kg) (mg/kg) (mg/kg) (S.U.) solids(%) -Monthly
Annual 5.3 0.14 0.31 2.0 0.39 6.7
Click Arrow
Click Arrow
Click Arrow
ClickAnow
Click Arrow
Click Arrow
Click Arrow
Click Arrow
Click Arrow
Click Arrow
Click Arrow
Annual Mean
Wastewater solids and biosolids annual report/ Part II: Biosolids production and quality V. 10-26-2018
1.7
F. coli MPNliJ CFU □
5300
Page 7
"
~ = ~ - "' ~ ~ - - -~~ -~~- - - - -= = - - "" ~- "" - "' - "' =
1.
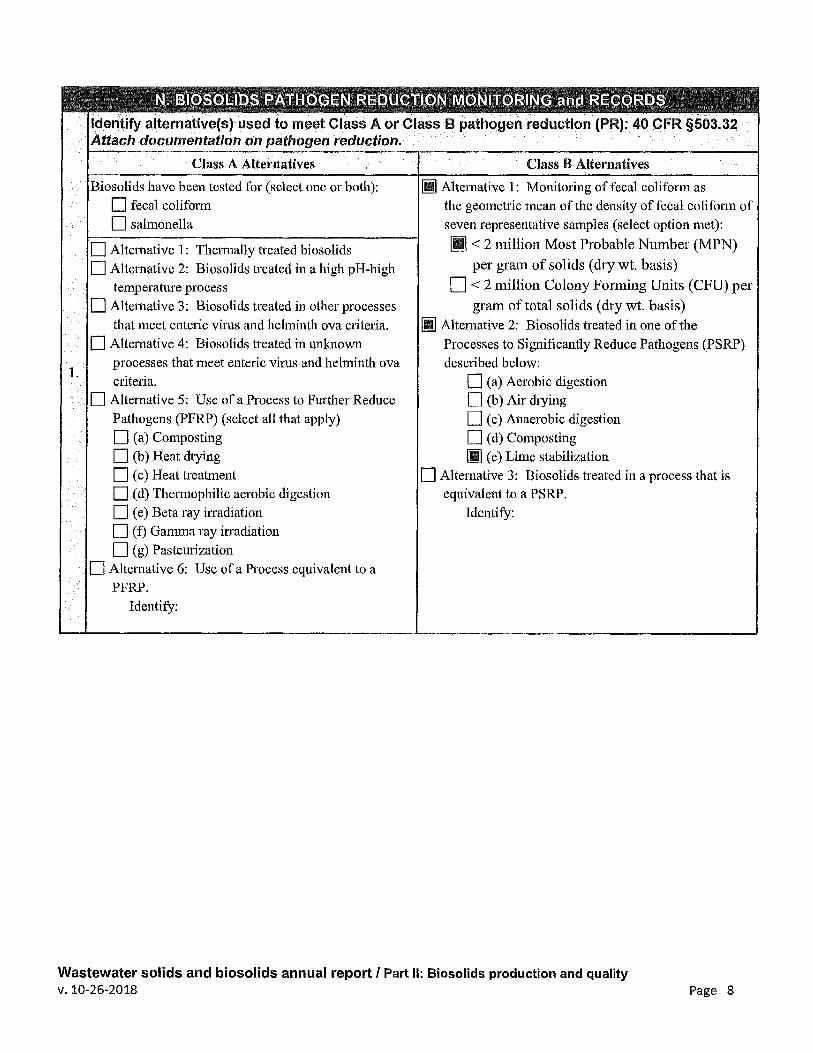
t!J. m1msmunris PAmmmmmt!J ~mmw@ml@t!J 1,1f@N1mm~1t!J@ ana mmmm~ms - ~
Identify alternative(s) used to meet Class A or Class B pathogen reduction (PR): 40 CFR §503.32 Attach documentation on pathogen reduction.
Class A Alternatives
Biosolids have been tested for (select one or both):
D fecal coliform
D salmonella
D Alternative 1: The1mally treated biosolids
D Alternative 2: Biosolids treated in a high pH-high temperature process
D Alternative 3: Biosolids treated in other processes
that meet enteric vims and helminth ova criteria.
D Alternative 4: Biosolids treated in unknown
processes that meet enteric virus and helminth ova
criteria.
D Alternative 5: Use of a Process to Further Reduce
Pathogens (PFRP) (select all that apply)
D (a) Composting
D (b) Heat drying
D ( c) Heat treatment D ( d) The1mophilic aerobic digestion
D ( e) Beta ray irradiation
D ( f) Gamma ray inadiation
D (g) Pastemization
D Alternative 6: Use of a Process equivalent to a
PFRP.
Identify:
Class B Alternatives
[ii Alternative 1: Monitoring of fecal coliform as
the geometric mean of the density of fecal colifonn of
seven representative samples (select option met):
Ii] < 2 million Most Probable Number (MPN)
per gram of solids ( chy wt. basis)
D < 2 million Colony Forming Units (CFU) per
gram of total solids (ch·y wt. basis) [ii Alternative 2: Biosolids treated in one of the
Processes to Significantly Reduce Pathogens (PSRP)
described below:
D (a) Aerobic digestion
D (b) Air drying
D ( c) Anaerobic digestion
D ( d) Composting
Ii] ( e) Lime stabilization
D Alternative 3: Biosolids treated in a process that is equivalent to a PSRP.
Identify:
Wastewater solids and biosolids annual report/ Part II: Biosolids production and quality v. 10-26-2018 Page 8
"
1.
2.
" - - " - -~ = " " - - " " " - ~,
@. Sl@S@l!ID>S Vl~U!i!;ffi@R .L\mm~.L\Gffil@N Rcmwemt@N arna RIG@Rms
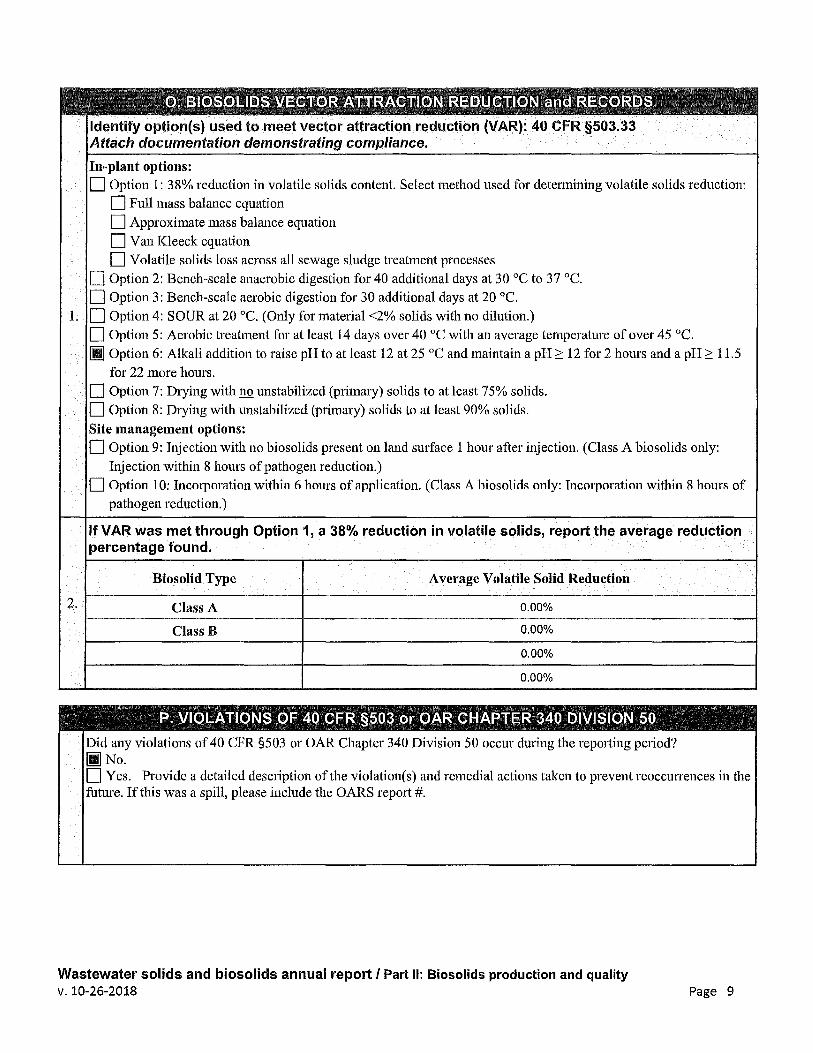
Identify option(s) used to meet vector attraction reduction (VAR): 40 CFR §503.33 Attach documentation demonstrating compliance.
In-plant options: 0 Option 1: 38% reduction in volatile solids content. Select method used for determining volatile solids reduction:
0 Full mass balance equation
0 Approximate mass balance equation
0 Van Kleeck equation
0 Volatile solids loss across all sewage sludge treatment processes
0 Option 2: Bench-scale anaerobic digestion for 40 additional days at 30 °C to 37 °C.
0 Option 3: Bench-scale aerobic digestion for 30 additional days at 20 °C.
0 Option 4: SOUR at 20 °C. (Only for material <2% solids with no dilution.)
0 Option 5: Aerobic treatment for at least 14 days over 40 °C with an average temperature of over 45 °C.
Ii] Option 6: Alkali addition to raise pH to at least 12 at 25 °C and maintain a pH 2: 12 for 2 hours and a pH 2: 11.5
for 22 more hours.
0 Option 7: Drying with no unstabilized (primary) solids to at least 75% solids.
0 Option 8: Drying with unstabilized (primary) solids to at least 90% solids.
Site management options: 0 Option 9: Injection with no biosolids present on land surface 1 hour after injection. (Class A biosolids only:
Injection within 8 hours of pathogen reduction.)
0 Option 10: Incorporation within 6 hours of application. (Class A biosolids only: Incorporation within 8 hours of
pathogen reduction.)
If VAR was met through Option 1, a 38% reduction in volatile solids, report the average reduction percentage found.
Biosolid Type Average Volatile Solid Reduction
Class A 0.00%
Class B 0.00%
0.00%
0.00%
R. [email protected]\ffil@NS @F 40 GFR §503 or @.L\R GH.L\RfficR 340 IDIVISl@N 50
Did any violations of 40 CFR §503 or OAR Chapter 340 Division 50 occur during the repmting period? Ii] No. 0 Yes. Provide a detailed description of the violation(s) and remedial actions taken to prevent reoccurrences in the future. If this was a spill, please include the OARS report #.
Wastewater solids and biosolids annual report/ Part II: Biosolids production and quality v. 10-26-2018 Page 9
,_
-
1.
2.
3.
" a - -i}. i\Ufv(n71~~~ @Ii Riimm II ~mm~@Hll\Jlj~ml -
" - ~"
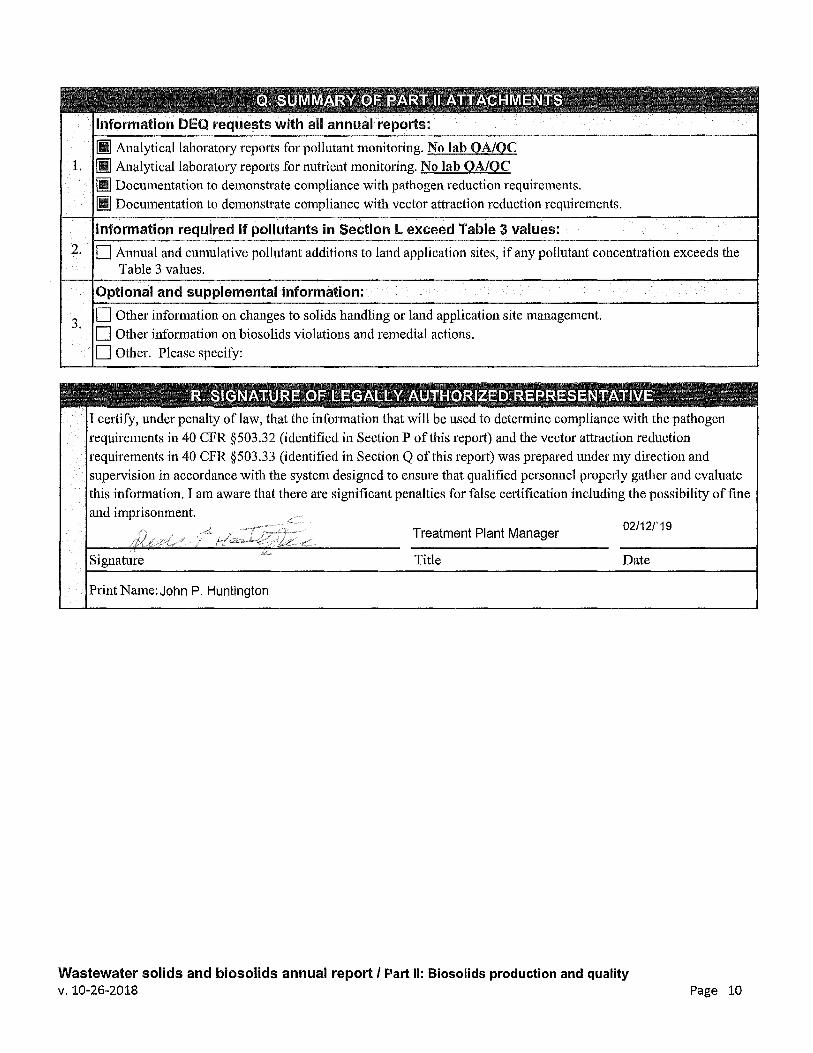
" - - " - - - " " - -- R - " - -Information DEQ requests with all annual reports:
[ii Analytical laborato1y reports for pollutant monit01ing. No lab QA/QC
[ii Analytical laboratory reports for nuttient monitoring. No lab OA/OC [ii Documentation to demonstrate compliance with pathogen reduction requirements.
[ii Documentation to demonstrate compliance with vector attraction reduction requirements.
Information required if pollutants in Section L exceed Table 3 values:
D Annual and cumulative pollutant additions to land application sites, if any pollutant concentration exceeds the Table 3 values.
Optional and supplemental information:
D Other inf01mation on changes to solids handling or land application site management.
D Other information on biosolids violations and remedial actions.
D Other. Please specify:
I certify, under penalty of law, that the information that will be used to determine compliance with the pathogen
requirements in 40 CFR §503.32 (identified in Section P of this report) and the vector attraction reduction
requirements in 40 CPR §503.33 (identified in Section Q of this report) was prepared under my direction and
supervision in accordance with the system designed to ensme that qualified personnel properly gather and evaluate this information. I am aware that there are significant penalties for false certification including the possibility of fine
and imprisonment.
Treatment Plant Manager 02/12/'19
Signature Title Date
Print Name:John P. Huntington
Wastewater solids and biosolids annual report/ Part II: Biosolids production and quality v. 10-26-2018 Page 10

State of Oregon Department of Environmental Quality 700 NE Multnomah St. Suite 600, Portland, OR 97232
Wastewater Solids and Biosolids Annual Report Part Ill: Biosolids land application site information
Part Ill: Must be completed by facilities that land applied Class B biosolids during the reporting period. Add additional pages as needed.
s. LAND APPLICAmloN s1rn1= INRORMATION
Owner Location, PLSS Appl. rate
Total Total area Site ID
(Last Name) (Township, Range, Section, Tax Crop(s) (lbs N/ac)
applied applied Lot) (OT/site)* (acres)
1. 3 Wyscaver 4,10,S,9W Pasture 100 1.56 1.74
2.
3.
4.
5.
6.
7.
8.
9.
10.
11.
12.
13.
14.
15.
Attach additional pages as required to report on all sites that received class B biosolids during the reporting period.
* Please report m umts of dry US tons (US ton= 2,000 lbs) ** Please attach laboratory report showing sample results only. No lab QA/QC.
Wastewater solids and biosolids annual report/ Part Ill: Biosolids land application site information v. 10-26-2018
DEQuseonly
Was site applied Soil
to the previous test.,., year?
li]Yes 0No □ 0Yes 0No □ 0Yes 0No □ □ Yes 0No □ 0Yes 0No □ 0Yes 0No □ 0Yes 0No □ 0Yes 0No □ 0Yes 0No □ 0Yes 0No □ 0Yes 0No □ 0Yes 0No □ 0Yes 0No □ 0Yes 0No □ 0Yes 0No □
Page 11
1.
2.
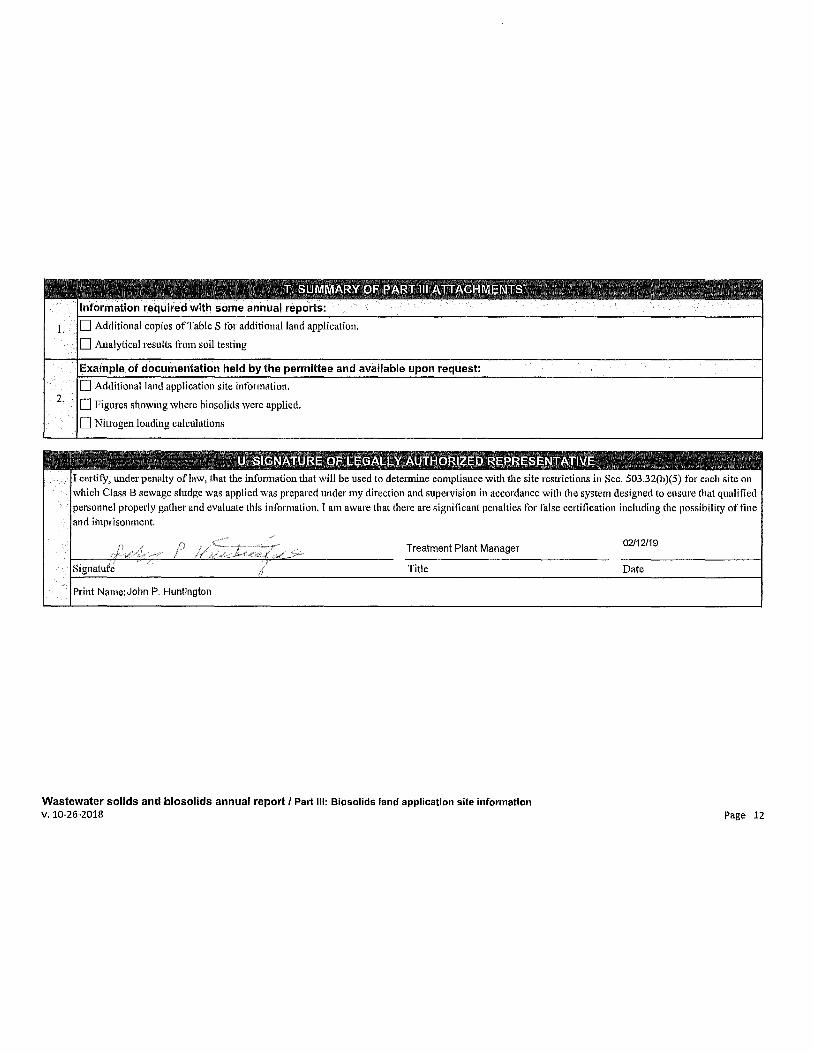
m. SIJJMMhiR¥ ©R R~Rm Ill A'ffiITTJ:XGHIME:Nms
Information required with some annual reports:
D Additional copies of Table S for additional land application.
D Analytical results from soil testing
Example of documentation held by the permittee and available upon request:
D Additional land application site information.
D Figures showing where bioso!ids were applied.
D Nitrogen loading calculations
I certify, under penalty oflaw, that the information that will be used to determine compliance with the site restrictions in Sec. 503.32(b)(5) for each site on which Class B sewage sludge was applied was prepared under my direction and supervision in accordance with the system designed to ensure that qualified
personnel properly gather and evaluate this information.Tam aware that there are significant penalties for false certification including the possibility of fine and imprisonment.
Treatment Plant Manager 02/12/19
Title Date
Print Name:John P. Huntington
Wastewater solids and biosolids annual report I Part Ill: Biosolids land application site information v. 10-26-2018 Page 12
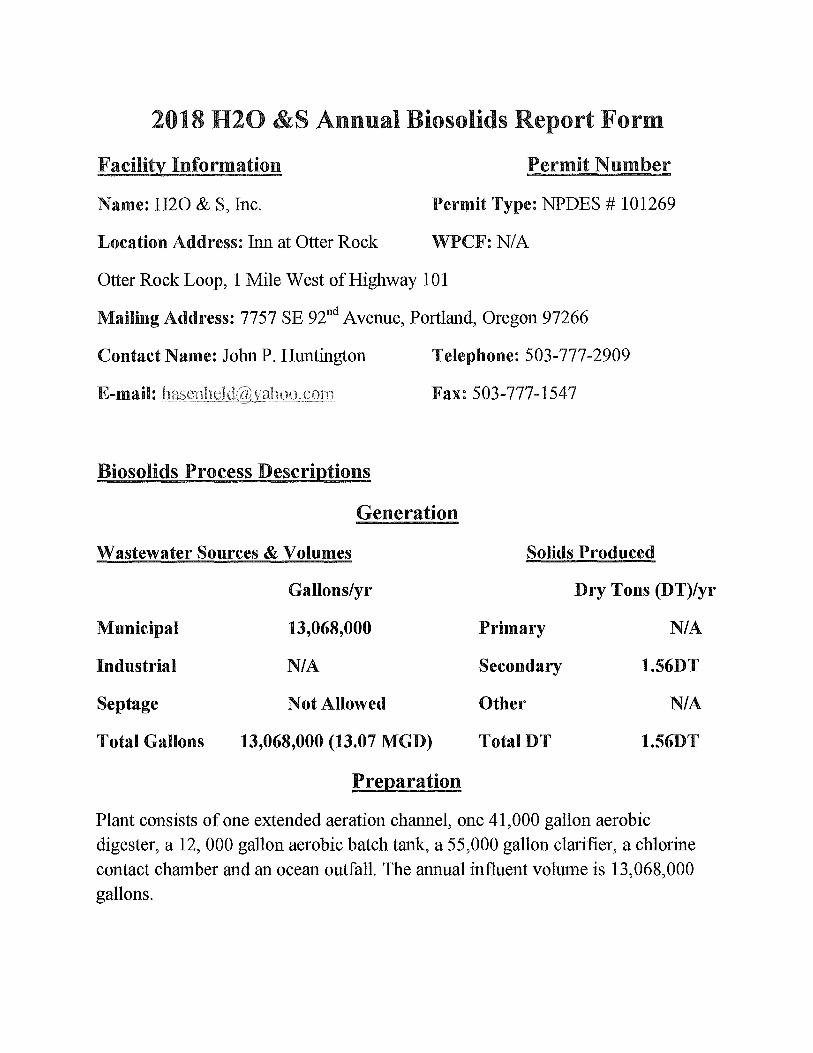
2018 H2O &S Annual Biosolids Report Form
Facility Information
Name: H2O & S, Inc.
Location Address: Inn at Otter Rock
Permit Number
Permit Type: NPDES # 101269
WPCF:N/A
Otter Rock Loop, 1 Mile West of Highway 101
Mailing Address: 7757 SE 92nd Avenue, Portland, Oregon 97266
Contact Name: John P. Huntington Telephone: 503-777-2909
Fax: 503-777-1547
Biosolids Process Descriptions
Generation
Wastewater Sources & Volumes
Gallons/yr
Municipal
Industrial
Septage
Total Gallons
13,068,000
NIA
Not Allowed
13,068,000 (13.07 MGD)
Preparation
Solids Produced
Primary
Secondary
Other
TotalDT
Dry Tons (DT)/yr
NIA
1.56DT
NIA
1.56DT
Plant consists of one extended aeration channel, one 41,000 gallon aerobic digester, a 12, 000 gallon aerobic batch tank, a 55,000 gallon clarifier, a chlorine
contact chamber and an ocean outfall. The annual influent volume is 13,068,000 gallons.
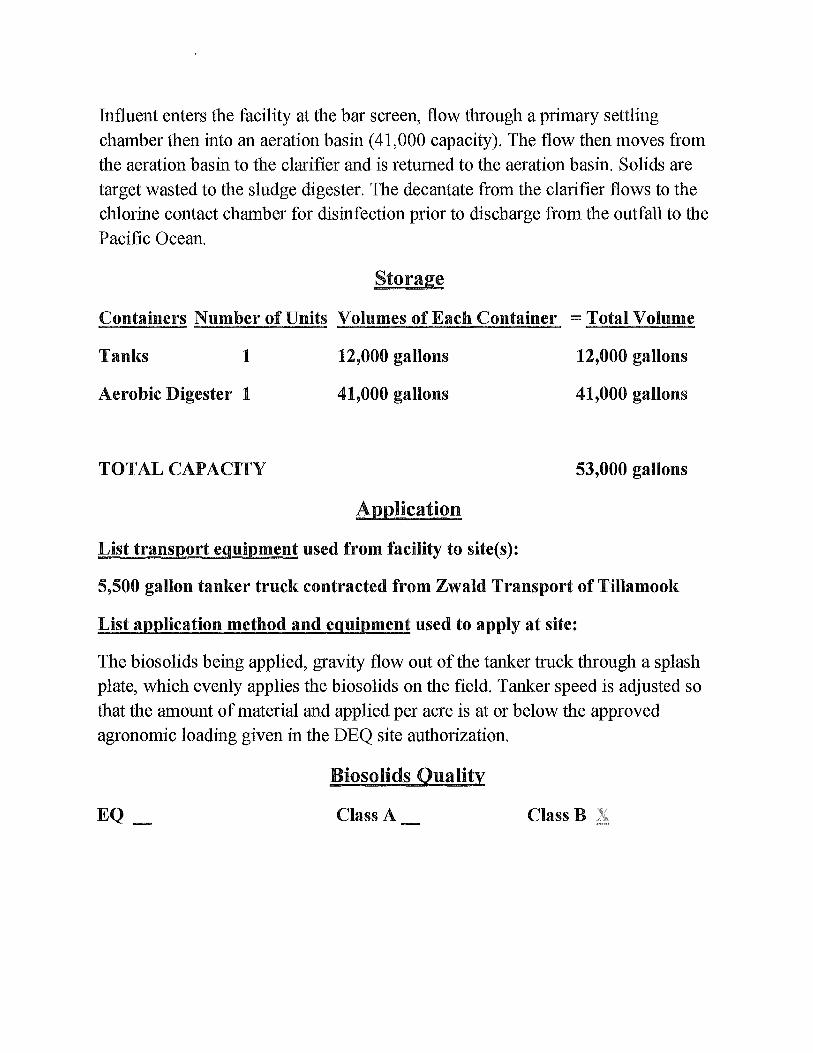
Influent enters the facility at the bar screen, flow through a primary settling chamber then into an aeration basin (41,000 capacity). The flow then moves from the aeration basin to the clarifier and is returned to the aeration basin. Solids are
target wasted to the sludge digester. The decantate from the clarifier flows to the chlorine contact chamber for disinfection prior to discharge from the outfall to the
Pacific Ocean.
Storage
Containers Number of Units Volumes of Each Container = Total Volume
Tanks 1
Aerobic Digester 1
TOTAL CAPACITY
12,000 gallons
41,000 gallons
Application
List transport equipment used from facility to site(s):
12,000 gallons
41,000 gallons
53,000 gallons
5,500 gallon tanker truck contracted from Zwald Transport of Tillamook
List application method and equipment used to apply at site:
The biosolids being applied, gravity flow out of the tanker truck through a splash plate, which evenly applies the biosolids on the field. Tanker speed is adjusted so that the amount of material and applied per acre is at or below the approved agronomic loading given in the DEQ site authorization.
EQ _
Biosolids Quality
Class A Class B
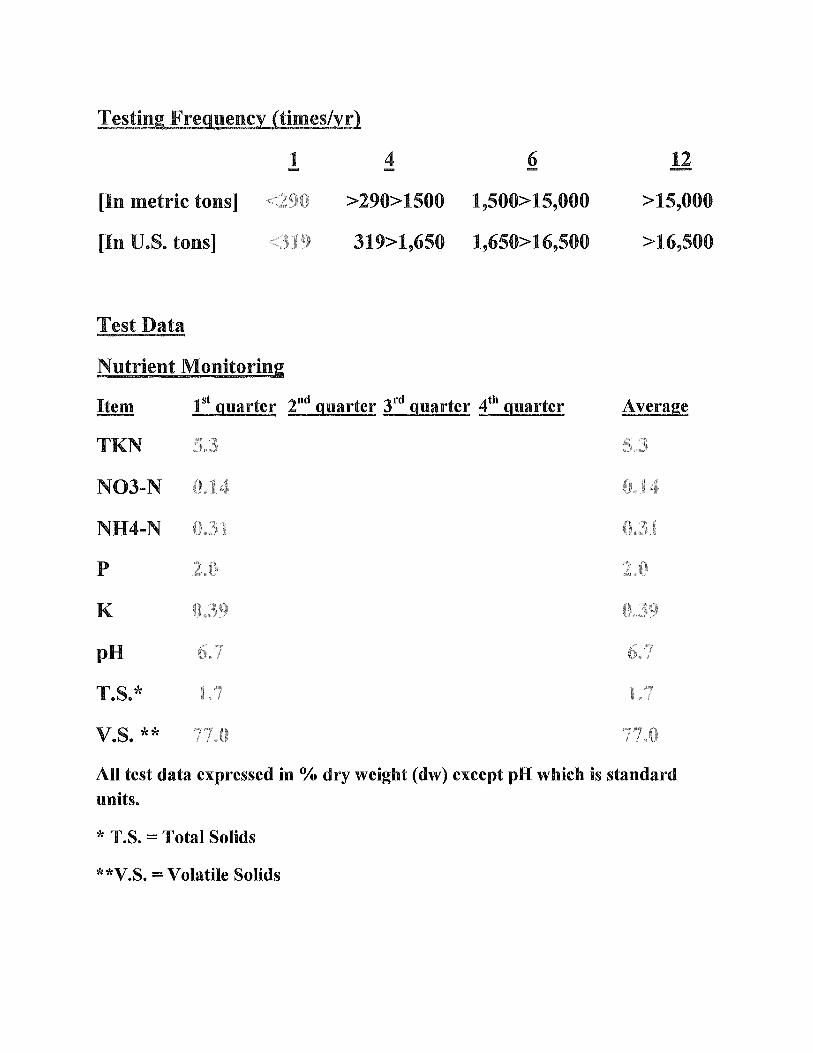
Testing Frequency (times/yr)
1 4 6 - -[In metric tons] <290 >290>1500 1,500> 15,000
[In U.S. tons] It, f 319>1.,650 1,650> 16,500
Test Data
Nutrient Monitoring
1st quarter 2nd quarter 3rd quarter 4th quarter
TKN
NO3-N
NH4-N
p
K
pH
T.S.*
v.s. **
5.3
0.14
0.31
2.0
0.39
,:. '7 u.,
L7
'77 t·•, .. { ' .
12
>15,000
>16,500
Average
- l !':'t ••.. 1
0.3 f
2.0
[,.., o. f
I. -,
! .. ,.,, !
'7·'"1 0 ! I • .. ,,
All test data expressed in% dry weight (dw) except pH which is standard units.
* T.S. = Total Solids
* *V.S. = Volatile Solids
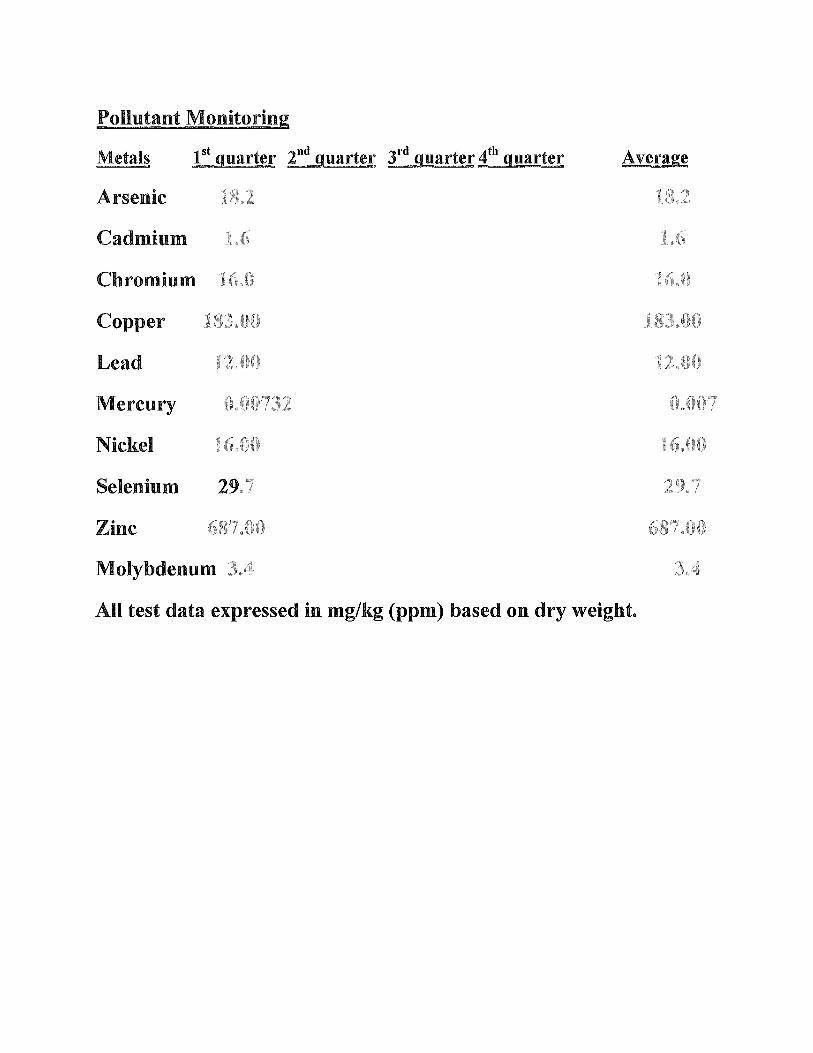
Pollutant Monitoring
Metals 1st quarter 2nd quarter 3rd quarter 4th quarter
Arsenic i 8.2
Cadmium I .fi
Chromium
Copper
Lead
Mercury
Nickel
Selenium
Zinc
183.00
i2J)O
0.00732
687.00
Molybdenum 3.4
Average
q;_; 2·· l O. ·
i
1 -:, ,f"(; I ..... u ,
(,87.00
3A
All test data expressed in mg/kg (ppm) based on dry weight.

Solids Treatment Processes
The EPA'S 40 CFR parts 503 and DEQ's Oregon Administrative Rules (OR) 340-50 allow permittees to use EPA approved alternatives to satisfy Class B biosolids pathogen or vector attl'action reduction criteria. The H2O & s WWTP uses the following approved methods for treatment of its biosolids:
A. Pathogen Reduction-Use of a process to significantly reduce pathogens (PSRP) 40 CFR 503.32(b )(3) Alt 2 #5. This involves sufficient use of an alkaline stabilization agent added to the sewage biosolids to raise the pH of the biosolids to 12 for 2:: 2 hours of contact (mixed).
B. Vector Attraction Reduction As above, the plant uses addition of alkali to achieve vectm· reduction (40 CFR 503.33(b)(6)). This involves the addition of sufficient alkali to raise the pH of the biosolids to at least 12 S.U.s at 25C and maintain a pH of 2:: 12 for 2 hours and a pH of2: 11.Sfor 22 more hours.

Biosolid Analysis Year
Source File No. Phone No. Contact
Lab analysis
at 22,000 gallons
Date •used in spreadsheet
Nutrient and metals analysis are an average of representative sampling events taken over the year biosollds are land applied.
Nutrient and metal concentrations are determined from the current year's representative solids analysis.
Site loading rates for nutrients and metal must be adjusted based on current analysis to meet authorized site loading rates.
COLOR KEY
SOLIDS ANALYSIS Cake Blosolld Liquid Biosolid % Total Solids % Volatile Solids
PATHOGEN REDUCTION Class A Biosolld Class B Blosolld
Fecal Coliform org.-100ml/1 dry gr.
requires entered value calculated value replace 1 with coefficient from selection
5,300
VECTRO ATTRACTION REDUCTION ,rnr;,ic<::Tir,~,
Volatile Solids Reduction Method
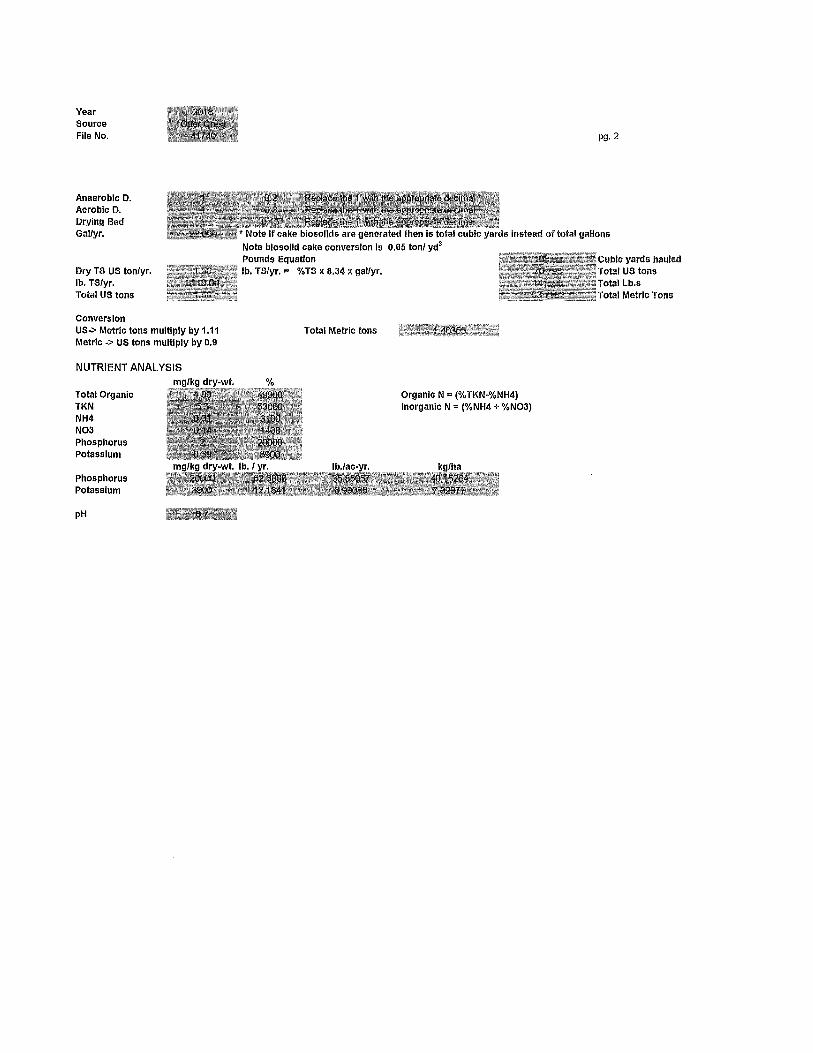
Year Source File No.
Anaerobic D. Aerobic D. Drying Bed Gal/yr.
Dry TS US ton/yr. lb, TS/yr. Total US tons
Conversion US-> Metric tons multiply by 1.11 Metric -> US tons multiply by 0.9
NUTRIENT ANALYSIS
Total Organic TKN NH4 NO3 Phosphorus Potassium
Phosphorus Potassium
pH
mg/kg dry-wt.
pg. 2
• Note If cake biosollds are generated then Is total cubic yards instead of total gallons Note blosolid cake conversion Is 0.65 ton/ yd3
Pounds Equation lb, TS/yr. = % TS x 8.34 x gal/yr.
Total Metric tons
% Organic N = (% TKN-%NH4) Inorganic N = (%NH4 + %NO3)
Cubic yards hauled ·~•Total US tons ''iTotal Lb.s cjTotal Metric Tons
Source File No,
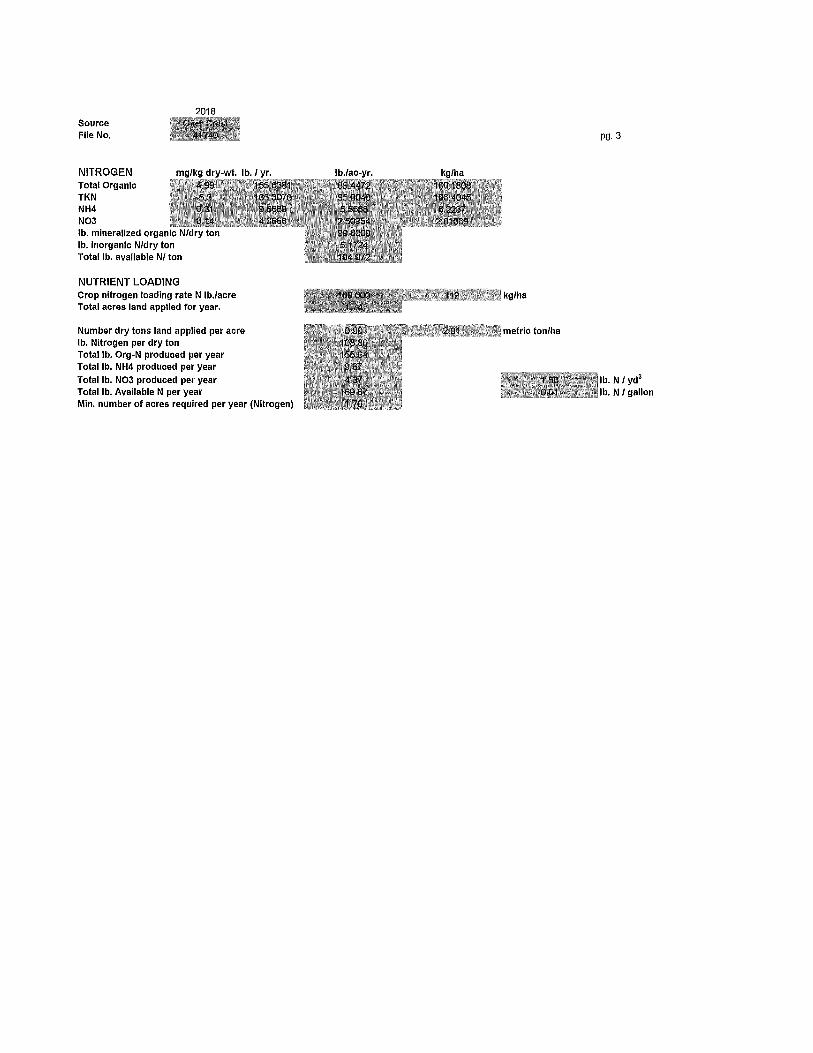
NITROGEN Total Organic TKN NH4 N03
mg/kg dry-wt. lb,/ yr.
lb. mineralized organic N/dry ton lb. Inorganic N/dry ton Total lb. available N/ ton
NUTRIENT LOADING Crop nitrogen loading rate N lb./acre Total acres land applied for year.
Number dry tons land applied per acre lb. Nitrogen per dry ton Total lb. Org-N produced per year Total lb. NH4 produced per year Total lb. N03 produced per year Total lb. Available N per year Min. number of acres required per year (Nitrogen)
lb.lac-yr. kg/ha
kg/ha
metric ton/ha
pg.3
lb. N / yd3
lb. N /gallon
Source File No.
2018
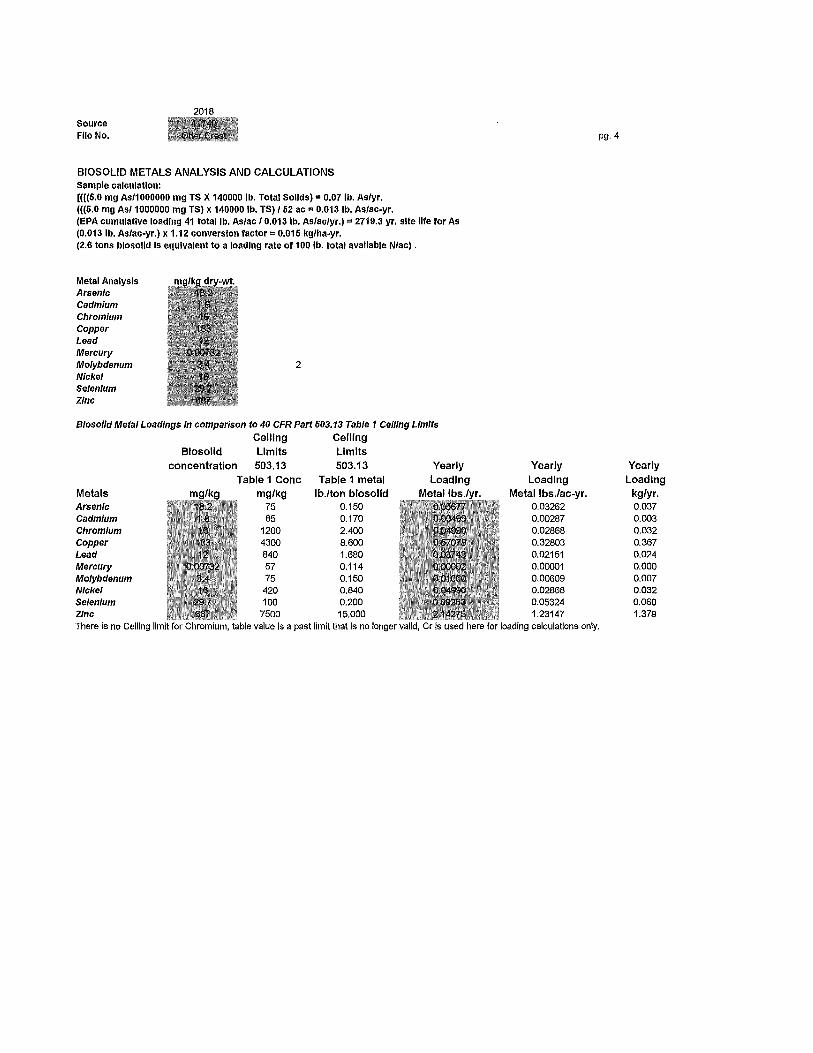
BIOSOLID METALS ANALYSIS AND CALCULATIONS Sample calculation: [([(5.0 mg As/1000000 mg TS X 140000 lb. Total Solids)= 0.07 lb. As/yr. (((5.0 mg As/ 1000000 mg TS) x 140000 lb. TS)/ 52 ac = 0.013 lb. As/ac-yr. (EPA cumulative loading 41 total lb. As/ac / 0.013 lb. As/ac/yr.) = 2719.3 yr. site life for As (0.013 lb. As/ac-yr.) x 1.12 conversion factor= 0.015 kg/ha-yr. (2.6 tons biosolid is equivalent to a loading rate of 100 lb. total available N/ac).
Metal Analysis Arsenic cadmium Chromium Copper Lead Mercury Molybdenum Nickel Selenium Zinc
2
Biosolld Metal Loadings In comparison to 40 CFR Part 503.13 Table 1 Celling Limits
Metals Arsenic Cadmium Chromium Copper Lead Mercury Molybdenum Nickel Selenium Zinc
Celling Ceiling Biosolid Limits Limits
concentration 503.13 503.13 Table 1 Cone Table 1 metal
mg/kg lb./ton biosolid 75 0.150 85 0.170
1200 2.400 4300 8.600 840 1.680 57 0.114 75 0.150 420 0.840 100 0.200
7500 15.000
Yearly Loading
Metal lbs.lac-yr. 0.03262 0.00287 0.02868 0.32803 0.02151 0.00001 0.00609 0.02868 0.05324 1.23147
pg.4
There is no Ceiling limit for Chromium, table value is a past limit that is no longer valid, Cr is used here for loading calculations only.
Yearly Loading
kg/yr. 0.037 0.003 0.032 0.367 0.024 0.000 0.007 0.032 0.060 1.379
Source File No.
2018
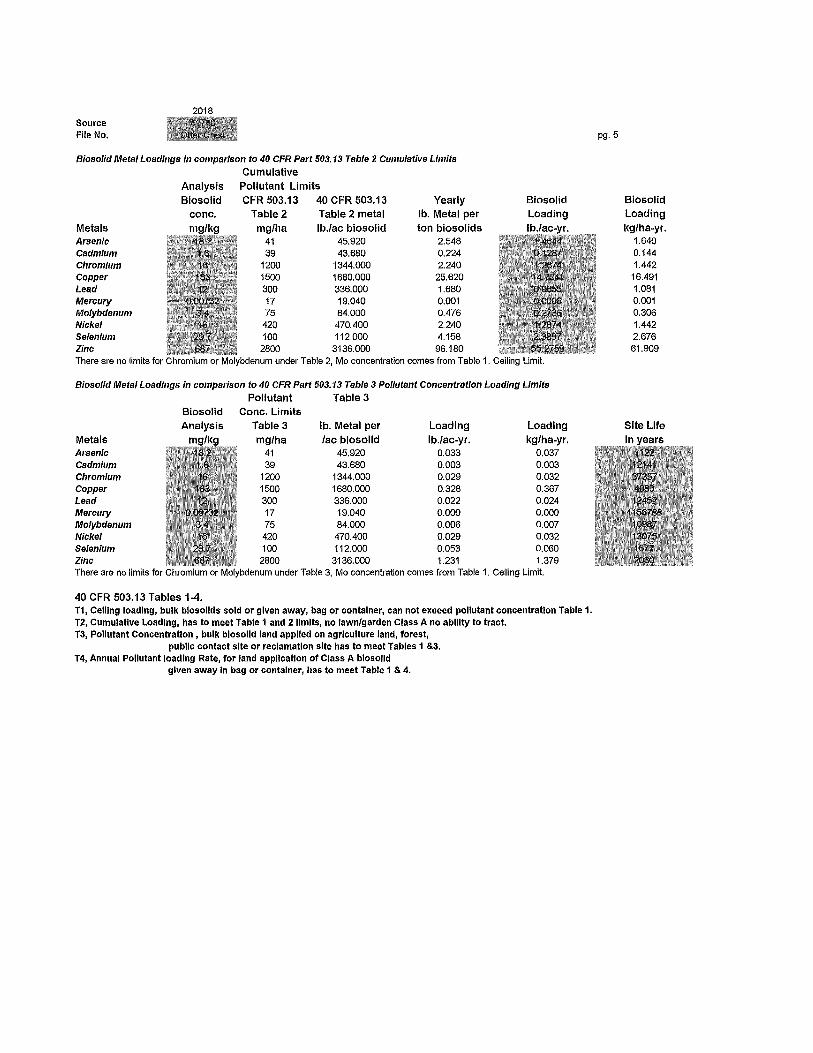
Biosolid Metal Loadings In comparison to 40 CFR Part 503.13 Table 2 Cumulative Limits Cumulative
Metals Arsenic Cadmium Chromium Copper Lead Mercury Molybdenum Nickel Selenium Zinc
Analysis Pollutant Limits Biosolid CFR 503.13 40 CFR 503.13 Yearly
Table2 mg/ha
41 39
1200 1500 300 17 75
420 100
2800
Table 2 metal lb.lac biosolid
45.920 43.680
1344.000 1680.000 336.000 19.040 84.000 470.400 112.000
3136.000
lb. Metal per ton biosolids
2.548 0.224 2.240
25.620 1.680 0.001 0.476 2.240 4.158 96.180
Biosolid Loading lb.lac-yr.
There are no limits for Chromium or Molybdenum under Table 2, Mo concentration comes from Table 1. Ceiling Limit.
Biosolld Metal Loadings in comparison to 40 CFR Part 503.13 Table 3 Pollutant Concentration Loading Limits Pollutant Table 3
Cone. Limits Table3 lb. Metal per Loading Loading
Metals mg/ha lac biosolid lb.lac-yr. kg/ha-yr. Arsenic 41 45.920 0.033 0,037 Cadmium 39 43.680 0.003 0.003 Chromium 1200 1344.000 0.029 0.032 Copper 1500 1680.000 0.328 0.367 Lead 300 336.000 0.022 0.024 Mercury 17 19.040 0.000 0.000 Molybdenum 75 84.000 0.006 0.007 Nickel 420 470.400 0.029 0.032 Selenium 100 112.000 0.053 0.060 Zinc 2800 3136.000 1.231 1.379 There are no limits for Chromium or Molybdenum under Table 3, Mo concentration comes from Table 1. Ceiling Limit.
40 CFR 503.13 Tables 1-4. T1, Ceiling loading, bulk biosollds sold or given away, bag or container, can not exceed pollutant concentration Table 1. T2, Cumulative Loading, has to meet Table 1 and 2 limits, no lawn/garden Class A no ability to tract. T3, Pollutant Concentration , bulk biosolld land applied on agriculture land, forest,
public contact site or reclamation site has to meet Tables 1 &3. T4, Annual Pollutant loading Rate, for land application of Class A biosolid
given away in bag or container, has to meet Table 1 & 4.
pg.5
Biosolid Loading kg/ha-yr.
1.640 0.144 1.442
16.491 1.081 0.001 0.306 1.442 2.676 61.909
Site Life in years

~lNttlYriCAL l..'100RAT0fh' OROUP
July 25, 2018
John Huntington H20 & S, Inc. 7757 SE 92nd Ave. Portland, OR 97266 TEL: (541) 992-0622 FAX (541) 764-2206
RE: Inn at Otter Crest
Dear John Huntington:
ALG ORELAP ID #OR/00012
361 West 5th Ave Eugene, OR 97401
T1'.,1,: (541) 485-8404 FAX.' (541) 484-5995 Website:
Order No.: l 806D46
Analytical Laboratory Group received 3 sample( s) on 6/27/2018 for the analyses presented in the following report.
The analysis was perfonned according to our laboratory's NELAP/TNI-approved quality assurance program. Any exceptions to this quality assurance program are noted on the case narrative.
Testing methods used are sufficiently sensitive enough to meet the requirements that support client/permittee NPDES permits that we have on file. The client is responsible for reviewing reports. The permittee is responsible for meeting permit limits.
Quality control data is within laboratory defined or method specified acceptance limits except if noted on the case narrative.
If you have any questions regarding these tests results, please feel free to call.
Kimberly Reever Morghan
Quality Manager 361 West 5th Ave Eugene, OR 97401
Original Page 1 of6
ANALYJ ICAl L,llWFL,ffVfW enoVP
WO#: CLIENT:
Project:
1806D46
H20 & S, Inc.
Inn at Otter Crest
ALG ORELAP fl) IIORJ000J2
361 West 5th Ave
Eugene, OR 97401 TEL: (541) 485-8404 FAX· (541) 484-5995
Website:
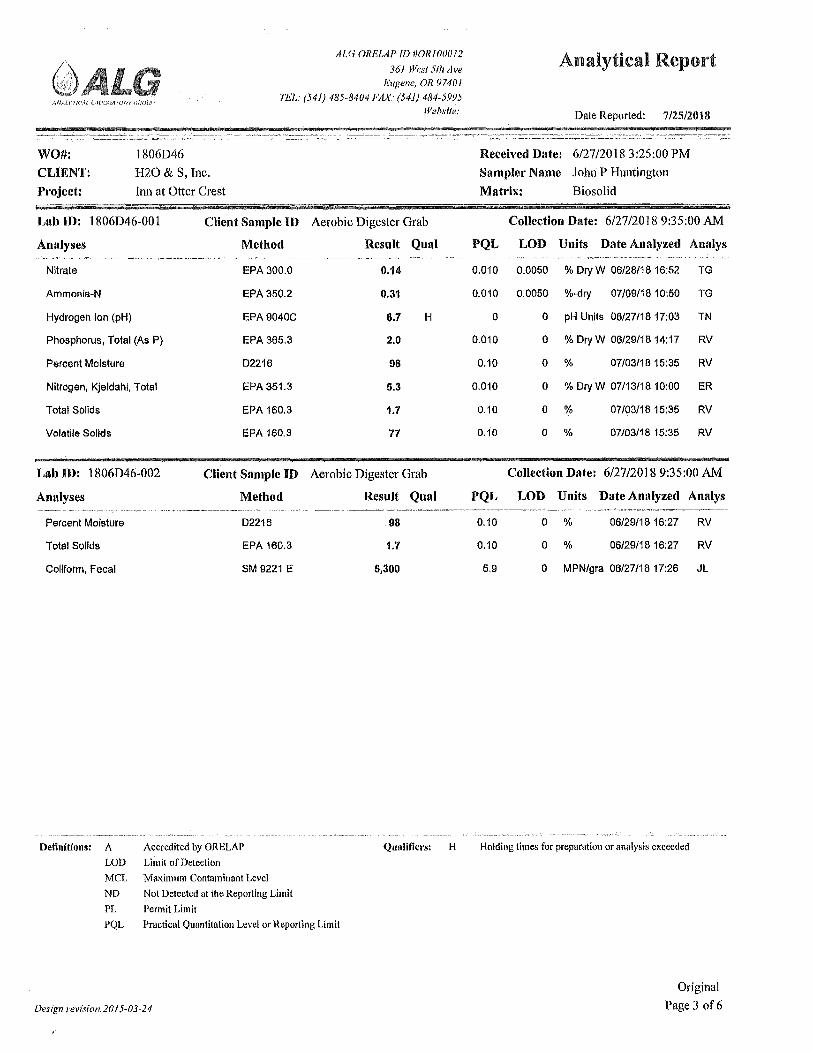
Lab ID: 1806D46-001 Client Sample ID Aerobic Digester Grab
Analyses Method Result Qual ··-~~---- -----------~ -------------·-
Nitrate EPA300.0 0.14
Ammonia-N EPA350.2 0.31
Hydrogen Ion (pH) EPA 9040C 6.7 H
Phosphorus, Total (As P) EPA365.3 2.0
Percent Moisture D2216 98
Nitrogen, Kjeldahi, Total EPA351.3 5.3
Total Solids EPA 160.3 1.7
Volatile Solids EPA 160.3 77
Lab ID: 1806D46-002
Analyses
Client Sample ID Aerobic Digester Grab
Method Result Qual
Percent Moisture
Total Solids
Coliform, Fecal
D2216
EPA 160.3
SM 9221 E
Definitions: A Accredited by ORELAP LOD Limit ofDetection
MCL Maximum Contaminant Level ND Not Detected at the Reporting Limit
PL Permit Limit PQL Practical Qunntitntion Level or Reporting Limit
Design revision. 2015-03-24
98
1.7
5,300
Qualifiers: H
Analytical Report
Date Reported: 7/25/2018
Received Date: 6/27/2018 3:25:00 PM
Sampler Name Jolm P Hlmtington
Matrix: Biosolid
Collection Date: 6/27/2018 9:35:00 AM
PQL LOD Units Date Analyzed Analys
0.010 0.0050 % Dry W 06/28/18 16:52 TG
0.010 0.0050 %-dry 07/09/1810:50 TG
0 0 pH Units 06/27/18 17:03 TN
0.010 0 % Dry W 06/29/18 14:17 RV
0.10 0 % 07/03/18 15:35 RV
0.010 0 % Dry W 07/13/18 10:00 ER
0.10 0 % 07 /03/18 15:35 RV
0.10 0 % 07/03/18 15:35 RV
Collection Date: 6/27/2018 9:35:00 AM
PQL LOD Units Date Analyzed Analys
0.10
0.10
5,9
0 % 06/29/1816:27 RV
0 % 06/29/18 16:27 RV
0 MPN/gra 06/27/18 17:26 JL
Holding times for preparation or analysis exceeded
Original Page 3 of6
7/24/2018
Cynthia O Kelley Analytical Laboratory Group, Inc. 361 West Fifth Avenue
Eugene, OR 97401
TEL: (800) 262-5973
FAX: (541) 484-5995
RE: 1806D46
Dear Cynthia O Kelley:
·' i
Environmental Testing Laboratory
Order No.: 1806C55
Neilson Research Corporation received 1 sample(s) on 6/29/2018 for the analyses presented in the following report.
The results relate only to the parameters tested or to the sample as received by the laboratory. This report shall not be reproduced except in full, without the written approval of Neilson Research Corporation. If you have any questions regarding these test results, please feel free to call.
Sincerely, NeiJson Research Corporation
_ __,,.,'
Tamra R. Schmedemann
Project Manager
245 S Grape St , Medford, OR 97501 1 (541) 770-5678 400 SE G St, Suite B , Grants Pass, OR 97526 A (541) 479-4053
nrclabs.com
Page 1 of 10
Neilson esearch Corporation 245 South Grape Street, Medford, Oregon 97501 541-770-5678 Fax 541-770-2901
Analytical Laboratory G1·oup, Inc, 361 West Fifth Avenue
Eugene, OR 97401
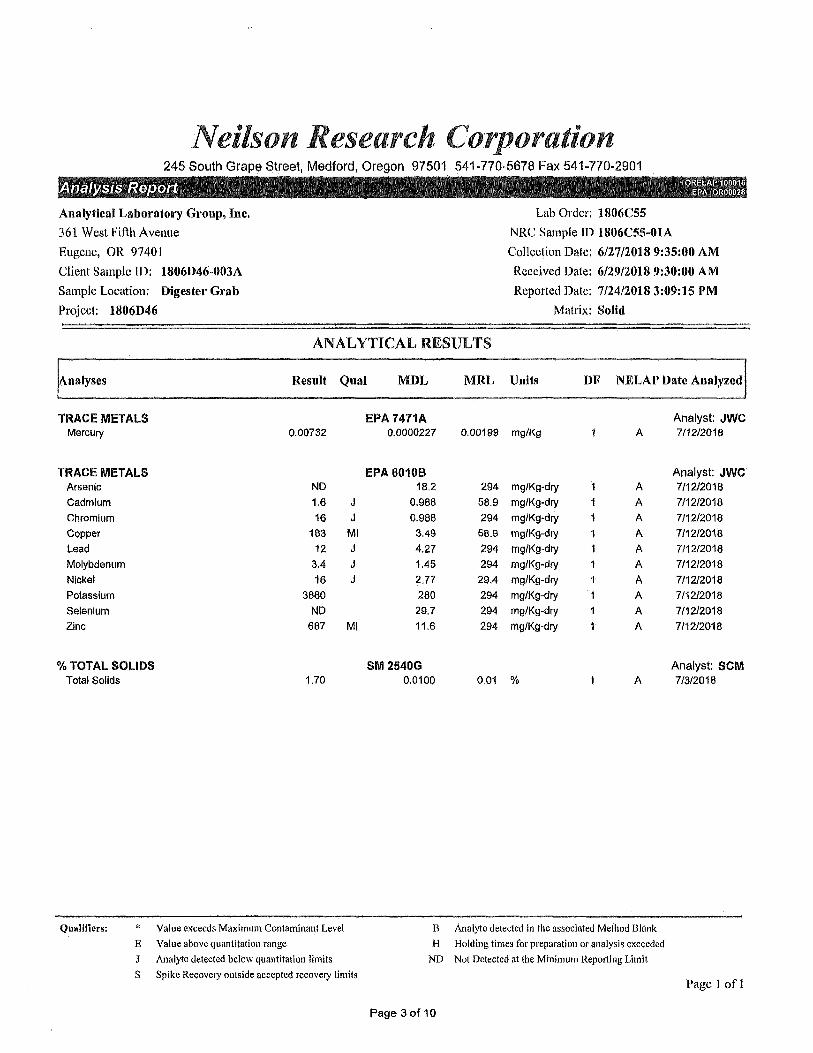
Client Sample ID: 1806D46-00JA
Sample Location: Digester Grab
Project: 1806D46
Lab Order: 1806C55
NRC Sample ID 1806C55-01A
Collection Date: 6/27/2018 9:35:00 AM
Received Date: 6/29/2018 9:30:00 AM
Reported Date: 7/24/2018 3:09:15 PM Matrix: Solid
ANALYTICAL RESULTS
Analyses Result Qnal MDL MRL Units DF NELAP Date Analyzed
TRACE METALS Mercury
TRACE METALS Arsenic
Cadmium
Chromium Copper
Lead Molybdenum Nickel
Potassium
Selenium
Zinc
% TOTAL SOLIDS Total Solids
0.00732
ND 1,6
16 183
12
3.4
16 3880
ND 687
1.70
Qualifiers: * Value exceeds Maximum Contaminant Level E Value above quantitation range
J Analyte detected below quantitation limits
J J
Ml J J J
Ml
S Spike Recovery outside accepted recovery limits
EPA 7471A 0.0000227
EPA 60108 18.2
0.988 0.988
3.49
4.27 1.45 2,77
280 29.7 11,6
SM 2540G 0.0100
0.00199 mg/Kg
294 mg/Kg-dry
58.9 mg/Kg-dry
294 mg/Kg-dry
58.9 mg/Kg-dry
294 mg/Kg-dry 294 mg/Kg-dry
29.4 mg/Kg-dry
294 mg/Kg-dry
294 mg/Kg-dry
294 mg/Kg-dry
0,01 %
A
1 A 1 A 1 A
1 A
1 A 1 A
A 1 A 1 A
A
A
B Analyte detected in the associated Method Blank
H Holding times for preparation or analysis exceeded ND Not Detected at the Minimum Reporting Limit
Page 3 of 10
Analyst: JWC 7/12/2018
Analyst: JWC 7/12/2018
7/12/2018 7/12/2018
7/1212018 7/12/2018
7/12/2018
7/12/2018 7/12/2018
7/12/2018
7/12/2018
Analyst: SCM 7/3/2018
Page 1 of 1
l\nalytical Laboratory (;roup, Inc. ! Jt,t wr;::s-1 1' ffTH A VENUE
EL'GF:NE, OREGON 97401
8D0-162-5tJ7 3/54 l-"85-8404 fit:,. 541-484-599:i Em.nil: 11l~h1 h.,(ti! algl ah.'li1H:.com
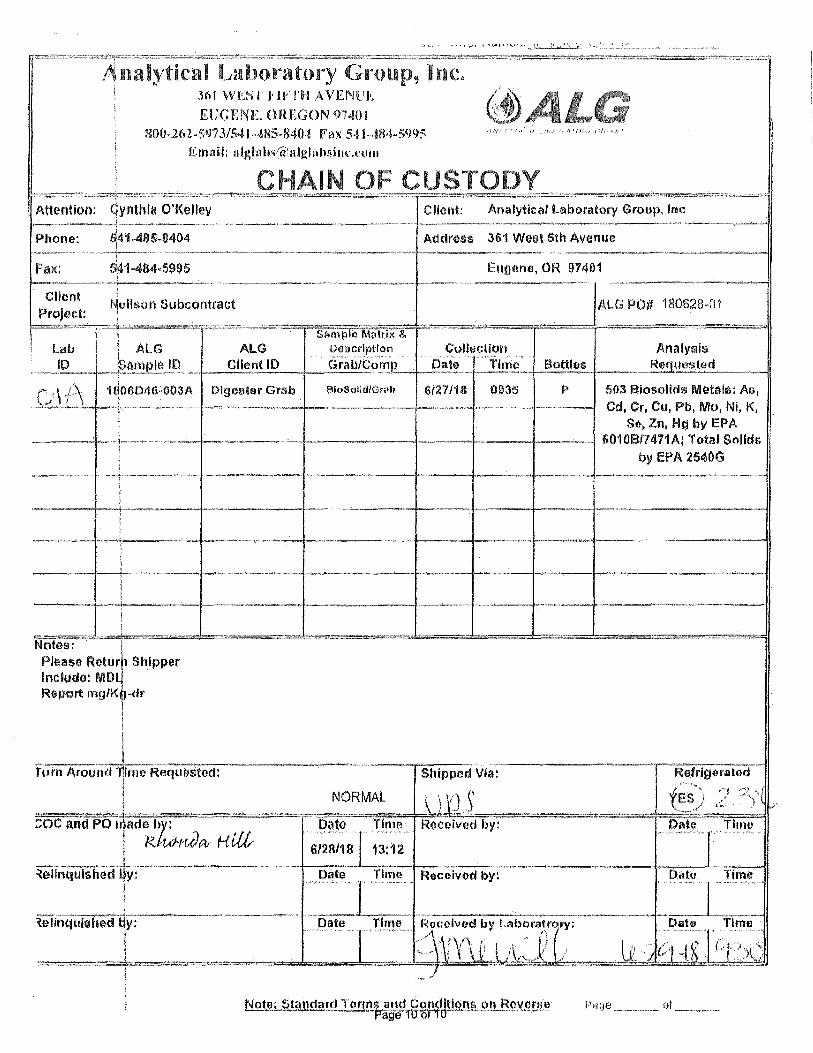
C Attention: qynthla O'Kelley
Phone:
Fax:
Client Project:
·: \
Neilson Subcontract
~·· 1 ALG ALG
· ID . Sample m Client ID i
1 qo6D46,003A Digester Grab \ C)\f\
St:irnplo M<1lrlx & Oeacrlptfon
Grab/Com~
Client: Analytical Laboratory Group, Inc
Address 361 West 5th Avenue
Eugene, OR 97401
'AL~ PO# 180628-Clt
CullacHon Date ,, Time Bottles
Analysis Rec uested
SioSolld/Grab G/27118 0935 p 503 Biosolids Metals: As1
Cd, Cr, Cuj Pb, Mo, Ni, K, s~. Zn, Hg by EPA
1---------1·.·----+------1----·~ 6010817471A; Total Solids by EPA 2540G
-----~--------~·-·--··----------~~~,
--------------"· --1-----1---
TUrn A,ound i"'" Requostod:
coc and pQ,ad~,:u),v Hut-·
~ellnquished *y: l
~elinqulshed t:Jy: l \ !
Shipped Via:
NORMAL , '\ rJ S .. Date Tirnn Roceived by:
6/28/18 13:12
.. ,i;>~•~... Time Receivod by:
Note: Standard TMms and Conditions on Rovorae · Page 10 of 10 ~. ·--~
Refriger.11tod
t,es) Date, · ihm,

Lab Order Number~J:Jc >l·)' )1---l(;.)
Analytica1 Laboratory Group, h1c. 361 WEST FIFTH AVENUE EUGENE, OREGON 97401
800-262-5973/541-485-8404 Fax 541-484-5995 Email: [email protected]
HAIN 0 cu , , ~, / 'i ' / ' i, ;.
DY Attention: John Huntington Client: H20 & S, Inc.
Phone: 503-667-6735 Address: 7757 SE 92nd Avenue
Email: [email protected] City, Slate, P rtl nd OR 97266 Zip o a '
!\lPlJC
')J
------· ·------------·~---------------~~ ~-------------.·--"~----------•--· - ---Client Sampler: Print Sampler: Signature
ll=P=ro==j=e=ct=: ==--=ln=n=a~=O=tt=e,;;;~=:=:=•p=S:=e-=M=a=tr=ix===c=ol=le*c=U=;=;=c=·,\.;;.=F,:~=-~=•='·=·~~=. "="'=-~=1\,'v-<'='>\~=· ==-IF· ;;::=:!:\=~·: )~'½i'° ~:,~:~:::a~,:. . Client ID & Grab/Comp . 6ate ...... Tfme ... --~nalysis RequeSted Typo . .# - Pres T 0c Lab ID--
.. I ·\ ;'\,•· l:·: l ' ' /. L -... ~.l~'-cl,,_ t."·_· __ l~c-~(~_ .. _ _,__B_i_os_o_lid_lG-rab -"'~l'_:z;;{_,-\"------~
✓ Ptx ;lo\, ,, (J {'}'2;, / 11::o t / ~ I w
--+a-----~-~-+-1---1-+'-'>-,-l--------l-~-
(p 1~-=r- kf
1.)' _ "!~ <;; 503 Biosollds
",_ ·~s N03 pH TS VS PMoist J 1 ~t~ ():)IA -~~-==---~ -=--~--· -
~\,J,~ NH3 TP TKN JS 1 H2S04 <cK ._CCdn Metals: As Cd Cr Cu Pb (t ··•;":\ p 1 q,-➔
. _..., ':,f'; q ,_ ::.~s, Mo Ni K Se Zn Hg (::);;; ·f::c
-
,~., ,"::,-:',, Biosolids Fecal Coliform SSC
Notes: . ~ Preservation Cnec1< Deliver to 1·-ab-no-l-at-er-th_a_n_6_h_ou-rs_f,_,ol-lo_w_in-g-sa_m_p_le_c_o_lle-ct-io_n_. -Pl-ea_s_e -no_ti_fy-th-e lab 1-n ::-=--=-L-a_b-=-1-D_ -_-_;~_-D~-_at_~rr_"'i_m_e +P_re_-P_r_es_e_rve_d.i---'p'-H_, ___ --1_-T_;_c~~ advance. Fill sample containers completely and refrigerate samples.
__ lwe. ~g b? c,\h&~-- . k?.,,{/\ ogfo~1_18_-1_--t----,---------11 11---~----,-,.-.--"r l I
-------~-------- --, ,,v,J-.\t .. l :q:: ,i--------------'~~~=-·M;...,::e,.,,,"~="'-·----111----1----4------ ___ ,__ __ ___,,_ __ .,
{j 11------··-·------------...a·,,;.__ ______ H ___ .. _ ~-i•-~--1-----+----+-----il
11---------------------------fl----t------t----lf-----1----
turn Around Time Requested (Rush incurs a Surcharge): Ship1:1jd Via: Refrigerated
1¥1 NORMAL □ RUSH ,/-1,l c;;; (];v;z1 t~ ~
H20 & S 2-5-18 Page ___ of __ _
flJ
1,,?
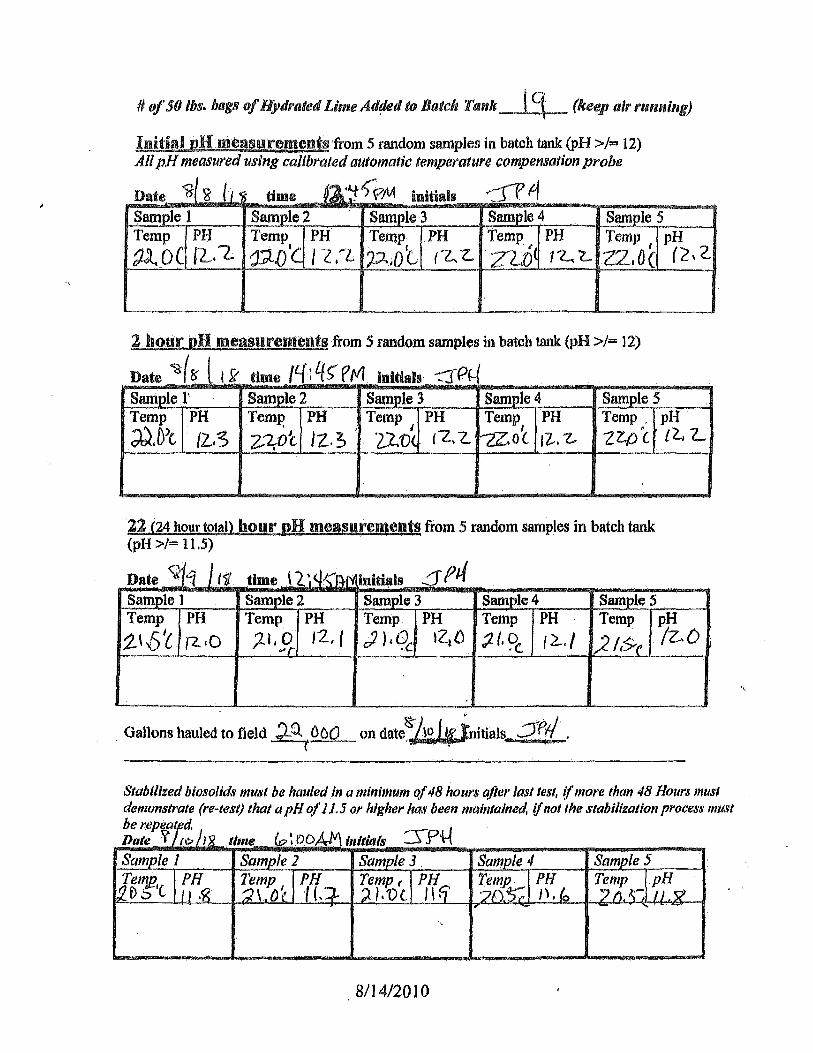
# of 50 lbs. bags of Hydrated Lime Ad¢ed to Batch Tank I ~ (keep air running)
Initial pH measurements from 5 random samples in batch tank (pH>/= 12) All pH measured using caiibrated automatic temperature compensation probe
Date ,g/ g l, time 6:l•~i)(?,M initials .. Sf~ Sample 1 Sample2 Sample 3 Sample4
~ Sample 5
Temp PH Temp PH Temp PH Temp PH Temp pH ~O( /2,L j;t.0
1
C /'Z tl. µlot (7-. -z.. '~ t
('2,, 2 7Ui 11.... 'Z... Z2,0(
2 hour pH measurements from 5 random samples in batch tank (pH >/= 12)
Date ~r8' l 1 ~ time /'-{:4~Pfll initials· -::TPf-. Sample 1' Samvle2 Sample 3 Sample 4 Sample 5 Temp PH TemP. PH Temp PH Temp PH Temp.
~.D'l I ' •
(2/$ z_~ot Jz.s 2:LV< (l,-Z.. '--ZZ,.O( ,i.-z.. ZZ.f) C
22 (24 hour total} hour .nH measurements from 5 random samples in batch tank {pH >/= 11.5)
Date ~'1 / 11 time \ 2 ~ <Jt(A,N hdti~ls 5()4 Sample 1 Sample2 Sample 3 Samt,le4 Sample 5 Temp PH Temp PH Temp PH Temp PH Temp
'2..\ ✓51
l ,-i..,O ;21,0 ... , J2,' d ),QC 12.iD j(.~C, ,~., ;2 f,>-c
. Gallons hauled to field ~~\ 060 on date~,\~J~ lnitials ::fft/ .
pH (2-1 L
pH (z.D
Stabilized blosolids must be hauled in a minimum of 48 hours after last test, if more than 48 Hours must demonstrate (re-test) that a pH of 1 J.5 or higher has been maintained if not the stabilization process must he repeat. d Date Y t.t> J time lo~ ODA/1 l11itlals :S--P'{-{
Sam le 5
8/14/2010
Attachment D:
"l \!t."1 tit}\ uud1>r penalty of law, tbut lhe patltoicn 1equu:01llf.lH'¾ iu 503 .32(b)(2) altc111otivi: J ., lhu mrinfl~cnwn1 prncticcs in 503.14 nud tho vccloi nUn1cliou unluctiou roqnirnmen1i. in ~0~.33(b)( l) ha,1e been met. TM11 detenninatfon tuu. been m~de ,mrier my c\irnction nud supm-vii;ion in accor<lw1i:e with the sy1;tem dc1:1ig11ed to emmre that qunliH~d pi.,ri.1.'JUH'll 1,ropcl'ly ~ath~t· mid evaluate tltc iu:formntiou u~cd to LlotonuiwJ thal t]11! pulhugcu reqnirem.cn1s and vcct<.w attraction reduction rcqniroment!'I have been mot l nls<l ce1'tii)' tlmt oll l>ioi;oli<l» we1·e land a1>plied ~l tbe ttp})):ov~d ag.rouumfo loadiug rnto uot~d iu. thtl rn:,;pcetivo DcJ)nrtmcnt &ito antlUJti7.ation \utter. 1 am 1,w~·IJ 1lmt Own: m·c }lit-1nitfomn pe1mltie~ tor foli:.e ce1tificntion including the poi;.~ibili::y of fine mid im.pri8omnen.l.''
P,,gc 28 U.!O&K Inc •. FN" ·l 17,HI fJiu1>01itli; Mm1ag.ime111 Phm Wl