Embed Size (px)
Citation preview

John Dorrer, Director
Center for Workforce Research andCenter for Workforce Research and
Information Information
Demographics and the Workforce Demographics and the Workforce � The U.S. workforce will continue to increase in size but at a
considerably slower rate than in the past. considerably slower rate than in the past.
� During the 1970s, the workforce grew 2.6 percent � During the 1970s, the workforce grew 2.6 percent annually, declining to 1.1 percent growth in the 1990s. Between 2000 and 2010, the annual growth rate is projected to equal that of the 1990s.to equal that of the 1990s.
� It is projected to slow in the next decade to just 0.4 � It is projected to slow in the next decade to just 0.4 percent and in the following decade to only 0.3 percent.percent.
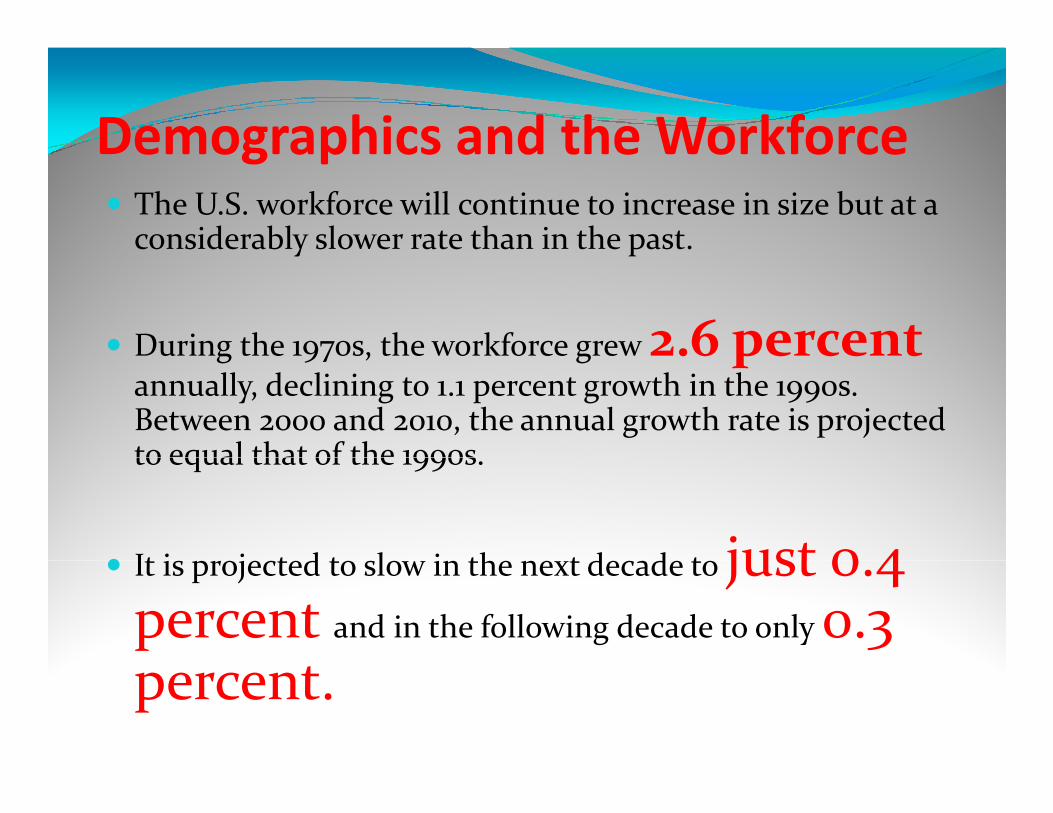
Labor Force Growth Will Continue to Slow in Mainein Maine
Labor Force GrowthLabor Force Growth
23%
15%
19%
8%
5% 5%5%
1%
1946-56 1956-66 1966-76 1976-86 1986-96 1996-06 2006-16
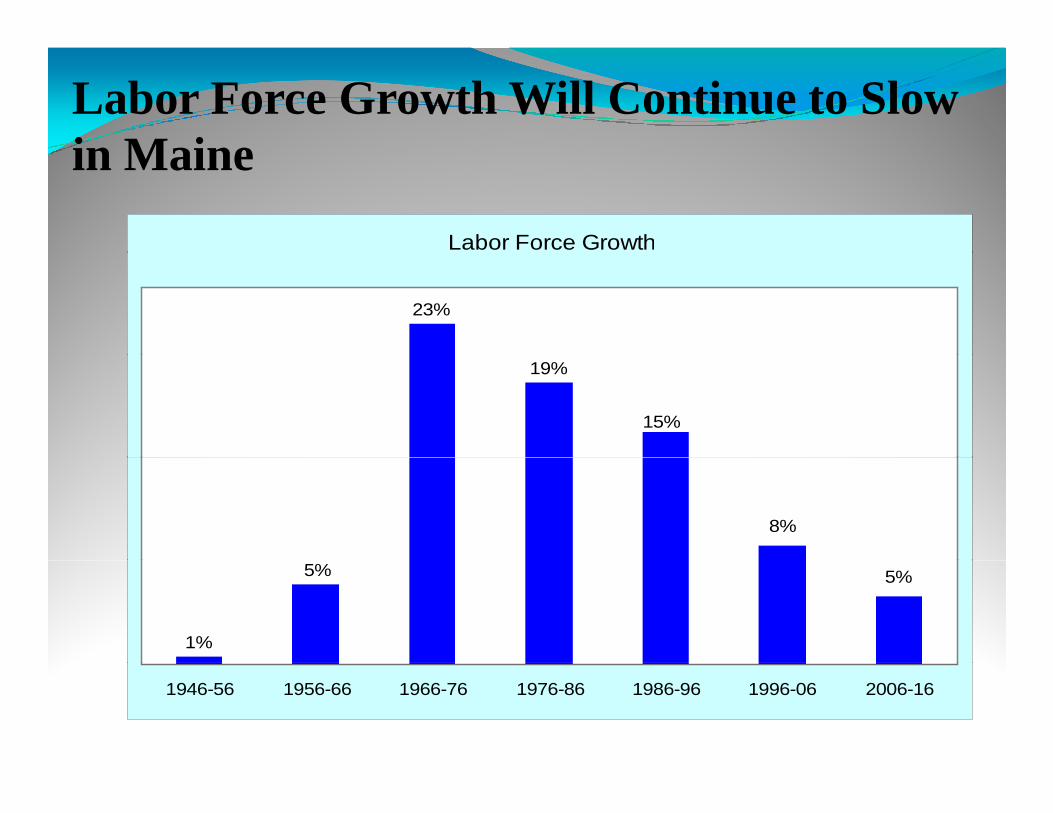
Labor Force Participation Rates Have Peaked in MaineLabor Force Participation Rates Have Peaked in Maine
Labor force participation rates by gender
80%
60%
70%
40%
50%
30%
40%
Male Female Total20%
1950 1960 1970 1980 1990 2000 2007 2016
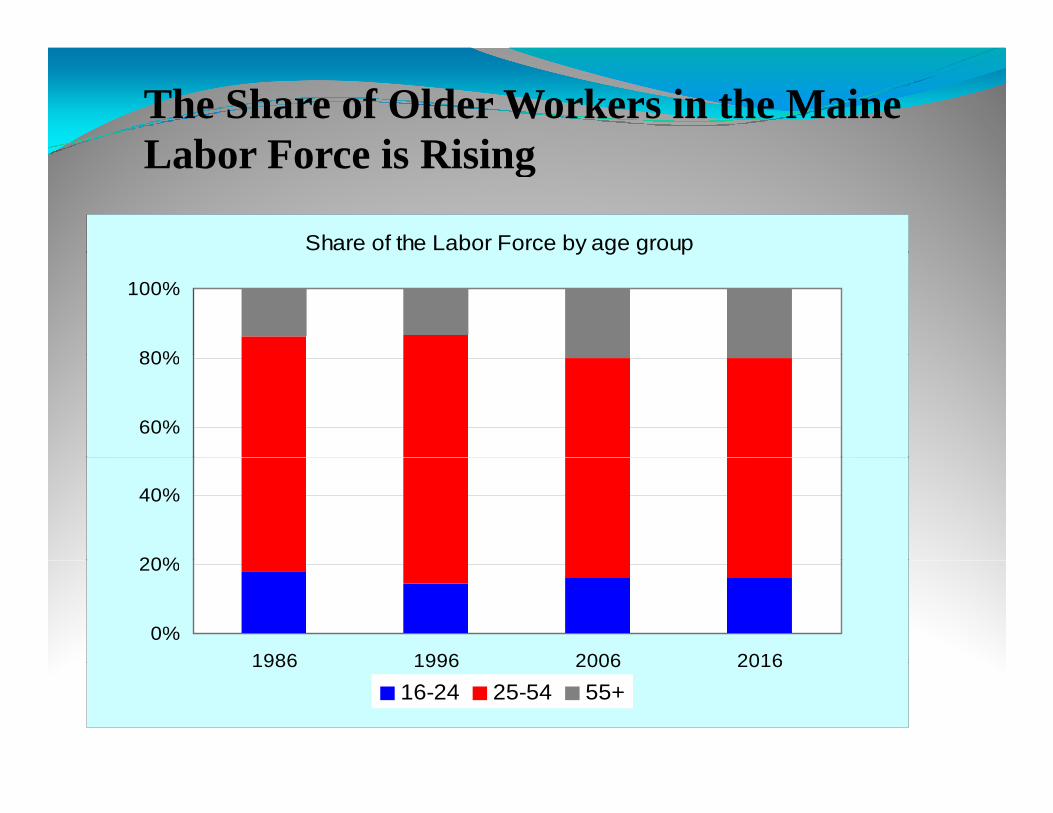
The Share of Older Workers in the Maine Labor Force is RisingLabor Force is Rising
Share of the Labor Force by age groupShare of the Labor Force by age group
80%
100%
60%
80%
20%
40%
0%
20%
1986 1996 2006 20161986 1996 2006 2016
16-24 25-54 55+
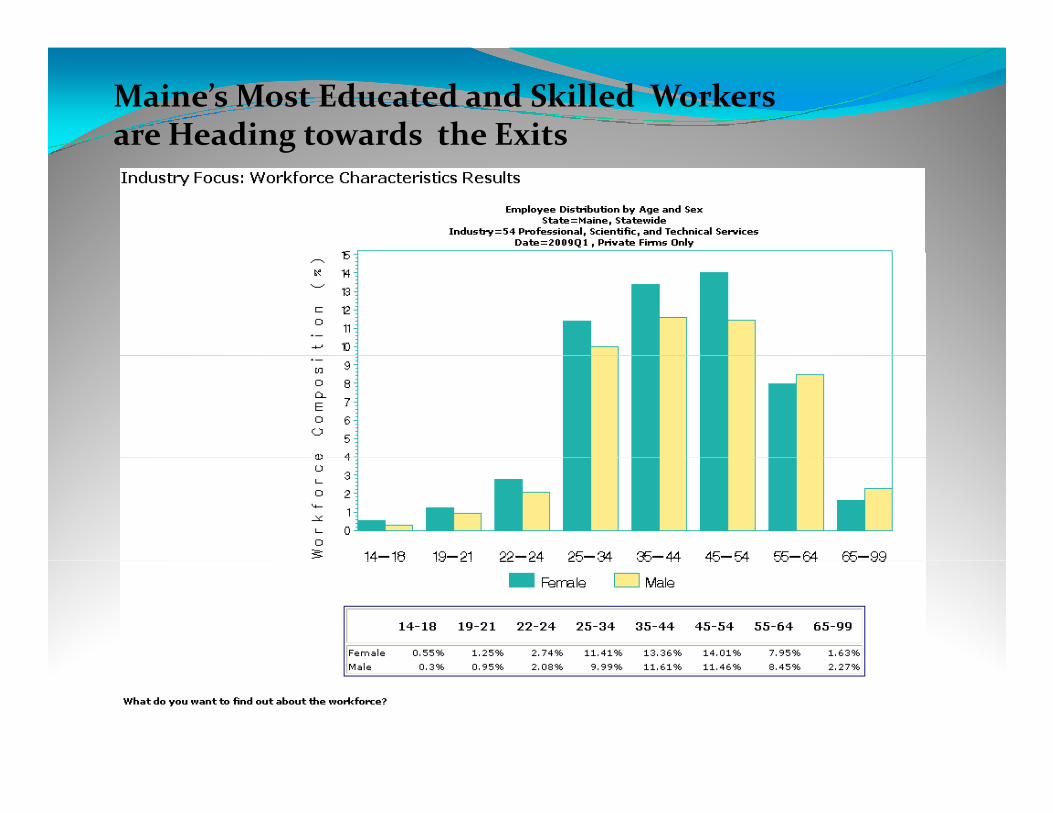
Maine’s Most Educated and Skilled Workers are Heading towards the Exitsare Heading towards the Exits
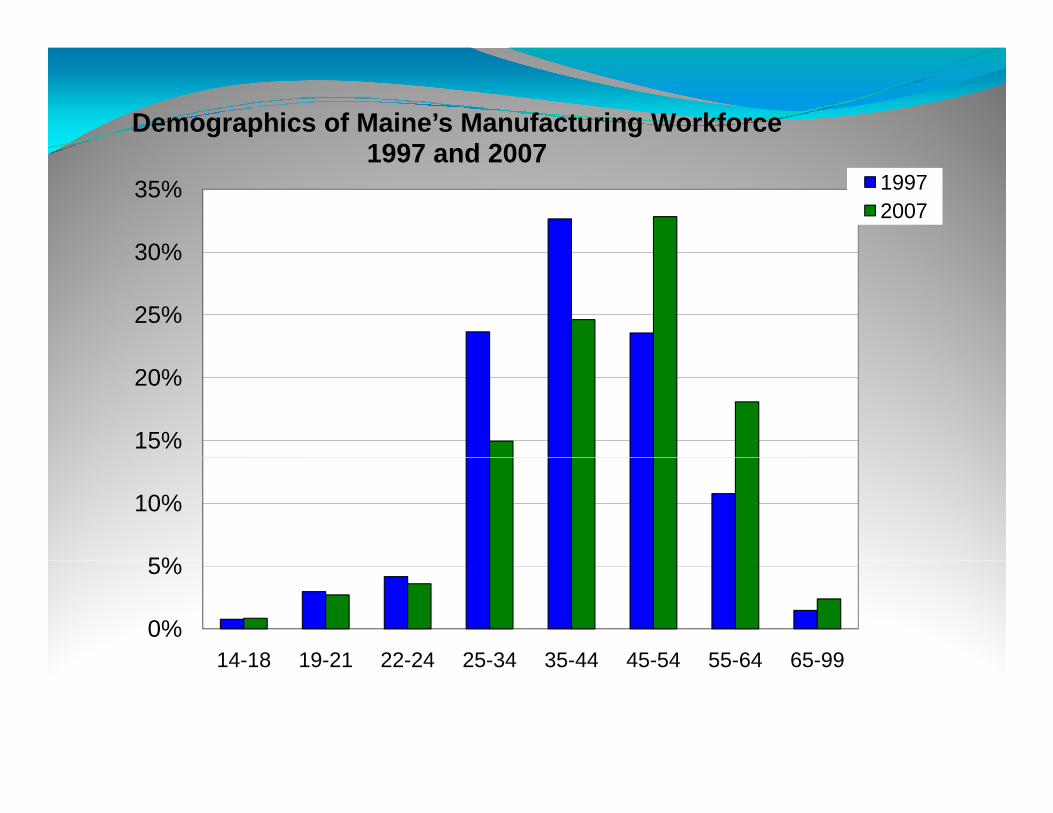
Demographics of Maine’s Manufacturing Workforce 1997 and 2007
30%
35%
1997 and 2007 19972007
25%
30%
15%
20%
5%
10%
0%
5%
14-18 19-21 22-24 25-34 35-44 45-54 55-64 65-9914-18 19-21 22-24 25-34 35-44 45-54 55-64 65-99
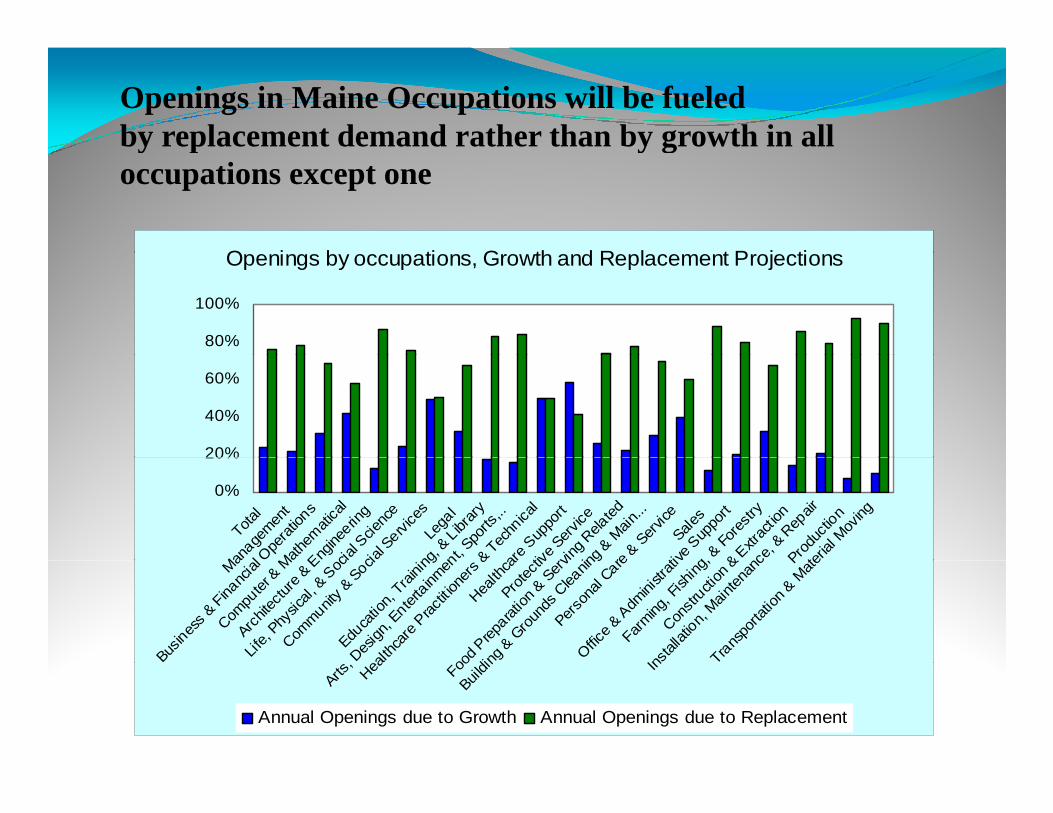
Openings in Maine Occupations will be fueled by replacement demand rather than by growth in all by replacement demand rather than by growth in all occupations except one
Openings by occupations, Growth and Replacement ProjectionsOpenings by occupations, Growth and Replacement Projections
80%
100%
20%
40%
60%
0%
20%
Total
Man
agem
ent
Busin
ess
& Fina
ncia
l Ope
ratio
ns
Compu
ter &
Mat
hem
atica
l
Archit
ectu
re &
Eng
ineerin
g
Life
, Phy
sical
, & S
ocia
l Scie
nce
Comm
unity
& Socia
l Serv
ices
Lega
l
Educa
tion,
Tra
ining
, & L
ibrar
y
Arts, D
esig
n, E
nterta
inmen
t, Spo
rts,..
Health
care
Pra
ctit io
ners
& T
echn
ical
Health
care
Sup
port
Prote
ctive
Ser
vice
Food
Prepa
ratio
n & S
ervin
g Rela
ted
Buildi
ng &
Gro
unds
Clea
ning
& Mai
n...
Perso
nal C
are &
Ser
vice
Sales
Offic
e & A
dmini
strat
ive S
uppo
rt
Farm
ing, F
ishin
g, &
For
estry
Const
ructi
on &
Extr
actio
n
Inst
allat
ion,
Mai
nten
ance
, & R
epair
Produ
ctio
n
Trans
porta
tion
& Mat
erial
Mov
ing
Man
agem
ent
Busin
ess
& Fina
ncia
l Ope
ratio
ns
Compu
ter &
Mat
hem
atica
l
Archit
ectu
re &
Eng
ineerin
g
Life
, Phy
sical
, & S
ocia
l Scie
nce
Comm
unity
& Socia
l Serv
ices
Educa
tion,
Tra
ining
, & L
ibrar
y
Arts, D
esig
n, E
nterta
inmen
t, Spo
rts,..
Health
care
Pra
ctit io
ners
& T
echn
ical
Health
care
Sup
port
Prote
ctive
Ser
vice
Food
Prepa
ratio
n & S
ervin
g Rela
ted
Buildi
ng &
Gro
unds
Clea
ning
& Mai
n...
Perso
nal C
are &
Ser
vice
Offic
e & A
dmini
strat
ive S
uppo
rt
Farm
ing, F
ishin
g, &
For
estry
Const
ructi
on &
Extr
actio
n
Inst
allat
ion,
Mai
nten
ance
, & R
epair
Produ
ctio
n
Trans
porta
tion
& Mat
erial
Mov
ing
Busin
ess
& Fina
ncia
l Ope
ratio
ns Arts
, Des
ign,
Ente
rtainm
ent,
Sports
,..
Health
care
Pra
ctit io
ners
& T
echn
ical
Food
Prepa
ratio
n & S
ervin
g Rela
ted
Buildi
ng &
Gro
unds
Clea
ning
& Mai
n...
Inst
allat
ion,
Mai
nten
ance
, & R
epair
Trans
porta
tion
& Mat
erial
Mov
ing
Annual Openings due to Growth Annual Openings due to Replacement
Employees will work in more decentralized,
Trends and Implications Employees will work in more decentralized, specialized firms, and employer-employee relationships will become less standardized and more individualized. more individualized.
Slower labor force growth will encourage employers Slower labor force growth will encourage employers to adopt approaches to facilitate greater labor force participation among women, the elderly, and participation among women, the elderly, and people with disabilities.
Greater emphasis will be placed on retraining and lifelong learning as the U.S. workforce tries to stay competitive in the global marketplace and respond competitive in the global marketplace and respond to technological changes.

Economic Dynamics and the Labor Economic Dynamics and the Labor
Market
�Accelerated Pace of Technological ChangeTechnological Change
�Unrelenting Globalization�Unrelenting Globalization
Program Development and
Planning : Employment, Wages, Planning : Employment, Wages,
Market Demand, and Growth
Employment
Wages
Market Demand
Projections/Growth
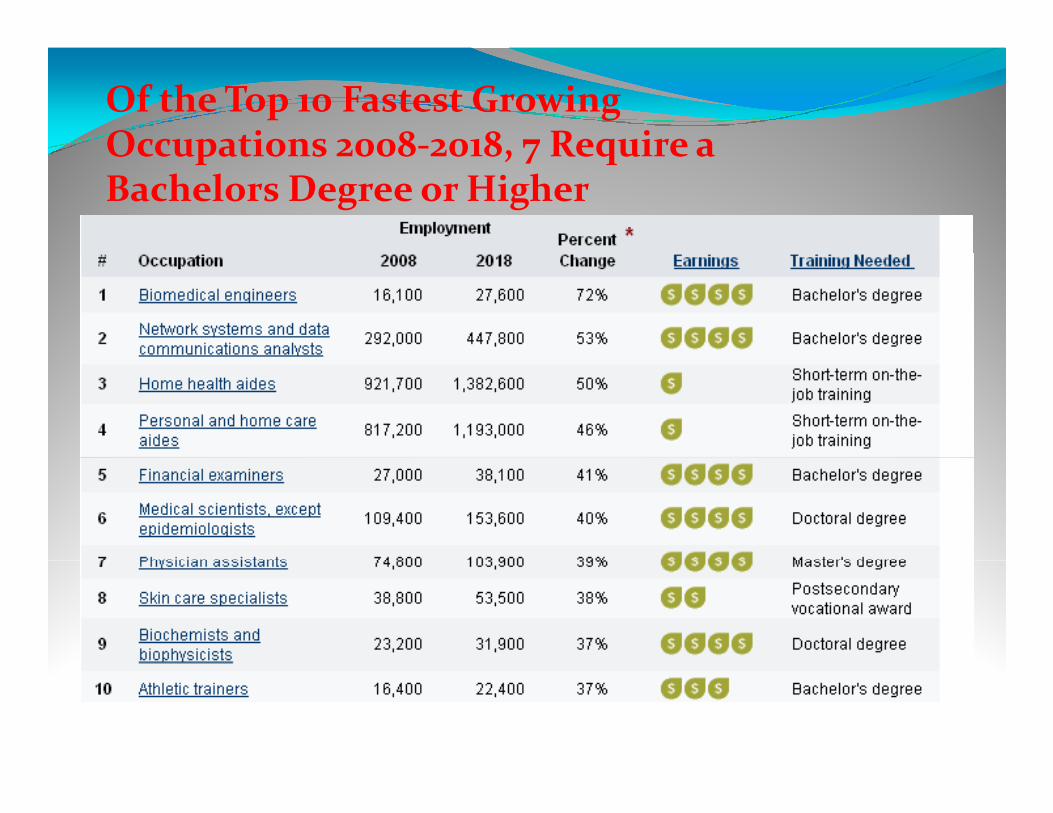
Of the Top 10 Fastest Growing Occupations 2008-2018, 7 Require a Occupations 2008-2018, 7 Require a Bachelors Degree or Higher
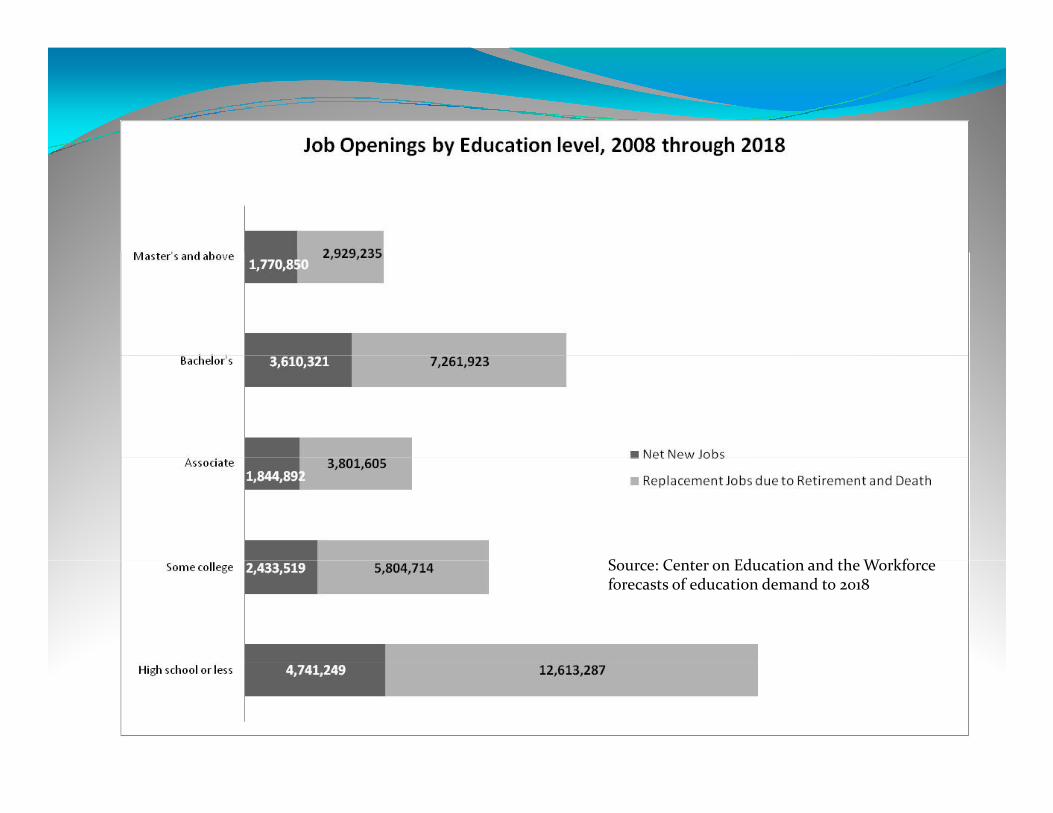
Source: Center on Education and the Workforce Source: Center on Education and the Workforce forecasts of education demand to 2018
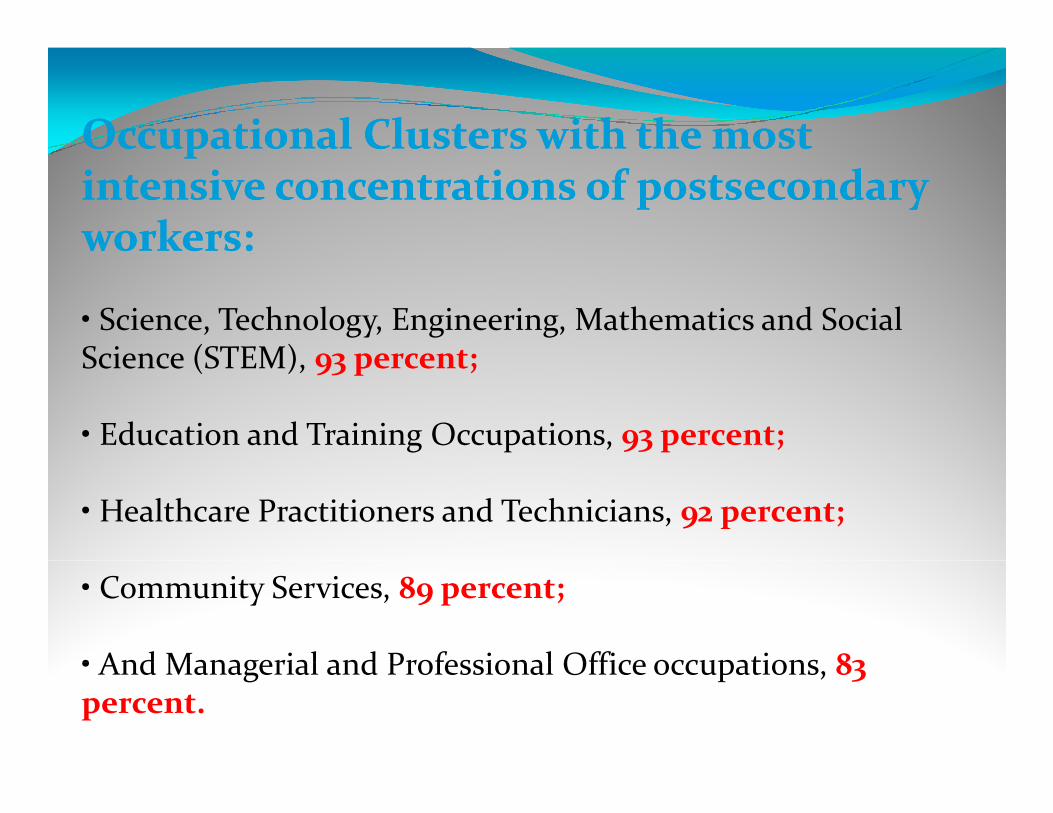
Occupational Clusters with the most Occupational Clusters with the most Occupational Clusters with the most Occupational Clusters with the most intensive concentrations of postsecondary intensive concentrations of postsecondary workers:workers:workers:workers:
• Science, Technology, Engineering, Mathematics and Social Science (STEM), 93 percent;Science (STEM), 93 percent;
• Education and Training Occupations, 93 percent;
• Healthcare Practitioners and Technicians, 92 percent;
• Community Services, 89 percent;
• And Managerial and Professional Office occupations, 83 • And Managerial and Professional Office occupations, 83 percent.
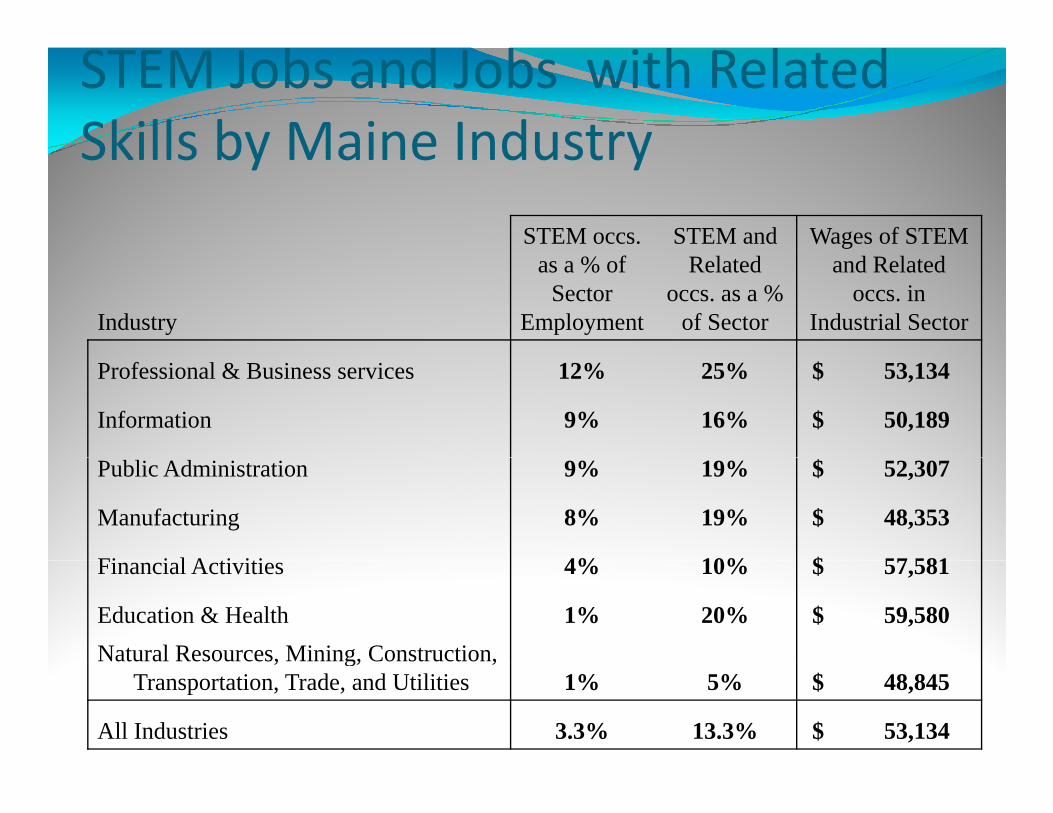
STEM Jobs and Jobs with Related
Skills by Maine IndustrySkills by Maine Industry
STEM occs. as a % of
STEM and Related
Wages of STEM and Related
Industry
as a % of Sector
Employment
Related occs. as a %
of Sector
and Related occs. in
Industrial Sector
Professional & Business services 12% 25% $ 53,134
Information 9% 16% $ 50,189
Public Administration 9% 19% $ 52,307 Public Administration 9% 19% $ 52,307
Manufacturing 8% 19% $ 48,353
Financial Activities 4% 10% $ 57,581 Financial Activities 4% 10% $ 57,581
Education & Health 1% 20% $ 59,580
Natural Resources, Mining, Construction, Natural Resources, Mining, Construction, Transportation, Trade, and Utilities 1% 5% $ 48,845
All Industries 3.3% 13.3% $ 53,134
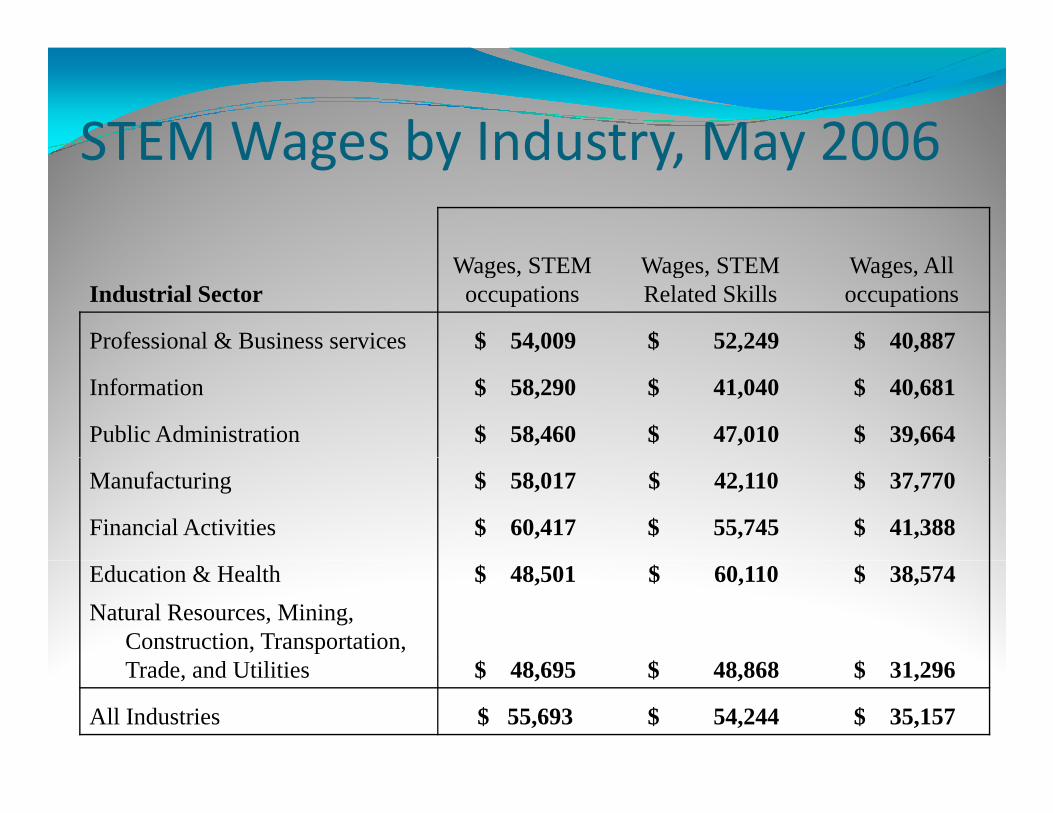
STEM Wages by Industry, May 2006STEM Wages by Industry, May 2006
Wages, STEM Wages, STEM Wages, All Industrial Sector
Wages, STEM occupations
Wages, STEM Related Skills
Wages, All occupations
Professional & Business services $ 54,009 $ 52,249 $ 40,887
Information $ 58,290 $ 41,040 $ 40,681
Public Administration $ 58,460 $ 47,010 $ 39,664
Manufacturing $ 58,017 $ 42,110 $ 37,770
Financial Activities $ 60,417 $ 55,745 $ 41,388
Education & Health $ 48,501 $ 60,110 $ 38,574
Natural Resources, Mining, Construction, Transportation, Trade, and Utilities $ 48,695 $ 48,868 $ 31,296 Trade, and Utilities $ 48,695 $ 48,868 $ 31,296
All Industries $ 55,693 $ 54,244 $ 35,157
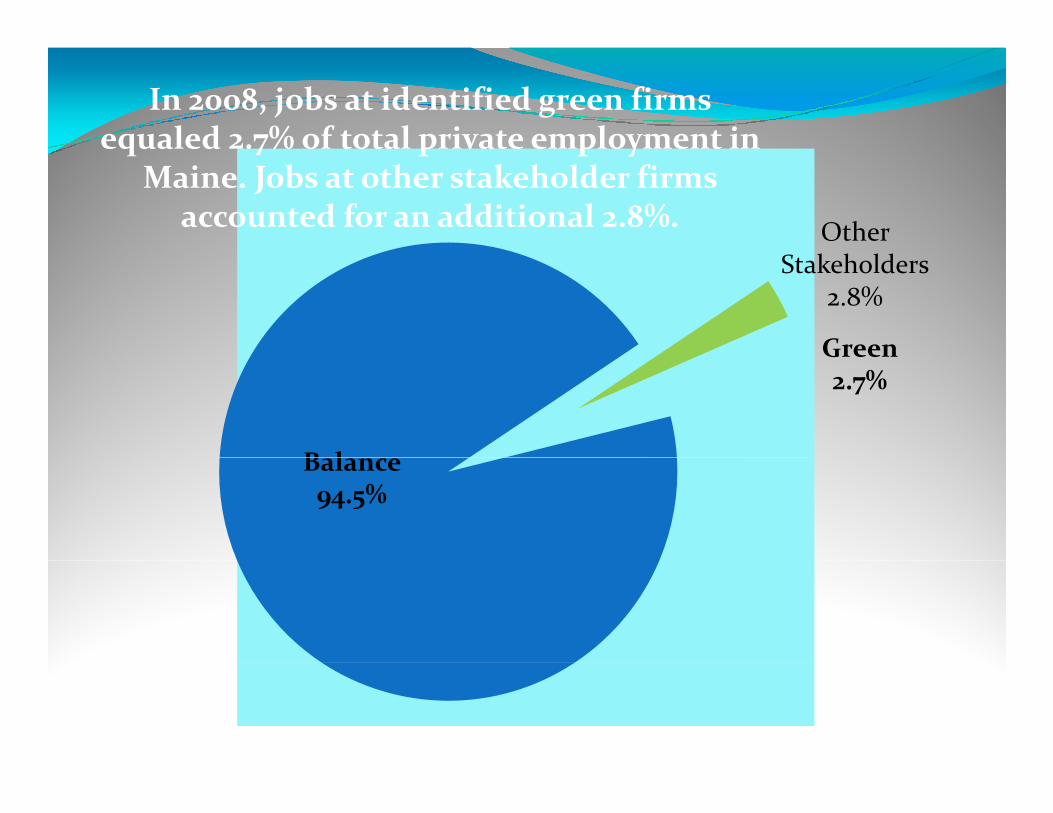
In 2008, jobs at identified green firms equaled 2.7% of total private employment in
Other Stakeholders
equaled 2.7% of total private employment in Maine. Jobs at other stakeholder firms
accounted for an additional 2.8%.
Stakeholders 2.8%
Green
Balance
Green 2.7%
Balance 94.5%
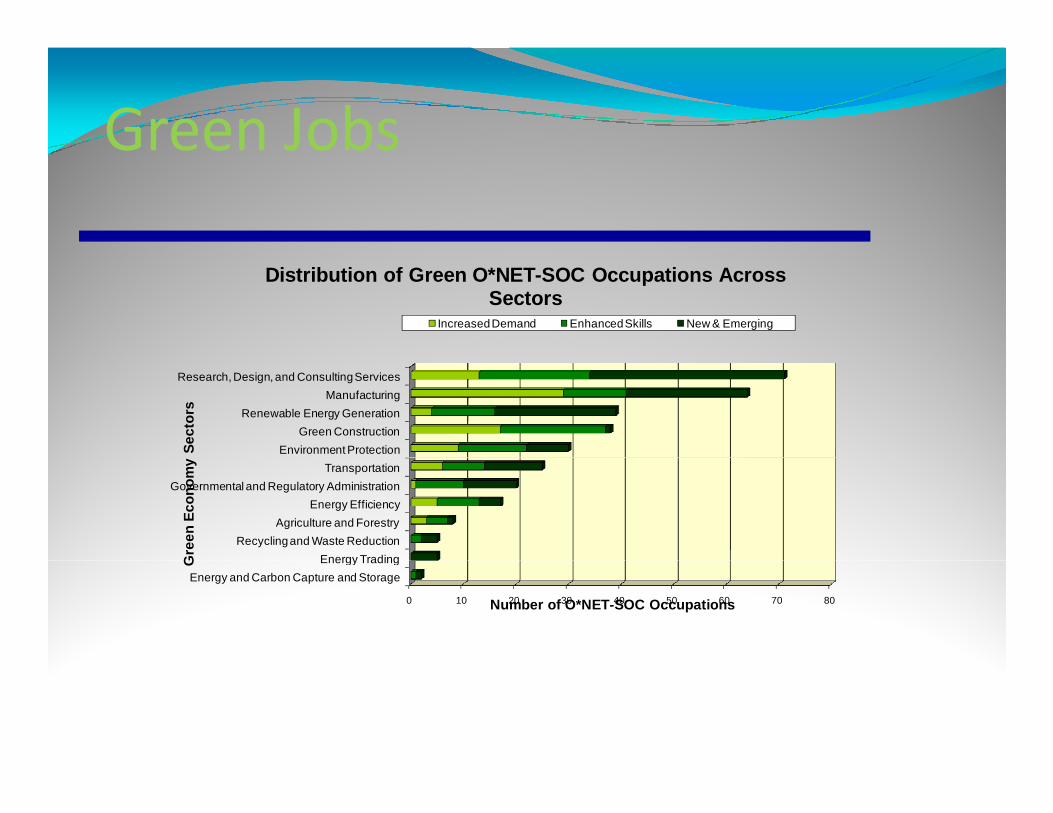
Green Jobs Green Jobs
Distribution of Green O*NET-SOC Occupations Across Sectors
Increased Demand Enhanced Skills New & Emerging
Environment Protection
Green Construction
Renewable Energy Generation
Manufacturing
Research, Design, and Consulting Services
Gre
en E
cono
my
Sec
tors
Energy Trading
Recycling and Waste Reduction
Agriculture and Forestry
Energy Efficiency
Governmental and Regulatory Administration
Transportation
Gre
en E
cono
my
Sec
tors
0 10 20 30 40 50 60 70 80
Energy and Carbon Capture and Storage
Energy Trading
Number of O*NET-SOC Occupations
Gre
en E
cono
my
Sec
tors
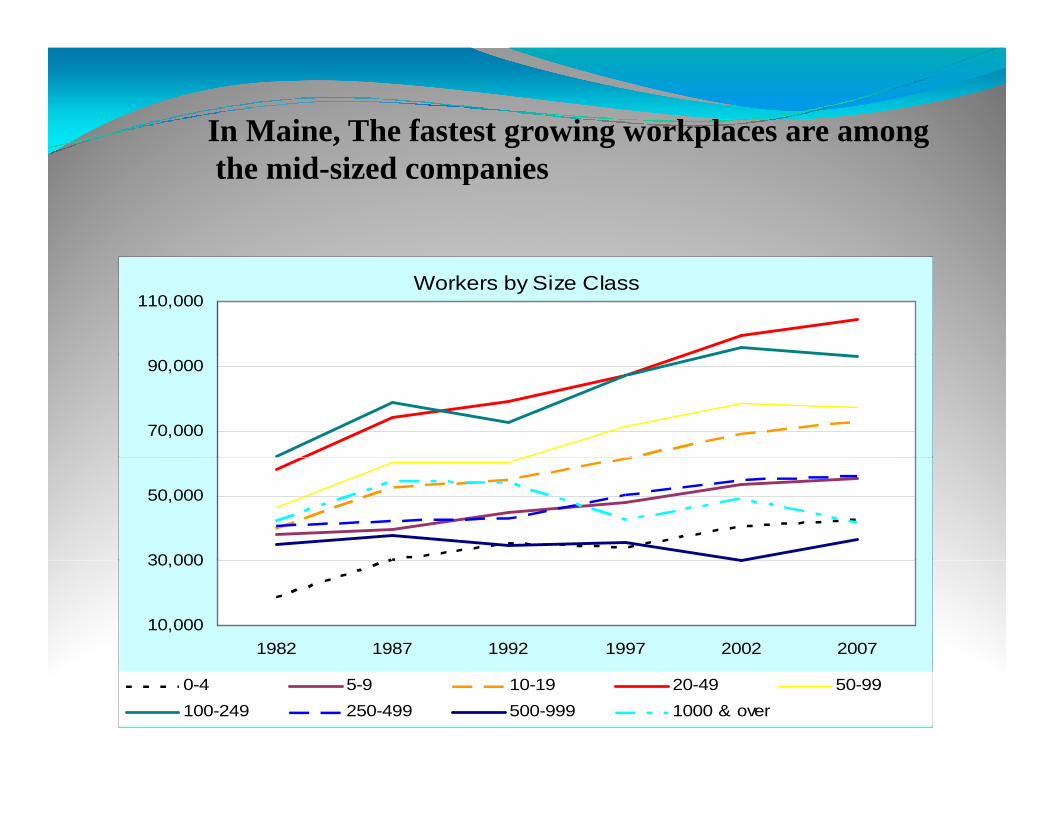
In Maine, The fastest growing workplaces are amongthe mid-sized companiesthe mid-sized companies
Workers by Size Class110,000
70,000
90,000
30,000
50,000
10,000
30,000
1982 1987 1992 1997 2002 2007
0-4 5-9 10-19 20-49 50-99
100-249 250-499 500-999 1000 & over
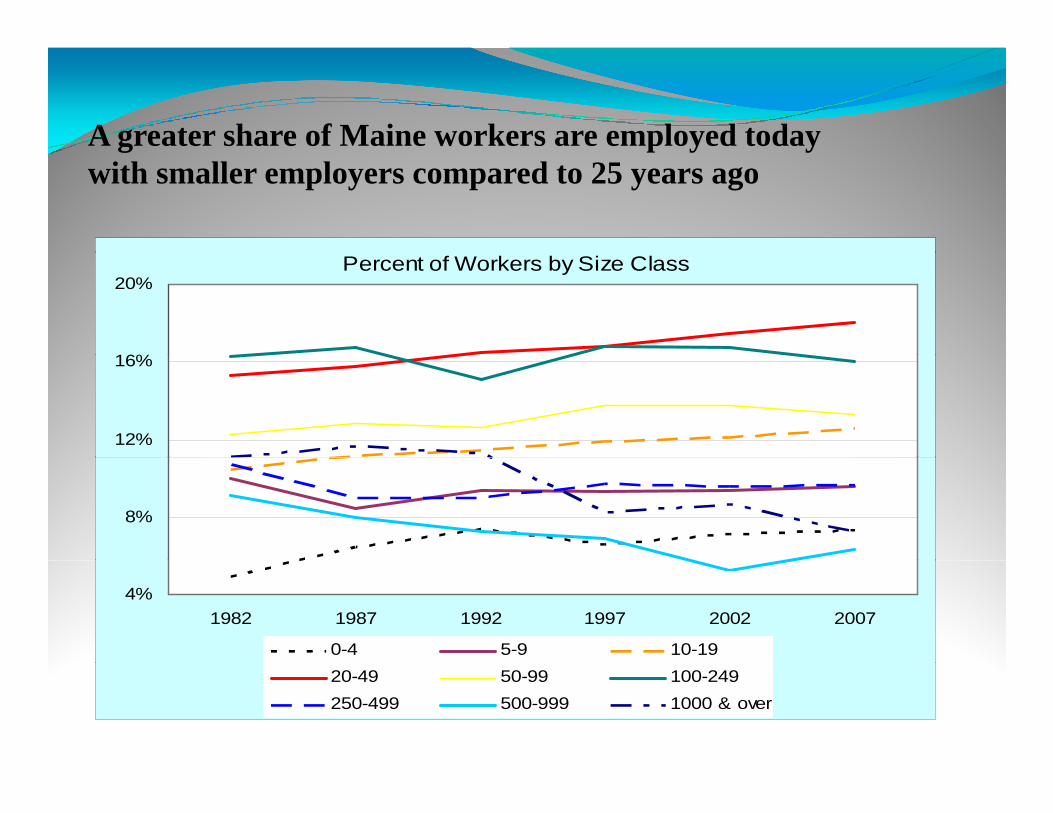
A greater share of Maine workers are employed todayA greater share of Maine workers are employed todaywith smaller employers compared to 25 years ago
Percent of Workers by Size ClassPercent of Workers by Size Class
16%
20%
12%
16%
8%
4%
1982 1987 1992 1997 2002 2007
0-4 5-9 10-19
20-49 50-99 100-249
250-499 500-999 1000 & over
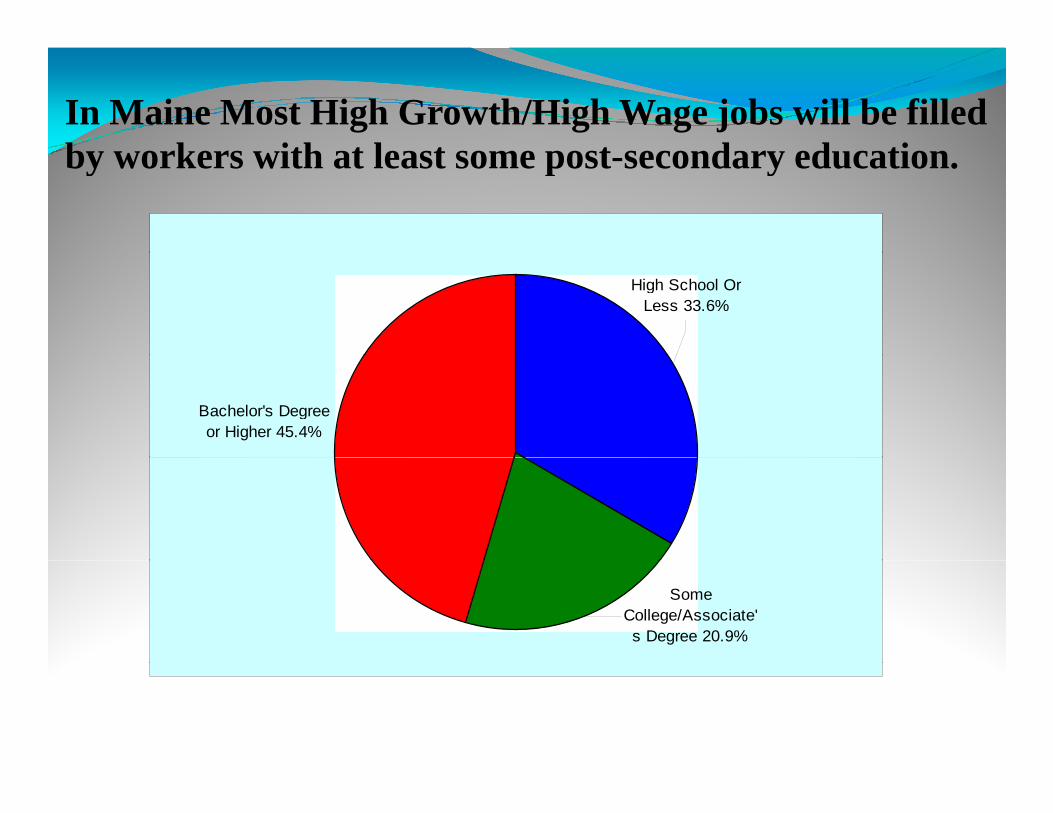
In Maine Most High Growth/High Wage jobs will be filled by workers with at least some post-secondary education.by workers with at least some post-secondary education.
High School Or Less 33.6%
Bachelor's Degree or Higher 45.4%
Some College/Associate's Degree 20.9%
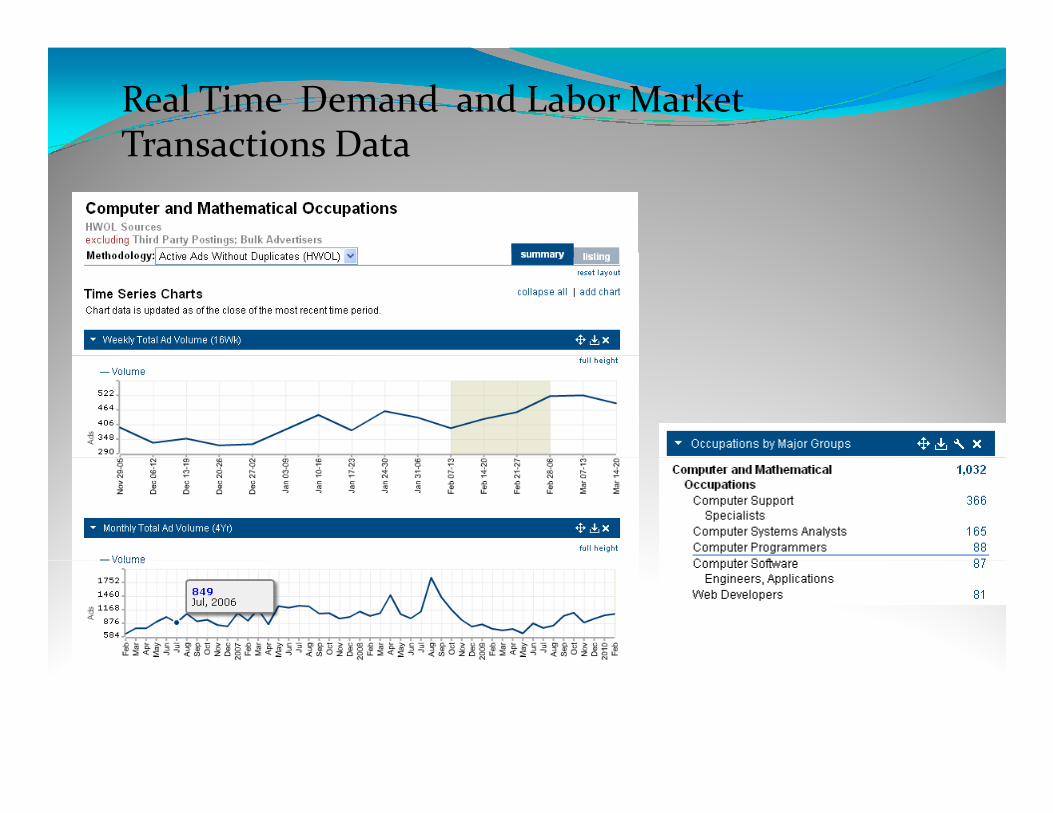
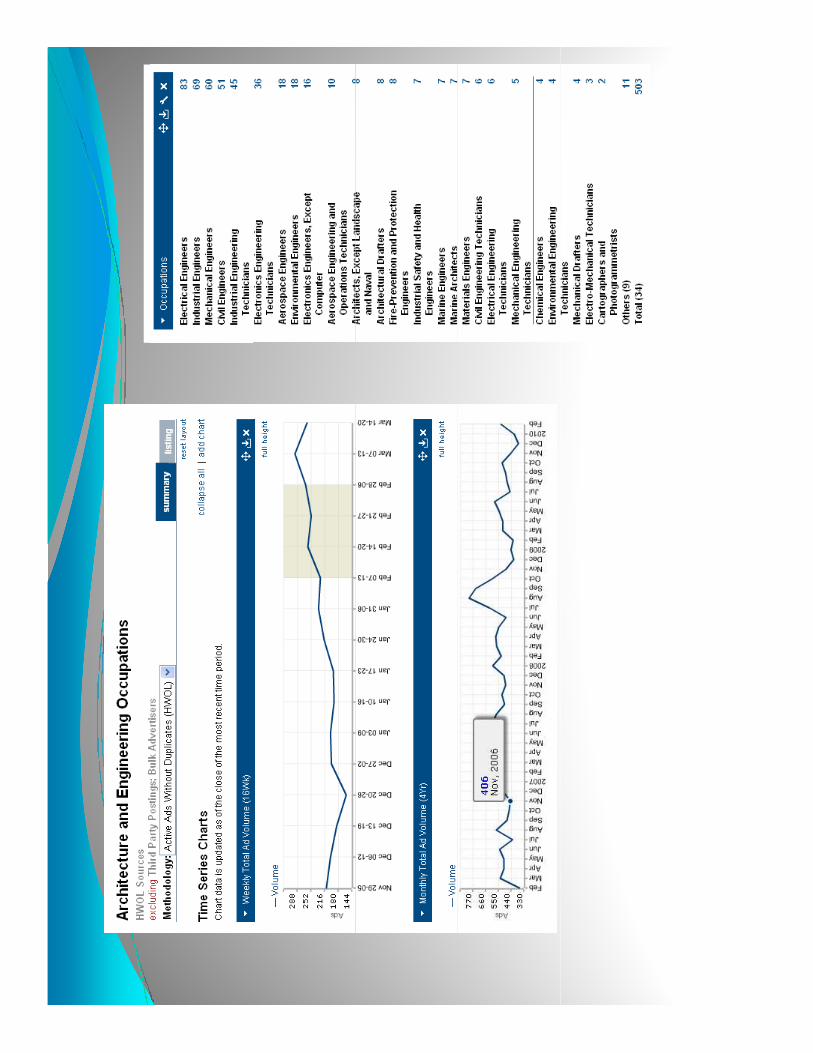
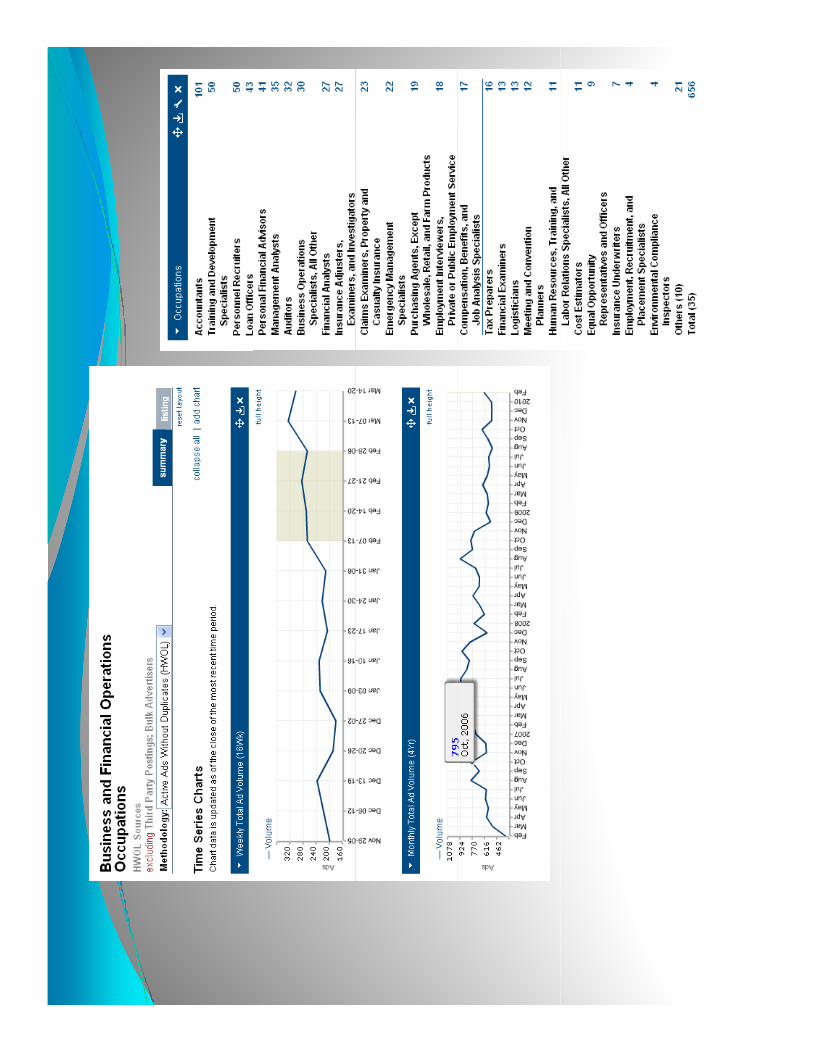
Real Time Demand and Labor Market Transactions DataTransactions Data
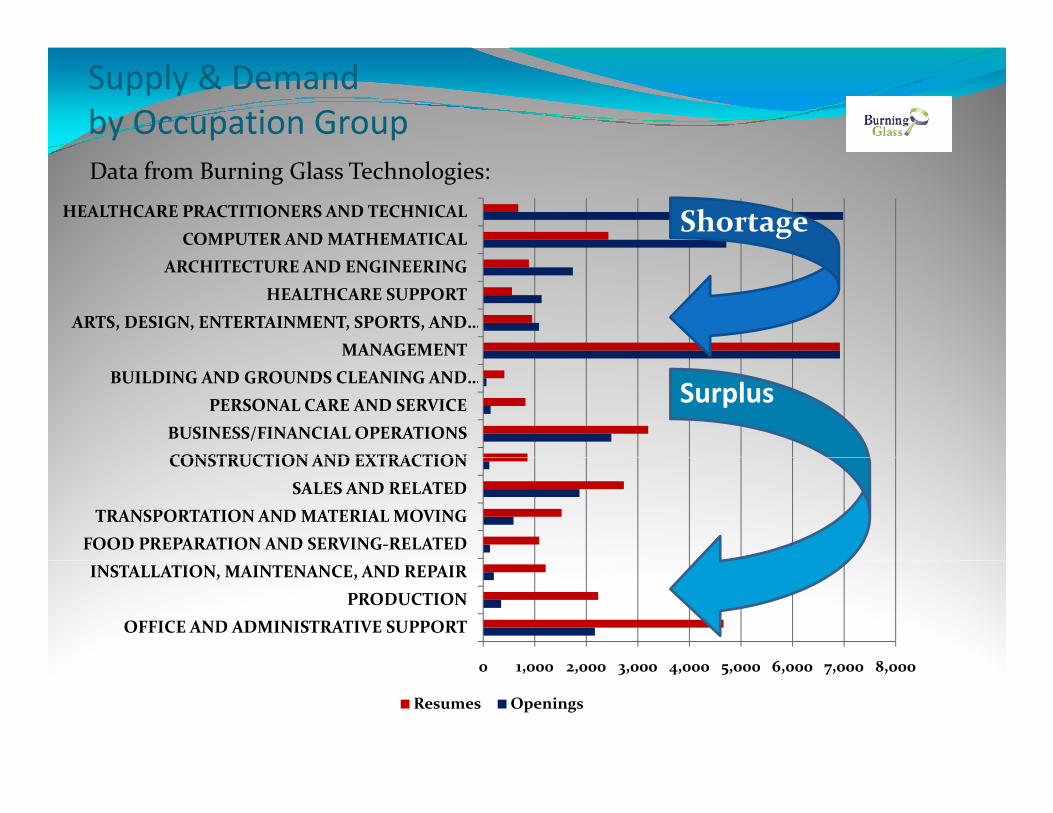
Supply & Demand
by Occupation Group
COMPUTER AND MATHEMATICAL
HEALTHCARE PRACTITIONERS AND TECHNICAL Shortage
Data from Burning Glass Technologies:
MANAGEMENT
ARTS, DESIGN, ENTERTAINMENT, SPORTS, AND …
HEALTHCARE SUPPORT
ARCHITECTURE AND ENGINEERING
CONSTRUCTION AND EXTRACTION
BUSINESS/FINANCIAL OPERATIONS
PERSONAL CARE AND SERVICE
BUILDING AND GROUNDS CLEANING AND …
MANAGEMENT
Surplus
FOOD PREPARATION AND SERVING-RELATED
TRANSPORTATION AND MATERIAL MOVING
SALES AND RELATED
CONSTRUCTION AND EXTRACTION
0 1,000 2,000 3,000 4,000 5,000 6,000 7,000 8,000
OFFICE AND ADMINISTRATIVE SUPPORT
PRODUCTION
INSTALLATION, MAINTENANCE, AND REPAIR
0 1,000 2,000 3,000 4,000 5,000 6,000 7,000 8,000
Resumes Openings
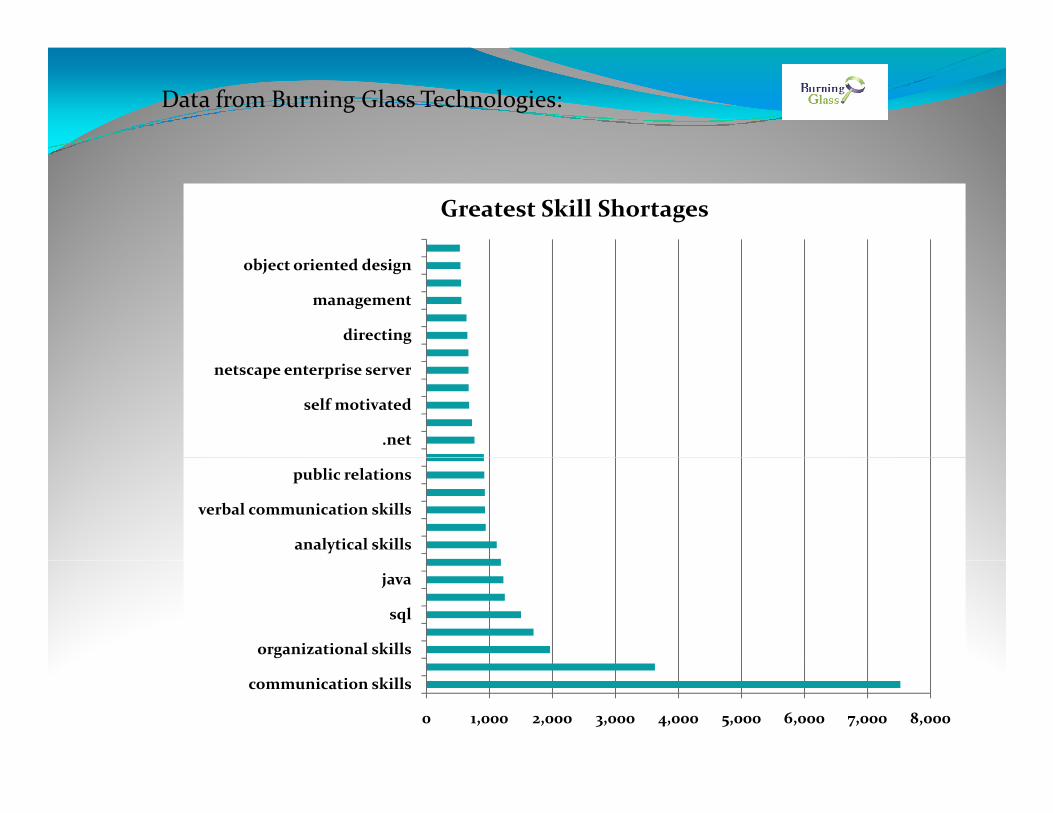
Data from Burning Glass Technologies:
Greatest Skill Shortages
directing
management
object oriented design
.net
self motivated
netscape enterprise server
analytical skills
verbal communication skills
public relations
organizational skills
sql
java
0 1,000 2,000 3,000 4,000 5,000 6,000 7,000 8,000
communication skills
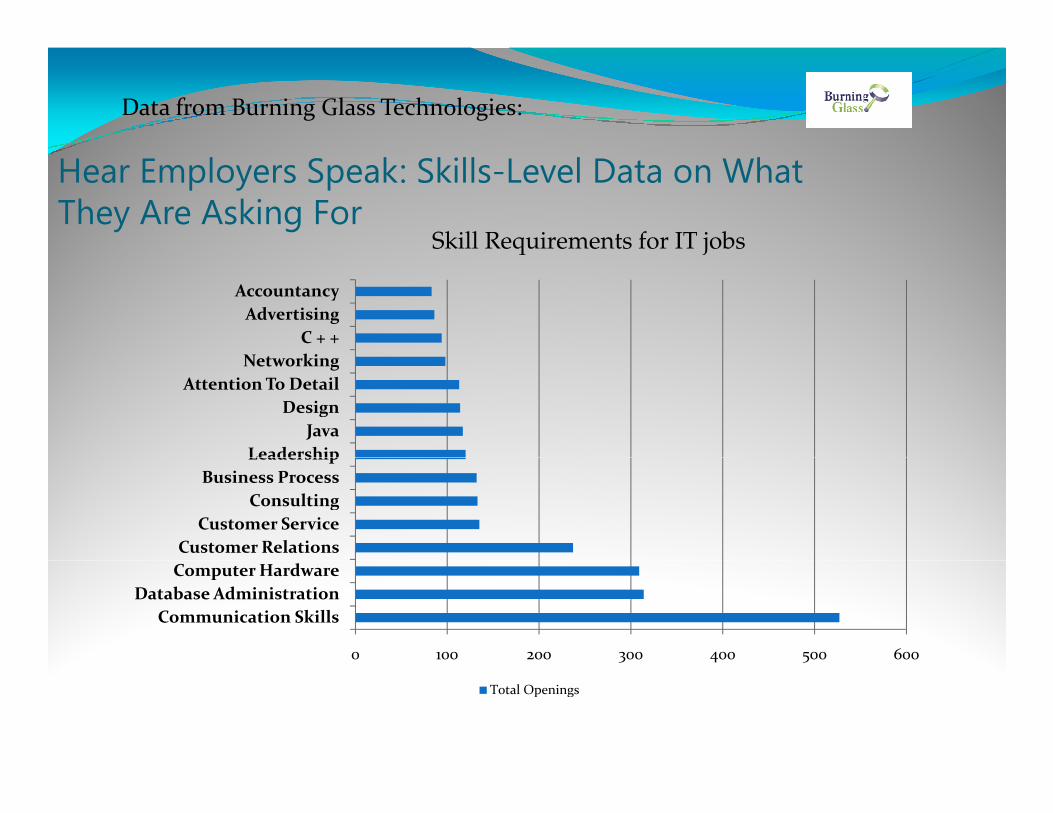
Hear Employers Speak: Skills-Level Data on What
Data from Burning Glass Technologies:
Hear Employers Speak: Skills-Level Data on What They Are Asking For
Skill Requirements for IT jobs
Networking
C + +
Advertising
Accountancy
Skill Requirements for IT jobs
Leadership
Java
Design
Attention To Detail
Networking
Computer Hardware
Customer Relations
Customer Service
Consulting
Business Process
Leadership
0 100 200 300 400 500 600
Communication Skills
Database Administration
Computer Hardware
0 100 200 300 400 500 600
Total Openings
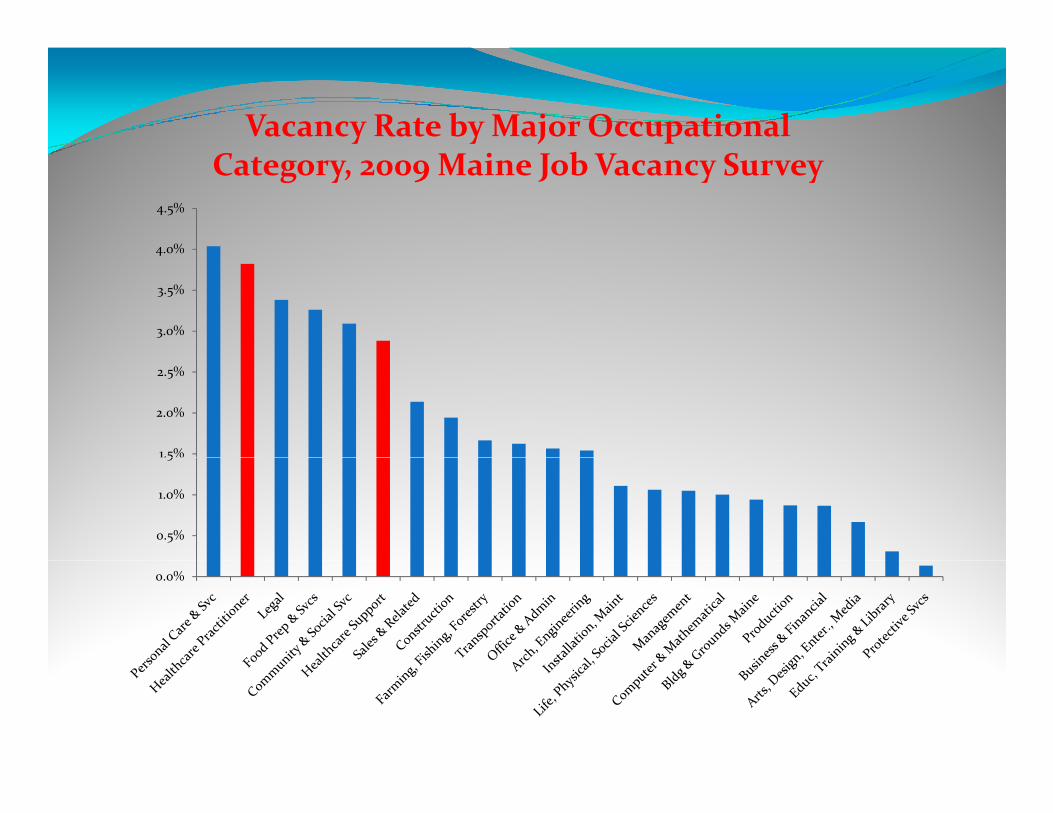
Vacancy Rate by Major Occupational Category, 2009 Maine Job Vacancy Survey
4.0%
4.5%
Category, 2009 Maine Job Vacancy Survey
3.0%
3.5%
4.0%
1.5%
2.0%
2.5%
0.5%
1.0%
1.5%
0.0%
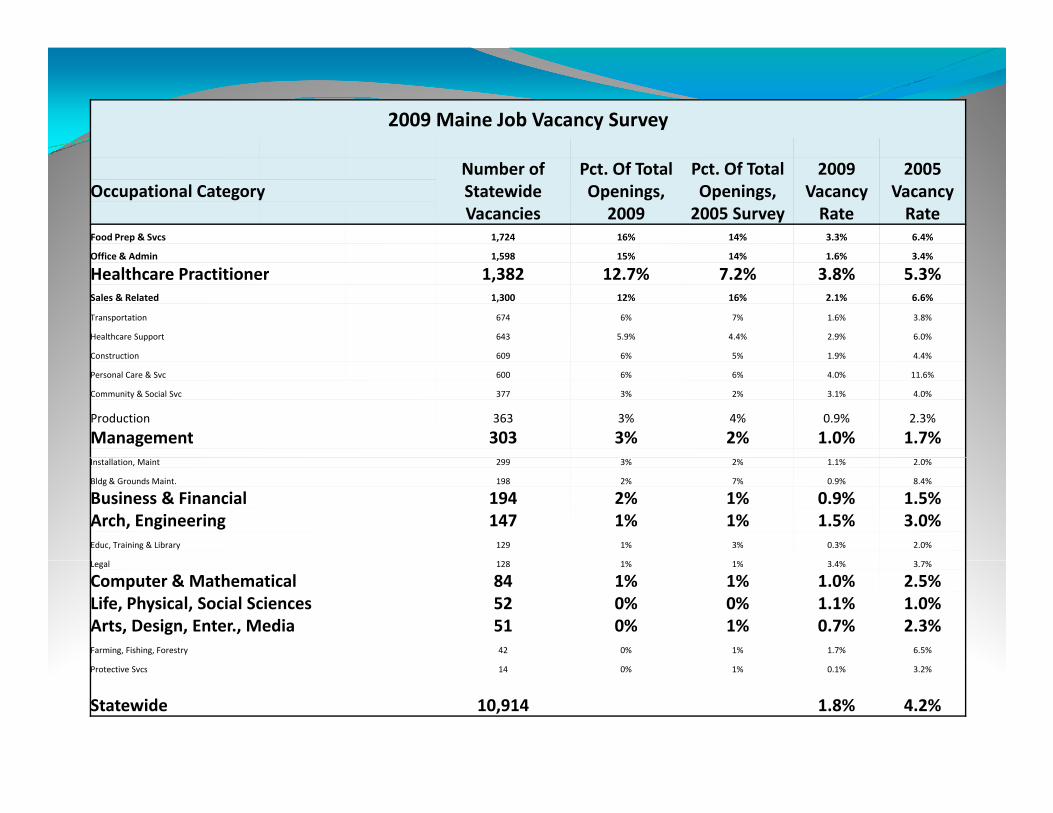
2009 Maine Job Vacancy Survey
Number of
Statewide
Vacancies
Pct. Of Total
Openings,
2009
Pct. Of Total
Openings,
2005 Survey
2009
Vacancy
Rate
2005
Vacancy
Rate
Occupational Category
Food Prep & Svcs 1,724 16% 14% 3.3% 6.4%
Office & Admin 1,598 15% 14% 1.6% 3.4%Office & Admin 1,598 15% 14% 1.6% 3.4%
Healthcare Practitioner 1,382 12.7% 7.2% 3.8% 5.3%
Sales & Related 1,300 12% 16% 2.1% 6.6%
Transportation 674 6% 7% 1.6% 3.8%
Healthcare Support 643 5.9% 4.4% 2.9% 6.0%
Construction 609 6% 5% 1.9% 4.4%Construction 609 6% 5% 1.9% 4.4%
Personal Care & Svc 600 6% 6% 4.0% 11.6%
Community & Social Svc 377 3% 2% 3.1% 4.0%
Production 363 3% 4% 0.9% 2.3%
Management 303 3% 2% 1.0% 1.7%
Installation, Maint 299 3% 2% 1.1% 2.0%Installation, Maint 299 3% 2% 1.1% 2.0%
Bldg & Grounds Maint. 198 2% 7% 0.9% 8.4%
Business & Financial 194 2% 1% 0.9% 1.5%
Arch, Engineering 147 1% 1% 1.5% 3.0%
Educ, Training & Library 129 1% 3% 0.3% 2.0%
Legal 128 1% 1% 3.4% 3.7%Legal 128 1% 1% 3.4% 3.7%
Computer & Mathematical 84 1% 1% 1.0% 2.5%
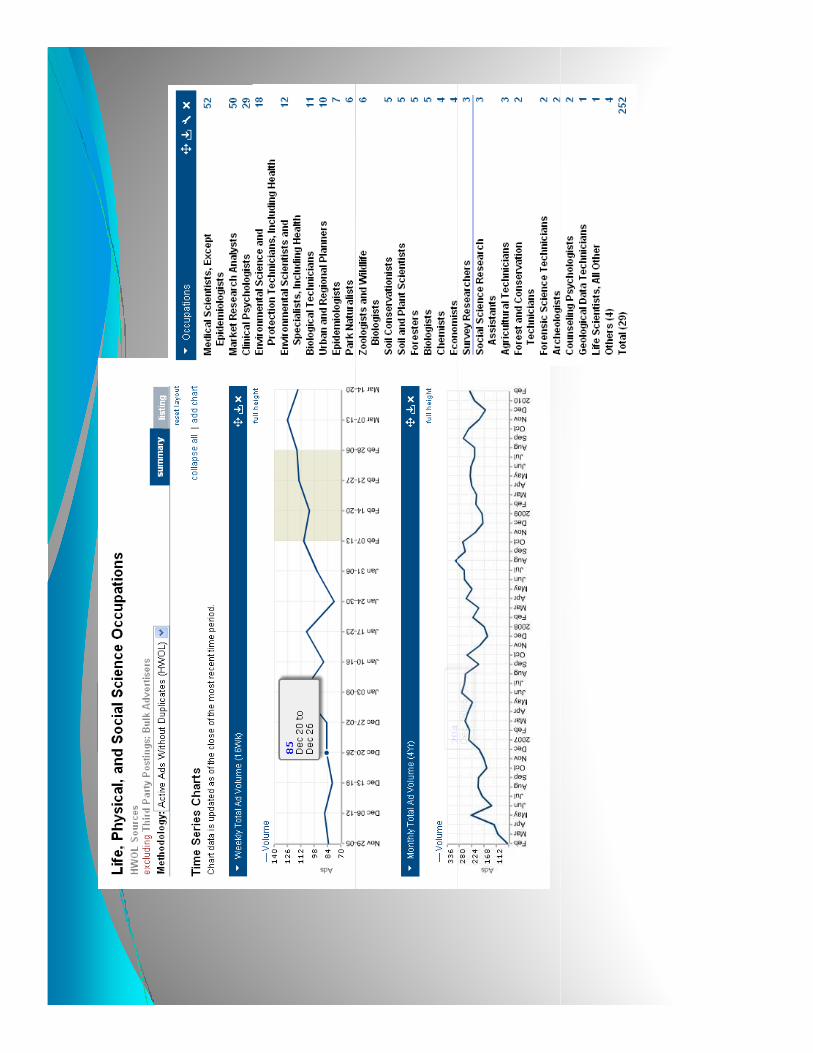
Life, Physical, Social Sciences 52 0% 0% 1.1% 1.0%
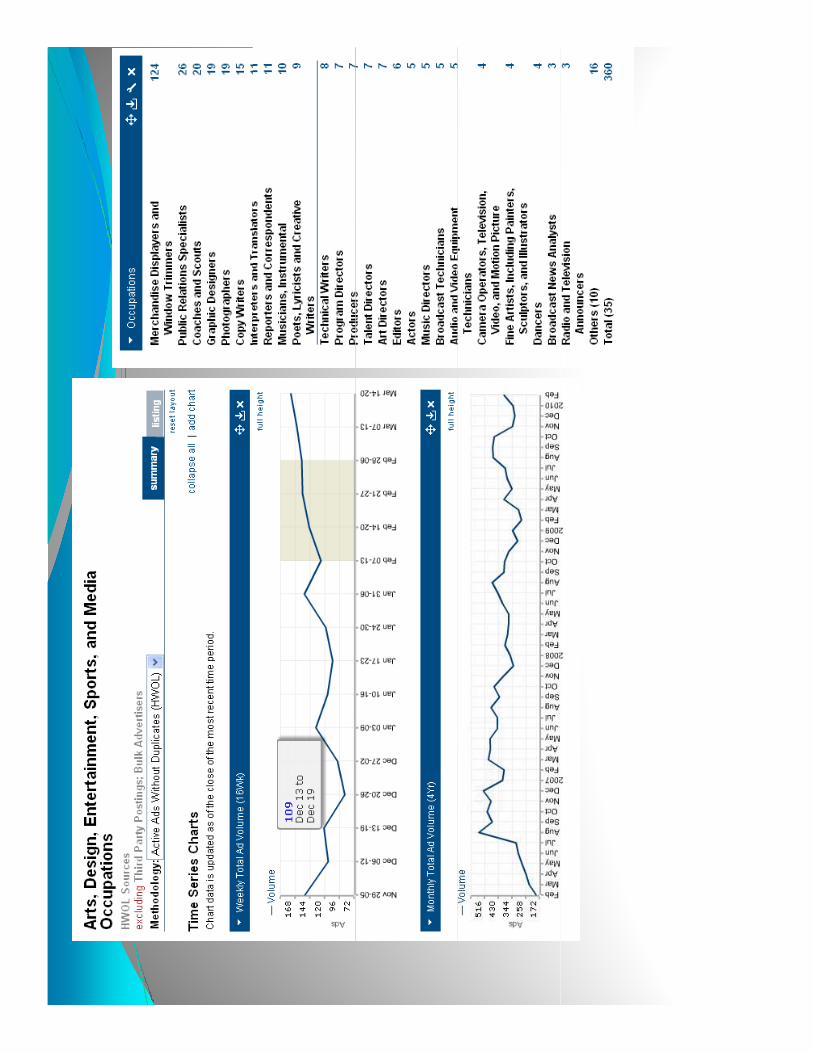
Arts, Design, Enter., Media 51 0% 1% 0.7% 2.3%
Farming, Fishing, Forestry 42 0% 1% 1.7% 6.5%
Protective Svcs 14 0% 1% 0.1% 3.2%
Statewide 10,914 1.8% 4.2%
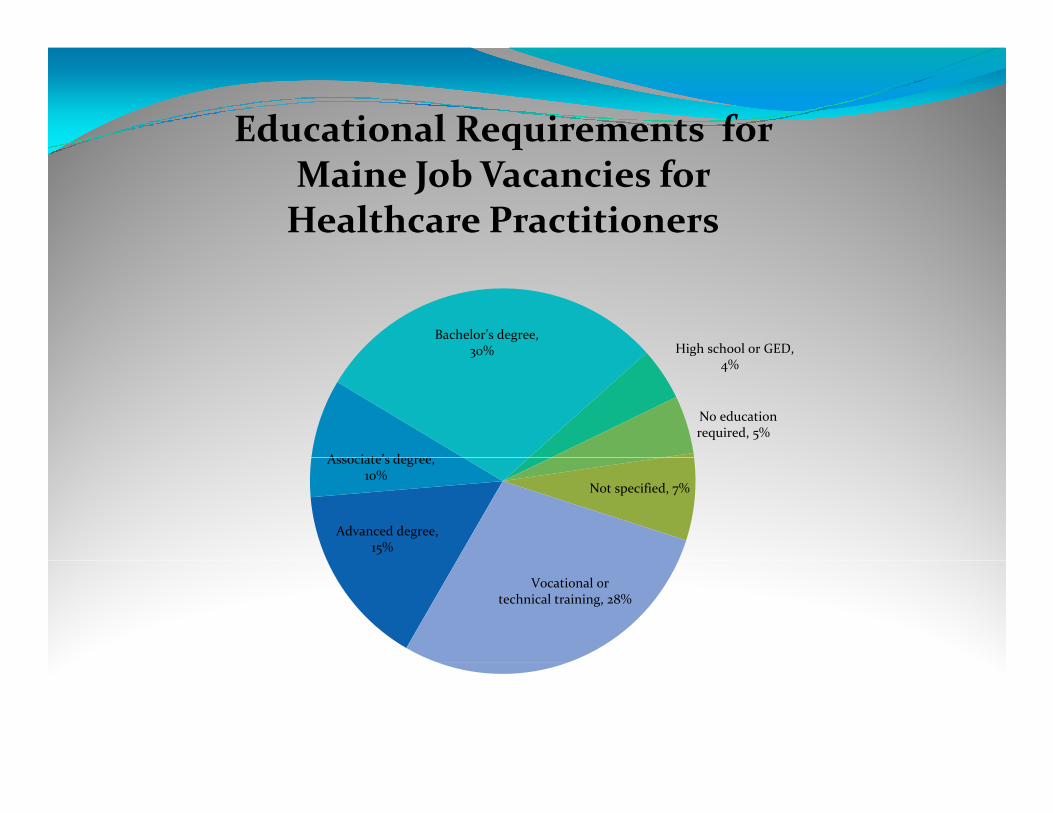
Educational Requirements for Educational Requirements for Maine Job Vacancies for
Healthcare Practitioners
Bachelor’s degree, 30% High school or GED,
Associate’s degree,
30% High school or GED, 4%
No education required, 5%
Advanced degree, 15%
Associate’s degree, 10%
Not specified, 7%
Vocational or technical training, 28%
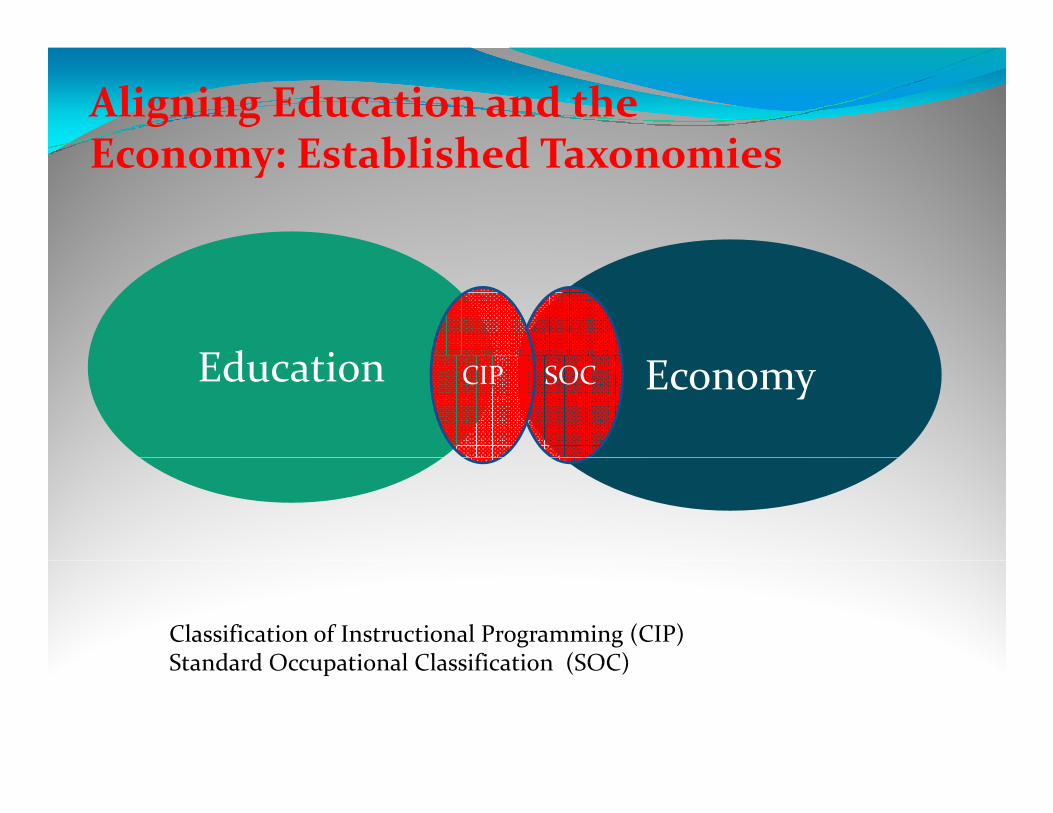
Aligning Education and the Economy: Established Taxonomies Economy: Established Taxonomies
Economy
Education
Education EconomyEducation SOCCIP
Classification of Instructional Programming (CIP)Standard Occupational Classification (SOC)Standard Occupational Classification (SOC)
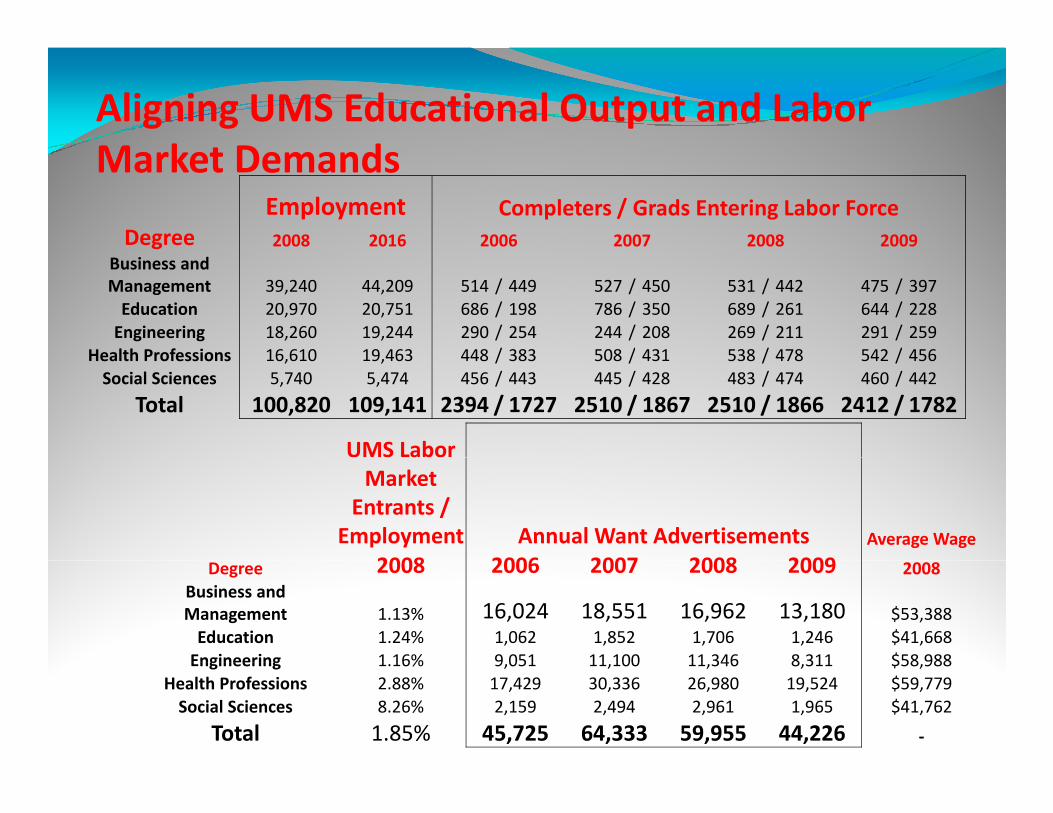
Aligning UMS Educational Output and Labor
Market DemandsMarket DemandsEmployment Completers / Grads Entering Labor Force
Degree 2008 2016 2006 2007 2008 2009
Business and Business and
Management 39,240 44,209 514 / 449 527 / 450 531 / 442 475 / 397
Education 20,970 20,751 686 / 198 786 / 350 689 / 261 644 / 228
Engineering 18,260 19,244 290 / 254 244 / 208 269 / 211 291 / 259
Health Professions 16,610 19,463 448 / 383 508 / 431 538 / 478 542 / 456Health Professions 16,610 19,463 448 / 383 508 / 431 538 / 478 542 / 456
Social Sciences 5,740 5,474 456 / 443 445 / 428 483 / 474 460 / 442
Total 100,820 109,141 2394 / 1727 2510 / 1867 2510 / 1866 2412 / 1782
UMS Labor UMS Labor
Market
Entrants /
Employment Annual Want Advertisements Average Wage
Degree 2008 2006 2007 2008 2009 2008Degree 2008 2006 2007 2008 2009 2008
Business and
Management 1.13% 16,024 18,551 16,962 13,180 $53,388
Education 1.24% 1,062 1,852 1,706 1,246 $41,668
Engineering 1.16% 9,051 11,100 11,346 8,311 $58,988Engineering 1.16% 9,051 11,100 11,346 8,311 $58,988
Health Professions 2.88% 17,429 30,336 26,980 19,524 $59,779
Social Sciences 8.26% 2,159 2,494 2,961 1,965 $41,762
Total 1.85% 45,725 64,333 59,955 44,226 -
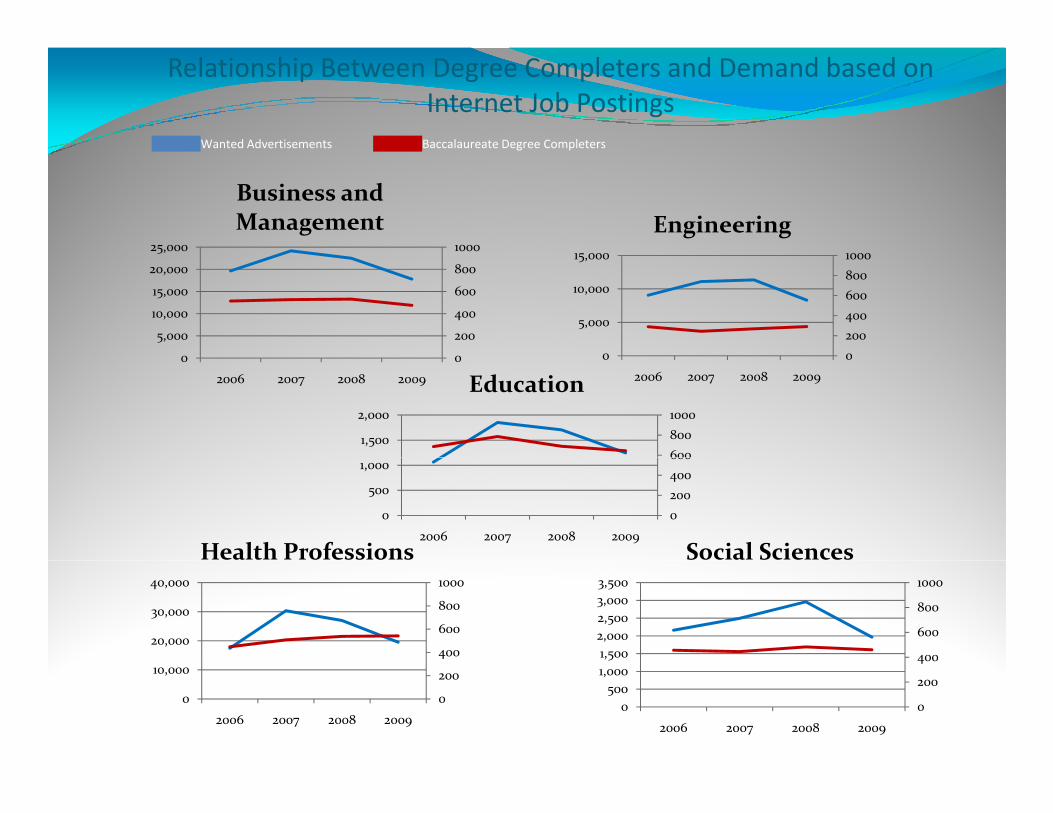
Relationship Between Degree Completers and Demand based on
Internet Job Postings
Wanted Advertisements Baccalaureate Degree Completers
100025,000
Business and Management
100015,000
Engineering
Wanted Advertisements Baccalaureate Degree Completers
0
200
400
600
800
1000
0
5,000
10,000
15,000
20,000
25,000
0
200
400
600
800
1000
0
5,000
10,000
15,000
00
2006 2007 2008 2009
00
2006 2007 2008 2009
600
800
1000
1,000
1,500
2,000
Education
0
200
400
600
0
500
1,000
2006 2007 2008 2009
Health Professions Social Sciences
400
600
800
1000
10,000
20,000
30,000
40,000
Health Professions
400
600
800
1000
1,000
1,500
2,000
2,500
3,000
3,500
Social Sciences
0
200
0
10,000
2006 2007 2008 20090
200
400
0
500
1,000
2006 2007 2008 2009
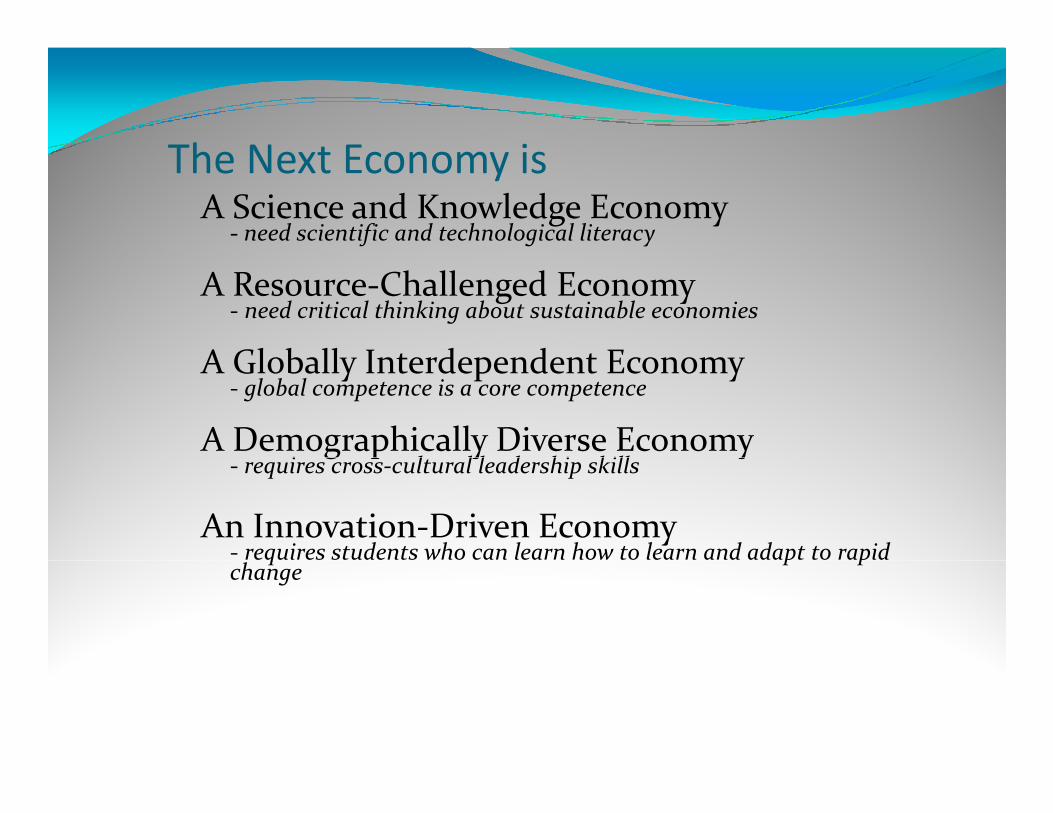
The Next Economy is The Next Economy is A Science and Knowledge Economy
- need scientific and technological literacy
A Resource-Challenged Economy- need critical thinking about sustainable economies
A Globally Interdependent EconomyA Globally Interdependent Economy- global competence is a core competence
A Demographically Diverse Economy- requires cross-cultural leadership skills
A Demographically Diverse Economy- requires cross-cultural leadership skills
An Innovation-Driven Economy- requires students who can learn how to learn and adapt to rapid change- requires students who can learn how to learn and adapt to rapid change

“Very Important” Skills for New From Conference Board Employer
Entrants with Four-Year College Diploma
Board Employer Survey
94.4%
95.4%
Teamwork *
Oral Communications *
92.1%
93.1%
93.8%
Critical Thinking/ Problem Solving *
Written Communications *
Professionalism/ Work Ethic *
87.0%
88.0%
92.1%
89.7%
Reading Comprehension
English Language
Writing in English
Critical Thinking/ Problem Solving *
85.6%
87.0%
81.8%Leadership *
Ethics/Social Responsibility *
Reading Comprehension
0% 20% 40% 60% 80% 100%
Page:42
* Applied Skill
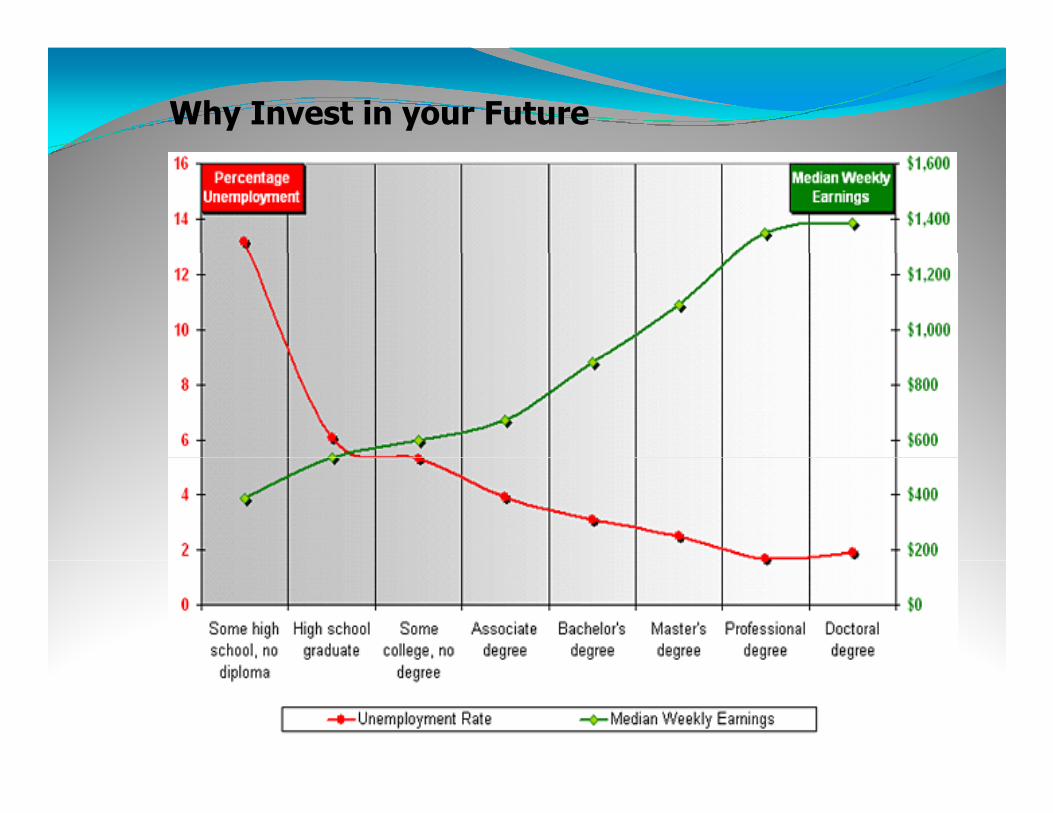
Why Invest in your Future
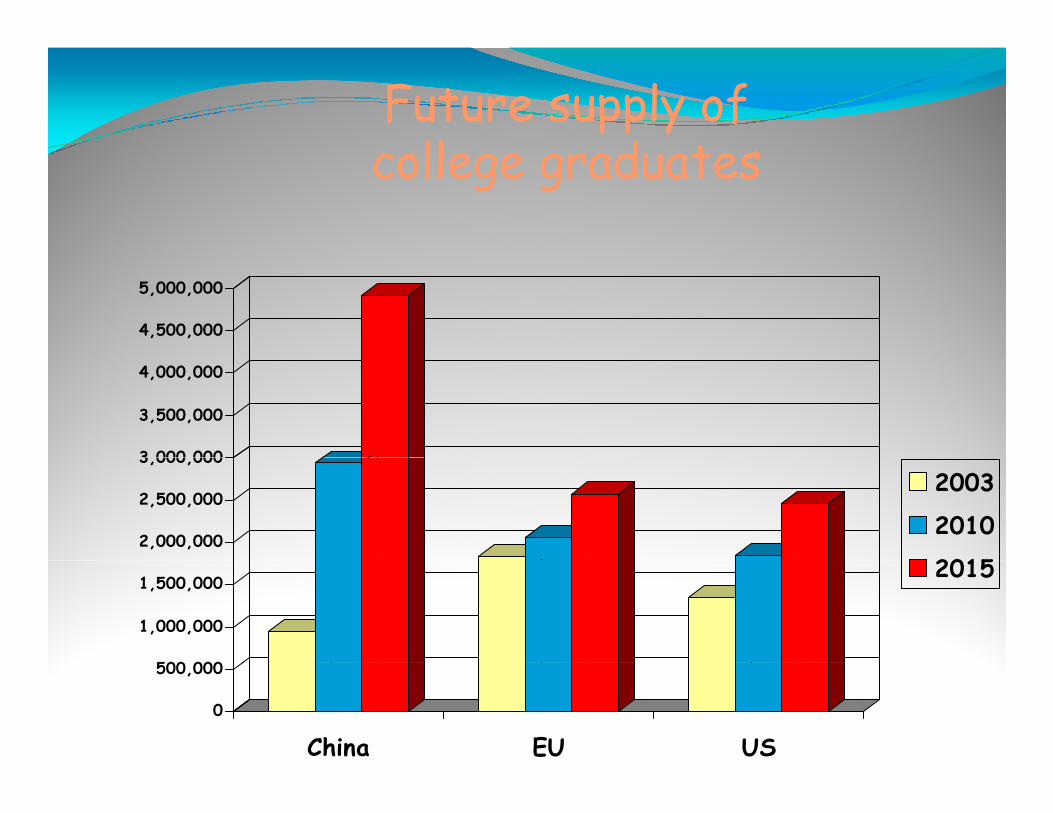
Future supply of college graduatescollege graduates
4,500,000
5,000,000
3,000,000
3,500,000
4,000,000
2,000,000
2,500,000
3,000,000
2003
2010
2015
500,000
1,000,000
1,500,0002015
0
500,000
China EU US