Embed Size (px)
Citation preview

John A. Tatom
John A. Tatom is an assistant vice president at the FederalReserve Bank of St Louis. James P Kelley provided researchassistance.
The 1990 Oil Price Hike inPerspective
HE ECONOMIC EFFECTS of the sharp risein oil prices in 1990 were, for a while, the cen-tral issue in discussions of the economic outlookfor 1990 and 1991. Iraq’s maneuvers to raisethe world price of oil late in July 1990 andtheir invasion of Kuwait less than a week laterled to a doubling of oil prices. As a result, oilprice shocks and the appropriate economicpolicy response to such shocks became subjectsof renewed speculation.
One of the most popular hypotheses to emergeat the time was that, since the economy wasdifferent in 1990 than it had been when previ-ous large oil price increases occurred, the 1990price rise should not affect the economy to thesame extent.’ It still was widely believed, how-ever, that the principal and most immediateeffect would be the onset of a recession. Inresponse, many analysts believed that the Fed-eral Reserve would ease monetary policy be-cause they thought it had done so at the outsetof previous oil shocks.
This article outlines the potential channels ofinfluence of a rise in the price of oil and the ex-tent to which the purported differences in eco-
lFjeleke (1990) was one of the first to develop this argu-ment. Among the reasons he cites are differences in thesize of the shock, the sensitivity of oil consumers to oilprice changes, the state of the economy before the oilshock and differences in available policy options. TheCouncil of Economic Advisers (1991) provides a more ex-tensive discussion consistent with this view.
nomic conditions in 1990 could account fordifferences between the economic effects of the1990 oil price surge and those in earlier, com-parable episodes.
WHY DO OIL PRICES MATTER?
One usually encounters two principal argu-ments in assessing how oil and energy pricechanges affect the economy. First, since energyresources are used to produce other goods andservices, a change in their price affects howmuch of the goods are produced as well as themix of resources that will be used to producethem. This argument focuses on the supply sideof the markets for goods and services. It sug-gests that the output losses associated withhigher energy prices are permanent, so thatchanging economic policies or shifting marketprices cannot replace the loss.
A second argument focuses on the effects onthe demand for a country’s output. It suggeststhat output losses are cyclical or transitory, sothat adjustments in wages and prices, or in eco-nomic policy, can reverse the loss in output.
3
IIIIIIIIIIII1I
II
MfluFM~o/flCrfl,m~o100~
4
Each argument suggests which characteristics ofthe economy determine the effects of an energyprice shock) as well as how changes in thesecharacteristics would alter these effects. Eachalso provides a different conclusion about thepotential for economic policy to ameliorate theadverse influences of energy price shocks.
Energy Prices and Economic Ca-pacity: The Permanent Effects ofan Energy Price Shock
Energy resources are used to produce mostgoods or services. As such, a rise in their pricewill (1) raise the total cost of an efficient pro-ducer’s output, (2) alter the most efficient meansfor producing output, (3) lower the profit-maxi-mizing level of output, (4) raise the long-runequilibrium price of output and (5) reduce thecapacity output of each firm’s existing stock ofcapital.~Capacity output declines when energyprices rise because firms reduce their use ofenergy and energy-using capital, some capitalbecomes obsolete, and firms use labor and capi-tal to economize on energy costs—that is, theygenerally switch to less energy-intensive pro-duction methods. The shaded insert on pages6 and 7 briefly explains the microeconomicfoundations of this capacity effect.
The economy’s aggregate supply is the sum ofthe supply decisions of the nation’s firms. Thus,the effect of energy prices on the typical firm’seconomic capacity determines the effect on theeconomy’s natural output and its aggregate sup-ply. The influence of a rise in the price of ener-gy on aggregate supply is shown in figure 1.The aggregate supply curve indicates the outputthat producers will supply at various levels ofthe aggregate price level, given other factorsinfluencing this decision. The supply curve typi-cally is derived from a given production func-tion, which relates output to the employment ofresources such as labor and capital. An initiallevel of nominal wages, the supplies of labor
and capital goods and the relative price ofenergy resources are assumed to be given inderiving a particular aggregate supply curve.
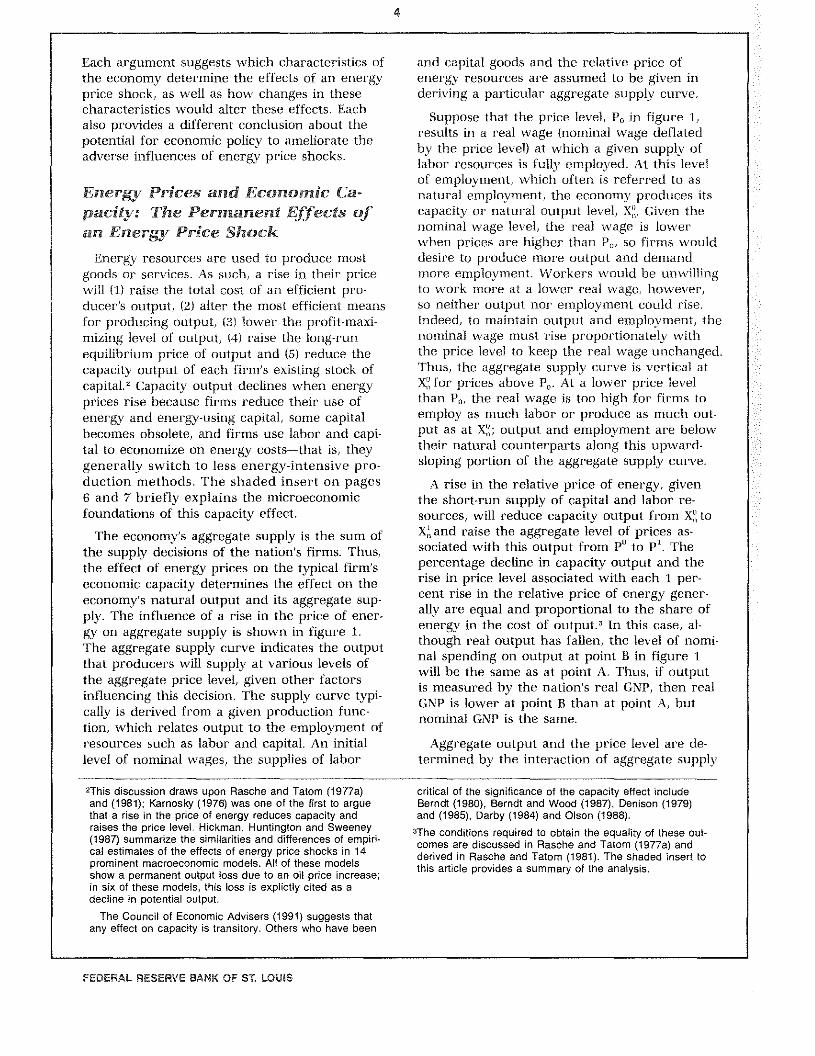
Suppose that the price level, P0 in figure 1,results in a real wage (nominal wage deflatedby the price level) at which a given supply oflabor resources is fully employed. At this levelof employment, which often is referred to asnatural employment, the economy produces itscapacity or natural output level, X~.Given thenominal wage level, the real wage is lowerwhen prices are higher than P0, so firms woulddesire to produce more output and demandmore employment. Workers would be unwillingto work more at a lower real wage, however,so neither output nor employment could rise.Indeed, to maintain output and employment, thenominal wage must rise proportionately withthe price level to keep the real wage unchanged.‘rhus, the aggregate supply curve is vertical atX~for prices above P0. At a lower price levelthan Pu, the real wage is too high for firms toemploy as much labor or produce as much out-put as at X~output and employment are belowtheir natural counterparts along this upward-sloping portion of the aggregate supply curve.
A rise in the relative price of energy, giventhe short-run supply of capital and labor re-sources, will reduce capacity output from X~toX~and raise the aggregate level of prices as-sociated with this output from P°to P1. Thepercentage decline in capacity output and therise in price level associated with each 1 per-cent rise in the relative price of energy gener-ally are equal and proportional to the share ofenergy in the cost of output.3 In this case, al-though real output has fallen, the level of nomi-nal spending on output at point B in figure 1will be the same as at point A. Thus, if outputis measured by the nation’s real GNP, then realGNP is lower at point B than at point A, butnominal GNP is the same.
Aggregate output and the price level are de-termined by the interaction of aggregate supply
2This discussion draws upon Rasche and Tatom (1977a)and (1981); Karnosky (1976) was one of the first to arguethat a rise in the price of energy reduces capacity andraises the price level. Hickman, Huntington and Sweeney(1987) summarize the similarities and differences ot empiri-cal estimates of the effects of energy price shocks in 14prominent macroeconomic models. All of these modelsshow a permanent output loss due to an oil price increase;in six of these models, this loss is explictly cited as adecline in potential output.
The Council of Economic Advisers (1991) suggests thatany effect on capacity is transitory. Others who have been
critical ot the significance ot the capacity effect includeBerndt (1980), Berndt and Wood (1987), Denison (1979)and (1985), Darby (1984) and Olson (1988).
3The conditions required to obtain the equality ot these out-comes are discussed in Rasche and Tatom (1977a) andderived in Rasche and Tatom (1981). The shaded insert tothis article provides a summary of the analysis.
FEDERAL RESERVE BANK OF St LOUIS
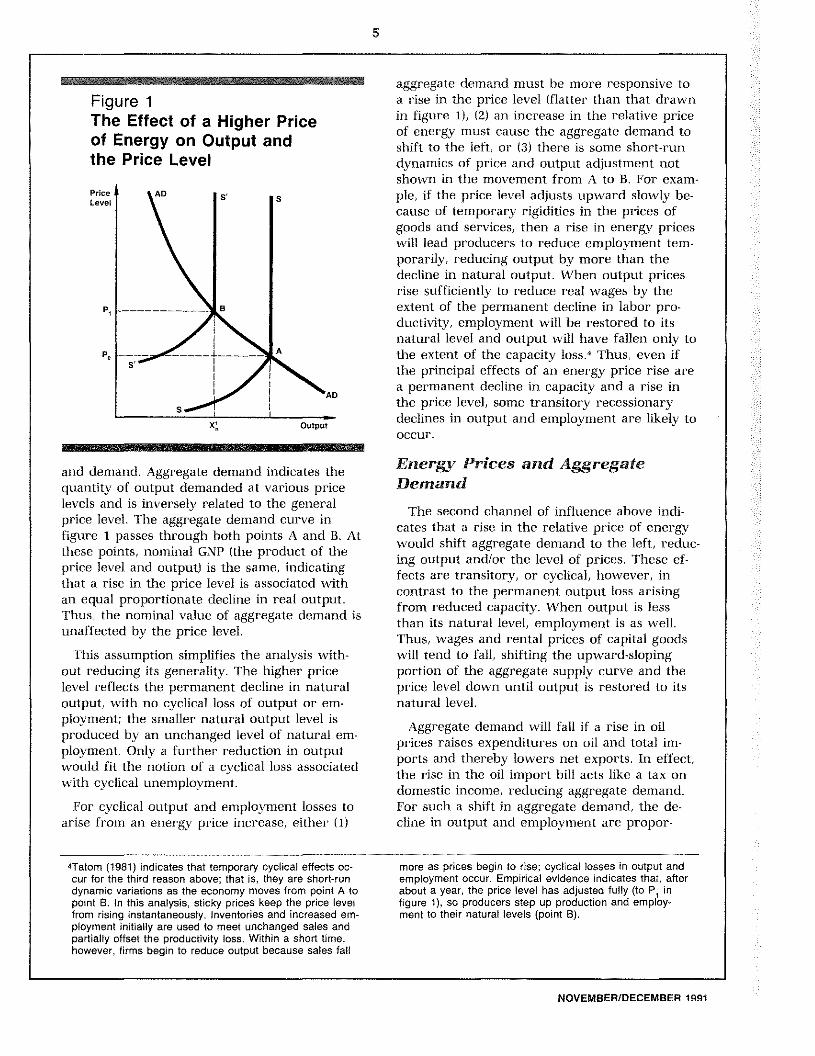
Figure 1The Effect of a Higher Priceof Energy on Output andthe Price Level
and demand. Aggregate demand indicates thequantity of output demanded at various pricelevels and is inversely related to the generalprice level. The aggregate demand curve infigure 1 passes through both points A and B. Atthese points, nominal GNP (the product of theprice level and output) is the same, indicatingthat a rise in the price level is associated withan equal proportionate decline in real output.Thus, the nominal value of aggregate demand isunaffected by the price level.
This assumption simplifies the analysis with-out reducing its generality. The higher pricelevel reflects the permanent decline in naturaloutput, with no cyclical loss of output or em-ployment; the smaller natural output level isproduced by an unchanged level of natural em-ployment. Only a further reduction in outputwould fit the notion of a cyclical loss associatedwith cyclical unemployment.
For cyclical output and employment losses toarise from an energy price increase, either (1)
4Tatom (1981) indicates that temporary cyclical effects oc-cur for the third reason above; that is, they are short-rundynamic variations as the economy moves from point A topoint 8. In this analysis, sticky prices keep the price levelfrom rising instantaneously. Inventories and increased em-ployment initially are used to meet unchanged sales andpartially offset the productivity loss. Within a short time,however, firms begin to reduce output because sales fall
5
aggregate demand must be more responsive toa rise in the price level (flatter than that drawnin figure 1), (2) an increase in the relative priceof energy must cause the aggregate demand toshift to the left, or (3) there is some short-rundynamics of price and output adjustment notshown in the movement from A to B. For exam-ple, if the price level adjusts upward slowly be-cause of temporary rigidities in the prices ofgoods and services, then a rise in energy priceswill lead producers to reduce employment tem-porarily, reducing output by more than thedecline in natural output. When output pricesrise sufficiently to reduce real wages by theextent of the permanent decline in labor pro-ductivity, employment will be restored to itsnatural level and output will have fallen only tothe extent of the capacity loss.~Thus, even ifthe principal effects of an energy price rise area permanent decline in capacity and a rise inthe price level, some transitory recessionarydeclines in output and employment are likely tooccur.
Energy Prices and AggregateDemand
The second channel of influence above indi-cates that a rise in the relative price of energywould shift aggregate demand to the left, reduc-ing output and/or the level of prices. These ef-fects are transitory, or cyclical, however, incontrast to the permanent output loss arisingfrom reduced capacity. When output is lessthan its natural level, employment is as well.Thus, wages and rental prices of capital goodswill tend to fall, shifting the upward-slopingportion of the aggregate supply curve and theprice level down until output is restored to itsnatural level.
Aggregate demand will fall if a rise in oilprices raises expenditures on oil and total im-ports and thereby lowers net exports. In effect,the rise in the oil import bill acts like a tax ondomestic income, reducing aggregate demand.For such a shift in aggregate demand, the de-cline in output and employment are propor-
more as prices begin to rise; cyclical losses in output andemployment occur. Empirical evidence indicates that, afterabout a year, the price level has adlusted fully (to P1 infigure 1), so producers step up production and employ-ment to their natural levels (point 8).
Price
Level
p,
III
IIIIIIIIIIIIII
Output
NOVEMBER/DECEMBER 1991
6
N TII~flk~tuJiS~btt pifeé ~àf~r~flj~ ~có~ ~~~\\~2~*~ ~ ,/4/~\ \ \~\/‘ ~ ~ ‘~ ~ ~ ~ ~ +~\t!?!1!~:~~i~i$t~/ ~:::~~ : ~~~~~~ ‘~ ~~\ : /\ ;~:I ~~
~ ~ ~ : ~ )y/ ~ ~ ~/~ It Mt ~\ /\/ ~/ ~ N
~ ~ ~ ~1lC,~1w \H ~~ ,p ~ 4\ ~ ~ ~, ot~Srwon~arcm*~t~C\ N N
4\ *11 ~ ~ N ~b*v~!!~~ ~ NN\ ~ / \* N ~ ~ ~ N ~ N N ~N N
N ~ t~~\ ~ N N NN N NN N N N N N~ N ~\/N ~ ~ ~,Lk~ ~ , ~\,~N\ \~\ ~ ~i ~ N\\N~N
N ~ ,~ N and ~ N N ~ N :N ‘ N /NN ~\ N
H I,NN~#~F~\t/N;~4S//
N N NN
/NN7\N~/NNN~N,/~/ ~ :~:%~N~ NN,N / N~’N / N/NNNN 4N: NaN ~~4NN </N\Nt/N\
N t*J)ttt NN >~ /
/ / / ~N N N n N
N ttt *rr ~> kmu~ptsdOedoI%N N\ Nato *tn~ ~ c~u~flx~ N
NN ,~\\ ~m~w*~ngn a/\ ~ / ~Zni,t~ / .~c+á~a /a~nkN t~
N / N / ~ Na ~ fl~ / ~N ~ / /4kN~N/k~/ Nin / N N NSt ~‘N bz~einstad *ort-ath zat$I
\flLN / / run / / ////4 NN /
N teW~q~np~ipd~Sná’Ntb N // N N NN
gswn scted ~baiktthefra N
N Seo9u N N~ N ~ NN~ea~ N eSapi toN a rmktN~ N at ~ N~s~ N
N N~ ~ StdS t 5 ~NSa~ c~ttht at~ to
jun tSnt~ ,idnnain Sdnbt N N t~tUØorC #St insho* iwo- ~~ NNofN~0L*~ S d4OiD utni ~ N ~*1UStN S SSCJ art bbs- N
~ ot ~ N N N. N N N \ótlS~aWe Msoos- ~~uISbn satUNN \\N __cNNN/NNNNNN///N/~NNNa/NNNM/\~s-Nd>~4~Ø~4N. NN\NN
N N N ~4 td prodtSug fl brol. of OU~~t$
N N át~terSS c~peck$voL ) bgbtr atN tjt~,Øttt~tos W4~NY’ ~fl\ ~rfl ~a / N~N __ N / NN i’tsn the ott
tffilsto**iq$8n ~I5S qt*flSiSltt N N ~ bN N N N N
Øedtt N~ NN ~S~OUtP*. // N\ N \N//~~~/N~ .NN\NN/.NNaNNN NN N N N
N w N N N~ N.o~N N a N
N NNf ~ od$N N NN~t~~spt N
tIOSIN / efn*p~t 841W N/ N pe~~ ~beNNN/~ // //N\ / \NNN/~ N\N\\
N N N N N N N / N~ / NN N N N
/ Jø*~*~~SNM~S Sntsnuttt bnf*-. N
~ ~*iS//\Nii Na~Ut NSS *SceMostSM;~msio.scateN ~ N N~ / N NN N N
~ N N ~ N N N N N N~/ N N / N N
N/N / \N~ N ~ >N~ ,//// N / N\~ aNaNNN
FEDERAL RESERVE BANK OF St LOUIS

7
~a ~ NNNN /N/~*~*’ /‘~P / ,:/
~ ~:. TN*/ N N ‘~‘ / %j~ N:/:~N :, / fl/j3~,N N/N / /// N ‘N / //N. / iht / /
N //NN N3*%4r ad A ~WhSltN / u
/ N N~ N / N N’ / N
/ / N / / /// N N ‘N /N//
/ ‘N / / N ~ / / N’ N N
NNN N~N N ~N / N N
N N / N N N / N ~ / 4 N NN / N nut edep NN~Ø~g~Ø~
N roustS N NN I ~tft
fle $ ~p • Nf~ lwie ‘fgN ~1%~t N
‘Xc N N~4p N jg~N erw’htb
N )mpb ouiw t n
N N N N N N ~N s-I N NNN N N N N
~t ~rsCN wprtqa~otSt1~5’ N N ~ N~ ,Np ~
/ N ~WN !iWWk~Sc ! P*. ~Sen~NN NN. N N ~fl ~N ¶ft5~ Ø~fl betweeflts %ilO’ ~ft~t*tnts’ a ft
r$SQU&~ WNfleaS Se p~aSF*afta~ ~ N N *~N N NN / N NNNN s
N / N N ‘~N M shatn tdv9y tN a NIN N NN N N ~ S~S~’ ~NN NNN N / _j~NR,~~$ta thflzpea-
N N ~ ~ N N N N N4 f~~n~M’~ç ~ Nr~u~N ~ ~ ~ ~ ~
0.N$j~ N: N N ~ ~ N
~ ~ thflfta taSS4 ~ this NNN N N Sc t~a~a’ & NMt ~ ot ~ant totalN >1~ ~ N N N / N NN N e N N N
N’ ~ !rzerw ra~ S(~C~fttt N NNN S eta exneMtureelSi, NN ~ N aftO liftN N ttS$t1~ Wt~~elSlStyof NNNNN , rtS N N N N fatS ‘S ona Sass N
N N N *NN \ NN 1 N NNN N N N N ~ OSNofN Qrtftt0rit&$~Ntfte
N NN”N~, N NN N N NNNNNNN NNN fl~ ‘N ~ IScSOOPNÔ N Se ~p~p~~$N
~$~ia asia deSflrodut*o ~4~-a)~,N NN N N NNNN deãa~ *t4°*a tnSffigtMth Sortr4eiftstaptt~ / Nfft~ NNNN N N tésour~fl ~ ~taasn
N q fete pppSSNè c(theHr g~s1trSe. N N N/ N fl ead~Nth~S~ ~ SN N N N N N N NW~ SSts N N N NN N WN ~ ~ ~
N N tp~$N’ ~ N N N N N N N - N N N N ‘NN~ N N
âlfnd Ov btu%*caØec~tSwoS’bea~zS N N N N N N N N N N N N N N N
bt~dete ospilSt is rd with capital that — N N N N N N N N N N N N N N
N N NN N N N NNNNN N N N N N N N N N/ NN N/ NN NN NN NNNN ‘N’ N NN NN NN NN N
o etar Policy d ii Pr eShocks
import status of a country determines the ef-fects of an energy price shock.” Countries that I’he appropriate monetary policy respon e toexport oil face larger aggregate demand when a rise in the relative price of energy depends on
its dominant channel of influence. If the higherenergy price only lowered aggregate demand,
porter when oil prices rise, and conversely policymakers could take offsetting actions towhen oil prices fall.° neutralize this shift by increasing the money
“Feldstein (1990) and the Council of Economic Advisers(1991) provide recent restatements of this shift in ag-gregate demand and the price-level induced movementalong the aggregate demand curve as the central chan-nels of influence of an oil price hike The Council of Eco-nomic Advisers also emphasizes a decline in realconsumption expenditures as a result of an oil price hikePerry (1991) argues that the oil price hike had little effecton the economy in 1990, because it did not reduce real income much (operating through the aggregate demandchannel above), nor did it induce the Fed “to raise interest
IIIIIIIIIIIIIIIII
tional to the rise in the oil price and the shareof oil imports in GNP. In this case, the net oil
oil prices rise; world aggregate demand and out-put are redistributed from oil importers to cx-
rates to fight inflation” as, he argues, it had in the past.~Achange in the relative price of energy could also affectaggregate demand by altering investment in plant, equip-ment and housing. Such an effect can account for adecline in the real interest rate, which is incompatible witha conventional model of aggregate demand. Reinhardt(1991) discusses the effects of energy price shocks on in-terest rates.
a NOVEMBER/DECEMBER 1991
8
supply, which would shift the aggregate de-mand curve back to the right.
If an energy price increase affects aggregatesupply, however, both raising the price leveland reducing natural output, policymakers couldattempt to offset the price level rise by reducingthe money stock to reduce aggregate demand.This would result in a cyclical loss in outputand employment as the economy’s output fellshort of its lower natural output level until theprice level declined sufficiently.
Alternatively, policymakers could attempt tooffset the reduction in output by raising ag-gregate demand. Raising deniand could not re-store the economy’s natural output, however; itwould not replace the energy and capital re-sources that firms can no longer afford to pur-chase or use. Instead, it would further raise theaggregate level of pt-ices associated with thesmaller level of capacity output.7
Thus, there is no real policy dilemma posedby oil price increases. Raising the money stockcannot offset a loss in natural output, whilereducing the money stock can only offset aprice level increase at the cost of a further lossin output and a cyclical rise in unemployment.Moreover, it is viitually impossible to alter mon-etary policy enough to fully offset the pricelevel surge because of the time it takes for achange in the money stock to affect the pricelevel and because of the relatively small size ofthe initial price response to changes in mone-tary policy.8 An unchanged growth rate for themoney stock is a policy that accepts the peima-nent output and price level consequences de-scribed above without compounding one or theother loss.
HAVE THE ECONOMIC EFFECTSOF OIL PRICE SHOCKSCHANGED?
Many analysts argued that the rise of oilprices in 1990 would have substantially less im-
pact on the U.S. economy than earlier oil pricehikes. There were two versions of this argu-ment. The first was that the adverse effects ofan oil price rise are proportional to the share ofoil imports in the economy and that this sharehad fallen since the earlier oil price shocks. Thesecond argument was that the effects of an oilprice rise are proportional to the use of energyper unit of output and that this dependence onenergy also had fallen.~
Does a Smaller Import ShareReduce the Adverse Effects of anOil Price Hike?
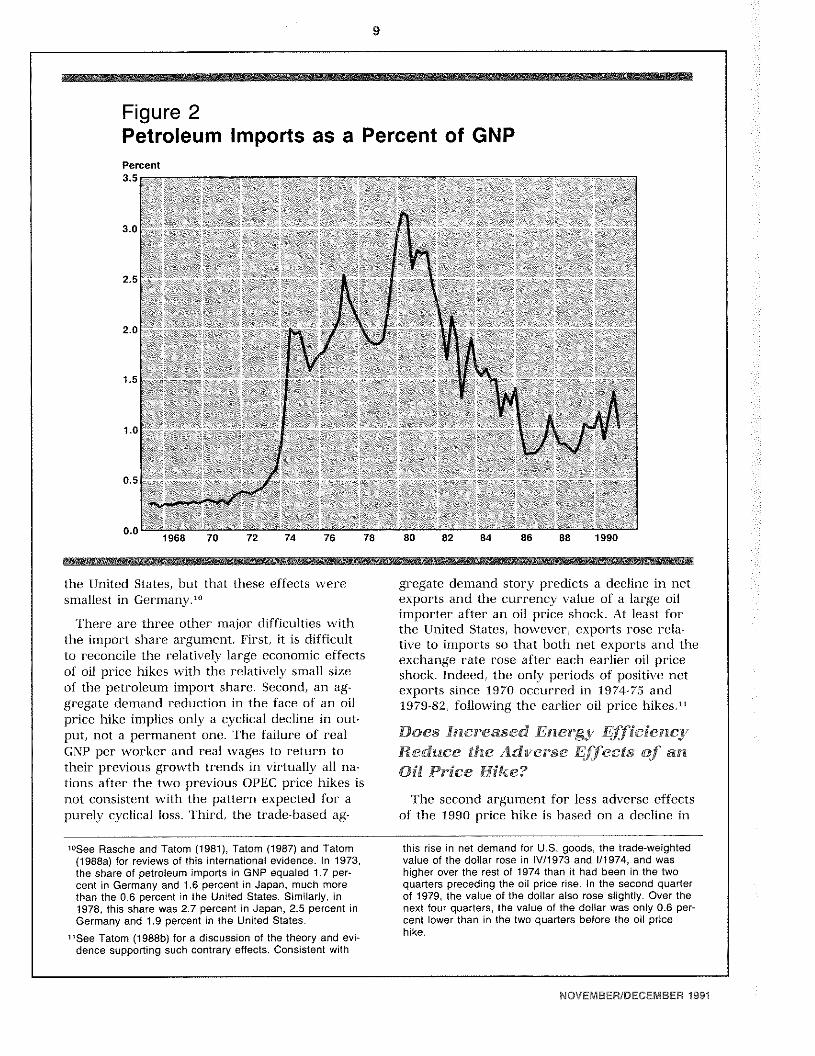
If the shaie of oil imports in GNP has fallen,then the first argument above implies that theeconomy’s aggregate demand and output havebecome less sensitive to a rise in oil prices.Figure 2 shows expenditures on petroleum im-ports as a percent of nominal GNP since 1970.In mid-1990, this share was about 1 percent,less than half its level in early 1979, but aboveits 0.6 percent share in 1973. Thus, the sharehad fallen below its level preceding only one ofthe previous two oil price shocks.
The import share argument has other short-comings. First, it suggests that oil-exportingcountries, including Canada in 1974 or theUnited Kingdom in 1979, should gain when oilprices rise, because net exports and aggregatedemand should rise. In each instance, however,output did not rise nor was there other evi-dence of a cyclical expansion following theprevious oil price shocks. The argument alsosuggests that countries that import a relativelysmall share of their oil, like the United States,will be less affected than countries that importrelatively niore of their oil, like Germany orJapan. The earlier experience with oil priceshocks indicates that, especially in 1973-74, boththe temporaty rise in inflation and the perma-nent loss in output were larger in Japan than in
7Kahn and Hampton (1990) contrasl three monetary policyoptions, which include iighiening to offset the price leveleffect, easing to offsei the cyclical effects and a neutralpolicy which “maintains constant monetary or nominalGNP growth’ Feldstein (1990) endorses the third option,nominal GNP targeting, and he also equaies this with un-changed money stock growth,
‘See Tatom (1981) and (1988a), for example, for evidenceon the relative size and lag lengths for energy price andmonetary policy effects on prices and output.
‘See Council of Economic Advisers (1991). Kahn andHampton (1990), Anderson, Bryan and Pike (1990), Brinner(1990). ‘How Big An Oil Shock” (1990), ‘‘Shocked Again”(1990). May (1990). Yanchar (1990) and Fieleke (1990) foranalyses thai emphasize one or both of these arguments.Fieleke, Kahn and Hampion. May and Yanchar emphasize,to varying degrees, that the expecied effecis also aresmaller because of a smaller expected rise in the price ofoil,
FEDERAL RESERVE BANK OF ST. LOUIS
I 9
Figure 2Petroleum Imports as a Percent of GNP
the United States, but that these effects weresmallest in Germany.1°
There are three other major difficulties withthe import shai-e argument. First, it is difficultto reconcile the relatively large economic effectsof oil price hikes with the relatively small sizeof the petroleum import share. Second, an ag-gregate demand reduction in the face of an oilprice hike implies only a cyclical decline in out-put, not a permanent one. The failure of realGNP per worker and real wages to return totheir previous growth trends in virtually all na-tions after the two previous OPEC price hikes isnot consistent with the pattern expected for’ apurely cyclical loss. Third, the trade-based ag-
“’See Rasche and Tatom (1981), Tatom (1987) and Tatom(1988a) for reviews of this international evidence. In 1973,the share of petroleum imports in GNP equaled 1.7 per-cent in Germany and 1.6 percent in Japan, much morethan the 0,6 percent in the United States. Similarly, in1978, this share was 2.7 percent in Japan, 2.5 percent inGermany and 1.9 percent in the United States.
115ee Tatom (1988b) for a discussion of the theory and evi-dence supporting such contrary effects. Consistent with
gregate demand story predicts a decline in netexports and the currency value of a large oilimporter after an oil price shock. At least forthe United States, however, exports rose rela-tive to imports so that both net exports and theexchange rate rose after each earlier oil priceshock. Indeed, the only periods of positive netexports since 1970 occui-red in 1974-75 and1979-82, following the earlier oil price hikes.”
Does Increased Energy EfficiencyReduce the Adverse Effects of anOil Price Hike?
The second argument for less adverse effectsof the 1990 price hike is based on a decline in
this rise in net demand for U.S. goods, the trade-weightedvalue of the dollar rose in lV/1 973 and /1974, and washigher over the rest of 1974 than it had been in the twoquarters preceding the oil price rise. In the second quarterof 1979, the value of the dollar also rose slightly. Over thenext four quarters, the value of the dollar was only 0.6 per-cent lower than in the two quarters before the oil pricehike.
II
Percent
3-5
IIIIIII 1968 70 72 74 76 78 80 82 84 86 88 1990
IIIIIIII
NOVEMBER/DECEMBER 1991

10
Figure 3Energy Use per Unit of Real GNP(Thousands of BTUs per dollar of real GNP, 1982 prices)25
20
15
10
5
01970
energy use per unit of output. According to thisargument, energy is less important to a firm’sproduction than in the past, so a rise in oilprices is expected to have a smaller effect onprices and production today than in the past.
Figure 3 shows total U.S. energy use per unitof output (measured in BTUs per unit of realGNP) from 1970 to 1988, the latest year availa-ble on this basis.”’ Energy use per unit of out-put has fallen sharply since 1973: ETUs usedper unit of real GNP were about 31 percentlower in 1988 than in 1973 and about 22 per-cent lo~vei-than in 1979. This rise in output perunit of energy is not surprising given the rise inthe relative price of energy since 1973, but it isnot relevant in assessing the importance ofenergy as a resource or in assessing whether
the effects of an energy price boost havedeclined in magnitude.
While energy use per unit of output is lowerthan earlier, the responsiveness of prices or out-put to a change in a resource’s price are pro-portional to the share of the resource’s cost intotal cost, not to the share of its quantity in out-put. Consider the familiar case of labor produc-tivity. Labor employment per unit of output inthe business sector declined by nearly one-thirdfront 1955 to 1973, as output per worker rosefrom $21,084 to $31,142 (1982 prices). Thus, theeconomy became less dependent on labor overthese 18 years—in exactly the same sense andto nearly the same extent as some have sug-gested about energy resources over the past 18years. Nevertheless, the share of labor in total
“’The energy expenditures and quantity data used forfigures 2 and 3 are from the Energy Information Adminis-tration, State Energy Price and Expenditure Report, 1988(September 1990).
72 74 76 78 80 82 84 86 1988
FEDERAL RESERVE BANK OF ST. LOUIS
I 11
Figure 4Energy Expenditures as a Percent of GNP
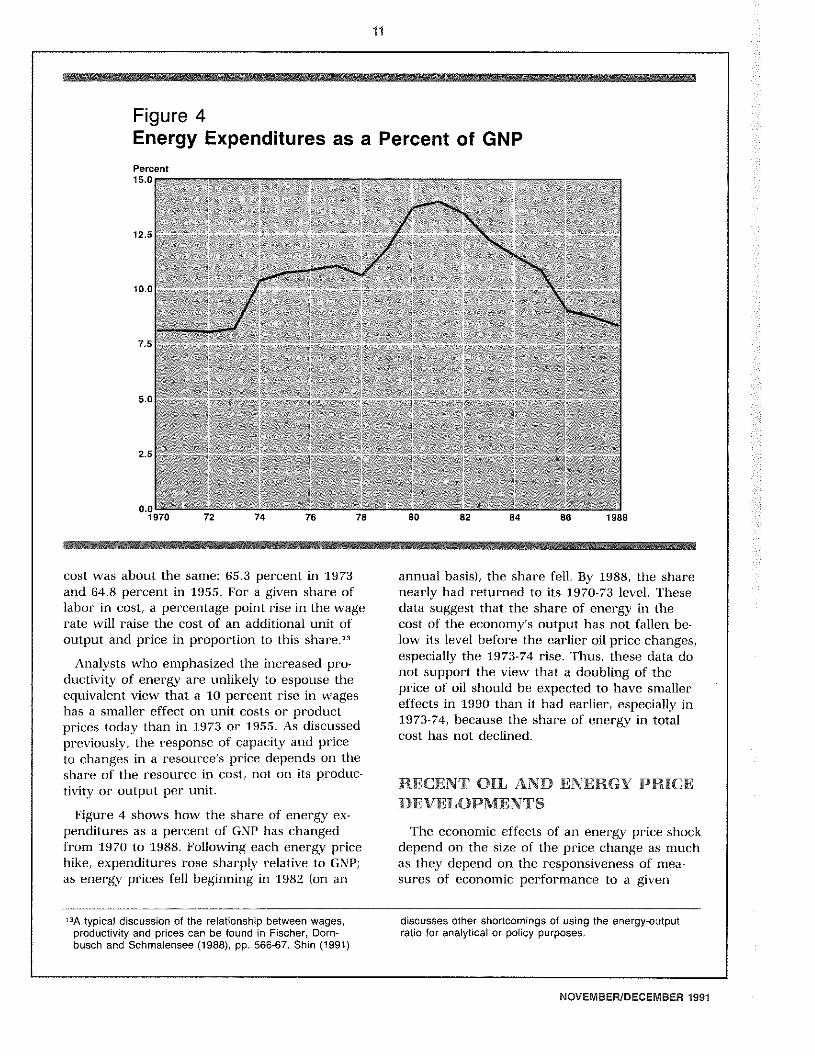
annual basis), the share fell. By 1988, the sharenearly had returned to its 1970-73 level. Thesedata suggest that the share of energy in thecost of the economy’s output has not fallen be-low its level before the earlier oil price changes,especially the 1973-74 rise. Thus, these data donot support the view that a doubling of theprice of oil should be expected to have smallereffects in 1990 than it had earlier, especially in1973-74, because the share of energy in totalcost has not declined.
RECENT OIL AND ENERGY PRICEDEVELOPMENTS
The economic effects of an energy price shockdepend on the size of the price change as muchas they depend on the responsiveness of mea-sures of economic performance to a given
discusses other shortcomings of using the energy-outputratio for analytical or policy purposes.
cost was about the same: 65.3 percent in 1973and 64.8 percent in 1955. For a given share oflabor in cost, a percentage point rise in the wagerate will raise the cost of an additional unit ofoutput and price in proportion to this share.13
Analysts who emphasized the increased pro-ductivity of energy are unlikely to espouse theequivalent view that a 10 percent rise in wageshas a smaller effect on unit costs or productprices today than in 1973 or 1955. As discussedpreviously, the response of capacity and priceto changes in a resource’s price depends on theshare of the resource in cost, not on its produc-tivity or output per unit.
Figure 4 shows how the share of energy ex-penditures as a percent of GNP has changedfrom 1970 to 1988. Following each energy pricehike, expenditures rose sharply relative to GNP;as energy prices fell beginning in 1982 (on an
“’A typical discussion of the relationship between wages,productivity and prices can be found in Fischer, Dorn-busch and Schmalensee (1988), pp. 566-67. Shin (1991)
Percent15.0
12.5
10.0
7.5
5-0
2.5
0.01970
IIIIIIIIIIIIIIIII
NOVEMBER/DECEMBER 1991
12
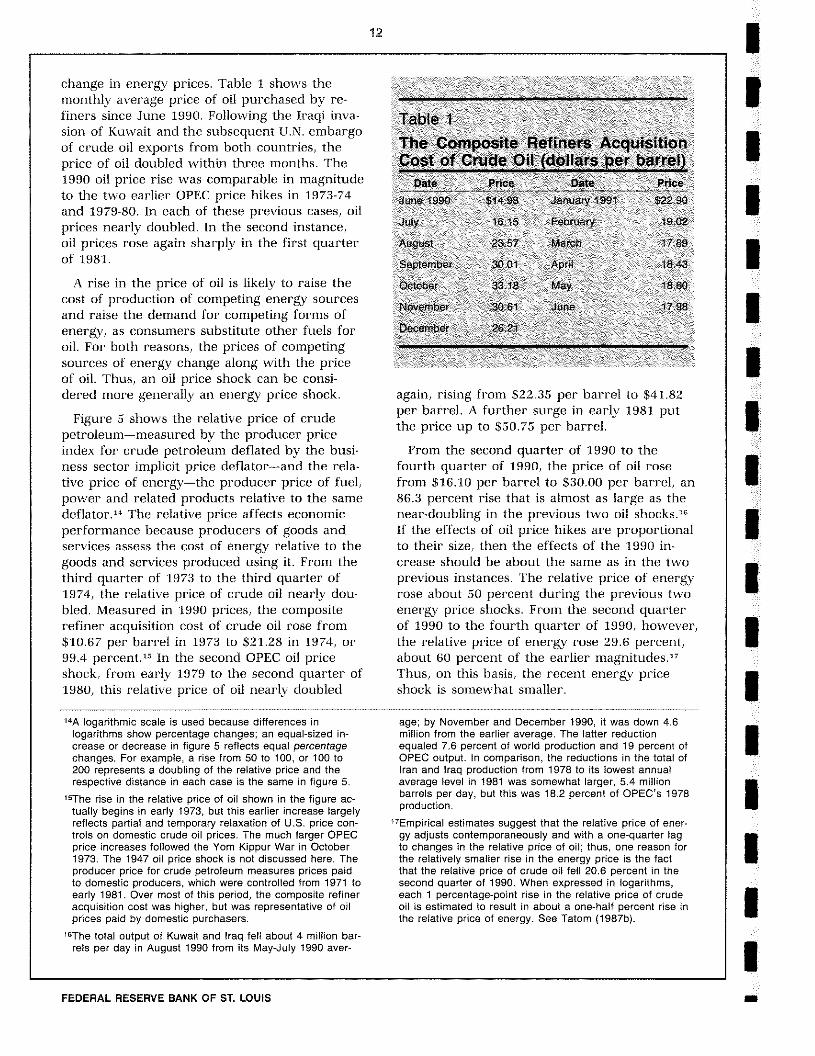
change in energy prices. Table I shows themonthly average price of oil purchased by re-finers since June 1990. Following the Iraqi inva-sion of Kuwait and the subsequent U.N. embargoof crude oil exports from both countries, theprice of oil doubled within three months. The1990 oil price rise was comparable in magnitudeto the two earlier OPEC price hikes in 1973-74and 1979-80. In each of these previous cases, oilprices nearly doubled. In the second instance,oil prices rose again sharply in the first quarterof 1981.
A rise in the price of oil is likely to raise thecost of production of competing energy sourcesand raise the demand for competing forms ofenergy, as consumers substitute other fuels foroil. For both reasons, the prices of competingsources of energy change along with the priceof oil. Thus, an oil price shock can be consi-dered more generally an energy price shock.
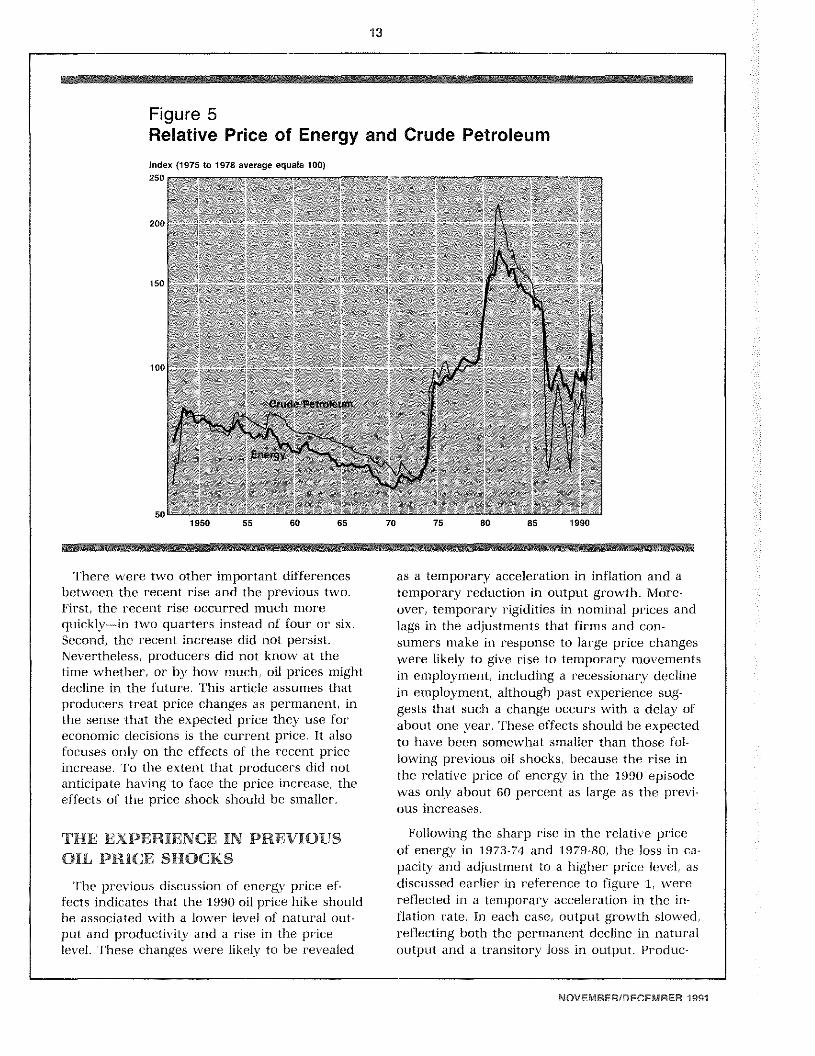
Figure 5 shows the relative price of crudepetroleum—measured by the producer priceindex for crude petroleum deflated by the busi-ness sector implicit price deflator—and the rela-tive price of energy—the producer price of fuel,power and related products relative to the samedeflator.14 The relative price affects economicperformance because producers of goods andservices assess the cost of energy relative to thegoods and services produced using it. From thethird quarter of 1973 to the third quarter of1974, the relative price of crude oil nearly dou-bled. Measured in 1990 prices, the compositerefiner acquisition cost of crude oil rose from$10.67 per barrel in 1973 to $21.28 in 1974, or99.4 percent.”’ In the second OPEC oil priceshock, from early 1979 to the second quarter of1980, this relative price of oil nearly doubled
Table 1The Composite Refiners AcquisitionCost of Crude Oil (dollars per barrel)
Date Price Date PriceJuie 1990 $1498 January 1991 $2290
July 16 15 February 1902
Augusl 23 57 March 17 89
September 3001 AprI 18.43
October 33.18 May 1860
November 3061 June 1798
December 2621
again, rising from $22.35 per barrel to $41.82
per barrel. A further surge in early 1981 putthe price up to $50.75 per barrel.
From the second quarter of 1990 to thefourth quarter of 1990, the price of oil rosefrom $16.10 per barrel to $30.00 per barrel, an86.3 percent rise that is almost as large as thenear-doubling in the previous two oil shocks.”If the effects of oil price hikes are proportionalto their size, then the effects of the 1990 in-crease should be about the same as in the twoprevious instances. The relative price of energyrose about 50 percent during the previous twoenergy price shocks. From the second quarterof 1990 to the fourth quarter of 1990, however,the relative price of energy rose 29.6 percent,about 60 percent of the earlier magnitudes.”Thus, on this basis, the recent energy priceshock is somewhat smaller.
‘~Alogarithmic scale is used because differences inlogarithms show percentage changes; an equal-sized in-crease or decrease in figure 5 reflects equal percentagechanges. For example, a rise from 5010 100, or 100 to200 represents a doubling of the relative price and therespective distance in each case is the same in figure 5.
“’The rise in the relative price of oil shown in the figure ac-tually begins in early 1973, but this earlier increase largelyreflects partial and temporary relaxation of U.S. price con-trols on domestic crude oil prices. The much larger OPECprice increases followed the Yom Kippur War in October1973. The 1947 oil price shock is not discussed here. Theproducer price for crude petroleum measures prices paidto domestic producers, which were controlled from 1971 toearly 1981. Over most of this period, the composite refineracquisition cost was higher, but was representative of oilprices paid by domestic purchasers.
“The total output of Kuwait and Iraq fell about 4 million bar-rels per day in August 1990 from its May-July 1990 aver-
age; by November and December 1990, it was down 4.6million from the earlier average. The latter reductionequaled 7.6 percent of world production and 19 percent ofOPEC output. In comparison, the reductions in the total ofIran and Iraq production from 1978 to its lowest annualaverage level in 1981 was somewhat larger, 5.4 millionbarrels per day, but this was 18.2 percent of OPEC’s 1978production.
“Empirical estimates suggest that the relative price of ener-gy adjusts contemporaneously and with a one-quarter lagto changes in the relative price of oil; thus, one reason forthe relatively smaller rise in the energy price is the factthat the relative price of crude oil fell 20.6 percent in thesecond quarter of 1990. When expressed in logarithms,each 1 percentage-point rise in the relative price of crudeoil is estimated to result in about a one-half percent rise inthe relative price of energy. See Tatom (1987b).
FEDERAL RESERVE BANK OF St LOUIS
I 13
Figure 5Relative Price of Energy and Crude Petroleum
as a temporary acceleration in inflation and atemporary reduction in output growth. More-over, temporary rigidities in nominal prices andlags in the adjustments that firms and con-sumers make in response to large price changeswere likely to give rise to temporary movementsin employment, including a recessionary declinein employment, although past experience sug-gests that such a change occurs with a delay ofabout one year. These effects should he expectedto have been somewhat smaller than those fol-lowing previous oil shocks, because the rise inthe relative price of energy in the 1990 episodewas only about 60 percent as large as the pi-evi-ous increases.
Following the sharp rise in the relative priceof energy in 1973-74 and 1979-80, the loss in ca-pacity and adjustment to a higher price level, as
discussed earlier in reference to figure 1, werereflected in a temporary acceleration in the in-flation rate. In each case, output growth slowed,reflecting both the permanent decline in naturaloutput and a transitory loss in output. Produc-
‘I’here were two other important differencesbetween the recent rise and the previous two.First, the recent rise occurred much morequickly—in two quarters instead of four or six.Second, the recent increase did not persist.Nevertheless, producers did not know at thetime whether, or by how much, oil prices mightdecline in the future. ‘I’his article assumes thatproducers treat price changes as permanent, inthe sense that the expected price they use foreconomic decisions is the current price. It alsofocuses only on the effects of the recent priceincrease. To the extent that producers did notanticipate having to face the price increase, theeffects of the price shock should be smaller.
THE EXPERIENCE IN PREVIOUS
OIL PRICE SHOCKS
The previous discussion of energy price ef-fects indicates that the 1990 oil price hike shouldhe associated with a lower level of natural out-put and productivity and a rise in the pricelevel. These changes were likely to be revealed
Index (1975 to 1978 average equals 100)250
200’
ISO
loOl
so’
IIIIIIIIIIIIIIIII
1950 55 60 65 70 75 80 85 1990
NOVEM8ER/DECEMSER 1991

14
tivity (and real wages) fell.” Generally, the per-manent loss in output and productivity and therise in prices were experienced first, with thetemporary surge in inflation (as measured bythe GNP deflator) delayed about two quarters.”’Employment declined much later and for only afew quarters. Cyclical unemployment associatedwith an oil price rise peaked about six quarterslater, before quickly dissipating.
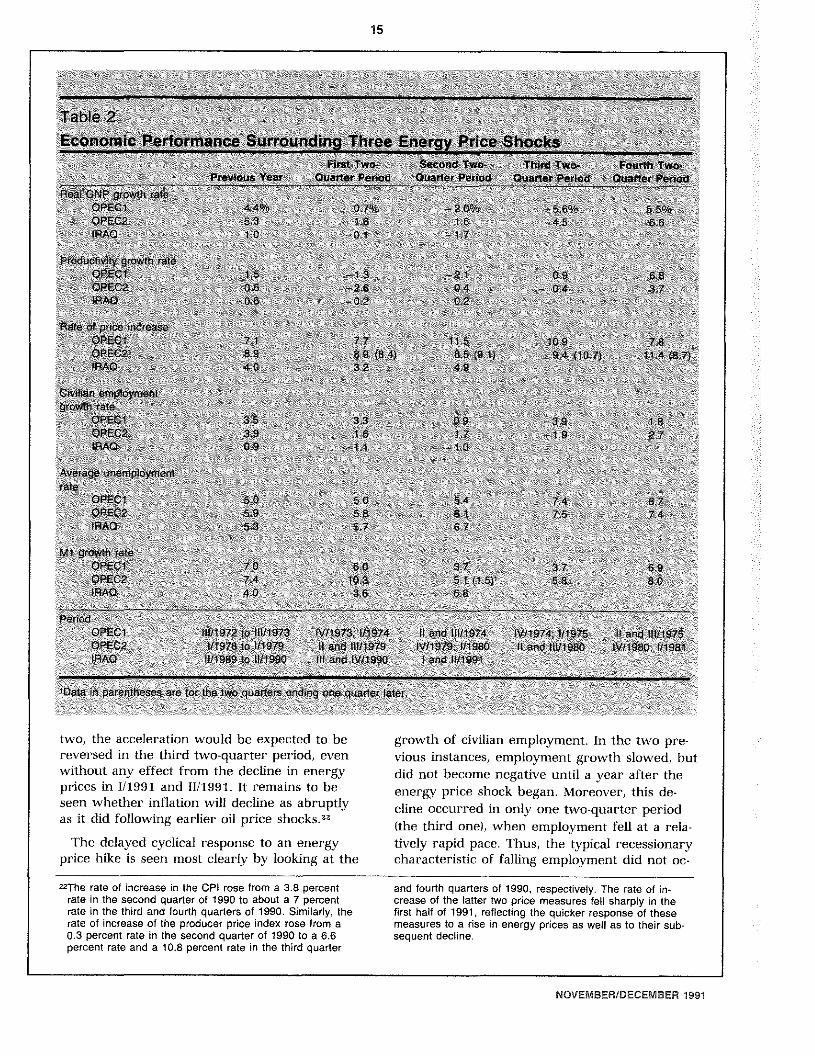
Table 2 shows these developments for thethree most recent large energy price hikes. Forperiods surrounding each oil price hike, the ta-ble provides real GNP growth, productivity (bus-iness sector output per hour) growth, the rateof increase in the GNP deflator, civilian employ-ment growth, the average unemployment ratefor the civilian labor force and money stock(Ml) growth. Each measure is provided for theyear before and the first four consecutive two-quarter periods following the shock. Two-quar-ter periods are used to simplify the data presen-tation, although the timing of energy priceeffects facilitates the usefulness of this proce-dure. OPECI refers to the first oil price shockwhich began in IV/1973. OPEC2 begins in 11/1979and IRAQ begins in 111/1990.
As table 2 indicates, real GNP growth slowedfollowing the two previous oil price hikes, butdid not become negative on a two-quarter basisuntil after the first two quarters (OPEC1) orafter a year (OPECZ). The slowing in outputgrowth reflects both the decline in natural out-put and, principally later, a temporary cyclicalloss in output. Table 2 also shows that the ex-pected productivity decline (negative growth) oc-curred more quickly than the decline in realGNP in the previous two cases; it began in thefirst two quarters of the energy price shock in
each case. Both productivity and output growthshow a sharp cyclical acceleration in the lasttwo-quarter period.
The most recent energy price shock, like theearlier two, was accompanied by an immediatedechne in productivity and a slowing in outputgrowth.”’ Output growth became negative earlierthan in the previous two cases. Since the recentenergy price hike occurred over only two quar-ters, the period of decline in productivity andoutput growth should be correspondingly shorterthan in the previous two instances. The slightrise in productivity growth in the second two-quarter period is consistent with this expectation.
In the previous two instances, the decline inproductivity and natural output was reflected,with about a two-quarter lag, in a sharp andtemporary acceleration in the rate of price in-crease as measured by the GNP deflator. Thus,in the second two-quarter period in OPECI, in-flation accelerated sharply and only temporarily,reflecting the one-time adjustment in the pricelevel. The same acceleration occurs in OPEC2,but with a one-quarter lag; the data for thetwo-quarter period ending one quarter later areshown in parentheses. As table 2 shows, how-ever, in the first two-quarter period,- the rate ofincrease in the GNP deflator rose (OPEC1) orwas unchanged (OPEC2); in the latest instance,it declined.”’
In the previous two cases, the delayed acceler-ation in the rate of price increase persisted forabout four quarters (five quarters for OPEC2),about as long as the period of sharp increasesin energy prices. There is also an accelerationin the recent second two-quarter period (1/1991and 11/1991). Since the latest price hike occurredover half as many quarters as in the previous
“’These developments were observed in nearly all countries.The notable exception was that income policies impededthe reductions in real wages (and, therefore, in laborproductivity) in some countries, especially in 1973-74, sothat the effective supply of natural employment fell, furtherreducing natural output. See Rasche and Tatom (1977a),(1977b) and (1981), Tatom (1988a) and (1987). Hamilton(1983) also provides empirical evidence supporting thepermanent effect on U.S. real GNP. Helliwell, Sturm, Jar-rett and Salou (1986) provide international evidence on theeffect on natural output.
195ee, for example, Tatom (1981) and (1988a). The lag forthe PCE deflator and CPI is shorter (one quarter) and themagnitude is larger for these consumer price series, be-cause the share of energy cost in expenditures is largerfor consumer expenditures than for GNP as a whole.Thus, the effect of a given rise in oil prices is larger forconsumer price inflation measures. The effects onproducer prices occur even faster and are even larger.
““Productivity growth had declined more rapidly in the yearbefore the recent oil price shock than it did in the initialtwo-quarter period, so productivity growth did not actuallyslow in the second half of 1990.
“‘The initial decline in the rate of price increase in the firsttwo-quarter period is not out of line. In each of the previ-ous initial two-quarter periods, this rate was much lower inat least one of the two quarters. In particular, in the firstquarter of 1974, the rate of increase of the deflator fell toa 5.6 percent rate; in 1979, it fell from 9.5 percent in thefirst quarter to a 9.2 percent rate in the second quarterand to 8.5 percent in the third quarter of 1979.
II
I
fl~OM P v~R~JVflr9T tflflt9
I 15
:\ \\~~ ~ ~ ~ \ /~\ ~ \~ ~\ ~ ~ ~ ~ \ ; ‘ 2 ~ ~~ ~ ~ ~ ~ ~ ~‘~ ~ y ‘ / — ~ ~ 2 / \ ‘ ~ ~,/
I H~ ~ ~ ~ ~ ~ ~~-~\/
t~~1e\Z: ~ ~ ~ ~ >
I S~mw~~*~j/iflUt~U~ ~I~~ ~~:~,:!L4\\z:/ \/~t~/ft~/\\~ ~\ ! ~ ~, ~ , ~ ~ \,~/\\\\/ > ~ ct~ttw~~ ~S~4~w~‘ ;~ 7~WZw~~ ~ ~
~ou*Xeth Sat Sat ~ettO~ ~Øe1fl*P1~4I*/~taTtot~*ttOd
I ~ >14 >~>~ \‘N 44 >> 444 4 ~ N4 >‘
2 >7 445/4tRW> >7 ) ~/ ~>*>t >2 >‘‘
I >~ >1 / 4 ‘/4> 4fládudlw$’ N,, “>1,~2”, >7>1N~ > 4/4/4,44
/ 44 14 “
/ I S / >-4S ‘~ / 2 / /\,~
I tAG~\/4N i: >7’7 4/ ,‘/47,~ ,,~/4/ >7 ‘>44
/ ,,‘I / >‘/44 >7” \>‘ >~c’ ‘>‘ /
/ >7 SI / / / v” /5 •, >~
7a5ti4 ~/5 ttE~i/>7~’~~O~’ 2 / at4 ,, / 4
4/1,4 N1~1I;’”y/4/’/7, ~“~: ,,/4~’/49ft~tfJfl**t / // >7 4/> >7>7 44 7, / 4 /
‘4 / 4 //4~> 2 44/N 4 4/ >7, / >4
‘a 2 / :~, / S~MCZ I /4 ~>~n ~
~21~q>~Ic 44>44/ :t~ ::>7/44H~tI >AVsrI9i’w~n~tMent 44 44 4 / 7 >4 / 24 4, N
4>4 4447 4> 7 >4 4 4 4,’ 4 4
2 4 4 Nfl ‘~ 4’ 544 >7” 44 >4 5/ 4> ‘>1 / 44 4744 44I ~9ii:
Mtgtmte 4 >44 >4 >4 44 4>
>>>~PE>>\>>> ,4\4,
I SitP$A&t~ 44 St 4
$rmad~ 4>,~ 44 444
I >> ~. iflIt9YZttlWt$7S’ tV4~iSUIW4 ~DaStWiØ4 twin,>); P71 >Itanflwfls~ QPEC2 tel (I — IWIfl MISn t980 1 flS W158~ W~~oIRAQ>,> ‘ftI$$to>J tfl jftattqMi$9G >l~aSW$91>>> > >
I tflt’prsttheses wbrtft ostflthGndmi,>nø *riaet > 4>44 4 >4>7
two, the acceleration would be expected to be growth of civilian employment. In the two pre-reversed in the third two-quarter period, even vious instances, employment growth slowed, butwithout any effect from the decline in energy did not become negative until a year after the
prices in 1/1991 and 11/1991. It remains to be energy price shock began. Moreover, this de-seen whether inflation will decline as abruptly dine occurred in only one two-quarter periodas it did following earlier oil price shocks.”” (the third one), when employment fell at a rela-
I The delayed cyclical response to an energy tively rapid pace. Thus, the typical recessionaryprice hike is seen most clearly by looking at the characteristic of falling employment did not oc-
I “2The rate of increase in the CPI rose from a 3.8 percent and fourth quarters of 1990, respectively. The rate of in-rate in the second quarter of 1990 to about a 7 percent crease of the latter two price measures fell sharply in therate in the third and fourth quarters of 1990. Similarly, the first half of 1991, reflecting the quicker response of theserate of increase of the producer price index rose from a measures to a rise in energy prices as well as to their sub-0.3 percent rate in the second quarter of 1990 to a 6.6 sequent decline.percent rate and a 10.8 percent rate in the third quarter
NOVEMBER/DECEMBER 1991

16
cur until a year after the onset of the two pre-vious energy price hikes.
The unemployment rate also did not rise im-mediately after the two previous adverse energypr’ice shocks. In 1973-74, it fell slightly in thefourth quarter of 1973, rose only 0.8 percen-tage points by the third quarter of 1974, thenpeaked 3.3 percentage points higher three quar-ters later.”~The unemployment rate peaked sixquarters after the initial surge in energy prices,in the last period shown in the table. In thesecond quarter of 1979, the initial quarter ofOPEC2, the unemployment rate also fell slightly,then rose gradually for the next three quartersso that it was only 0.4 percentage points higherin 1/1980 than it was before the energy priceshock. The unemployment rate then rose 1.4percentage points to a peak in 111/1980, six quar-ters after the initial energy price surge.”’
In the most recent case, the unemploymentrate rose immediately, climbing from 5.5 per-cent in July 1990 to 7 percent in June 1991.Such a rise is substantially different ftomn thepattern in the initial stages of the previous en-ergy price shocks.
Its behavior might better he understood in thecontext of the slowing in U.S. economic activitythat began in 1988. For example, civilian em-ployment actually began declining sharply inMarch 1990, five months before the energypt-ice hike; civilian employment fell at a 0.9 per-cent rate from March to July 1990 and declinedfurther at a 0.5 percent rate from July to Oc-tober 1990, when energy prices peaked; fromOctober 1990 to August 1991, such employmentfell at a 1.3 percent rate. Thus, the path of eco-nomic activity downward into recession hadbegun well before energy prices rose.25
A Coniparison of Changes in Mone-tary Policy Actions
Each of the two previous oil shocks were fol-lowed by changes in monetary policy actions.There is no clear initial pattern, as moneygrowth slowed in the initial two quarters in1973-74 but accelerated in 1979. As shown atthe bottom of table 2, however, in each case,Ml growth then slowed sharply during the se-cond two-quarter period, at the same time thatthe rate of price increase temporarily accelerat-ed.2” Then, in each instance, Nil growth acceler-ated sharply in the fourth two-quartet- periodfollowing the sharp rise in the unemploymentrate.
The expectation that the economy wouldquickly experience a recessionary rise in unem-ployment because of the 1990 oil price rise waswidespread. There were equally widespreadwarnings against repeating the “typical” policyresponse of easing monetary policy to combatthis unemployment.”’ While there is evidence ofrising unemployment and subsequent accelera-tions in Ml growth following previous oil pricesurges, these changes came more than a yearafter the initial oil price rise. These changes alsooccurred after the substantial slowing of Mlgrowth and the transitory inflation rate hikethat are more closely associated with the oilprice increases.
In the most recent case, money (Ml) growthslowed from a 4.8 percent rate from IV/1989 to11/1990 to a 3.7 percent rate in 111/1990 and to a3.5 percent rate in lV/1990. Money growthquickly reversed course, however, acceleratingto a 6.8 percent rate, as the unemployment ratecontinued to rise in the first half of 1991. This
““One explanation for the initial decline in the unemploy-ment rate when oil prices rise relies on the capacity lossand “sticky” prices. The initial fall in productivity and ini-tial absence of a price-related decline in aggregate de-mand when oil prices rise require that producers raiseemployment to offset some of the output loss and avoidlarger-than-desired depletion of inventory. See Tatom(1981) and Ott and Tatom (1986) for discussions of this ef-fect. Rasche and Tatom (1977a) show that employmentrose during the first three quarters of the 1973-74 oilshock and did not fall until five quarters later.
“41n this second instance, a further rise in energy prices latein 1980 and early in 1981 contributed to a further rise inthe unemployment rate about a year later, from IV/1981 to1/1982.
““Other analysts have emphasized this point. See Weiden-baum (1990) and Erceg and Leovic (1990), for example.
““After late 1982, monetary policymakers placed relativelymore emphasis on M2 instead of Ml. Another measure,
the adjusted monetary base, is often a convenient sum-mary measure of monetary policy actions. Higher energyprices significantly raise relative currency demand onequarter later, reducing monetary aggregates relative to theadjusted monetary base; see Tatom (1990). Thus, mone-tary base growth is less useful as an indicator of monetarypolicy during energy price shocks. Bullard (1991) discuss-es these and other indicators of monetary policy and thepotentially conflicting signals they offer.
“For example, according to Trehan (1990), “Researchershave generally concluded that the Fed eased policy toovercome the reduction in output caused by the oil embar-go” and “.. the Fed’s initial response to the second oilshock also was similar to its response to the first oilshock.” See also, Council of Economic Advisers (1991),which indicates that policy was excessively stimulative pri-or to the previous oil shocks so that it lacked credibility,making efforts to ease ineffective. The Council of Econom-ic Advisers (p. 80) suggests such temporary actions wouldbe appropriate and effective today.
III
FEDERAL RESERVE BANK OF St LOUlS a

17
acceleration in Ml growth occurred earlier thanit had following the previous oil pride hikes,although it did follow both a previous slowingin Ml growth and a recessionary rise in the un-employment rate, just as had similar accelera-tions in Ml following the two previous energyprice increases.””
CONCLUSION
The rise in oil prices from August to October1990 set in motion renewed concern and confu-sion over both the effects of oil price hikes andthe appropriate monetary policy response. Threeviews achieved widespread acceptance. First, theeconomy was believed to be less sensitive to oilprice hikes than it had been earlier. Second, itwas widely believed that the principal and mostimmediate effect would be a cyclical decline inoutput and employment. Third, analysts believedthat the Fed would ease policy, as it had whenfaced with this problem in the past.
These views are at odds with previous ex-perience. In 1990, the share of oil imports inGNP and energy per unit of GNP had not fallento the level before the first oil price shock in1973. Moreover, the relevant parameter, theshare of energy in cost, had not fallen below its1973 level either. Thus, U.S. economic perfor-niance should not have become less sensitive tooil price shocks than it was before. In addition,negative employment growth and an accelera-tion in money growth had not characterized theinitial year of previous energy price shocks.
Earlier evidence suggests that the principalcost of an energy price hike is the loss in capac-ity output and productivity. A counterpart ofthis loss is a one-time surge in the general levelof prices, which follows the energy price hikerelatively closely. The adverse cyclical conse-quences of past shocks occurred later. The prin-cipal policy response following previous oil pricehikes was a slowing in money growth. Later,when inflation declined and the unemploymentrate rose sharply, money growth accelerated.
The 1990 oil price rise occurred against thebackdrop of a slowing in money and output
28M2 shows the same pattern. It grew at a 2.5 percent ratefrom Il/i 990 to lV/l 990, down from a 4 percent rate in11/1990 or the 5.1 percent rise in the two-quarter periodending in 11/1990. In the first half of 1991, M2 growth alsorose, but only to a 4.2 percent rate. Bullard (1991) indi-cates that Fed decisionmakers were keenly aware of thepolicy dilemma and chose to pursue a course of neither
growth that had been under way since late in1988. Thus, the expected productivity declineand temporary surge in inflation were accompa-nied by a continuing decline in employment andcyclical output loss. While these developmentswere uncharacteristic of the initial effects ofprevious oil price hikes, monetary growth slowedin the second half of 1990 anyway.
There were other distinguishing features as-sociated with the 1990 oil price hike. Foremostamong them was its brevity: it occurred over athree-month period and was nearly reversed inanother five months. Thus, while the responseof output, productivity and prices appears con-sistent with the capacity-loss-induced effects as-sociated with previous oil price doublings, thesubsequent decline in oil prices from October1990 to March 1991 can be expected to resultin offsetting price, output and employmentmovements.
IIIIIIIIIIIIIII
I
REFERENCES
Anderson, Gerald H., Michael F Bryan, and Christopher J.Pike. “Oil, the Economy and Monetary Policy,” FederalReserve Bank of Cleveland Economic Commentary(November 1, 1990).
Berndt, Ernst. “Energy Price Increases and the ProductivitySlowdown in United States Manufacturing,” The Decline inProductivity Growth, Federal Reserve Bank of Boston Con-ference Series, no. 22 (1980), pp. 60-89.
Berndt, Ernst R., and David 0. Wood. “Energy Price Shocksand Productivity Growth: A Survey/in Robert C. Gordan,et. al., eds., Energy: Markefs and Regulation, Essays inHonor of MA. Me/man (MIT Press, 1987), pp. 305-67.
Brinner, Roger E. ‘Finding Keys to Turn,” U.S. FbrocastSummary (DRI/McGraw Hill, October 1990).
Bullard, James B. “The FOMC in 1990: Onset of Reces-sion:’ this Review (May/June 1991), pp. 31-53.
Corcoran, Patrick J. “Putty’ and ‘CIay’—A Parable forPotential GNP,” Prudential Economics, The Prudential(February 15, 1990), pp. 6-9.
Council of Economic Advisers. “Oil Price Shocks and Eco-nomic Policy[ chapter 3 in Economic Report of the Presi-dent (1991), pp. 79-110.
Darby, Michael R. “The U.S. Productivity Slowdown: A Caseof Statistical Myopia:’ American Economic Review (June1984), pp. 301-22.
Denison, Edward F Trends in American Economic Growth,1929-1982 (The Brookings Institution, 1985).
“Explanations of Declining Productivity Growth’Survey of Currenf Business (August 1979, Part II), pp. 1-24.
Erceg, John J., and Lydia K. Leovic. “The Outlook After theOil Shock: Between Iraq and a Soft Place,” FederalReserve Bank of Cleveland Economic Commenfaty (Oc-tober 15, 1990).
easing nor tightening. He indicates that there was a con-cern for actual inflationary pressures late in 1990, but con-cern for the cyclical consequences of the oil price hikewas framed only in terms of the potential risk.
NOVEMBER/DECEMBER 1991

18
Feldstein, Martin. “The Fed Must Not Accommodate Iraq[Waif Street Journal, August 13, 1990.
Fieleke, Norman S. “Oil Shock III?” New England EconomicReview (September/October 1990), pp. 3-10.
Fischer, Stanley, Rudiger Dornbusch, and RichardSchmalensea Economics, 2nd ed. (McGraw Hill BookCompany, 1988).
Hamilton, James D. “Oil and the Macroeconomy since WorldWar II,” Journal of Political Economy (April 1983), pp.228-48,
Helliwell, John, Peter Sturm, Peter Jarrett, and Gerard Salou,“The Supply Side in the OECD’s Macroeconomic Model,”OECD Economic Studies (Spring 1986), pp. 75-131.
Hickman, Bert, Hillard G. Huntington, and James L.Sweeney. Macroeconomic Impacts of Energy Shocks (NorthHolland Press, 1987).
“How Big An Oil Shock,” The Economist (August 11, 1990),pp. 12-13
Kahn, George A., and Robert Hampton, Jr. “Possible Mone-tary Policy Responses to the Iraqi Oil Shock,” FederalReserve Bank of Kansas City Economic Review (Novem-ber/December 1990), pp. 19-32.
Karnosky, Denis S. “The Link Between Money andPrices—1971-76,” this Review (June 1976), pp. 17-23.
May, Todd Jr. “Oil Prices Won’t Bring a Recession’ For-tune Forecast/Special Report, Fortune (September 10,1990), pp. 51-52.
Olson, Mancur. “The Productivity Slowdown, The Oil Shocksand The Real Cycle’ Journal of Economic Perspectives(Fall 1988), pp. 43-69.
Ott, Mack, and John A. Tatom. “Are Energy Prices Cycli-cal?”Energy Economics (October 1986), pp. 227-36.
Perry, George L. “The Anomalous Recession,” The Brook-ings Review (Spring 1991), p. 51.
Rasche, Robert H., and John A. Tatom. “Energy PriceShocks, Aggregate Supply and Monetary Policy: The The-ory and the International Evidence,” in Karl Brunner andAllan H. Meltzer, eds., Supply Shocks, Incentives and Na-tional Wealth, Carnegie-Rochester Conference Series onPublic Policy (North Holland, 1981), pp. 9-93.
“The Effects of the New Energy Price Regime onEconomic Capacity, Production and Prices,” this Review(May 1977a), pp. 2-12.
“Energy Resources and Potential GNP’ thisReview (June 1977b), pp.10-24.
Reinhart, Vincent, “Reading the Effects of an Energy Shockin Financial Markets$ Journal of Economics and Business(1991), pp. 115-32.
Shin, David. “International Comparisons of Energy-Gross Na-tional Product Ratios’ American Petroleum Institute Dis-cussion Paper 68 (June 1991).
“Shocked Again[ The Economist (August 11, 1990), p. 23.
Tatom, John A. “The Effects of Financial Innovations onCheckable Deposits, Ml and M2,” this Review (July/August1990), pp. 37-57.
“Are The Macroeconomic Effects of Oil PriceChanges Symmetric?” in Karl Brunner and Allan H. Melt-zer, eds., Stabilization Policies and Labor Markets,Carnegie-Rochester Conference Series in Public Policy(North Holland, 1988a), pp. 325-6B.
_______ • “Macroeconomic Effects of the 1986 Oil Price De-dine,” Contemporary Policy Issues (July 1988b), pp. 69-B2.
- “The Macroeconomic Effects of the Recent Fall inOil Prices,” this Review (June/July 1987), pp. 34-45.
“Energy Prices and Short-Run Economic Perfor-mance,” this Review (January 1981), pp. 3-17.
Trehan, Bharat. “Lessons from the Oil Shocks of the1970s,” Federal Reserve Bank of San Francisco Weekly Letter(November 9, 1990).
Weidenbaum, Murray. “Recessionary Signs Were EvidentEven Before Oil Crisis,” Christian Science Monitor, October16, 1990.
Yanchar, Joyce. “A Look at Oil Market Fundamentals,” Spe-cial Study, DR(/McGraw-Hill U.S. Review (August 1990),pp. 25-31.
FEDERAL RESERVE BANK OF ST. LOUIS