Embed Size (px)
Citation preview
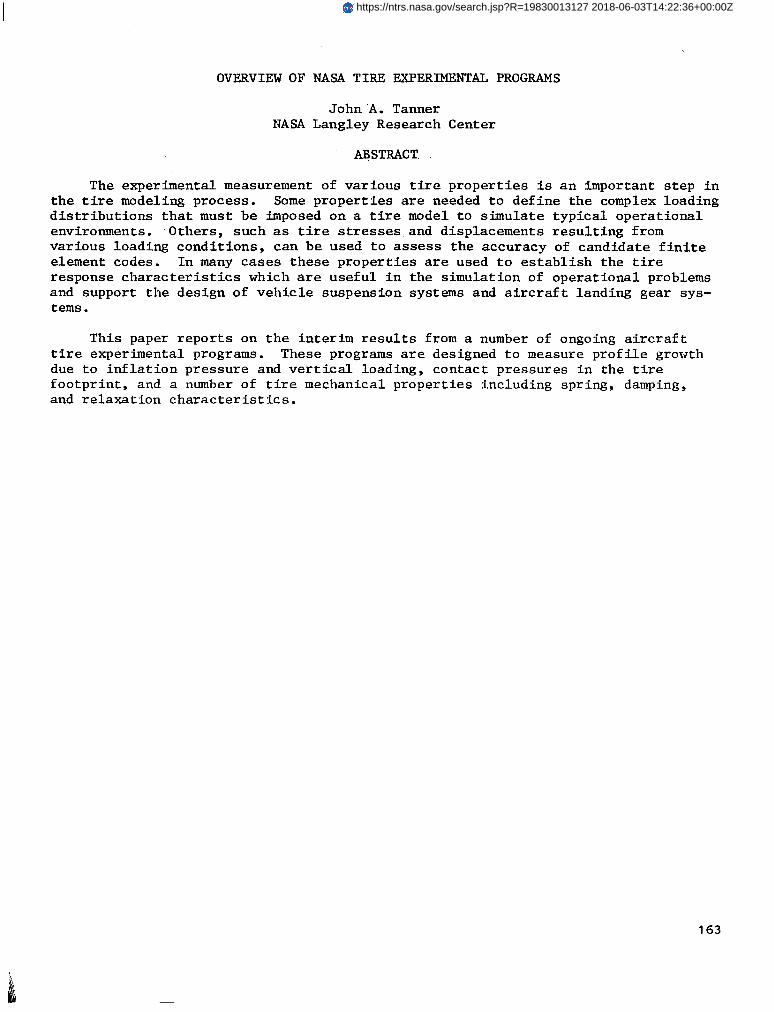
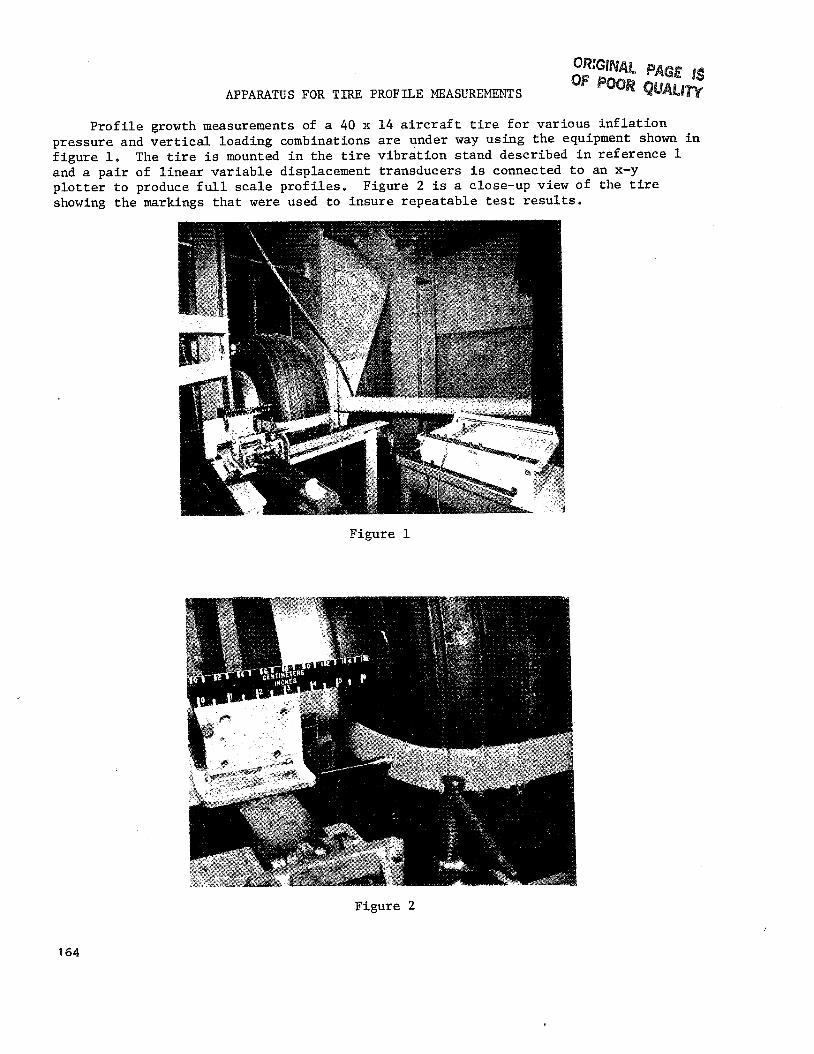
OVERVIEW OF NASA T1R.E EXPERIMENTAL PROGRAMS
John A. Tanner NASA Langley Research Center
ABSTRACT
The experimental measurement of various tire properties is an important step in the tire modeling process. Some properties are needed to define the complex loading distributions that must be imposed on a tire model to simulate typical operational environments. Others, such as tire stresses and displacements resulting from various loading conditions, can be used to assess the accuracy of candidate finite element codes. In many cases these properties are used to establish the tire response characteristics which are useful in the simulation of operational problems and support the design of vehicle suspension systems and aircraft landing gear sys- tems.
This paper reports on the interim results from a number of ongoing aircraft tire experimental programs. These programs are designed to measure profile growth due to inflation pressure and vertical loading, contact pressures in the tire footprint, and a number of tire mechanical properties including spring, damping, and relaxation characteristics.
163
https://ntrs.nasa.gov/search.jsp?R=19830013127 2018-06-03T14:22:36+00:00Z
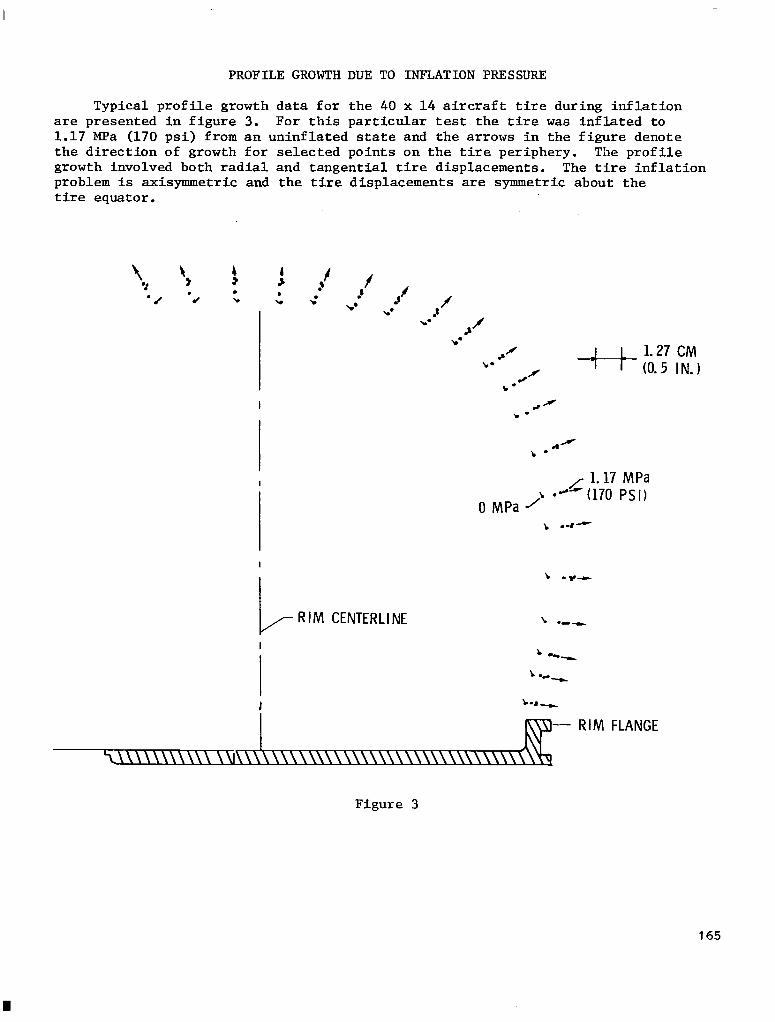
PROFILE GROWTH DUE TO INFLATION PRESSURE
Typical profile growth data for the 40 x 14 aircraft tire during inflation are presented in figure 3. For this particular test the tire was inflated to 1.17 MPa (170 psi) from an uninflated state and the arrows in the figure denote the direction of growth for selected points on the tire periphery. The profile growth involved both radial and tangential tire displacements. The tire inflation problem is axisymmetric and the tire displacements are symmetric about the tire equator.
I
/ 1.17 MPa b l
0 MPa ’ &- (170 PSI)
L .4-
I
\ -w-c
G R I M CENTERLI NE \ ---
I b--
’ WY
b-r,
- RIM FLANGE
Figure 3
165
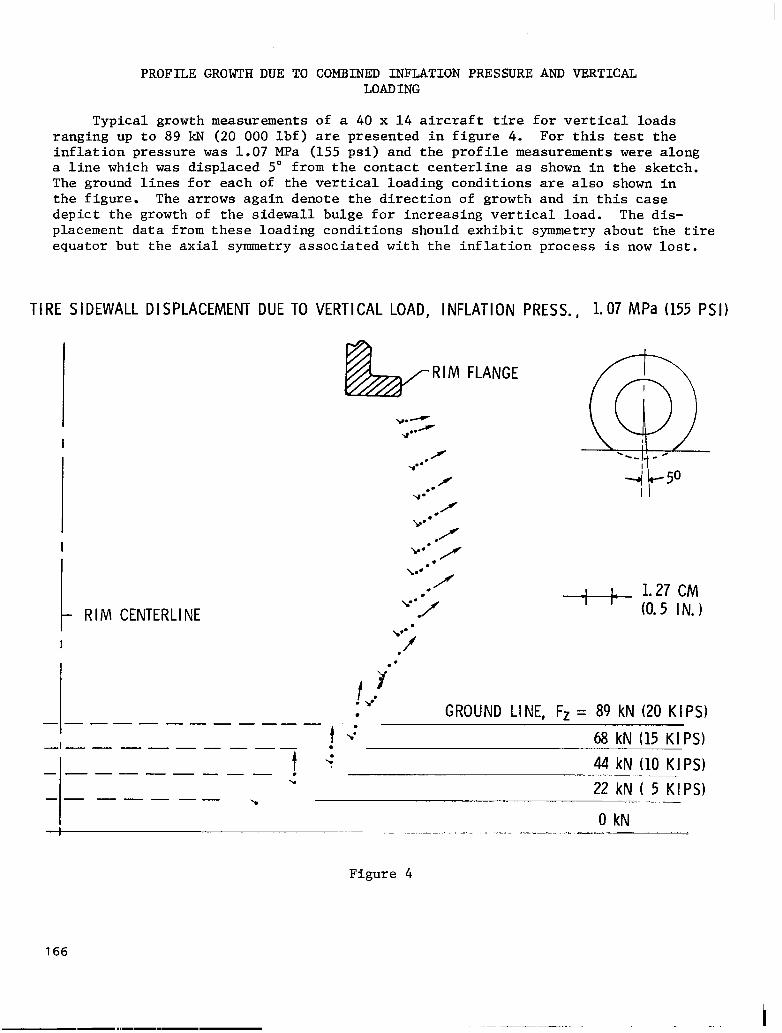
PROFILE GROWTH DUE TO COMBINED INFLATION PRESSURE AND VERTICAL LOADING
Typical growth measurements of a 40 x 14 aircraft tire for vertical loads ranging up to 89 kN (20 000 lbf) are presented in figure 4. For this test the inflation pressure was 1.07 MPa (155 psi) and the profile measurements were along a line which was displaced 5" from the contact centerline as shown in the sketch. The ground lines for each of the vertical loading conditions are also shown in the figure. The arrows again denote the direction of growth and in this case depict the growth of the sidewall bulge for increasing vertical load. The dis- placement data from these loading conditions should exhibit symmetry about the tire equator but the axial symmetry associated with the inflation process is now lost.
TIRE SIDEWALL DISPLACEMENT DUE TO VERTICAL LOAD, INFLATION PRESS., 1.07 MPa (155 PSI)
RIM CEN TERL ,I NE v') ++- f’5’IcNM) . .
I 5 . .
v f
I . \*'
GROUND LINE, Fz = 89 kN (20 KIPS) ------------ t l
,I -I--------- . 68 kN (15 KIPS) t < 44 kN (10 KIPS) ---------. -w
22 kN ( 5 KIPS) ---v-m- \ 0 kN i;. __.-----. -- - -
RIM FLANGE
Figure 4
166
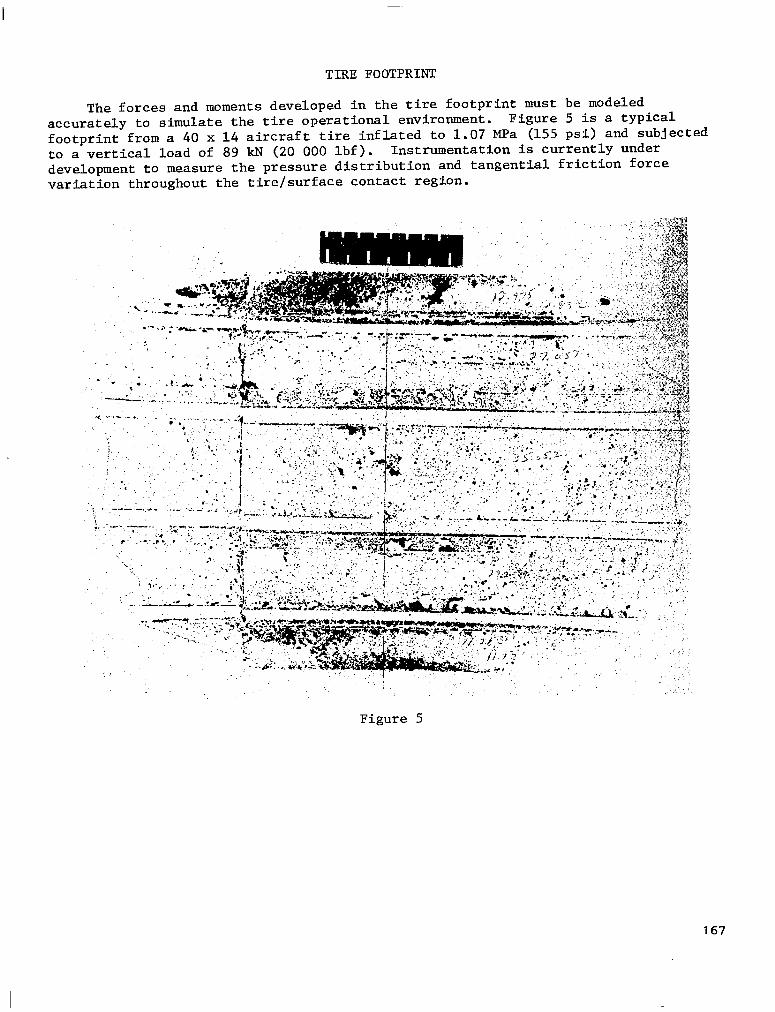
TIRE FOOTPRINT
The forces and moments developed in the tire footprint must be modeled accurately to simulate the tire operational environment. Figure 5 is a typical footprint from a 40 x 14 aircraft tire inflated to 1.07 MPa (155 psi) and subjected to a vertical load of 89 kN (20 000 lbf). Instrumentation is currently under development to measure the pressure distribution and tangential friction force variation throughout the tire/surface contact region.
Figure 5
167
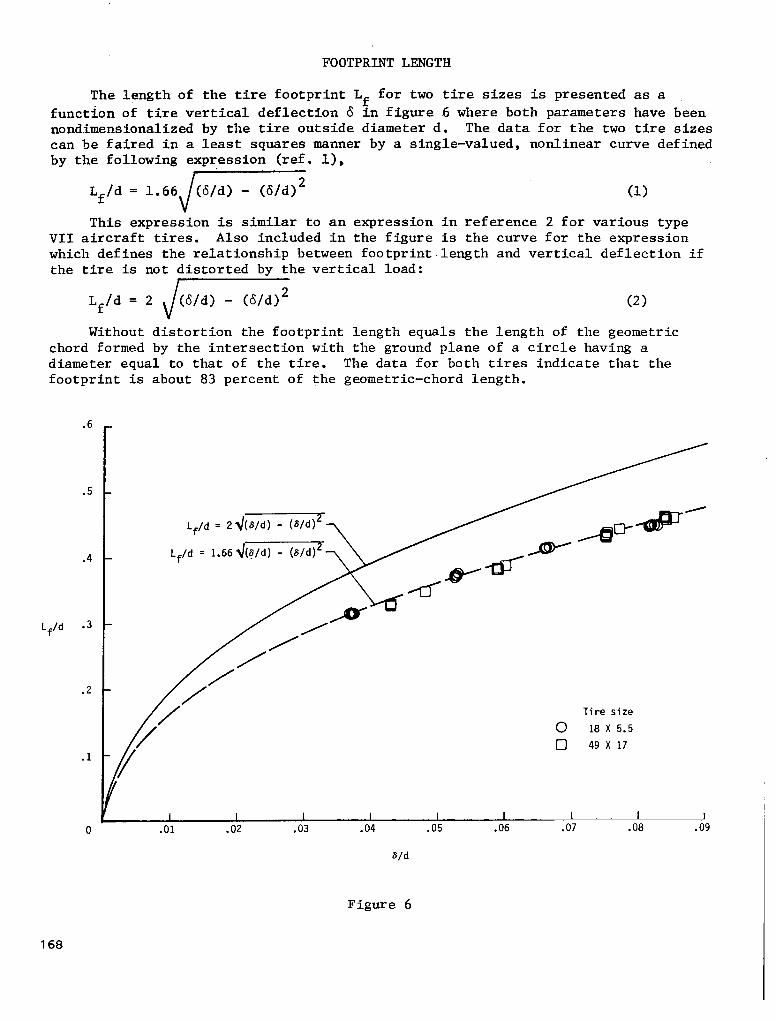
FOOTPRINT LENGTH
The length of the tire footprint Lf for two tire sizes is presented as a function of tire vertical deflection 6 in figure 6 where both parameters have been nondimensionalized by the tire outside diameter d. The data for the two tire sizes can be faired in a least squares manner by a single-valued, nonlinear curve defined by the following expression (ref. 1),
, Lf/d = 1.66
J (6/d) - GM2 (1)
This expression is similar to an expression in reference 2 for various type VII aircraft tires. Also included in the figure is the curve for the expression which defines the relationship between footprint.length and vertical deflection if the tire is not distorted by the vertical load: r
Lf/d = 2 J
(6/d) - @/d12 (2)
Without distortion the footprint length equals the length of the geometric chord formed by the intersection with the ground plane of a circle having a diameter equal to that of the tire. The data for both tires indicate that the footprint is about 83 percent of the geometric-chord length.
.6
.5
.4
Lf/d -3
I I I I I I .04 .05 .06 .07 .08 .09
6/d
Figure 6
168
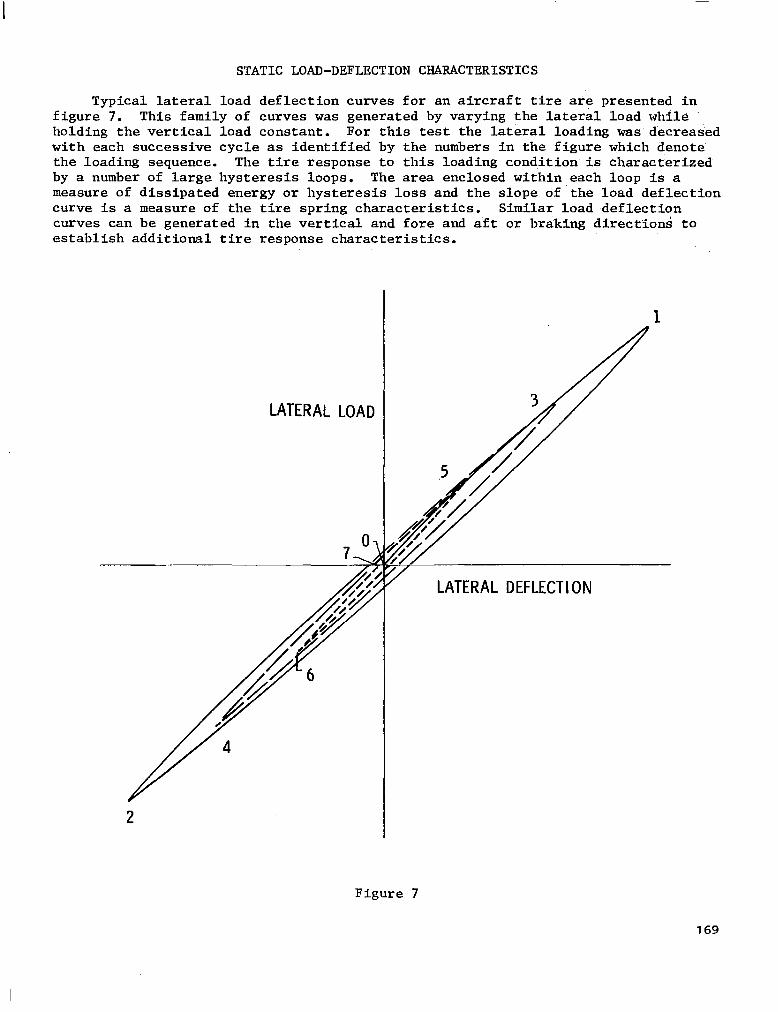
STATIC LOAD-DEFLECTION CHARACTERISTICS
Typical lateral load deflection curves for an aircraft tire are presented in figure 7. This family of curves was generated by varying the later& load while holding the vertical load constant. For this test the lateral loading was decreased with each successive cycle as identified by the numbers in the figure which denote the loading sequence. The tire response to this loading condition is characterized by a number of large hysteresis loops. The area enclosed within each loop is a measure of dissipated energy or hysteresis loss and the slope of the load deflection curve is a measure of the tire spring characteristics. Similar load -deflection curves can be generated in the vertical and fore and aft or braking directions to establish additional tire response characteristics.
LATERAL LOAD
7 LATERAL DEFLECTION
Figure 7
169
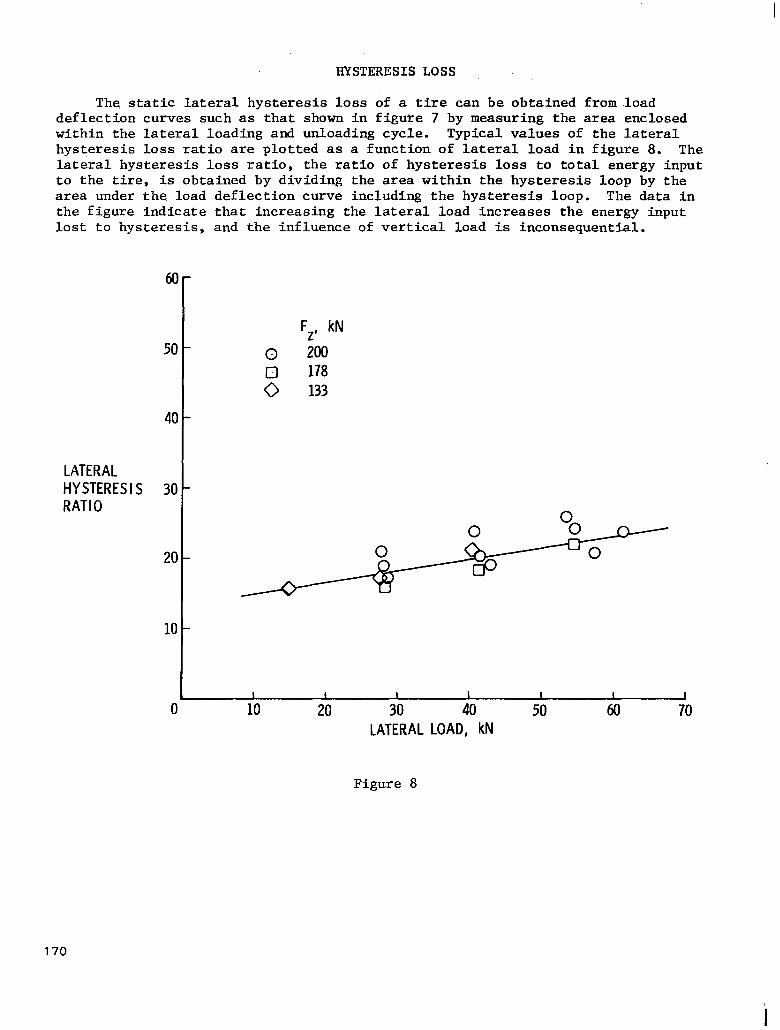
HYSTERESIS LOSS
The static lateral hysteresis loss of a tire can be obtained from.load deflection curves such as that shown in figure 7 by measuring the area enclosed within the lateral loading and unloading cycle. Typical values of the lateral hysteresis loss ratio are plotted as a function of lateral load in figure 8. The lateral hysteresis loss ratio, the ratio of hysteresis loss to total energy input to the tire, is obtained by dividing the area within the hysteresis loop by the area under the load deflection curve including the hysteresis loop. The data in the figure indicate that increasing the lateral load increases the energy input lost to hysteresis, and the influence of vertical load is inconsequential.
LATERAL HYSTERESIS RATIO
61
5(
4i
3(
2(
l(
(
Fz, kN 0 200
: ::i
10 20 30 40 LATERAL LOAD, kN
50 60 70
Figure 8
170
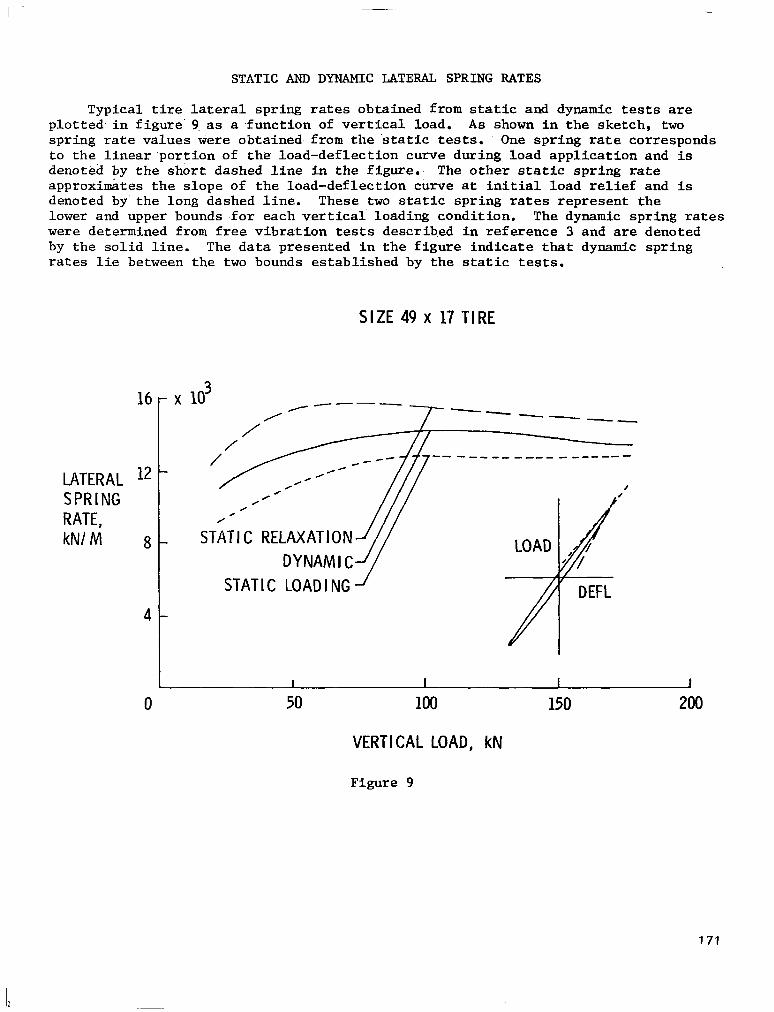
STATIC AND DYNAMIC LATERAL SPRING RATES
Typical tire lateral spring rates obtained from static and dynamic tests are plotted in figure. 9. as a -function of vertical load. As shown in the sketch, two spring rate values were obtained from the 'static tests. One spring rate corresponds to the linear 'portion of the load-deflection curve during load application and is denoted by the short dashed line in the figure.. The other static spring rate approximates the slope of the load-deflection curve at initial load relief and is denoted by the long dashed line. These two static spring rates represent the lower and upper bounds for each vertical loading condition. The dynamic spring rates were determined from free vibration tests described in reference 3 and are denoted by the solid line. The data presented in the figure indicate that dynamic spring rates lie between the two bounds established by the static tests.
SIZE 49 x 17 TIRE
LATERAL SPRING RATE, kNIM
16
12
8
4
0
STATIC LOADING
4
DEFL
50 100
VERTICAL LOAD, kN
Figure 9
150 200
171
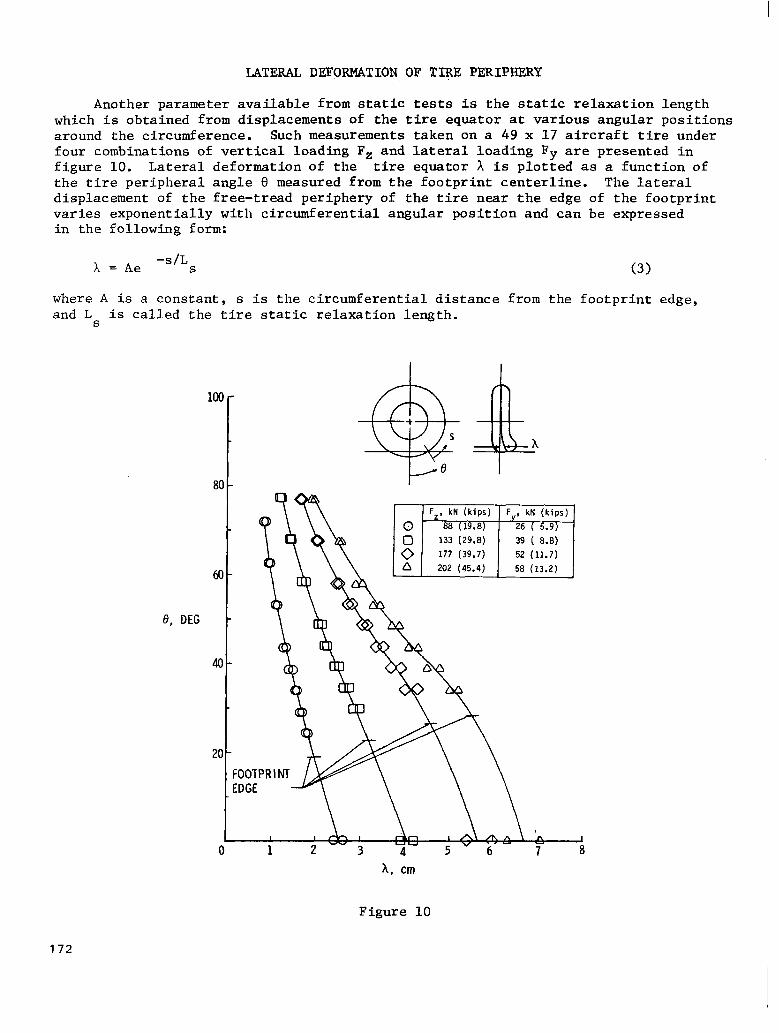
LATERAL DEFORMATION OF TIRE PERIPHERY
Another parameter available from static tests is the static relaxation length which is obtained from displacements of the tire equator at various angular positions around the circumference. Such measurements taken on a 49 x 17 aircraft tire under four combinations of vertical loading F, and lateral loading Fy are presented in figure 10. Lateral deformation of the tire equator X is plotted as a function of the tire peripheral angle 0 measured from the footprint centerline. The lateral displacement of the free-tread periphery of the tire near the edge of the footprint varies exponentially with circumferential angular position and can be expressed in the following form:
X = Ae -s/L S (3)
where A is a constant, s is the circumferential distance from the footprint edge, and L
S is called the tire static relaxation length.
0, DEG
A, cm
Figure 10
172
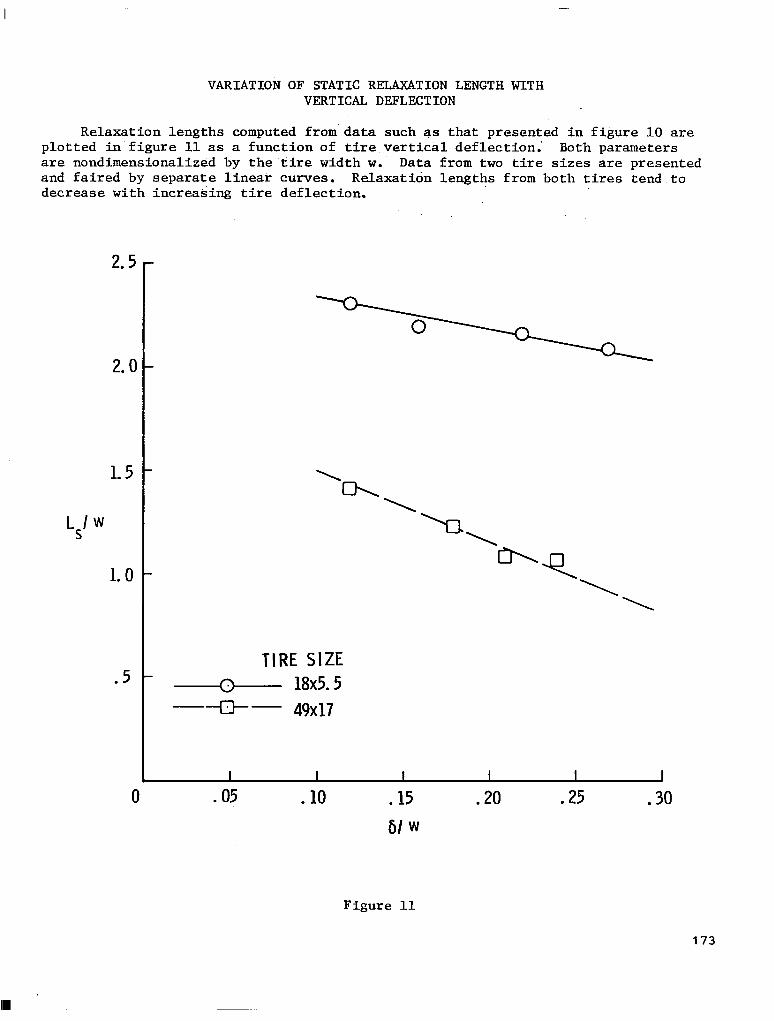
VARIATION OF STATIC RELAXATION LENGTH WITH VERTICAL DEFLECTION
Relaxation lengths computed from data such as that presented in figure 10 are plotted in figure 11 as a function of tire vertical deflection; Both parameters are nondimensionalized by the tire width w.. Data from two tire sizes are presented and faired by separate linear curves. Relaxation lengths from both tires tend to decrease-with increasing tire deflection.
2.5
2. (I
1.5
L*l w
1.0
.5 TIRE SIZE
n 18x5.5 -+J-- 49x17
0 .05 . 10 .15
61 w
.20 .25 .30
Figure 11
173
CONCLUDING REMARKS
Some of the data reviewed in this paper are typical of the experimental measure- ments necessary to verify the performance of tire analytical models and to establish footprint loading conditions for tire contact problems. Other data presented are used in defining tire spring and damping properties and the transient response characteristics necessary to model the tire's role as a component of a vehicular suspension system or an aircraft landing gear system. Experimental measurements of tire properties will continue to be an important step in the tire modeling process, regardless of the level of sophistication of the modeling technique.
REFERENCES
1.
2.
3.
Tanner, John A.; Stubbs, Sandy M.; and McCarty, John L.: Static and Yawed- Rolling Mechanical Properties of Two Type VII Aircraft Tires. NASA TP-1863, 1981.
Smiley, Robert F.; and Horne, Walter B.: Mechanical Properties of Pneumatic Tires with Special Reference to Modern Aircraft Tires. NASA TR R-64, 1960.
Sleeper, Robert K.; and Dreher, Robert C.: Tire Stiffness and Damping Determined from Static and Free-Vibration Tests. NASA TP-1671, 1980.
174