Embed Size (px)
DESCRIPTION
Johannes Deelstra Agricultural University, Wageningen, The Netherlands Jordforsk. Modelling in monitored catchments. Experiences from case studies in Norway. SOIL/SOILN_NO in the Skuterud catchment SOILNDB in the Mørdre catchment. Location of catchments in the JOVÅ-programme. North pole. - PowerPoint PPT Presentation
Citation preview

Johannes Deelstra
Agricultural University, Wageningen, The Netherlands
Jordforsk

Modelling in monitored catchments
Experiences from case studies in Norway
SOIL/SOILN_NO in the Skuterud catchment
SOILNDB in the Mørdre catchment

Location of catchments in the JOVÅ-programme
North pole
EU, y/n
president Bush
Volvo
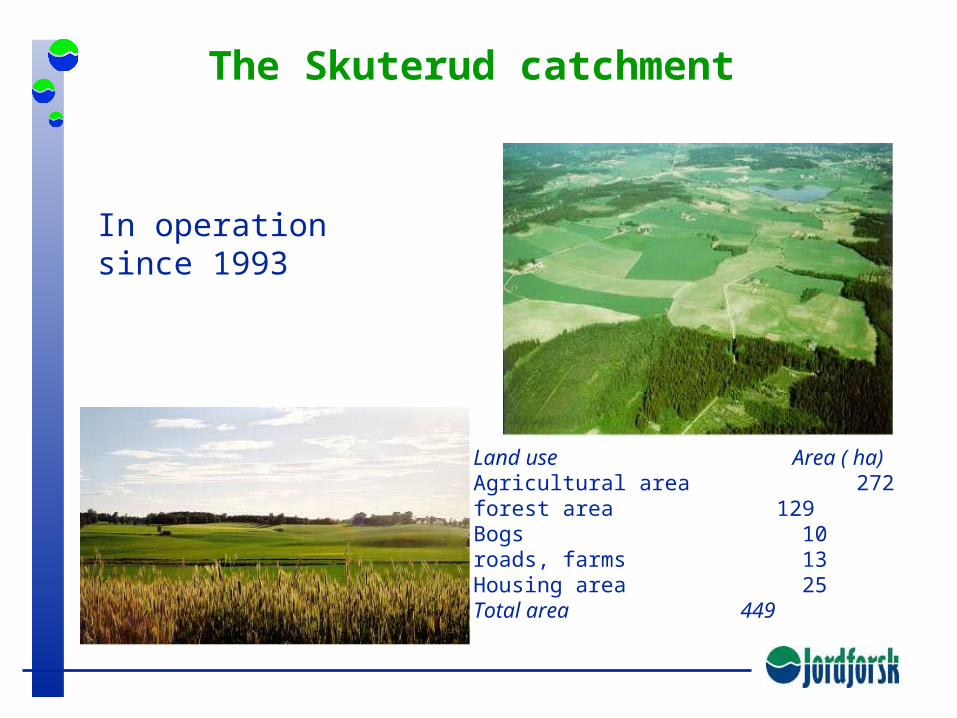
The Skuterud catchment
Land use Area ( ha)Agricultural area 272forest area 129Bogs 10roads, farms 13Housing area 25Total area 449
In operation since 1993

The Mørdre catchment
Land use Area (ha) Agricultural area 444Forest 192Bogs 27Housing area, roads, etc 18Sum 681
In operation since 1991
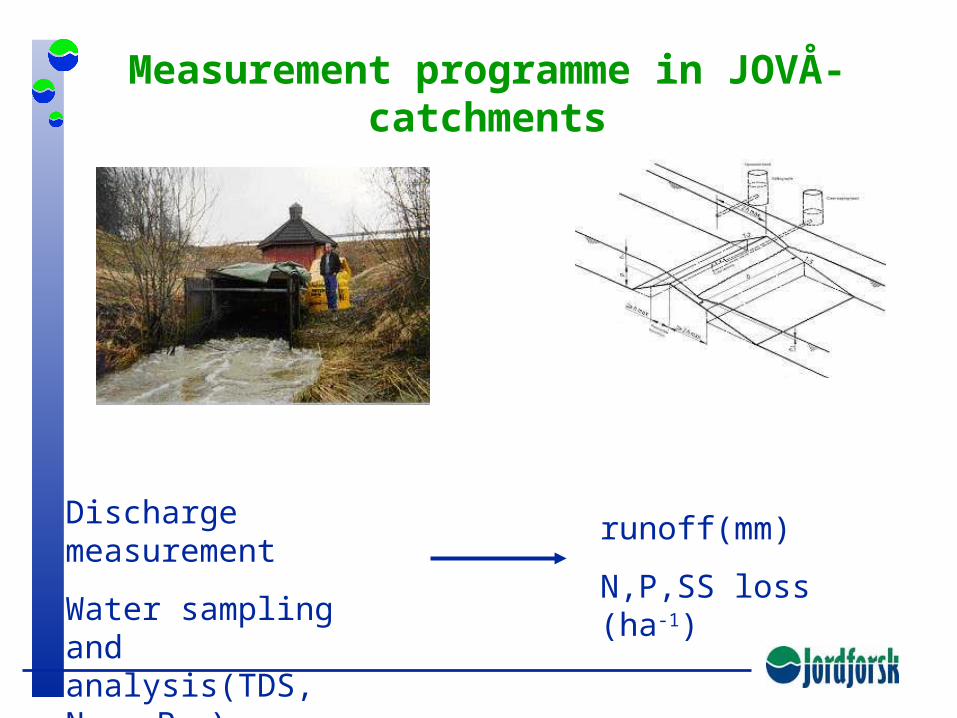
Measurement programme in JOVÅ-catchments
Discharge measurement
Water sampling and analysis(TDS, Ntot, Ptot)
runoff(mm)
N,P,SS loss (ha-1)

Collection of information on farming practices
type of crop fertiliser application yield sowing/harvesting dates type/date of soil tillage
Measurement programme in JOVÅ-catchments (cont’d)
In additionsoil mapping, profile descriptionsadditional determinations of soil physical parameters

Simulation Skuterud
water and heat transport in the vertical profile daily meteorological data and soil physical parameters, initial
values numerous switches to set
The Soil model
SOILN_NO, Norwegian version of the Swedish SOILN model
- includes major nitrogen and carbon processes - many inputs from SOIL- nitrogen application including the dates of application, type of crops, sowing and harvesting dates, crop yield ploughing dates- MATLAB
NITROGEN LEACHING FROM THE ROOT-ZONE TO TILE DRAINAGE/GROUNDWATER.

Simulation for each farmer field
SimulationsNo measuresWith measures
Optimal fertiliser applicationCatch cropsIrrigation
Skuterud

Nitrogen runoffno measures
Period Measured Simulated Simulated/Measured April 94 - April 95 46 48.4 1.05 April 95 - April 96 22 22.9 1.04 April 96 - April 97 30 25.8 0.86 April 97 - April 98 40 30.8 0.77 Accumulated 1994-1998 138 128 0.93
Skuterud
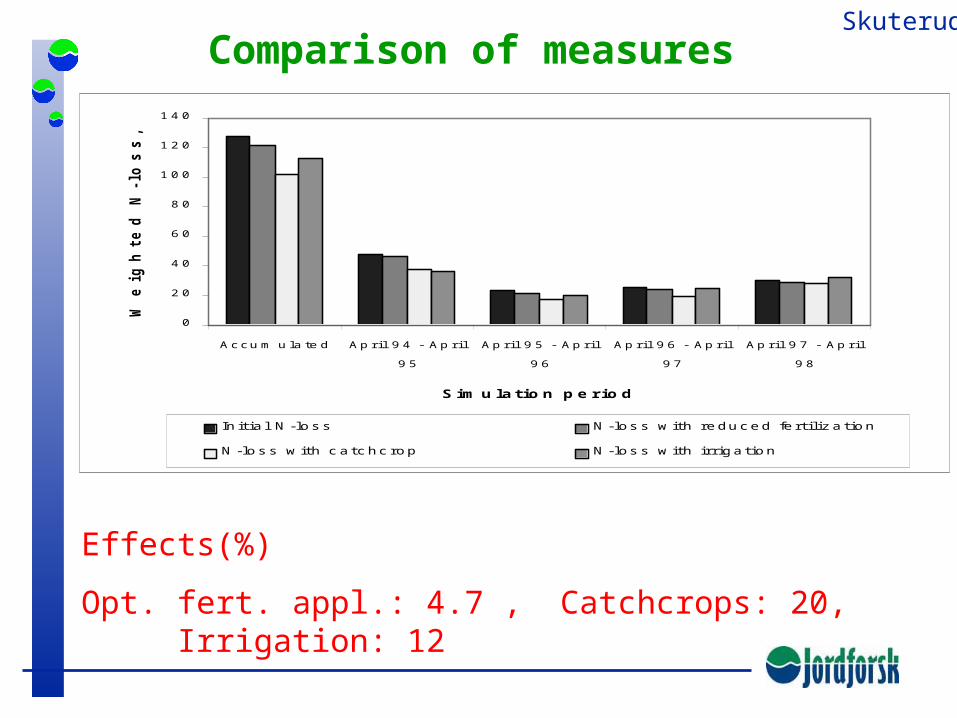
Comparison of measures
0
2 0
4 0
6 0
8 0
1 0 0
1 2 0
1 4 0
Accu m u la te d Ap ril 9 4 - Ap ril
9 5
Ap ril 9 5 - Ap ril
9 6
Ap ril 9 6 - Ap ril
9 7
Ap ril 9 7 - Ap ril
9 8
Simu latio n pe riod
We
igh
ted
N-l
os
s,
kg
/ha
Init ial N-loss N-loss with reduced fert ilization
N-loss with catchc rop N-loss with irrigation
Skuterud
Effects(%)
Opt. fert. appl.: 4.7 , Catchcrops: 20, Irrigation: 12

Nitrogen leaching maps
Skuterud
Mørdre - SOILNDBLarsson et al. (2001), SLU
A ”shell” in Visual Basic, coupling SOIL og SOILN(SLU)
To quantify N-loss from agricultural areas

Input og parameterisering Input preperation: through Excel into SOILNDB-database
climatological data soilsdata farming practices (fert., soil prep., etc)
Parameter setting: through SOILNDB-database (possibility to change) through changing program-code

Soils soil physical parameters (pF, ksat, texture, org. matter)
two alternative sources: from soil database in SOILNDB (10 USDA jordarter og 7
”Nordic” soil types. own data
Farming practicescrop type,
fertiliser, type and quantity
soil tillage, type, date

Simulation procedure Mørdre
Simulation for individual farmer fields (input; farmer information)for 2 ha units(input SSB)

Results: runoff(mm)
0
100
200
300
400
500
600
700
1991-92 1992-93 1993-94 1994-95 1995-96 1996-97 1997-98 1998-99 1999-00
dato
av
ren
nin
g (
mm
)
Målt avrenning (mm)
Simulert avrenning (mm) med JOVÅ data
Simulert avrenning (mm) med SSB data

Results: nitrogen losses
0
10
20
30
40
50
60
70
80
1991-92 1992-93 1993-94 1994-95 1995-96 1996-97 1997-98 1998-99 1999-00
Målt nitrat-N tap (kg/ha)
Simulert nitrat-N tap (kg/ha) med SSB data
Simulert nitrat-N tap (kg/ha) med JOVÅ data

Summary both models; user friendly
SOIL/SOILN_NO/SOILNDB, one dimensional - catchment?
one dimensional model size of catchment(limits?) surface runoff?
validation of modelling results against total catchment runoff; justified? what about flow processes?
how to deal with variability in catchments soil physical parameters, sowing/harvesting, fertiliser application


![[Griselda Deelstra, Guillaume Plantin (Auth.)] Ris](https://img.pdfslide.us/doc/110x75/55cf8e25550346703b8f0b1b/griselda-deelstra-guillaume-plantin-auth-ris.jpg)