Embed Size (px)
Citation preview
https://doi.org/10.52131/joe.2021.0302.0029
106
iRASD Journal of Economics
Volume 3, Number 2, 2021, Pages 106 – 118
Journal Home Page: https://journals.internationalrasd.org/index.php/joe
Prices, Money Supply and Output Nexus in Pakistan – A Macro
Econometric Model Asma Awan1, Hafiz Khalil Ahmad2, Altaf Hussain3, Muhammad Yousuf Khan Marri4 1Assistant Professor, Department of Economics, University of the Punjab, Lahore, Pakistan. Email:[email protected] 2 Professor & Dean, Faculty of Administrative and Management Sciences, GC Women University, Sialkot, Pakistan. Email: [email protected] 3 Assistant Professor, Department of Economics, The Islamia University of Bahawalpur, Bahawalpur, Pakistan. Email: [email protected] 4 PARC National Agricultural Research Centre, Park Road, Islamabad, Pakistan. Email: [email protected]
ARTICLE INFO ABSTRACT
Article History:
Received: August 04, 2021 Revised: September 28, 2021 Accepted: September 29, 2021 Available Online: September 30, 2021
This study is an endeavor to examine joint determination of
prices, money supply and output in Pakistan during 1975-2019 by using macro-economic model and annual time series data. Three Stage Least Square (3SLS) method is utilized to estimate simultaneous model of prices, money supply and output nexus. Our results strongly support significant positive association between prices and money supply thus supports monetarist view
that growth in money supply causes inflation and rising behavior of prices is detrimental to real output. The accelerated inflation has obstructed real output and reduced output levels has further caused jump in price levels during the investigated period. The empirical results also supports significant bi-directional relationship between prices and money supply. Prudent monetary policy is need of hour to stabilize prices in order to
minimize its adverse impacts on real output.
Keywords:
Prices Money Supply Output Simultaneous model
JEL Classification Codes: E31, E51, E23, C30
© 2021 The Authors, Published by iRASD. This is an Open Access
Article under the Creative Common Attribution Non-Commercial 4.0 Corresponding Author’s Email: [email protected]
1. Introduction
Monetary theoreticians, policy makers and social scientists have extensively tried to
investigate the dynamics among prices, money supply and output. Monetarists claimed active
role of money in determination of prices and output1. Lucas (1980), Rolnick and Weber (1994,
Omoke and Ugwuanyi (2010) all have supported monetarist claim that money causes prices.
Whereas, Keynesians believed passive role of money in determination of output. Advocates of
Keynes asserted that prices are mainly determined by structural factors and income causes
changes in money stock without any feedback (Hussain, 1982). The determination of the causal
ordering among key macro-economic variables i.e. prices, money supply and output is crucial in
making vigilant fiscal and monetary policies aiming at stable economic growth.
Researchers have extensively worked on subject matter in context of Pakistan started
with pioneered work of Husain in 1970’s, however, there is no consensus and empirical results
remains inconclusive. Mostly studies have utilized single equation model which can lead to
inappropriate results due to expected two-way causation among variables of interest. Therefore,
we have made efforts to use simultaneous model that can potentially capture two way causations
among the variables. The model employed in this research differs from past empirical research
as simultaneous macro model is utilized consisting of three stochastic equations, 3SLS
1 Although changes in money supply transmits into prices and output with some lag not immediately.
iRASD Journal of Economics 3(2), 2021
107
methodology is utilized to estimate the model and stationary variables are used to avoid spurious
regression results.
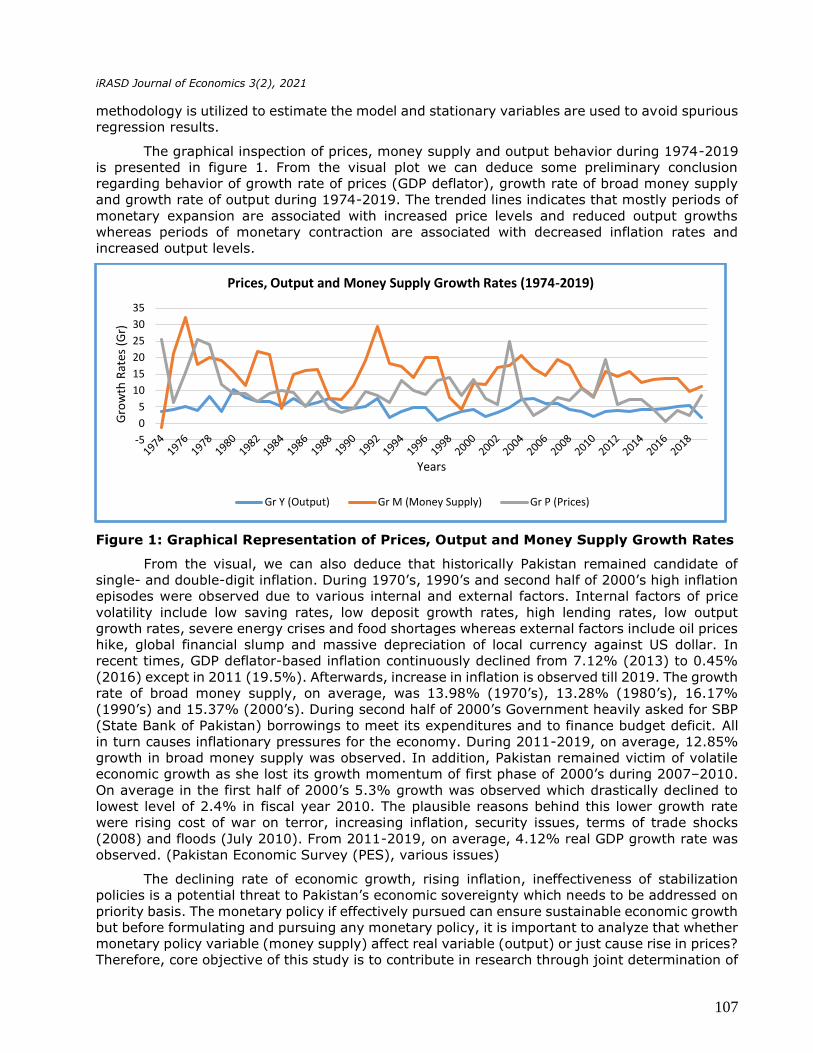
The graphical inspection of prices, money supply and output behavior during 1974-2019
is presented in figure 1. From the visual plot we can deduce some preliminary conclusion
regarding behavior of growth rate of prices (GDP deflator), growth rate of broad money supply
and growth rate of output during 1974-2019. The trended lines indicates that mostly periods of
monetary expansion are associated with increased price levels and reduced output growths
whereas periods of monetary contraction are associated with decreased inflation rates and
increased output levels.
Figure 1: Graphical Representation of Prices, Output and Money Supply Growth Rates
From the visual, we can also deduce that historically Pakistan remained candidate of
single- and double-digit inflation. During 1970’s, 1990’s and second half of 2000’s high inflation
episodes were observed due to various internal and external factors. Internal factors of price
volatility include low saving rates, low deposit growth rates, high lending rates, low output
growth rates, severe energy crises and food shortages whereas external factors include oil prices
hike, global financial slump and massive depreciation of local currency against US dollar. In
recent times, GDP deflator-based inflation continuously declined from 7.12% (2013) to 0.45%
(2016) except in 2011 (19.5%). Afterwards, increase in inflation is observed till 2019. The growth
rate of broad money supply, on average, was 13.98% (1970’s), 13.28% (1980’s), 16.17%
(1990’s) and 15.37% (2000’s). During second half of 2000’s Government heavily asked for SBP
(State Bank of Pakistan) borrowings to meet its expenditures and to finance budget deficit. All
in turn causes inflationary pressures for the economy. During 2011-2019, on average, 12.85%
growth in broad money supply was observed. In addition, Pakistan remained victim of volatile
economic growth as she lost its growth momentum of first phase of 2000’s during 2007–2010.
On average in the first half of 2000’s 5.3% growth was observed which drastically declined to
lowest level of 2.4% in fiscal year 2010. The plausible reasons behind this lower growth rate
were rising cost of war on terror, increasing inflation, security issues, terms of trade shocks
(2008) and floods (July 2010). From 2011-2019, on average, 4.12% real GDP growth rate was
observed. (Pakistan Economic Survey (PES), various issues)
The declining rate of economic growth, rising inflation, ineffectiveness of stabilization
policies is a potential threat to Pakistan’s economic sovereignty which needs to be addressed on
priority basis. The monetary policy if effectively pursued can ensure sustainable economic growth
but before formulating and pursuing any monetary policy, it is important to analyze that whether
monetary policy variable (money supply) affect real variable (output) or just cause rise in prices?
Therefore, core objective of this study is to contribute in research through joint determination of
-5
0
5
10
15
20
25
30
35
Gro
wth
Rat
es (
Gr)
Years
Prices, Output and Money Supply Growth Rates (1974-2019)
Gr Y (Output) Gr M (Money Supply) Gr P (Prices)

108
prices, money supply and output dynamics within the framework of simultaneous model in
Pakistan.
The study is organized as following the introduction, section 2 presents literature review,
section 3 contains research design, section 4 reports empirical results and discussions, and
section 5 concludes with policy suggestions.
2. Literature Review
To ferret out the causal ordering among prices, money supply and output considerable
amount of empirical literature is available in context of developed and developing countries
including Pakistan. The findings of Sims (1972) empirical work in context of US economy that
money causes income (supporting monetarist preposition) attracted the social scientists and
researchers to work on the subject matter. Since then, economic literature is replete with number
of empirical studies.
During 1970’s and 1980’s traditional granger causality test was adopted mainly to gauge
interrelationships among variables of interest whereas during 1990’s and 2000’s more
sophisticated econometric techniques like Johansen co-integration, ARDL approach, ECM (error
correction models), VAR models were adopted. Most of the past empirical research is based on
single equation models rather than macro-economic models consisting number of equations. In
recent times more scientific approach i.e., Graph theoretic approach is also utilized in Pakistan
to detect causal nature of money, prices and output.
Following Sims work, Barth and Bannett (1974) found two-way causation between money
supply and output in Canadian economy. William et al. (1976) created doubts on Sims empirical
work by finding that money does not granger causes income in UK, however, income does
granger causes money and money in turn causes prices only. Lee and Li (1983) worked for
Singaporean economy and reported bi-directional relationship between money and output
whereas in money-prices nexus money causes prices without any feedback. In context of India
Joshi and Joshi (1985) also supported that money granger causes output with feedback. Daniel
and Batten (1985) also supported bi-directional causality between money and output.
In context of Pakistan, Abbas (1991) worked on selected Asian countries including
Pakistan, Malaysia and Thailand. He used granger causality test and found significant two-way
causal relationship between money and income in Pakistan. Bangali et al. (1999) finding was
consistent with Abbas (1991) empirical study. In addition, Bangali et al. (1990) asserted that
increase in price level is caused by monetary expansion in Pakistan. Hussain and Mahmood
(1998) found one way causation running from money to prices. A precise summary of the
empirical literature on subject matter is reported in table 1.
Table 1
Summary of Empirical Literature on Prices, Money supply and Output Study Sample Variables Methodology Findings
Olivo and Miller
(2000) Venezuela
1950-1996 (Annual data)
Money Nominal GDP Prices
Johansen Co-integration Test
Stable long run
relationship when M1 was used.
Absence of relationship when
M2 was used. Hussain and Abbas (2002)
Pakistan
1950-1999 (Annual data)
GNP2 CPI3
M2
Granger Causality
and ECM4
Y→M, M↔P
2 Gross National Product 3 Consumer Price Index 4 Error Correction Model

iRASD Journal of Economics 3(2), 2021
109
Ahmad (2003) SAARC countries (Bangladesh, Pakistan, India)
----
Money (M) Prices (P) Interest Rate Income (Y)
Granger Causality Test
Bangladesh
M↔P, M→Y, R→Y,
R→P
Pakistan
M↔P, Y→R, P→R
India
Y→R, P→R, Y→M
Abbas and Fazal
(2006) Pakistan
1959-2003 (Annual data)
Money Income Prices
Co-integration ECM Granger Causality
There is long run
relationship.
M↔P, Y→M
Qayyum and
Abdul (2006) Pakistan
1960-2005 (Annual data)
QTM equation: Inflation Rate Monetary
growth
Velocity growth Output growth
Johansen Co-integration
Inflation is purely
monetary phenomenon
Hussain and
Rashid (2008)
Pakistan
1960-2004 (Annual data)
Money Prices
Income
Johansen Co-
integration and
Causality Test
Y→M , M→P without
any feed back
Omoke and Ugwuanyi (2010)
Nigeria
1970-2005 (Annual data)
M2 Output Inflation
Johansen Co-integration, Granger
Causality Test
No significant co-integration, M→P, M→Y.
Asghar and
Jahandad (2010)
Pakistan
1971 to 2003 (Quarterly data)
Money supply Prices Income
Graph Theoretic
Approach
Money supply and
prices causes’ income.
Singh et al. (2015)
India
Q1 1991 to Q1 2015
(Quarterly data) data)
Money Supply5 Prices Output
Granger Causality Johansen Co
integration
Relationship is quite sensitive with respect to choice of variables.
Narrow money found
better policy
measure.
Dingela and Khobai (2017)
South Africa
1980-2016 (Annual data)
Broad money supply
GDP per capita Interest rate Inflation
ARDL (Autoregressive Distributed Lag Model)
Money supply and economic growth are positively related in short run and long run
5 Multiple measures were used in this research pertaining to each variable. For example, reserve money, narrow money and broad money are used as proxy of money supply.
110
Mansoor et al.(2018)
Pakistan
1980-2016 (Annual data)
Money Supply Prices
Economic Growth
ARDL GDP → M2
M2 → CPI CPI & GDP do not
cause each other.
Mahara (2020) Nepal
1975-2019 (Annual data)
Money Supply Economic
Growth
ARDL M2 → Real economic
growth
Note: → denotes one way causation, ↔ denotes two-way causation.
After reviewing literature on relationship among prices, money supply and output we
found that literature remains inconclusive and there are various possible reasons for this
inconsistency. The varying results attributes to adoption of different estimation strategies, time
frame, frequency of the data and differences in cross sectional units. The ambiguity of
relationship among variables of interest in turn demands more research on subject matter but
by using simultaneous model that truly captures endogeneity between variables. This research
is an endeavor in this context and will be a contribution in empirical literature. It also provides
avenues for further research using macro-economic models.
3. Research Design 3.1. Data Set and Description of the Variables
Using the annual data this study examines dynamic relationship among prices, money
supply and output for the period 1975-2019. It is relevant to mention that lagged output variable
is also used in the analysis, therefore, estimation period starts from 1975 instead of 1974. Data
is of secondary nature and selection of the variables is based on data availability and relevance
to theory. Brief description of the variables along data source is provided in table 2.
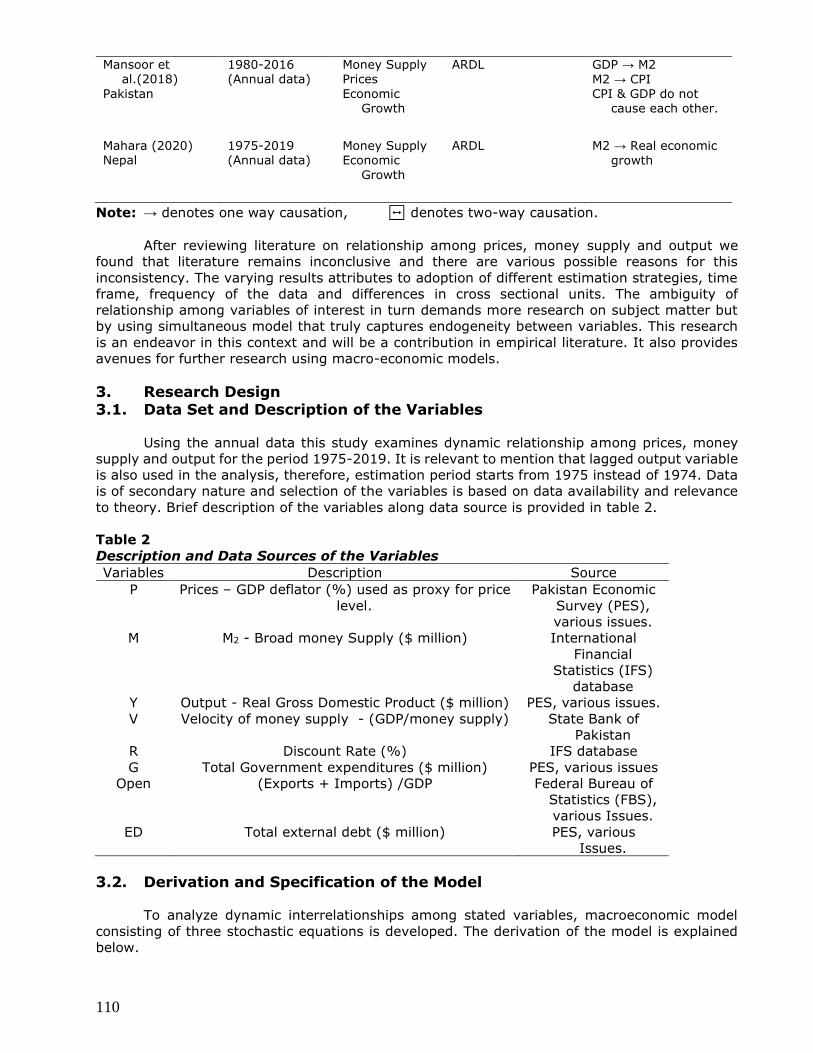
Table 2
Description and Data Sources of the Variables
Variables Description Source
P Prices – GDP deflator (%) used as proxy for price
level.
Pakistan Economic
Survey (PES),
various issues.
M M2 - Broad money Supply ($ million) International
Financial
Statistics (IFS)
database
Y Output - Real Gross Domestic Product ($ million) PES, various issues.
V Velocity of money supply - (GDP/money supply) State Bank of
Pakistan
R Discount Rate (%) IFS database
G Total Government expenditures ($ million) PES, various issues
Open (Exports + Imports) /GDP Federal Bureau of
Statistics (FBS),
various Issues.
ED Total external debt ($ million) PES, various
Issues.
3.2. Derivation and Specification of the Model
To analyze dynamic interrelationships among stated variables, macroeconomic model
consisting of three stochastic equations is developed. The derivation of the model is explained
below.
iRASD Journal of Economics 3(2), 2021
111
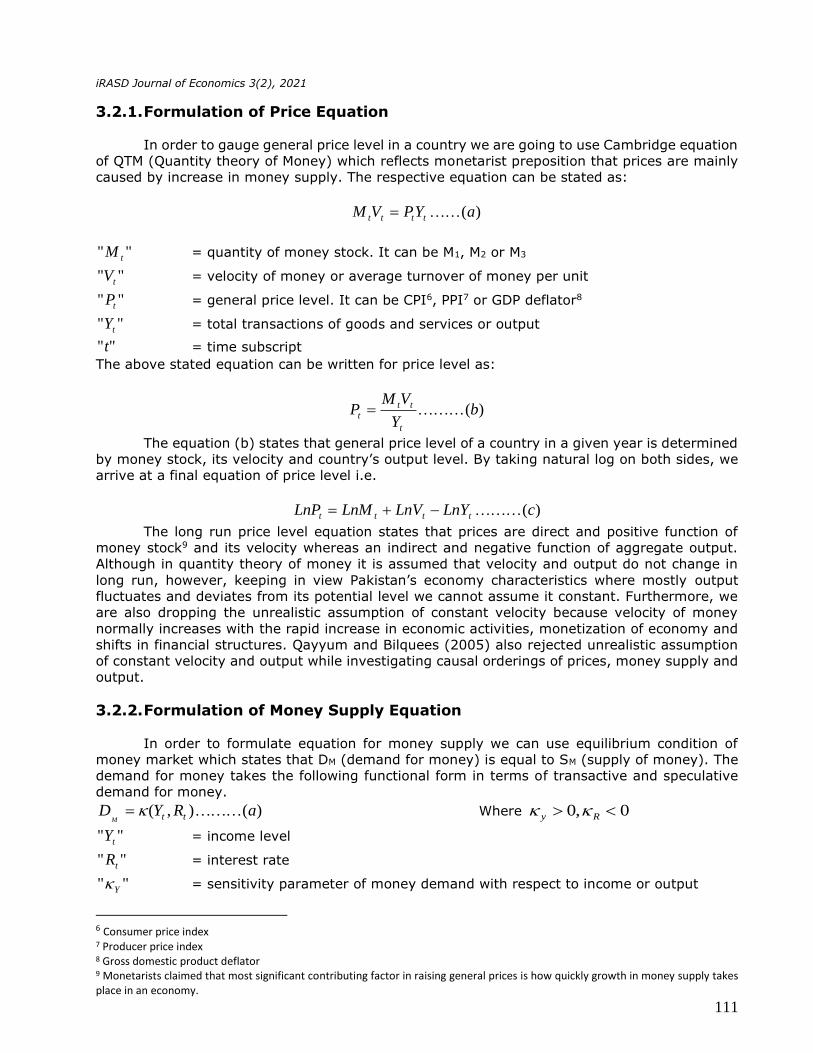
3.2.1. Formulation of Price Equation
In order to gauge general price level in a country we are going to use Cambridge equation
of QTM (Quantity theory of Money) which reflects monetarist preposition that prices are mainly
caused by increase in money supply. The respective equation can be stated as:
)(aYPVM tttt =
"" tM = quantity of money stock. It can be M1, M2 or M3
"" tV = velocity of money or average turnover of money per unit
"" tP = general price level. It can be CPI6, PPI7 or GDP deflator8
"" tY = total transactions of goods and services or output
""t = time subscript
The above stated equation can be written for price level as:
)(bY
VMP
t
ttt =
The equation (b) states that general price level of a country in a given year is determined
by money stock, its velocity and country’s output level. By taking natural log on both sides, we
arrive at a final equation of price level i.e.
)(cLnYLnVLnMLnP tttt −+=
The long run price level equation states that prices are direct and positive function of
money stock9 and its velocity whereas an indirect and negative function of aggregate output.
Although in quantity theory of money it is assumed that velocity and output do not change in
long run, however, keeping in view Pakistan’s economy characteristics where mostly output
fluctuates and deviates from its potential level we cannot assume it constant. Furthermore, we
are also dropping the unrealistic assumption of constant velocity because velocity of money
normally increases with the rapid increase in economic activities, monetization of economy and
shifts in financial structures. Qayyum and Bilquees (2005) also rejected unrealistic assumption
of constant velocity and output while investigating causal orderings of prices, money supply and
output.
3.2.2. Formulation of Money Supply Equation
In order to formulate equation for money supply we can use equilibrium condition of
money market which states that DM (demand for money) is equal to SM (supply of money). The
demand for money takes the following functional form in terms of transactive and speculative
demand for money.
)(),( aRYD ttM= Where 0,0 Ry
"" tY = income level
"" tR = interest rate
"" Y = sensitivity parameter of money demand with respect to income or output
6 Consumer price index 7 Producer price index 8 Gross domestic product deflator 9 Monetarists claimed that most significant contributing factor in raising general prices is how quickly growth in money supply takes place in an economy.

112
"" R = sensitivity parameter of money demand with respect to interest rate
""t = time subscript
We also know that supply of money is:
)(bP
MS
t
tM =
"" tM = money supply
"" tP = general price level
""t = time subscript.
In the long run money market equilibrium requires DM = SM therefore by equating
equation (a) and equation (b) we get
)(),( cRYP
Mtt
t
t =
The above relationship between money balances and real money supply can be
transformed into nominal money stock as
)(),(* dRYPM tttt =
Finally the money supply equation can take the following multiplicative form
)(** 210 eRYPM tttt
=
By using logarithmic transformation, we can rewrite equation (e) as
)(210fLnRLnYLnPLnM tttt ++=
The above equation states that money stock is a function of price level, output and
interest rate in the long run. Although in context of Pakistan interest rate is policy determined
variable rather than market determined variable, however, if we use discount rate as a measure
of interest rate we can safely posit that State Bank can potentially lower money supply (paper
money plus deposits) by increasing discount rate. In support of inclusion of interest rate in money
supply equation we can refer Okpara and Nwaoha (2010) research on subject matter. In their
empirical study, they have used interest rate as an explanatory variable in money supply
equation and found significant negative association between money supply and interest rate.
3.2.3. Formulation of Output Equation
The output function used in this research takes the form of following multiplicative power
function augmented with prices, government expenditure, openness and external debt. The
lagged output variable is also used as an explanatory variable.
)()()( 54321
)1(0 aEDOpenGYPY tttttt
−=
"" tY = output level
"" tP = general price level
"" 1−tY = lagged output level
"" tG = government expenditures

iRASD Journal of Economics 3(2), 2021
113
"" tOpen = openness
"" tED = DOD10 external debt
Taking Log on both sides, we get
)()( 543)1(210 bLnEDLnOpenLnGYLnLnPLnLnY tttttt +++++= −
The above output function states that output depends on price level, lagged output (used
as proxy for economic development), government expenditures, openness and external debt. It
is expected that there is a negative or indirect relationship between external debt, prices and
output whereas there is a positive or direct impact of government expenditures, openness,
lagged output on current output of a country. Inclusion of lagged variable is of great significance
in order to judge variations over the time period. We have used four exogenous variables in the
output equation.
Finally, we can report complete macroeconomic model consisting of three stochastic
equations related to price level, money supply and output to analyze linkages or causal orders
among variables during 1975-2019, time period consisting of 44 years.
Macroeconomic Model of Prices, Money Supply and Output
tttttttt
ttttt
ttttt
LnEDLnOpenLnGYLnLnPLnY
tionOutputEqua
LnRLnYLnPLnM
yEquationMoneySuppl
LnVLnYLnMLnP
niceEquatio
36365354343133131303
2222322121202
1111313212101
)(
:
:
:Pr
++++++=
++++=
++++=
−
List of Endogenous Variables
LnP = Log of prices
LnM = Log of money supply
LnY = Log of output
List of Exogenous Variables
LnV = Log of money velocity
LnR = Log of interest rate
Ln (Y) t-1 = Log of lagged output
LnG = Log of government expenditures
LnOpen = Log of openness
LnED = Log of external debt
The first equation of the simultaneous system is price equation, money supply is a second
equation, and third equation is an output equation. The system is complete as it contains equal
number of dependent variables and equations. There exist three equations related to three
dependent variables. The alphas ( s' ) are used as coefficients of dependent variables whereas
betas ( s' ) are used as coefficients of exogenous or independent variables.
10 Disbursed and Outstanding

114
3.3. Estimation Strategy
To check order of integration we have employed recent and most powerful Ng-Perron
(2001) unit root test11 which is preferable over ADF, PP and KPSS unit root tests. Furthermore,
simultaneous model on subject matter is estimated by 3SLS (full information) method
proposed by A. Zellner and Theil in 1962. This approach is superior to 2SLS approach as 2SLS
method is a limited information method. The assumptions of 3SLS approach includes presence
of simultaneity in the model, over-identification of the model, residuals of each equation must
be serially uncorrelated and model must be correctly specified. Hausman’s simultaneity test
is used to confirm simultaneity in the model. Over identification of the model is confirmed
through application of order and rank condition. Breusch Pegan Godfrey serial correlation LM
test (1969) is utilized to confirm serially uncorrelated residual terms, whereas, Ramsey’s
RESET test (1969) is used to check the correct specification of each equation of the model.
4. Empirical Results and Discussions
After confirming stationarity, all assumptions of the 3SLS approach are confirmed. In
order to conserve space we are not going to report results related to unit root checks and pre-
requisites of 3SLS approach. However, results of macro model on subject matter are reported in
table 4.
Table 4
3SLS Estimates (Prices, Money Supply and Output Macro Model) Variables Prices equation
(Ln P) Money Supply
equation (Ln M)
Output equation (Ln Y)
Dependent Variables
LnP1t
-----
1.38*
t-stat [5.02] prob. (0.00)
-0.54*
t-stat [-3.25] prob. (0.001)
LnM2t
0.38* t-stat [4.06] prob. (0.00)
-----
-----
LnY3t
-0.78* t-stat [-6.27]
prob. (0.00)
-0.37 t-stat [-1.01]
prob. (0.31)
-----
Independent
variables
LnV1t
0.073 t-stat [0.13] prob. (0.89)
-----
-----
LnR2t
----- -0.66* t-stat [-2.45] prob. (0.01)
-----
(Ln(Y)-1) 3t
-----
-----
0.074 t-stat [0.52] prob. (0.59)
LnG4t
-----
-----
0.016
t-stat [0.28] prob. (0.77)
LnOpen5t
-----
-----
-0.212* t-stat [-1.65] prob. (0.10)
LnED6t
-----
-----
0.251 t-stat [0.98] prob. (0.32)
11 It addresses issues of ADF and PP test related to poor size and power distortions.

iRASD Journal of Economics 3(2), 2021
115
Intercept
-5.38
t-stat [-4.96]
prob. (0.000)
3.28
t-stat [1.32]
prob. (0.18)
5.35
t-stat[3.11]
prob. (0.002)
Summary Measures
R2 0.992 0.986 0.979
Adjusted R2 0.991 0.985 0.975
S.E of Regression 0.082 0.112 0.108
Note: Asterisk * is used to indicate the significant variable. The p-values are reported to show the exact level of significance.
Table 4 report results of 3SLS estimation. It reports the estimated coefficients, t-values,
and respective probabilities. Most of the variables are statistically significant as well as having
expected signs. The summary measures are reported in lower section of the table. All summary
statistics are found satisfactory.
4.1. Discussion Related to Price Equation
In price equation, two explanatory variables out of three are statistically significant and
have their expected signs. Money supply and velocity of money both are positively associated to
prices with a reported coefficient 0.38 and 0.073 respectively. However, money supply is highly
statistically significant and velocity of money is not statistically significant. The estimated
coefficient of money supply can be interpreted as 1 percent increase in money supply directly,
on average, increases price level by 0.38 percent in the long run, keeping other factors constant.
This empirical finding suggests that monetary variable i.e. money supply is causing inflation in
Pakistan which is consistent with the findings of Rangarajan and Arif (1990), Khan and Qasim
(1996) Hussain (2006), Abbas and Fazal (2006), Mansoor et al. (2018) who supported
monetarist stance for causing inflation beside other structural factors. The plausible reason
behind this finding is that whenever there is an increase in money supply circulation, it definitely
lowers the purchasing power of each unit of a currency (or increases prices) as there is more
money chasing same amount of goods and services.
Since velocity of money supply is statistically insignificant hence no valid inferences can
be obtained from this empirical finding. Furthermore, results strongly supported the inverse
relationship between output and prices. From last couple of years Pakistan remained candidate
of low growth rates which transmits in rising cost of production and inflation. This empirical
finding is highly consistent with the Pakistan experience. The reported coefficient of output
indicates that 1 % decline in output increases prices directly, on average, by 0.78 % in the long
run.
4.2. Discussion Related to Money Supply Equation
In money supply equation two variables are significant out of three however their
significance level vary from variable to variable. From reported results we found that prices are
positively associated with money supply and it is statistically significant. From the significance of
prices in money supply equation and significance of money supply in price equation we are able
to conclude that relationship between prices and money supply is a two-way relationship. The
rise in money supply positively affects prices and rise in prices further cause expansion of money
supply. The coefficient of money supply equation indicates that 1 percent rise in prices directly,
on average, increases money supply by 1.38 percent in the long run.
In context of money and output nexus, we surprisingly found negative association but
this association is not statistically significant. Given insignificance, no valid inferences can be
drawn. Furthermore, with regard to discount rate (interest rate) and money supply nexus we
found significant negative association with the reported coefficient 0.66 percent which indicates

116
that 1 % increase (decrease) in discount rate, directly on average, decrease (increase) money
supply by 0.66 percent. The significance level of this association is 1%. State Bank of Pakistan
can potentially lower growth of money supply by raising discount rate. As rise in discount rate
makes borrowings of commercial banks expensive which further decrease money supply creation
process. The SBP has drastically increased lending rates from June 2007 to March 2009 as it was
10.32% in 2007 which increased to 14.28% in March 2009. All this tightening of monetary stance
has lowered growth of money supply especially if we compared with 1980s and 1990s era of
monetary growth but sharp rising trend of lending rates has also spurred inflation in Pakistan
because rising interest rates has caused investment projects more expensive. It is also pertinent
to mention that in recent times SBP has reduced interest rate given increasing incidence of
inflation.
4.3. Discussion Related to Output Equation
In output equation only two variables out of five are statistically significant. With respect
to prices and output we found highly significant negative relationship. More inflation means lesser
real output or conversely we can say that lesser inflation means higher real output. Pakistan has
experienced sky rocketing inflation which has potentially deteriorated real output during the
investigated period. The rising trend of inflation especially double digit inflation has caused
uncertainties, erosion of investment activities, increased vulnerabilities which transmitted in
lowering output and growth momentum of real GDP. The reported coefficient indicates that 1
percent increase in prices directly on average deteriorated real output by 0.54 percent in the
long run. This finding is consistent with Suleman et al. (2009) and Cechetti (2000) as well as
with the Pakistan experience. However, results contradicts with findings of Mansoor et al. (2018)
that CPI based inflation and output do not cause each other. This contradiction may be attributed
to change in specification of model, analysis period and estimation method. From the results we
also observed that there exist two-way causation between output and prices in Pakistan as prices
in output equation is statistically significant and output in price equation is statistically significant.
With respect to output and government expenditures we found positive relationship but
this relationship is statistically insignificant. Its insignificance in Pakistan claims that increase in
government expenditures does not cause rise in output levels. Since government expenditures
are mainly non-development expenditures rather than of development expenditures. The worst
thing to mention is that share of development expenditures in total expenditures is decreasing.
Furthermore, openness is partially statistically significant at 10% and negatively related to
output. Its negative association with real output is quite surprising. Possible rationale behind this
refers to lower competitiveness of Pakistan in International market due to its concentration of
primary commodities, absence of value added products, deteriorated terms of trade and low
market share.
The coefficient of external debt is also positively associated with real output but it is
insignificant hence we cannot infer from this relationship. Realistic formulation of many economic
relations requires inclusion of lagged variables therefore we have included lagged variable of
output in order to investigate impact of lagged output growth on current real GDP growth and
found signs of positive relationship but it is insignificant.
5. Conclusion
This study empirically examines joint relationship among prices, money supply and real
output in Pakistan using annual data from 1975-2019. It improves deficiency in methodology by
utilizing macro-economic model instead of a single equation model. After confirming stochastic
properties of the data with Ng-Perron test, 3SLS method is utilized to estimate the model. The
3SLS results report that most of the variables are significant, aligned with theory and consistent
with current situation of the country. The core finding is high surge in Pakistan’s inflation rate
caused by excessive monetary expansion during 1975-2019, on average, have retarded real
GDP. It strongly supports Monetarist believe by confirming direct and positive relationship
between money supply and prices during the investigated period. Prices are caused by expansion
in money supply with feedback effect. Furthermore, prices and output are negatively associated

iRASD Journal of Economics 3(2), 2021
117
with each other. In a nutshell, we can safely conclude bi-directional relationship between prices
and money supply and between prices and real output in Pakistan. To overcome these ill effects
of rising prices on real output and to mitigate inflation two key policy measures are suggested.
Firstly, coordinated monetary and fiscal policies are need of hour to keep macro-economic
balances and to mitigate adverse impacts of inflation on real output. Secondly, in order to reap
benefits from economic globalization, there is a need to ensure trade competitiveness.
In this research, we put best efforts to examine long run causal ordering of money, prices
and output within the framework of macro model in Pakistan using longer data. We tried to make
it inclusive in its all possible aspects, however, in research there is always room for improvement.
We have used QTM for formulation of price equation, whereas, future potential researchers can
formulate price equation with any other relevant theory of money. Moreover, graph theoretic
approach based evidence on subject matter can also be examined as it is limited in case of
Pakistan.
References Abbas, Kalbe (1991). Causality Test between Money and Income: A Case Study of Selected
Developing Asian Countries (1960 – 1988). Pakistan Development Review, 30(4),1919-
1927.
Abbas, K., & Husain, F. (2006). Money, Income and Prices in Pakistan: A bi-variate and tri-
variate causality. South Asia Economic Journal, 7(1), 55-65.
Asghar, Z., & Jahandad, N. (2010). Causal Order between Money, Income and Price through
Graph Theoretic Approach for Pakistan. Economics Bulletin, 30(3), 2515-2523.
Ahmed, M. (2003). Money Income and Money Price Causality in Selected SAARC Countries:
Some Econometric Evidence. The Indian Economic Journal, 50(1), 55-60.
Barth, J., and J. Bannett (1974). The Role of Money in Canadian Economy: An Empirical Test.
Canadian Journal of Economics, 306-311.
Bengali, K., A. Khan and M. Saddaqat (1999). Money, Income, Prices and Causality: The
Pakistani Experience.
Bilquees, F (1988). Inflation in Pakistan: Empirical Evidence on the Monetarist and Structuralist
Hypothesis. The Pakistan Development Review, 27(2), 109-130.
Daniel, L.T and D.S. Batten (1985). Lag Length Selection and Tests of Granger Causality
between Money and Income. Journal of Money, Credit and Banking, 17 (2), 164-178.
Dingela, S., & Khobai, H. (2017). Dynamic impact of money supply on economic growth in South
Africa. An ARDL approach.
Fazal Husain, A Rashid (2008). Economic Liberalization and the Causal Relations Among Money,
Income and Prices: The Case of Pakistan. Journal of Applied Economics, 18,103-121.
Government of Pakistan. Economic Survey (Various Issues), Finance Division, Economic
Advisor’s Wing, GOP, Islamabad.
Heidri and Salmasi (2010). Re-investgation of the Long run Relationship between Money Growth
and Inflation in Iran: An Application of Bound Test Approach to Co-integration.
International Conference on Business and Economic Research, IACSIT Press, Kuala
Lumpur, Malaysia
Hussain, F and T. Mahmood (1998). Causality between Money and Prices: Evidence from
Pakistan. The Pakistan Development Review, 37(3), 1155-1161.
Joshi, K and S, Joshi (1985). Money, Income and Causality: A Case Study for India. Arthavikas.
Kalba, Abbas and Hussain Afzal (2006). Money, Income and Prices in Pakistan: A Bi-variate and
Tri-variate Causality. South Asian Economic Journal, 7(1), 55-65
Khan, A. H; Siddique A. N. (1990). Money, prices and Economic Activity in Pakistan: A Test of
Causal Relation. Pakistan Economic and Social Review 28, 2.
Khan, A.H and M.A. Qasim (1996). Inflation in Pakistan Revisited. The Pakistan Development
Review, 35(4), 747-759.
Khan, M.S and Schimmelpfening (2006). Inflation in Pakistan: Money or Wheat?. International
Monetary Fund Working Paper
118
Lee, S., and W. Li (1983). Money, Income and Prices and their Lead Lag Relationship in
Singapore. Singapore Economic Review, 73-87.
Lucas, R. E., Jr (1980). Two Illustrations of the Quantity Theory of Money. American Economic
Review, 70:5.
Mahara, T., & Mahara, T. (2020). Money Supply-Economic Growth Nexus: Evidence from a
Landlocked Country.
Mansoor, A., Shoukat, Q., Bibi, S., Iqbal, K., Saeed, R., & Zaman, K. (2018). The Relationship
between Money Supply, Price Level and Economic Growth in Pakistan: Keynesian versus
Monetarist View. Review of Economic and Business Studies, 11(2), 49-64.
Masih, A.M.M and R. Masih (1998). Does Money Cause Prices or the other way around? Multi-
country Econometric Evidence including Error Correction modeling for South East Asia.
Journal of Economic Studies, 25, 138-160
Ng, S. and Perron, P. (2001), Lag Length Selection and the Construction of Unit Root Test with
Good Size and Power. Econometrica, 69, 1519-54.
Okpara and Nwaoha (2010). Government Expenditure, Money Supply, Prices and Output
Relationship in Nigeria: An Econometric Analysis. International Research Journal of
Finance and Economics.
Omoke, Philip Chimobi and Ugwuanyi C.U (2010). Money, Prices and Output: A Causality Test
for Nigeria”. American Journal of Scientific Research, 8, 78-87.
Pakistan, Government of (various issues), Statistical Bulletin, SBP
Qayyum, A. and F. Bilquees (2005). P-Star Model: A Leading Indicator of Inflation for Pakistan.
The Pakistan Development Review, 44(2), 117-129.
Qayyum Abdul (2006).Money, Inflation and Growth in Pakistan. The Pakistan Development
Review, 45(2), 203-212.
Rangarajan C., A. R. Arif (1990). Money, Output and Prices in Rangarajan C. (ed) 2004: Select
Essays on India Economy. Academic Foundation New Dehli, 285-316.
Rolnick, A.J and W.E Weber (1994). Inflation, Money, Output under Alternative Monetary
Standards. Federal Reserve Bank of Minneapolis (Research Department Staff Report).
Sims, C. A (1972). Money, Income and Causality. American Economic Review, 62, 540-552.
Singh, C., Das, R., & Baig, J. (2015). Money, output and prices in India. IIM Bangalore Research
Paper, (497).
Suleman, D Wasti; S.K.A Lai I; Hussain A. (2009). An Empirical Investigation between money
Supply, Government Expenditure, Output and Prices: The Pakistan Evidence. European
Journal of Economics, Finance and administrative Sciences, Issue 17, 60-68.
Williams, W., C. Goodhart and D. Gowland (1970). Money Income and Causality: The UK
Experience”. American Economic Review, 417-423.
Zahid A. and Nighat J. (2010). Causal Order between Money Income and Prices through Graph
Theoretic Approach for Pakistan. Economic Bulletin 30 (3), 2515-2253.