Embed Size (px)
Citation preview

Joe Molieri/Bread for the World

CHAPTER 3
Chapter Summary
We can get close to ending hunger in America by making improvements in economic policies as discussed in
Chapters 1 and 2. But we cannot end hunger altogether without confronting knottier social issues. Often, hunger
is a by-product of social exclusion, which can
appear in many forms of discrimination. Ending
hunger requires ending discrimination and having
a safety net wide enough to protect those who are
at the margins of society. This chapter addresses
issues of social exclusion, focusing on people
with criminal records, at-risk youth on their way
to dropping out of school, adults and children
with disabilities, and low-income seniors. Clearly,
these are not all the excluded groups, nor do they
represent all forms of discrimination. They are
examples of why ending hunger requires more
than just getting to full employment and making
sure every job is a good job.
Inclusion for the Excluded and Denied
• Abolish laws that prohibit people with criminal records from receiving public benefits and that make it hard for them to get jobs and earn an honest living.
• Establish an employment program that targets individuals with significant barriers to work so that they are able to gain work experience, build skills, and improve their long-term prospects for employment.
• Guarantee every child a high-quality education from Pre-K through grade 12 and assure critical benchmarks are reached.
• Increase income assistance for people with disabilities who cannot work; provide better support to those who can and want to work.
• Improve SNAP outreach to low-income seniors; ensure that there is sufficient funding to deliver meals to all those who are homebound and in need.
MAIN RECOMMENDATIONS IN THIS CHAPTER
www.bread.org/institute n 2014 Hunger Report 87

Ex-Offenders/Returning CitizensAfter paying their debt to society, ex-offenders returning to their communities face many
barriers to putting their lives back together. Poor people of color, particularly men, are victims of a discriminatory criminal justice system that seems intent on keeping them in poverty. The stigma of having a criminal record means that ex-offenders—returning citizens is the term preferred by advocacy groups—are already one of the groups most vulnerable to hunger. Poli-cies that make millions of returning citizens ineligible for nutrition assistance only exacerbate the problem—while studies show that access to public services that improve economic secu-
rity, especially soon after people are released, reduces recidivism rates.1 The policies are counterpro-ductive, go on punishing people long after they’ve completed their sentences, and turn their children, other family members, and com-munities into collateral damage.
TJ and MarquezAs his release date approached,
Terry Jones (TJ), 41, decided to apply for SNAP benefits (which used to be called food stamps). It was the first time he had applied, although he’d been eligible based
on income for most of his life. “I was too proud for food stamps,” he explained. When he was a kid, his father told him there were three things poverty should never do to a man: pawn belongings, sell blood, or use food stamps. TJ changed his mind about food stamps because of his own kids. Once he got out of prison, he would need to feed them. That was his job, as their father. The SNAP benefit won’t be enough by itself, but it will help. In Ohio, where he lives, a returning citizen is eligible for up to $200 of food stamps a month.
Most parents in prison are fathers (744,200 fathers compared to 65,600 mothers in 2012).2 For T.J., the worst thing about prison was the separation from his children. This was his third time in prison. His teenage daughter told him she thinks about suicide. She is 6 feet tall and kids make fun of her for her height. It tears him up to think how much it hurts her. He wants to be able to tell her every day that she is a beautiful young woman, but he can’t when he is behind bars. “The number of fathers in prison increased 76 percent and the number of mothers in prison increased 122 percent between 1991 and 2007,” reports the Sentencing
Figure 3.1 Number of Parents in Prison, 1991-2007
Source: The Sentencing Project (2012), “Parents in Prison.”
0
200,000
400,000
600,000
800,000
1991 1997 1999 2004 2007
Fathers
0
25,000
50,000
75,000
100,000
1991 1997 1999 2004 2007
Mothers
If the dropouts from the nation’s class of 2011 had graduated, the U.S. economy would benefit by about
over their lifetimes.2
$154 billion
From 2000 to 2010, the rateof incarceration decreased
35 percent for black women and increased 28 percent for Hispanic women, and 38 percent for white women.1
88 Chapter 3 n Bread for the World Institute

CHAPTER 3Project, a research and advocacy group that promotes reforms in sentencing policy. See Figure 3.1. “In 2007, 1.7 million children had a parent in prison on any given day.” 3
In several states, the law prohibits people convicted of certain categories of crimes from receiving public benefits. People convicted of drug-related crimes are hit with restrictions that affect their employment, housing, education, military service, driver’s licenses, child custody, voting rights, nutrition assistance, and more.4 In its zeal to “get tough” on drugs, and without regard to the inequities of the criminal justice system, Congress in 1996 enacted a lifetime ban on food stamp eligi-bility for ex-drug offenders. There is a similar lifetime ban on eligi-bility for Temporary Assistance for Needy Families (TANF), a program that mainly serves families headed by single mothers. Little research exists on the relationship between recidivism rates and the stress experienced by parents trying to feed their children. But TJ and other men in the HELP Program for returning citizens in Cincinnati admit to doing whatever necessary to make sure their children don’t go hungry.
Most states have either elimi-nated the ban on SNAP eligibility or changed it to a partial ban—for example, in some states it applies to people convicted of distributing or manufacturing drugs but not to those convicted of pos-session only.5 Ten states continue to ban all drug-related ex-offenders from SNAP. See Figure 3.2. Underscoring the harm done by the ban, a report released in 2013 in the journal AIDS Education and Prevention studied its implications in Texas, California, and Connecticut. Texas has a full ban, California a partial ban, and Connecticut no ban. The results indicated that returning citizens “who did not eat for an entire day were more likely to live in a state with a SNAP food benefit ban compared to a state without a SNAP food benefit ban.”6 Moreover, the study provided evidence that those who’d gone longer without food were more likely to engage in risky behaviors such as exchanging sex for money, thus increasing their risk of exposure to HIV.
Dominic Duren, assistant director of the HELP Program, pauses for a photo with his son Dominic Jr. in the basement of St. Francis De Sales in Cincinnati, Ohio.
Joe Molieri/Bread for the World
twice the rate
women over the age of 65The poverty rate of
is approximately
for men over 65.4
Nearly two-thirds of working-age adults who experience consistent poverty—more than
36 months of poverty during a 48-month period—have one or more disabilities.3
www.bread.org/institute n 2014 Hunger Report 89

In an effort to reduce recidivism, the state of Ohio has repealed some of the sanctions against returning citizens. The Second Chance Act of 2007, a federal law, was originally sponsored by two members of Congress from Ohio, Senator Rob Portman and the late Rep. Stephanie Tubbs Jones, who represented the Cleveland area.7 The federal law provides funds for job training and other re-entry programs but leaves the imposition or repeal of sanctions up to the states. The repeal of sanctions in Ohio means that returning citizens have access to somewhat more help than their counterparts in some other states. But they still face daunting challenges.
Public perceptions often change far more slowly than laws.
Marquez McCoy’s experience is a perfect illustration of this. In February 2013, less than a month before we met him for the first time, Marquez was turned down for a job working in the storeroom at a casino. Of course, nearly everyone has inter-viewed for a job and not gotten it, but Marquez’s interview process shows the ongoing challenges confronting people coming out of prison. He had made a good impression on the storeroom manager. A small, mus-cular guy in his early 30s, he came across as quite capable of doing the work. He was honest about his past and the manager was willing to give
him a try nonetheless. In turn, he told Marquez up front that the Human Resources department might not be as open-minded about hiring someone with a criminal record. A criminal record is not something easily hidden. “Have you ever been convicted of a felony?” is among the first questions on most job applications. To boost Marquez’s chances with the HR department, the manager asked him to provide five letters of recommendation instead of the usual three. Mar-quez did him two better and provided seven letters, including one from a judge. Late on a Friday, Marquez got a call from the manager of the storeroom, not to offer him a job but to tell him he was sorry that HR would not approve his hire because he had a felony conviction.
It was the closest Marquez had come to getting a job in more than a year, and when it fell through he plunged into a severe depression, convinced he was never going to be able to earn money in a legitimate job and would have to return to what he did before going to prison: sell drugs. But the other men in the HELP Program worked with him, helping him get past the depression and supporting him until the temptation to go back to working the street had eased.
The HELP ProgramThe HELP Program is a ministry of the St. Francis de Sales Parish community in Cincin-
nati. The men served by the program have all spent time in prison and are struggling with
Nate Gordon, a leader with the HELP Program, and his daughter at his ex-girlfriend’s mother’s
house. Though Nate works at night, he always
makes an effort to visit his children each week.
Joe Molieri/Bread for the World
90 Chapter 3 n Bread for the World Institute

CHAPTER 3their re-entry into everyday life. Participants come predominantly from the Over the Rhine (OTR) community of Cincinnati, a depressed area of the city known for concentrated poverty and violent crime associated with the drug trade. The program’s goal was to help the men get jobs. It was founded in 2007 by Brother Mike Murphy after his return to Cincinnati from India, where he had spent 12 years with the Missionaries of Charity led by Mother Teresa.
2007 was a discouraging time to be launching a program to help a group of men with criminal records find jobs—a difficult task even in a strong economy. The end of 2007 was the beginning of the Great Recession. Many of the prospects Mike had worked to cultivate fell through. The owner of a construction com-pany had agreed to provide jobs to 20 men if Mike would work with them to obtain driver’s licenses and General Equivalency Degrees (GEDs). Mike held up his end of the bargain, but as the recession worsened, the company no longer had the jobs to offer.
At first sight, Mike does not look like the natural leader of such a program. He is white and the men are without exception African American. At 73, he is older than the participants by decades—by 50 years in some cases. When he returned from India, he had little experience with ex-offenders and had not expected to be working with them. But his parish commu-nity challenged him to reach out to the men standing on street corners all day, unable to find work.
Initially, he thought the men were jobless because they lacked the skills that employers needed. He soon realized, though, that legal obstacles kept them from getting and holding onto jobs. The biggest difference between Mike and the men in the program was how they were viewed and treated by government. Changing the laws had to be at the top of the HELP Program’s agenda, he realized.
In 2012, Ohio Governor John Kasich signed Senate Bill (SB) 337, an extensive reform of the employment restrictions on returning citizens. Through their lobbying efforts, the men in the HELP Program were instrumental in its passage. They met with legislators and shared their experiences of wanting to work but not being able to get jobs, in large part because of state sanctions. At the time the governor signed the bill, TJ was in prison for a parole violation but was following the bill’s progress in the newspaper. He wept when
Figure 3.2 State Polices Regarding Disqualification of SNAP Benefits for Ex-offenders who Committed A Drug Felony
Source: U.S. Department of Agriculture, Food and Nutrition Service (2012).
Lifetime Ban (12)
Modified Ban (20)
No Ban (21)
DC
Drug Felony Disqualification PolicyVirgin IslandsHawaiiGuam
Alaska
www.bread.org/institute n 2014 Hunger Report 91

he learned that the bill had passed. He and his brothers in the HELP Program had won their battle for change. It didn’t occur to him until later that the legislation that had pre-vented him from getting a job as a barber had been repealed. TJ had learned to cut hair while in prison, but under the old law he could not obtain a barber’s license. The thinking behind the law was based on the belief that the cash transactions between barbers and their customers provide an opportunity to launder money.
Ohio’s SB 337 would not have been possible without the federal Second Chance Act. The fact that two Ohio legislators were lead sponsors of the federal law and that Governor Kasich had been a col-league of theirs in Congress made a big difference to its chances of pas-sage. The bill was presented to the public as a measure to reduce recid-ivism—and save money. According to a 2011 report by the Pew Center on the States, Ohio could see more than $24 million in cost savings by reducing recidivism by 10 percent.8 Nationwide, more than four in 10 ex-offenders return to state prison within three years of their release, according to the report.9
The advocacy work done by the men in the HELP Program includes talking to members of the St. Francis de Sales Parish community. They share the journey they are on, a journey that casts them in a light ema-nating from St. Dismas, the penitent thief who was crucified alongside Jesus. When he asked Jesus to “remember me when you come into your kingdom,” the Savior replied, “I say to you, today you will be with me in Paradise.”10 Face-to-face meetings between parishioners and the men in the program help raise the funds needed to sustain the HELP Program. Many people of faith who might otherwise be quick to condemn them for their criminal records have been moved by their testimony, and some of the men have been offered jobs right on the spot.
Subsidizing Work Can Work As the economy recovers from the Great Recession, some groups with significant bar-
riers to employment, such as returning citizens, will continue to need help getting jobs. The structural barriers they face predate the recession and are rooted in discrimination. The longer they are unemployed, the harder it is for them to find jobs. Subsidized employment programs can allow people in these situations to gain work experience, build skills, and improve their long-term prospects for employment.
The best-known example of a subsidized employment program is the Works Progress Administration (WPA), a New Deal program that provided jobs to 8.5 million people during
Br. Mike Murphy, founder of the HELP
Program, meets with a HELP participant.
Through mentorship and personal investment, Br.
Mike works to re-build the lives of ex-offenders/
returning citizens.
Joe Molieri/Bread for the World
92 Chapter 3 n Bread for the World Institute
CHAPTER 3
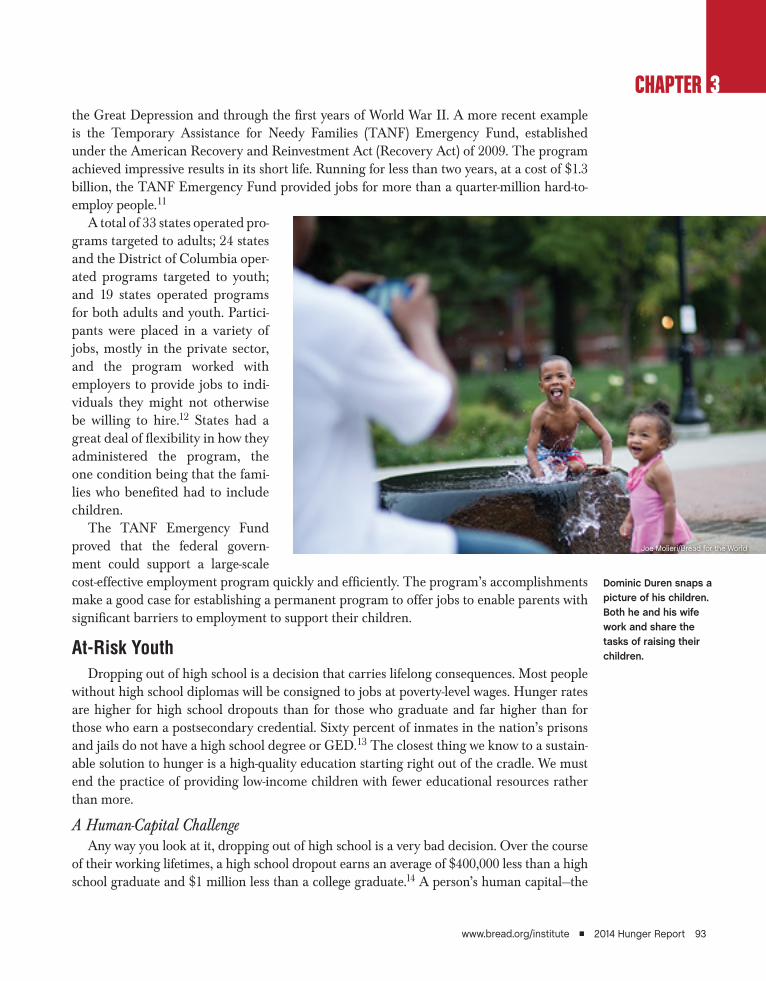
Dominic Duren snaps a picture of his children. Both he and his wife work and share the tasks of raising their children.
Joe Molieri/Bread for the World
www.bread.org/institute n 2014 Hunger Report 93
the Great Depression and through the first years of World War II. A more recent example is the Temporary Assistance for Needy Families (TANF) Emergency Fund, established under the American Recovery and Reinvestment Act (Recovery Act) of 2009. The program achieved impressive results in its short life. Running for less than two years, at a cost of $1.3 billion, the TANF Emergency Fund provided jobs for more than a quarter-million hard-to-employ people.11
A total of 33 states operated pro-grams targeted to adults; 24 states and the District of Columbia oper-ated programs targeted to youth; and 19 states operated programs for both adults and youth. Partici-pants were placed in a variety of jobs, mostly in the private sector, and the program worked with employers to provide jobs to indi-viduals they might not otherwise be willing to hire.12 States had a great deal of flexibility in how they administered the program, the one condition being that the fami-lies who benefited had to include children.
The TANF Emergency Fund proved that the federal govern-ment could support a large-scale cost-effective employment program quickly and efficiently. The program’s accomplishments make a good case for establishing a permanent program to offer jobs to enable parents with significant barriers to employment to support their children.
At-Risk YouthDropping out of high school is a decision that carries lifelong consequences. Most people
without high school diplomas will be consigned to jobs at poverty-level wages. Hunger rates are higher for high school dropouts than for those who graduate and far higher than for those who earn a postsecondary credential. Sixty percent of inmates in the nation’s prisons and jails do not have a high school degree or GED.13 The closest thing we know to a sustain-able solution to hunger is a high-quality education starting right out of the cradle. We must end the practice of providing low-income children with fewer educational resources rather than more.
A Human-Capital ChallengeAny way you look at it, dropping out of high school is a very bad decision. Over the course
of their working lifetimes, a high school dropout earns an average of $400,000 less than a high school graduate and $1 million less than a college graduate.14 A person’s human capital—the

total of his skills and capabilities—determines his employability. Education is still the best way to build human capital. A worker with a higher level of education earns higher wages, and in turn, higher wages make it possible for her to continue building her human capital by obtaining additional education or training. It’s a “virtuous cycle”—as opposed to a “vicious cycle”—that pays off for the rest of a person’s life.
But the costs of teenagers dropping out are also borne by society. In 2007, the Center for Labor Market Studies at
Northeastern University estimated that there were 6 million high school dropouts in the United States between the ages of 16 and 24.15 Economists say that the people in this cohort alone will cost society at least $1.75 trillion over their lifetimes through public assistance, lost tax revenues from their reduced earnings, and incarceration.16 Harry Holzer, an economist at Georgetown University and the Urban Institute, has studied the impact of high school dropout rates on the national economy. He estimates that every percentage point increase in the dropout rate reduces federal revenues by $5 billion per year. “A 1 percentage-point increase that lasts for five years would reduce total federal revenues by a total of $25 billion,” Holzer says. “A 2 percentage-point increase lasting that amount of time would reduce revenue by a total of $50 billion.”17
In 2010, the latest year of data available, 78.2 percent of students graduated who started as freshman four years earlier.18 That was up from 73.2 percent in 2006. A 5-percentage point rise in five years is very good news. The news was espe-cially positive for students of color. From 2006 to 2010, Hispanic graduation rates improved from 61 percent to 71.4 percent and African American graduation rates from 59.2 percent to 66.1 per-cent.19 Whites saw gains as well, though they were not as dramatic—from 80.3 percent in 2006 to 83 percent in 2010.20
During the first half of the twentieth century, the United States had the highest secondary school completion rates in the world. U.S. domi-nance peaked in the early 1960s, when graduation rates reached a plateau that lasted for decades.
Figure 3.3 Prevalence and Severity of Food Insecurity Among Children, by Educational Attainment of Most Educated Adult in Household, 2010-2011 Average.
Source: USDA, Economic Research Service (2013). Calculations based on Current Population Survey Food Security Supplement data.
Very low food security Low food security
Percent of households
50 10 15 20 25 30
4-year degreeor higher
Some college(including 2-year
degree)
Completed highschool (or GED)
Less than highschool
All households with children
“Hunger rates are higher for high school dropouts than for those who graduate and far higher than for those who earn a postsecondary credential.”
94 Chapter 3 n Bread for the World Institute

CHAPTER 3Other countries caught up, and many eventually surpassed us. Now, the U.S. secondary school completion rate is ranked 22 out of 27 high-income countries.21 While it may have been inevitable that other countries would catch up with the United States, the long plateau of no improvements in U.S. graduation rates was not inevitable.
Despite the overall improvement in graduation rates, there are still too many schools where the odds are stacked against students. These are schools where a 40 percent dropout rate, or worse, is considered the norm.22 When a school has a large share of students at risk of dropping out, it undermines the quality of educa-tion for all students in the school. Based on patterns of inequity in education, it is not surprising that dropout rates are highest in low-income communities. Students of color are the most affected since at-risk white students are more likely to be integrated into schools in middle-class communities.23
More than half a century after Brown vs. Board of Education ended “separate but equal,” we find that segregation in U.S. schools is increasing. The share of black students attending schools that are more than 90 percent minority grew from 34 percent in 1989 to 39 percent in 2007. Low-income immigrant Hispanic children are also concentrated in schools with higher percentages of minorities. Segregation by income level is also increasing: In 1989, black stu-dents attended schools in which an average of 43 percent of their class-mates was low-income; by 2007, this figure had risen to 59 percent.24 The absolute number of white stu-dents who drop out is larger, but the percentages of black and Hispanic students who drop out are higher. See Figure 3.4 and 3.5.
Figure 3.4 Dropouts as a Percent of 16-24 Year Olds (2007)
Source: Northeastern University - Center for Labor Market Studies and Alternative Schools Network in Chicago (2009), “Left behind in America : the nation’s dropout crisis.”
30%
25
20
15
10
5
0White Black Hispanic Other
12.2%
27.5%
21.0%
10.7%
10,000,000
8,000,000
6,000,000
4,000,000
2,000,000
0Black
5,535,350
1,161,343
Hispanic
6,765,995
1,858,498
Other
2,839,900
304,234
White
Total Dropouts by Race
23,355,067
2,849,809
Total 16-24 Year Olds
Figure 3.5 Number of Dropouts 16-24 Years Old by Race (2007)
www.bread.org/institute n 2014 Hunger Report 95

Michele Learner, Bread for the World Institute
Most of this year’s Hunger Report discusses hunger and poverty in the context of the many stresses on U.S. families in a difficult economy. But hunger also affects teenagers who are out on their own. For at least 320,000 to 400,000 teens each year, hunger and homelessness are most often tied to family rejection. Stigma based on sexual orientation and gender identity affects lesbian, gay, bisexual, and transgender (LGBT) people across the life course—bringing rejection, victimization, and a higher proportion of health and mental health problems. But teenagers are the most vulnerable.
In the past, few adolescents came out publicly as LGBT. Today’s growing legal and social acceptance of the LGBT community, while welcome and overdue, carries an “unintended conse-quence”—young people are coming out earlier, and many families, schools and communities
are not as accepting as media coverage suggests. It’s a recipe for large numbers of young people who have
either been kicked out of their homes by parents or have run away in the face of family rejection and abuse. There is little hard data available on homelessness among LGBT youth, but estimates suggest that as many as 40 percent of all homeless youth identify as LGBT. In one study in New York, the average age that homeless lesbian and gay teenagers had become homeless was just under 14 years old. For transgender youth, it was even younger—13 years old.
What can be done? Hunger and homelessness for LGBT youth has causes and solutions that are tied to the social environment. Solutions—meaning social change—must come from greater awareness, government protection and services, and family support.
Preventing suicide, homelessness, and other serious health risks, and promoting the well-being of LGBT youth in the context of the family, is the mission of the Family Acceptance Project (FAP). FAP is a research-based intervention and policy project, based at San Francisco State University, which helps diverse families better understand and support their LGBT children. FAP is developing a new evidence-based family intervention model to prevent and ameliorate systems-level health problems, such as homelessness, to be disseminated across the country.
When Michael’s parents heard he was gay, they told him he had to leave and couldn’t come back until he repented. After two weeks on the street, Michael heard about a program that provides support for homeless LGBT youth. Staff gave Michael’s parents FAP’s family educa-tion materials, which explain to families that how they react to their LGBT children affects the teens’ risk of serious health problems such as suicide and HIV. And they show ways for families to support their LGBT children—even if they believe that being gay is wrong. Michael’s parents learned about sexual orientation. They learned how to help their son and keep their family together. With counseling and support, they asked Michael to come home.
Michele Learner is an associate editor with Bread for the World Institute.
BOX 3.1
NEITHER SEEN NOR HEARD: LGBT YOUTH AND HUNGER
“There is little hard data available on homelessness among LGBT youth, but estimates suggest that as many as 40 percent of all homeless youth identify as LGBT.”
96 Chapter 3 n Bread for the World Institute

CHAPTER 3Jackson, Mississippi
Albert Sykes grew up in the same neighborhood as the slain civil rights leader Medgar Evers. Albert’s grandmother told him that she was home that day in 1963 and heard the shots fired that killed Evers. Albert was born in 1983. The civil rights movement has a daily physical presence in Albert’s life: the house where the Evers family lived.
Albert has three sons: Aiden is 7, Ethan 5, and Christian 2. He named the youngest after a close friend, Chris Adagbonyin, who was murdered in 2007. “For every black male born after 2002,” Albert says, “there is supposedly a one in three chance of going to prison. I can’t accept that one of my sons is going to end up in prison. Not in my family.”25
Albert carries on the work of the civil rights movement through his leadership of the Young People’s Project (YPP) in Jackson. YPP uses math literacy as a tool to develop young leaders who want to radically improve the quality of education—and the quality of life—in their communities.26 High school students teach kids in middle school and by working together, the young people develop confidence in themselves to analyze and solve problems that go beyond algebra. They boost each other’s self-esteem and counter the low-expectations of their school, community, and families. They gain a stronger sense of being respon-sible for each other’s welfare, and they begin to come together to demand more from the education system, seeing improvements as mandated by their right to a quality education. Even though Jackson has one of the lowest high school graduation rates of any city in the country,27 95 percent of YPP students graduate and 75 percent go on to college.28
YPP’s genesis was in the work of Robert Moses, a civil rights leader who came to Jackson in the early 1960s with the Student Nonviolent Coordinating Com-mittee (SNCC) to help ensure that black people could register to vote. In 1982, Moses founded the Algebra Project in Cambridge, Massachusetts. The idea was not only to teach at-risk children how to solve algebra problems, but also to apply principles he learned as an organizer in the 1960s. “Algebra is the gatekeeper,” Moses explained to an interviewer in 2010.29 Success in algebra is directly related to educational and economic empowerment. Mastering algebra in high school more than doubles a student’s chances of earning a four-year college degree.30 A child born into a family in the lowest 20 percent of the U.S. income distribution who goes on to earn a four-year college degree is 80 percent less likely to wind up in that same lowest quintile as an adult than a peer who does not earn a college diploma.31 Thus, algebra is directly related to economic mobility.
Mastering algebra in high school more than doubles a student’s chances of earning a four-year college degree.
iStock
www.bread.org/institute n 2014 Hunger Report 97

Moses gained national recognition for the Algebra Project when he received a MacArthur Foundation “Genius Grant,” which enabled him to expand the project to other parts of the country. In 1994, he brought the Algebra Project to Jackson, where Albert Sykes, then 11 years old, was among the first group of students. At Brinkley Middle School, where Albert was a student, 96 percent of the children qualify for free and reduced price lunch.32 Only 10 percent of the students in a recent study who were eligible for the National School Lunch Program showed proficiency in math.33
The Algebra Project initially got Albert’s attention—and that of most of the other par-ticipants—because food was offered at every session. “When we started showing up after school, it was mostly because we knew there wasn’t going to be dinner at home that night,” he says. “Sure there was hunger for knowledge, but there was also real physical hunger.”34
YPP was founded in 1996, and Albert was involved in it from the beginning. At just 14, he helped write the organization’s first grant proposal, which won YPP a $150,000 grant from the Kellogg Foundation. YPP has grown from one school in Jackson to 16 cities around the country. Every year, the program reaches 5,000 students from disenfranchised communi-
ties35 with math and leadership training. Albert now spends most of his time organizing both children and adults, encouraging them to demand more from public officials. Because of YPP’s stellar reputation in the community, Albert can walk into almost any church and begin a con-versation with the pastor about issues in the community. With the pastor’s support, he is able to organize a meeting with members of the church. At the end of the meeting, they agree to do a project together—for example, dedicating part of a weekend to cleaning up their neighborhood. Afterwards, they take another step by petitioning the city government to take action on the abandoned properties blighting their neighborhoods, and then another step by pressuring the officials to follow through until the community receives an acceptable response.
YPP works primarily at the local level, but it is also participating in a national conver-sation on education reform. In 2010, YPP launched the “We the People Tour” to engage students and educators around the country in a national dialogue about making high-quality education a fundamental right. In 2011, the U.S. Department of Education offered YPP a lead role in hosting Voices in Action: National Youth Summit. The event brought together students from around the country, which focused on sharing best practices in advocating for and winning change in their communities. While education reformers are usually acting on behalf of students, YPP believes that students themselves must be change agents.36
Dr. Robert Moses, a civil rights pioneer and educa-
tion reformer, founded the Algebra Project in the
early 1980s to improve the math literacy of children in
disadvantaged schools.
Rick Reinhard
98 Chapter 3 n Bread for the World Institute

CHAPTER 3Quality Education as a Constitutional Right (QECR), a YPP-led effort to establish a
federal guarantee of high-quality public education for all, is supported by groups such as the Children’s Defense Fund, the Frameworks Institute, and the SNCC Legacy Project.37 QECR envisions a day when every young person in the country—regardless of ethnicity, gender, or class—has access to a high-quality education. This may seem to be a grandiose vision, but at one time, voting rights were the same kind of vision. In a typical school year, 500,000 students in grades 9-12 drop out of school.38 YPP estimates that it serves 5,000 students per year.39 So clearly, it can’t be left as the only pro-gram to take responsibility and action.
Early EducationEarly childhood education is a topic that has attracted
widespread attention and fanfare in the media and state leg-islatures. By now, most Americans are aware that high-quality early childhood education can improve a person’s lifelong educational achievements. In his 2013 State of the Union speech, President Obama called for universal Pre-K education in the United States. As we said in Chapter 2, the United States is the only high-income country that does not offer universal Pre-K.
Longitudinal research—the study we’re about to discuss has followed the same people since the 1970s—suggests that low-income children can make dramatic and lasting educa-tional gains with quality education in early childhood. Between 1972 and 1977, 111 low-income children in North Carolina participated in a study starting when they were infants, the now-legendary Carolina Abecedarian Project. Of the children in the study, 57 received high quality child care and early education, and the rest formed a control group.40 The Abecedarian group received care and instruction year-round until age 5. The educational program featured low student-to-teacher ratios and emphasized cognitive, language, social, and emotional development.
By the time the children in the Abecedarian group turned 21, they had more advanced reading and math skills, had finished more years of schooling, were attending college at higher rates, and had jobs that were higher-paid and required more skills than the children
Figure 3.6 Percent of U.S. Population Enrolled in Preschool
Source: W. Steven Barnett et al (2012), The State of Preschool 2012, National Institute for Early Education Research.
3%14%
2002
2%
16%
2003
3%
17%
2004
3%
17%
2005
3%
20%
2006
3%
22%
2007
4%
24%
2008
4%
25%
2009
4%
27%
2010
4%
28%
2011
4%
28%
2012
3-year-olds 4-year-olds
“Sure there was hunger for knowledge, but there was also real physical hunger.”
— Albert Sykes
www.bread.org/institute n 2014 Hunger Report 99

in the control group. By the time participants were 30, they were four times as likely to have earned a college degree. Professor Craig Ramey, co-author of a recent study on the Abecedarian Project, said, “I believe that the pattern of results over the first 30 years of life provides a clearer than ever scien-tific understanding of how early childhood education can be an important contributor to academic achievement and social compe-tence in adulthood. The next major challenge is to provide high quality early childhood education to all children who need it and who can benefit from it.”41
It is important to note that the Abecedarian Project is just one of numerous studies, both small- and large-scale, that demonstrate the short- and long-term benefits of high-quality early education.42 The most essential term in this statement is “high-quality.” While
Pre-K has shown promise in giving children a strong start, that potential will only be fully realized if children’s Pre-K experiences are high-quality and are followed by high-quality schooling as they grow up.
Adults and Children with Disabilities
New laws in recent decades have redefined the rights of people with disabilities and made it possible for many to par-ticipate more fully in society. But Americans with disabilities continue to be more marginalized than others; having a dis-ability makes a person two to three times as likely to experi-ence poverty as someone who is not disabled.
The federal safety net is not really designed with the needs of disabled people in mind. It is assumed that adults will be using safety net programs only briefly, until their work situations improve—yet disabled people may not be able to work at all, or only able to work a few hours from time to time. Similar difficulties confront the par-ents of children with disabilities, whose responsibility to care for their children often limits their ability to work.
Figure 3.7 Percent of 4-Year Olds Served in State Pre-K
Source: W. Steven Barnett et al (2012), The State of Preschool 2012, National Institute for Early Education Research.
“Households that choose to apply for food stamps/SNAP are in the greatest need of food assistance and most likely to be food insecure.”
— USDA
100 Chapter 3 n Bread for the World Institute

CHAPTER 3Sympathy Is Not Enough
Several studies show that a household that includes a disabled person is more likely to be food insecure than a household with the same income where no one is disabled.43 This is mainly because of additional expenses associated with the disability—usually extra healthcare costs, possibly home care costs, and almost certainly prescription drug costs. One study published in 2007 estimated that an income of $10,160 for an able-bodied person was equivalent to $26,668 for a person with a persistent work-limiting disability.44
As mentioned above, the disabled population of the United States experiences poverty and hunger at more than double the rate of the population at large. In 2013, the U.S. Department of Agriculture (USDA) published the agency’s first comprehensive study about the relationship between food security and disability. (USDA uses the term “low food security” to mean that a person does not know where her next meals are coming from or is at risk of hunger. “Very low food secu-rity,” meaning that a person goes without food, is what everyone else calls hunger.)
Using data collected in recent years by the Census Bureau, the USDA study found low food secu-rity in 25 percent of households where there was a disabled adult of working age (18-64), and in 33 percent of households where there was a disabled adult of working age who was not employed. “Very low food security,” as we just mentioned, is hunger. Among households with a disabled adult who was not employed, 17.3 percent experienced very low food security—a rate nearly four times higher than that of households where no working-age adult had a disability.45 See Figure 3.8.
Some of the households with very low food security were receiving SNAP benefits—in fact, households with a disabled person participate in SNAP and other safety-net programs at very high rates. So why did these households still experience hunger?
The USDA study doesn’t address this question, but the answer is not hard to find: monthly SNAP benefits, on average, last most participants somewhere between two and three weeks. Charitable food sources are needed to help supplement SNAP and the household’s own resources. SNAP does, however, reduce the number of days each month that recipients expe-rience hunger. As the USDA study notes, “Households that choose to apply for SNAP are in the greatest need of food assistance and most likely to be food insecure.”
Figure 3.8 Prevalence of Food Insecurity by Disability Status
Source: Alisha Coleman-Jensen and Mark Nord (January 2013), “Food Insecurity among Households with Working Age Adults with Disabilities,” U.S. Department of Agriculture, Economic Research Service. Calculations based on 2009 and 2010 Current Population Survey Food Security Supplement data.
17.3
11.8
4.6
16.2
13.0
7.4
0 10 20 30 40
Households with a member(age 18-64) with other
reported disabilities
Households with noworking-age adult with
disabilities
Percent of households
Very low food security
Low food security
12.0
24.8
33.5
Percent food insecure
Households with a member(age 18-64) not in
labor force-disabled
www.bread.org/institute n 2014 Hunger Report 101

Supplemental Security Insurance (SSI) is a federal program that provides modest assistance to 8.3 million people who are severely disabled with little or no income and assets.46 Roughly half of all SSI recipients live in households that are below the poverty line after taking into account all safety-net benefits.47 The maximum monthly SSI benefit for an individual in 2013 is $710,48 which adds up to an income of about three-quarters of the poverty level for a single-
person household ($8,520 annu-ally). By definition, anyone who receives the full SSI benefit has very little other income, because once a person earns $85 in a month, SSI benefits are reduced by $1 for every $2 of earnings above that amount.49
Can people in this situation use savings to help make ends meet? The answer is essentially “no,” because SSI, SNAP, and other pro-grams have “asset tests.” To qualify for SSI, an individual must not have assets worth more than $2,000; a couple’s asset limit is $3,000.50 These limits have not been raised since 1989. This prevents people from saving for emergencies. It can leave people with disabilities desti-tute in the event of a health crisis.
SSI is a different program than Social Security Disability Insurance (DI). SSI eligibility is based on income and financed from general federal revenue; DI is social insurance paid for by payroll taxes that accumulate in a trust fund. This is similar to how Social Security for retirees is financed. People who receive DI worked at one time and paid into the system. But disability caused them to lose their ability to earn enough from their work.
Most people who apply for DI are denied. One reason is that applicants must prove they are unable to do any job. Disability payments are calculated based on workers’ earnings before the disability. The average monthly DI payment in 2013 was $1,130 a month51 or $13,560 a year—less than the salary of a full-time minimum wage worker.
Reducing hunger among people with disabilities should begin by increasing their incomes. The maximum monthly benefit in the SSI program should be raised at least to 100 percent of the poverty threshold, which in 2013 was $958 a month for a single-person household.52 The current maximum SSI benefit of $710 leaves a recipient at 26 percent below the poverty level. Whether or not all of the additional $248 is spent on food, higher incomes would go a long way to reducing hunger.
Policymakers can also develop and support employment opportunities that pay a living wage for people with disabilities. Neither SSI nor DI recipients are barred from working, and, of course, employment has the same effect of reducing hunger for disabled people as it does for anyone else. SSI and DI recipients have low earnings because most can work only a few
Supplemental Security Income (SSI) provides
cash assistance to people with disabilities
up to about three-fourths of the poverty line for
a single person and slightly over 80 percent of poverty for a couple.
Todd Post/Bread for the World
102 Chapter 3 n Bread for the World Institute

CHAPTER 3hours, or even less. If they were to earn enough to put them above the poverty line, they would lose some of their benefits. Workers with disabilities are often described as the “last hired, first fired.”53 The Great Recession and subsequent weak recovery bore this out: workers with disabilities experienced higher rates of job loss and gained jobs back at a slower pace than nondisabled workers.54 In 2007, before the start of the Great Recession, 19.5 percent of DI recipients and 12.6 percent of SSI recipients held jobs of some kind. But altogether, just 2.9 percent earned more than $10,000.55 People with disabilities should have better options than benefits that aren’t enough to live on or a job that doesn’t pay enough to live on either.
Able to WorkIn 2012, the National Council on Disability issued a report documenting the scope of
the practice of paying subminimum wages to disabled workers in “sheltered workshops.” Currently about 425,000 workers, mainly people with intellectual and developmental disabilities, are working in sheltered workshops.56 Labor law exempts employers from having to pay them the minimum wage—workers may be paid a dollar an hour or even less.57 The work takes place in segregated settings (thus the term “shel-tered”) and consists of repetitive tasks, such as filling bubble gum machines or packing boxes. The tasks are performed day after day, year after year.
In 2009 and 2010, 60 men with disabilities in Iowa were being paid 41 cents an hour58 to work for Henry’s Turkey Farm. Their employer was also their “care-taker,” deducting rent from their pay to house them in a bunkhouse leased from the city of Atalissa, Iowa. This sheltered workshop made national news when the Des Moines Register uncovered evidence that workers were forced to live in roach-infested housing and subjected to other abuses.
The Social Security Administration defines a shel-tered workshop as “a private non-profit, state, or local government institution that provides employment opportunities for individuals who are developmen-tally, physically, or mentally impaired, to prepare for gainful work in the general economy.”59 In most cases, however, workers are never prepared for employment in the general economy or transitioned out of the sheltered setting. According to the National Disability Rights Network, “Rarely, if ever, does a person with a disability request to work in a sheltered workshop, but they end up working in a sheltered or segregated environment simply because it was presented as the only option.”60
About 8 in 10 people with a disability were not in the labor force in 2012, compared with about 3 in 10 persons with no disability.
Richard Lord
www.bread.org/institute n 2014 Hunger Report 103

Sheltered workshops have been portrayed as providing an altruistic service, but this is not the way many people with disabilities, and the organizations that represent them, view sheltered workshops. In 2012, for example, the National Federation of the Blind and 50 other organizations of people with disabilities led protests against Goodwill Industries for paying employees in sheltered workshops as little as 22 cents per hour.61 When asked what they
prefer, disabled people say they do not want to work in jobs isolated from the rest of society.62
In the Americans with Disabili-ties Act (ADA) of 1990, Congress and the White House declared that “The Nation’s proper goals regarding individuals with disabili-ties are to ensure equality of oppor-tunity, full participation, indepen-dent living, and economic self-sufficiency for such individuals.”63 Unfortunately, these inspiring words often slam into a crueler reality. For every disabled worker in the general economy working at a job paying at least minimum wage, there are three others employed in sheltered workshops and earning a subminimum wage.64
An antiquated provision of the Fair Labor Standards Act of 1938 is what allows employers to pay subminimum wage. Workers who have grown up in the era of ADA and experienced inclusive K-12 environments should not have to step back in time when they enter the work-place—particularly because people who are placed in sheltered workshops are often coming right from high school. A movement led by disabilities rights organizations is under way to change the law that allows employers to pay subminimum wages. The organizations are calling on government agencies to force employers to pay fair wages or stop doing business with those that do not. See “A Higher Road to Better Paying Jobs” in Chapter 2, starting on page 77. Government contract regulations require that specific quantities of goods and services be procured from sheltered workshops. These are lucrative arrangements for the mostly nonprofit organizations that are awarded the contracts, so they can afford to pay workers a fair wage. And, of course, being paid fairly is among the most important rights of all workers, including people with disabilities.
Children with Disabilities Families raising children with disabilities experience higher rates of material hardship
than families with children without disabilities.65 See Figure 3.9. The annual additional costs associated with a severely disabled child range from $3,210 on the low end to as much as $25,460 a year.66 Child care for children with disabilities is also particularly difficult to find,
People are twice as likely to be disabled at
age 50 as at age 40, and twice as likely to
be disabled at age 60 as at age 50.
Jupiterimages
104 Chapter 3 n Bread for the World Institute

CHAPTER 3making it harder for parents to work and earn a living. One-third of children with disabilities live in single-parent homes, although it doesn’t always start out that way.67 Married parents are more likely to separate or divorce within three years after the birth of a child with a dis-ability than are the parents of a child not born with a disability.68
Poverty itself increases the risk that children will develop a disability. Low birth weight, which closely tracks poverty rates, is associated with long-term dis-abilities.69 Stress, especially the so-called “toxic stress” caused by sustained economic hardship and family adversity, can cause biolog-ical changes in children that make them more susceptible to chronic illness.70 Toxic stress is also asso-ciated with cognitive difficulties. A 2012 study by the American Psychological Association found, “The children with a history of pov-erty and neglect are more likely to be diagnosed with developmental delay (60 percent compared to 10 to 20 percent), Attention Deficit/Hyperactivity Disorder (80 percent compared to 3 to 7 percent), and Learning Disability (28 percent compared to 5 percent). Addition-ally, 100 percent of our sample had emotional/behavioral disorders, compared to 46 percent of the gen-eral population.”71
There have been media reports alleging that parents are asking doctors to prescribe psychotropic drugs to their children for emotional/behavioral disorders simply so that they can qualify for SSI. (Children with disabilities in low-income families may be eligible for SSI if the disability imposes additional costs on their families.) The allegations were taken seriously in some quarters, prompting a 2011 request from members of Congress to the U.S. Govern-ment Accountability Office (GAO) to investigate “trends in the rate of children receiving SSI benefits due to mental impairments such as ADHD, depression and others to identify the causes of the trends.”72 In June 2012, GAO reported that in fact, children taking psy-chotropic drugs were more likely to be denied SSI benefits than approved.73 The evidence shows that the children who are approved do in fact qualify based on their medical condi-tions; children are approved for SSI only with solid evidence supplied by qualified medical professionals.
Figure 3.9 Low-Income Families That Include a Child with a Disability are More Likely to Experience Material Hardships
Percent of low-income (below 200% of poverty) families with children experiencing material hardships, by children’s disability
Source: Susan Parish et al (March 2009), “Material Hardships in US Families Raising Children with Disabilities: Research Summary and Policy Implications,” UNC School of Social Work, University of North Carolina.
Food-related hardship(s)
No child has a disability One or more children has a disability
54%
71%
35%
51%
Housing-related hardship(s)
www.bread.org/institute n 2014 Hunger Report 105

The SSI program for children currently provides income assistance to 1.3 million children with serious disabilities. This is about 20 percent of all U.S. children with serious disabilities, and about 1.7 percent of all children in the country.74 At a congressional hearing on the program in 2011, Katie Bentley, the mother of a ten-year-old disabled child from Covington, Kentucky, explained the value of the SSI program to her family.75 Ms. Bentley’s son Will has a wide range of disabilities as a result of lesions on his brain: the inability to use his hands due to delayed motor skills; difficulty interpreting things he touches, smells, or hears; and speech delay because of impairments in the muscles needed to form words. The income assistance the family receives
through SSI [a total of $710 in 2013] has helped improve the quality of Will’s life. For example, it allowed Ms. Bentley to reduce her work hours so that she can provide more of the care that Will needs. “At one time, Will was unable to do anything for himself,” Ms. Bentley said. Now he can write his name and has begun learning to read. “For a parent of a child with a disability,” Ms. Bentley told the members of Congress, “the wealth of support that comes from SSI and Medicaid is a dream come true… Before he was granted SSI in 2010, we could barely even afford the gas to drive him to his therapies and appointments with his special-ists.”76 For many families like the Bentleys, the Medicaid eligibility
that comes with SSI approval is no less important than the cash assistance. The prescription drugs that Will requires cost more than $1,000 a month. Medicaid pays for these.
Jonathan Stein, president of Community Legal Services in Philadelphia, spoke at the same hearing. He reminded members of Congress, “For many families with a disabled child, SSI means the difference between being able to provide for their disabled child, and having to go without basic necessities.”77 Prior to the establishment of the SSI program in 1972, a low-income family with a child with developmental disabilities such as Will’s would have had few options other than sending him to a state-run institution. A report by the House Ways and Means Committee that predates the authorizing legislation expressed what the public had already come to understand: “Disabled children living in low-income households are among the most disadvantaged of all Americans and are deserving of special assistance.”78
Low-Income SeniorsThe strongest section of the U.S. safety net is reserved for seniors. Social Security and
Medicare, the fiber of which the senior safety net is woven, prevent the majority of seniors from falling into hunger and poverty. But this section of the safety net is fraying, mostly
Nearly 30 percent of families raising a
child with a disability live in poverty.
Richard Lord
106 Chapter 3 n Bread for the World Institute

CHAPTER 3because of increases in out-of-pocket medical expenses. When out-of-pocket healthcare costs are taken into account, producing a more accurate picture of household resources and levels of hardship, senior poverty rates increase in every state and double in 12 of them: California, Colorado, Connecticut, Hawaii, Massachusetts, Maryland, Minnesota, New Hampshire, New Jersey, Nevada, Wisconsin, and Wyoming.79
Ms. JeffersLucy Jeffers is not one to complain about her ailments, though at 87, she has her share.
Her knees ache when she is on her feet too long, and a year ago she had them drained of fluid. But she doesn’t let the pain prevent her from attending church on Sundays or buying food at the supermarket. She takes advantage of a van ser-vice that picks her and other ten-ants up in front of their apartment building and drives them to the store. However, Ms. Jeffers does not join the shopping trips after the second week of the month—because that’s when her monthly SNAP benefits run out.
Ms. Jeffers is aggravated that her benefits don’t last through the month. Bad knees and all, she set off for the social services office—a trip that required three bus changes—and when she got there, she did not hesitate to speak her mind about the difficulty of feeding herself for a whole month on $35 in food stamp benefits. Ms. Jeffers brought receipts to show what she was spending her SNAP benefits on. She has high cholesterol and was told by her doctor to purchase low-fat milk and cheese and other items that cost more. This makes it more difficult to stretch her SNAP resources. The caseworker told her there was nothing she could do. Ms. Jeffers didn’t really expect that much would happen as a result of her trip, but at the end of the month she is always hungry—and that made it worth a try.
Ms. Jeffers lives alone in a government-subsidized apartment building for seniors in Takoma Park, Maryland, just over the border from Washington, DC. In March 2013, her rent increased from $192 to $203 per month because of across-the-board government spending cuts that were mandated by sequestration. (See Amelia Kegan’s article about the impact of sequestration and Bread for the World’s response on pages 44-45.) The $11 hike in her rent may not sound like much to many people, but to Ms. Jeffers, who lives on $710 a month in Social Security benefits, it means deeper cuts to her food budget that make the second half of the month more uncomfortable. She braces for the day her SNAP benefits run out by cutting back on portions. By the last week of the month she is eating one meal per day, usually rice with a little butter to
Seniors over 85—like Ms. Lucy Jeffers above—are the fastest growing members of the senior population living in poverty.
Todd Post/Bread for the World
www.bread.org/institute n 2014 Hunger Report 107

add some flavor. The chicken and fish she looks forward to at the beginning of each month are gone, and so are the collard greens and other fresh vegetables that she loves.
“Bad things happen when older people don’t get enough good food,” says Mary Jane Koren, Vice President of the Long-Term Care Quality-Improvement Program at the Com-monwealth Fund.80 They experience more complications from chronic illnesses, leading to longer hospital stays—20 percent of people over the age of 75 have five or more chronic illnesses.81 Malnutrition also increases the risk of falls—one in three seniors experiences a
fall every year, and 30 percent suffer moderate to severe injury.82 “Ensuring that old people have a balanced, nutritionally complete diet, can reverse many of the con-sequences of malnutrition or out-right prevent them,” says Koren.
Seniors need more health care than other age groups, and while Medicare covers much of their health care costs, it doesn’t cover all of them. In fact, Medicare pays only about 60 percent of seniors’ total health costs.83 A 2013 report by the Henry J. Kaiser Family Foundation found that half of all seniors spend at least 16 percent of their income on out-of-pocket health care costs, and the dollar amount rises sharply over time. 84
Out-of-pocket expenses for people 85 and older are 75 percent to 100 percent higher than for someone between ages 65 and 74.85 Seniors older than 85 are the fastest growing segment of the senior population.86 They are also the fastest-growing share of seniors who are newly impoverished.87 Two-thirds of people age 85 and older are women.88
Seniors who receive SNAP are eligible for a medical expense deduction when their SNAP benefits are calculated; they are required to have at least $35 in out-of-pocket medical expenses.89 In Georgia, a senior couple contacted a benefits hotline run by the Georgia Legal Services Program to complain that it was impossible for them to feed themselves on $16 in monthly SNAP benefits. The husband was fighting cancer and the couple was paying thou-sands of dollars in out-of-pocket medical costs for his care. Georgia Legal Services contacted the couple’s caseworker at the Georgia Department of Human Services and forwarded documentation of the couple’s medical expenses. This qualified them for a sharp increase in SNAP benefits, to $355 a month.90 In 2010, the U.S. Department of Agriculture estimated that 55 percent of SNAP-eligible seniors were eligible for the medical expense reduction, yet only 14 percent took advantage of it.91
Seniors have low SNAP participation rates compared to other groups: only about a third of seniors who are eligible participate.92 “As highly as Americans prize independence,
A food distribution site in rural Buckingham
County, Virginia.
Richard Lord
108 Chapter 3 n Bread for the World Institute
CHAPTER 3older Americans fear dependence even more,” says Nancy Wellman, writing in the American Journal of Clinical Nutrition.93 Pride is a factor if they’ve never sought help from the government before. Seniors tend to be proud and also mag-nanimous—they would rather go without themselves than take away from a child or another senior in greater need. But this stance is based on a common misunder-standing about how the program operates94—that giving benefits to one person takes them away from someone else. Instead, because SNAP is an entitlement along with Social Security and Medicare, anyone who qualifies is eligible to receive benefits.
Unlike many people her age, Ms. Jeffers has no qualms about using SNAP. She has no pension or retirement savings even though she worked until she was 75. She was a domestic worker—one of the lowest-paid jobs in the United States.
Between 2001 and 2010, the risk of hunger for seniors increased by 78 percent, according to a report by the Meals on Wheels Research Association, putting the total number of seniors at risk at 8.3 million.95 The Meals on Wheels Association is the largest provider of home-delivered and congregate meals. The seniors it reaches in these programs have an average of anywhere from six to 15 serious health conditions, need between six and 26 different medications, and are either homebound or need help going outside.96 For every dollar invested in Meals on Wheels programs, the government saves $50 in healthcare costs.97
The Older Americans Act (OAA) is the largest funding source of home-delivered and congregate meals. At a congressional hearing on the reauthorization of the OAA, Meals on Wheels CEO and President Ellie Hollander reminded committee members, “OAA Nutri-
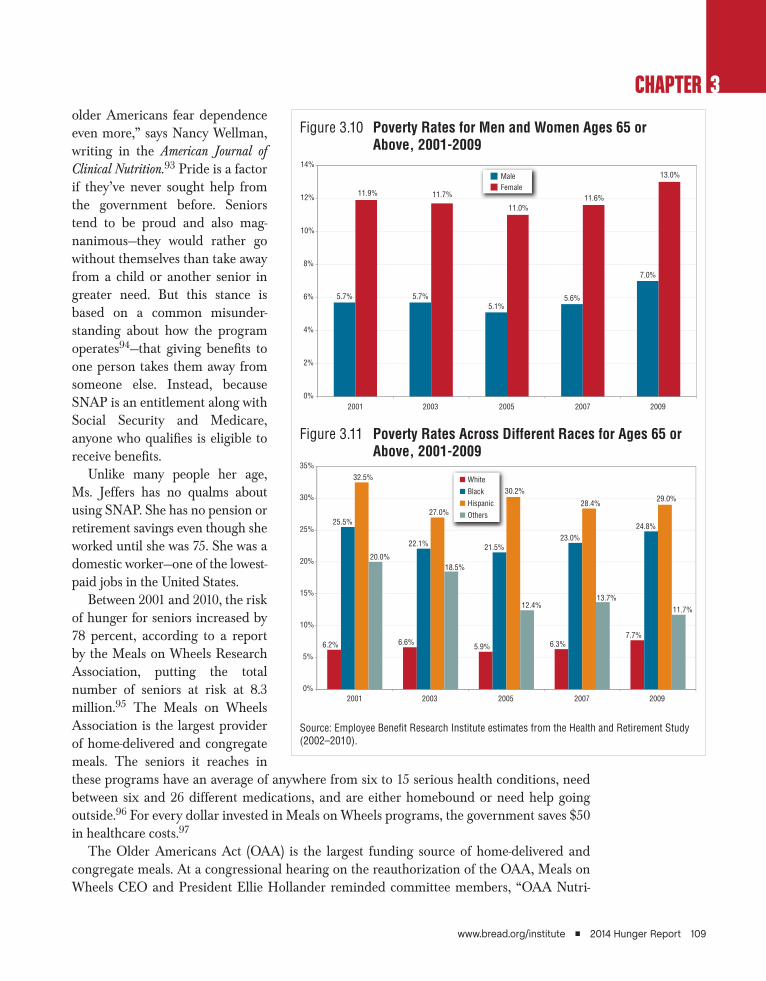
Figure 3.10 Poverty Rates for Men and Women Ages 65 or Above, 2001-2009
Source: Employee Benefit Research Institute estimates from the Health and Retirement Study (2002–2010).
5.7% 5.7%5.1%
5.6%
7.0%
11.9% 11.7%
11.0%11.6%
13.0%
0%
2%
4%
6%
8%
10%
12%
14%
MaleFemale
6.2% 6.6% 5.9% 6.3%7.7%
25.5%
22.1% 21.5%23.0%
24.8%
32.5%
27.0%
30.2%
28.4%29.0%
20.0%18.5%
12.4%13.7%
11.7%
0%
5%
10%
15%
20%
25%
30%
35%
White
Black
Hispanic
Others
2001 2003 2005 2007 2009
2001 2003 2005 2007 2009
Figure 3.11 Poverty Rates Across Different Races for Ages 65 or Above, 2001-2009
www.bread.org/institute n 2014 Hunger Report 109

tion Programs have decreased 18 percent from 1992 to 2012. At the same time, [the eligible population] has increased 34 percent.”98
Seniors and the Safety Net In 2011, Social Security lifted close to 15 million seniors out of poverty, the majority of
them women. Without Social Security, 43.6 percent of all seniors would have been in poverty. With Social Security, however, only 8.7 percent fell below the poverty line in 2011.99
When Social Security was first launched, during the Great Depression, it was much less effective in reducing poverty. At the beginning of the 1960s, one in three seniors was living in poverty. When the War on Poverty was launched in 1964, benefit levels were increased, and in 1972 they were indexed to rise with inflation.100 Within two decades, the senior poverty rate was cut to one in 10. In a 2004 report for the National Bureau of Economic Research, Gary Engelhardt and Jonathan Gruber concluded, “Social Security can explain the
entire decline in poverty among the elderly.”101
The War on Poverty also established the Medicare program, which guarantees health insur-ance to all seniors. Before Medicare was enacted, half of all seniors were uninsured. Rising
healthcare costs threaten Medicare’s sustainability. But this is a problem with the U.S. health care system, not a problem with the Medicare pro-gram. The United States spends at least twice as much on health care as other high-income countries—yet with far worse health outcomes. For-tunately, there has been some good news lately on bringing health care spending under control. According to a May 2013 Congressional Budget Office report, health care costs are projected to grow more slowly than previously expected,102 in part because of efficiencies expected from the implementation of the Affordable Care Act.
Compared to Medicare, Social Security faces a far less murky financial future. There is much less reason to be concerned that there will not be enough working-age people paying taxes to support the increasing numbers of beneficiaries. In 1950, the ratio of workers to retirees was 16.5 to 1; in 2012 it was 2.8 to 1; in 2038, it is projected to be 2.2 to 1.103 But the demographic shift that is the cause of so much concern has already occurred. With no changes to its financing structure, the program
Without Social Security benefits, the senior poverty rate in 2011
would have risen from 8.7 percent to 43.6
percent.
Richard Lord
“Between 2001 and 2010, the risk of hunger for seniors increased by 78 percent, putting the total number of seniors at risk at 8.3 million.”
— Meals on Wheels Research Association
110 Chapter 3 n Bread for the World Institute
CHAPTER 3could pay out the full benefit for the next 20 years and 75 percent after that.104 Maintaining Social Security benefits at their current level indefinitely would require minor changes to the financing structure. Social Security is financed through a payroll tax on earned income. The amount of earnings subject to the tax is $113,700, so the simplest thing to do would be to raise the income threshold that determines how much of one’s income is subject to the tax. Raising
it above the current $113,700 would have no effect on the 95 percent of American workers who earn less than that.105
The alternative often discussed is means-testing the pro-gram, which means cutting benefits to affluent seniors to ensure that benefit levels can be maintained for low-income seniors. The problem here is that there are so few seniors who could accurately be described as affluent. Seniors with incomes of
more than $130,000 per year are just 1.2 percent of all Social Security beneficiaries. Means-testing that started with seniors whose annual income exceeds $100,000 would yield just 2.3 percent of savings to the pro-gram.106 Under this plan, benefit reductions would have to be phased in starting with incomes much lower than $100,000. A sharp cut in benefits that simply kicked in at income of $100,000 would no doubt create some incen-tive to use accounting gimmicks to reduce the amount of a person’s income that is subject to Social Security taxes. At what point, then, should means-testing start? $80,000? $60,000? $50,000? Many people would not consider $50,000 to be affluent. Means-testing the pro-gram would also increase its administrative costs. The beauty of the program currently is that it costs almost nothing to administer.107 Based on the administrative costs incurred in the disability program, where there is means-testing, one would expect to see expenses increase by 1.7 percent of the program’s costs.108
Rather than cutting Social Security, we should be talking about increasing the benefits. In 2012, the average annual Social Security benefit was less than $15,000.109 When the program was created, the Social Security Administration described it as one leg of a three-legged stool.110 The other two legs were defined-benefit pension plans and household savings. Today, the majority of retired people rely on Social Security as their main source of income, and for two in every five seniors, Social Security is the source of more than 80 percent of their retirement income.111 See Figure 3.12.
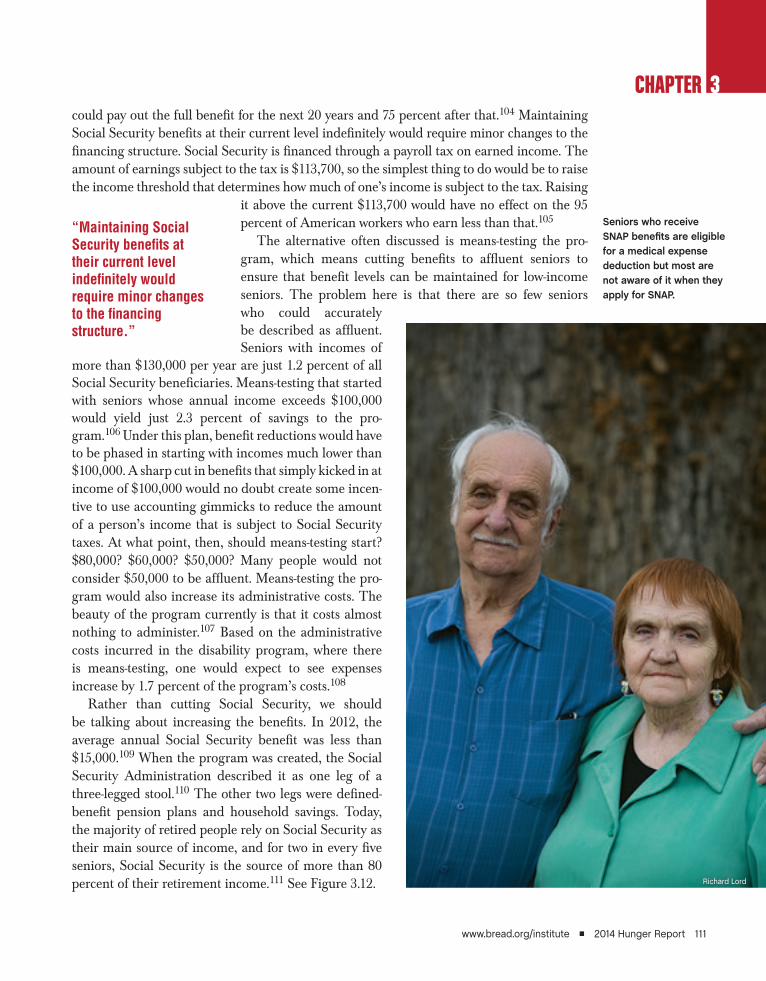
Seniors who receive SNAP benefits are eligible for a medical expense deduction but most are not aware of it when they apply for SNAP.
Richard Lord
“Maintaining Social Security benefits at their current level indefinitely would require minor changes to the financing structure.”
www.bread.org/institute n 2014 Hunger Report 111

The Kids Will Be All RightOne of the major lines of argument of people who believe we should shrink the federal
safety net is generational unfairness.112 According to this line of thinking, seniors use up so much of the safety net that there’s nothing left for children. However, the fact is that the reason the United States has such high rates of child poverty is not because it is overly generous with benefits for seniors. In fact, compared to other high-income countries, the United States is much less generous in its spending per capita on safety net programs for seniors.113 On the other hand, countries with low senior poverty rates also tend to have low child poverty rates.
Political and media frenzy aside, there is no reason for younger workers to feel cheated when they pay Social Security taxes so that retirees have a modicum of economic security. As long as productivity growth continues, young workers will be able to enjoy higher living standards while also resting assured that when they retire, Social Security will be able to provide benefits to them as it did for earlier generations of retired Americans.
Productivity growth, as mentioned in earlier chapters, is the key to achieving high living standards for everyone. When productivity increases, it means that workers are producing more value over time.114 If workers get their share of the gains from productivity growth—a big “if”—they will be doing better economically as time goes on. Since 1947, productivity growth has averaged 2.2 percent annually. Between 1973 and 1995, growth slowed to 1.3 per-cent on average, but after 1995 productivity picked up again, averaging 2.3 percent through the present.115
Figure 3.12 Sources of Income for Americans Aged 65+, by Income Quintile
Source: U.S. Social Security Administration, Income of the Population 55 or Older, 2010
84.3 83.3
65.7
43.5
17.3
0%
10%
20%
30%
40%
50%
60%
70%
80%
90%
100%
Other
Cash public assistance
Income from assets
Private pensions orannuities
Government employeepensions
Earnings
Social Security
Bottom Second Third Fourth Top
112 Chapter 3 n Bread for the World Institute

CHAPTER 3If productivity grew at a 2.3 percent annual rate over the next 25 years, and workers got
their fair share of the growth, wages (after being adjusted for inflation) would be on average more than 75 percent higher than they are today. In 2038, a typical worker would be able to buy 75 percent more goods and services than a typical worker today.116 If productivity growth was, instead, just 1.3 percent annually for the next 25 years, a typical worker would still have a wage that is 38 percent higher than the average wage today. “In short,” says Dean Baker of the Center for Economic and Policy Research, “even in a worst-case sce-nario, where productivity falls back to the slowest pace we have seen in the last 70 years, workers will on average be much wealthier than workers are today.”117
Trying to predict how productive the U.S. economy will be over the next 25 or 50 years is, at best, guessing. But unless we believe technological advancement has reached a limit, then productivity growth over the long run is virtually guaranteed. Suffice it to say: whether productivity growth is closer to 2.3 percent or 1.3 percent, wage growth will be more than enough to compensate for the effect on workers’ living standards of a growing burden of retirees.
This discussion about produc-tivity growth at the end of a sec-tion about ending senior hunger is not a digression. It is, in fact, central to understanding why we can end senior hunger and how we can do it at a reasonable cost. Productivity growth makes it pos-sible to easily finance higher living standards for retired people.
The only problem with this opti-mistic image of the future is that for the last three decades, workers have not been sharing equitably in the gains from productivity growth. As we discussed in Chap-ters 1 and 2, the vast majority of the gains from growth have gone to those at the top of the income distribution, while the wages of most workers have eroded or barely kept pace with inflation. Whether or not we restore the link between productivity growth and wage growth will determine the living standards of our children and grandchildren.
The living standards of our children and grandchildren will depend mostly on restoring the link between productivity growth and wage growth.
Richard Lord
www.bread.org/institute n 2014 Hunger Report 113

FEDERAL POLICY IDEAS TO ENDCHILDHOOD HUNGER
Duke Storen, Share Our Strength
Child Nutrition Reauthorization offers a rare opportunity for bi-partisan reform to make it easier for communities to end childhood hunger. The programs that provide healthy food to hungry children already operate through public-private partnerships across the country. By building on successful state practices, eliminating red tape and increasing program efficiency, more churches, schools, and other community organizations will be able to connect additional children to healthy meals. The U.S. Department of Agriculture (USDA) has worked to streamline programs like summer meals and afterschool meals, but reauthorization is an opportunity to take a step back and make sure the infrastructure that provides healthy foods for low-income children meets today’s demand as efficiently and effectively as possible.
For example, a church that feeds children meals afterschool and during the summer must negotiate two different programs—the Summer Food Service Program (SFSP) and the Child and Adult Care Food Program (CACFP). These programs have different requirements, meal patterns, reimbursement rates, and are often housed under different state agencies. These complications
make it difficult for many churches to operate these programs despite the desire to offer them and the need in the community.
Besides eliminating red tape, nutrition programs also need greater flexibility to respond to local circumstances and demands. For example, the current programs feeding children afterschool and in the summer require kids to come to a site instead of bringing food to them. Eighty percent of children spend their time during summer at
home and 86 percent spend their time after school at home. In order to expand existing summer and afterschool programs, we need to meet children where they are during out-of-school times.
Recently, USDA undertook a demonstration project that both eliminated red tape and increased flexibility related to summertime meals for kids. Many kids who rely on school meals go hungry in the summer months when they lose access to those meals. Low-income families also say their grocery bills are, on average, about $300 higher every month when kids are out of school. Instead of trying to meet unmet demand by creating new programs—i.e. summer meals sites—families with children who received a free school lunch during the school year had an additional monetary benefit placed on their SNAP or WIC card. This allowed the family to have enough resources to feed their children at home during summer months. The project resulted in more children receiving the food they need during summer months, illustrating the power of increased flexibility and paperwork reduction.
As we approach Child Nutrition Reauthorization, we have an opportunity to ask the following questions and develop policy proposals based on discussions with participants, practitioners, and policymakers.
“No child should grow up hungry in America, but one in five children struggles with hunger.”
114 Chapter 3 n Bread for the World Institute

CHAPTER 3CHAPTER 3
How can we eliminate red tape in the child nutrition programs? Can we reduce the number of child nutrition programs to one or two (in-school and out-of-school) operated by a single agency in each state? How do we ensure that children only have to qualify once and sponsors only have one set of administrative, meal, and reporting requirements?
Should the requirement for children to eat meals together on site (the congre-gate feeding requirement) be waived? The ideal location to serve summer meals to low-income children may be in a safe, supervised enrichment program, but the current infrastructure and barriers limit our ability to reach kids this way. States should have the option to implement alternative program models such as the summer EBT demonstration, home-delivered meals, and backpack programs. A USDA pilot testing meal delivery showed that adding non-congregate options in rural areas added to the number of children receiving meals without reducing participation at nearby congregate programs.
How do we build on state efforts to expand school breakfast? States including Maryland, New Mexico, and Colorado have enacted policies to institutionalize innovative breakfast models. These policies require schools with a large percentage of students who qualify for free or reduced-price meals to serve breakfast “after the bell.” National policy could build on these efforts by requiring breakfast after the bell in low-income or possibly all schools and/or by providing financial incentives for universal feeding.
Each child deserves the opportunity to live in dignity and thrive. Let’s work together to make sensible policy changes that invest in our children and our nation’s future. We can make No Kid Hungry a reality in America. To learn more, visit NoKidHungry.org.
Duke Storen is the senior director for partner impact & advocacy with Share Our Strength, whose No Kid Hungry campaign is working with churches, private citizens, public officials, nonprofits, business leaders and others to end childhood hunger by connecting kids to the national nutrition programs.
School lunch staff and students enjoy the new school lunch menu created to meet the new standards at the Yorkshire Elementary School in Manassas, VA.
USDA
www.bread.org/institute n 2014 Hunger Report 115