Embed Size (px)
Citation preview
BACKGROUND PAPER FOR THE
WORLD DEVELOPMENT REPORT 2013
Jobs and Welfare in Mozambique
Sam Jones
University of Copenhagen
Finn Tarp
University of Copenhagen & UNU-WIDER
Country case study for the
2013 World Development Report

United Nations University
World Institute for Development Economics Research(UNU-WIDER)
Jobs and welfare in Mozambique:Country case study for the 2013 World Development Report
15 August 2012
Sam Jones* & Finn Tarp**
* University of Copenhagen** University of Copenhagen & UNU-WIDER

Preface
The 2013 World Development Report (WDR13), to be launched in October 2012, will focus onjobs and development. The WDR13 will articulate a framework which places jobs at the centerof development, considers the dynamic links between growth strategies and jobs, and providesanalytical tools to think about policies and programs from a jobs perspective. The frameworkcombines insights from poverty work, studies on job creation and destruction, and the socialdevelopment literature to show that jobs are transformational across three important dimensionsof development: living standards, productivity and social cohesion. It will in particular makethe case that these three dimensions play out differently depending on a country’s context andpriorities, implying a diversity of jobs agendas across the developing world.
An integral part of the preparation of the WDR13 is the preparation of in-depth case studiesanalyzing the nature of the jobs challenges across a range of country situations. The typologyconsidered includes: agrarian economies, conflict-affected countries, resource-rich countries,urbanizing countries, societies with high youth unemployment, formalizing countries, and agingsocieties. Mozambique was selected by the World Bank team to illustrate the situation ofmainly agrarian economies, where progress in poverty reduction is unlikely to happen withoutsubstantial gains in agricultural productivity (and especially in smallholder farming) but whererapid growth and integration in the world economy will almost certainly involve urban jobs (andespecially wage employment). Such tensions imply that the following four questions are critical:
• What are the jobs that will contribute the most to poverty reduction, productivity growthand social cohesion?
• Are there trade-offs between these transformations and if so how can they be addressed?
• What are the obstacles to the creation of more “good jobs” from a development perspective?
• Which policies could contribute to the removal of those obstacles?
In January of 2012, the Director of the WDR13 Martin Rama approached UNU-WIDERand requested that UNU-WIDER lead the preparation of the Mozambique case study. Wewere delighted to be able to respond positively, and it is a great pleasure to present herewiththe Mozambique case study, which was prepared within the framework of the Research andCommunication on Foreign Aid (ReCom) programme supported financially by Danida and Sida.
Principal thanks for collaboration in preparing this study go to Finorio Castigo, Fausto Mafam-bissa, Noemia Nhatsave and David Rosenfeld of the Direcção Nacional de Estudos e Análisede Políticas (DNEAP), Ministério de Planificação e Desenvolvimento (MPD), República de
i

Moçambique as well as Søren Schou (University of Copenhagen) for excellent research assistance.Sincere thanks also go to Channing Arndt and to the World Bank’s WDR13 team directedby Martin Rama for helpful comments on earlier versions of this study, including commentsprepared by Kei Otsuka.
More broadly, we highly appreciate the support and time of António Cruz (Director Nacional,DNEAP/MPD) as well as the constructive inputs of a wide range of national government officials,representatives from the private and NGO sectors and employees of international donor agenciesconsulted in Mozambique as background to this study.
The usual caveats apply, so all opinions and any remaining errors of fact or interpretation remainours.
Sam Jones and Finn Tarp
15 August 2012
ii

Contents
1 Introduction 1
2 Definitions and data 4
2.1 Labour market concepts . . . . . . . . . . . . . . . . . . . . . . . . . . . . . . . . 4
2.2 Sources of data . . . . . . . . . . . . . . . . . . . . . . . . . . . . . . . . . . . . . 7
3 Context 9
4 Stylized jobs facts 13
Fact 1 . . . . . . . . . . . . . . . . . . . . . . . . . . . . . . . . . . . . . . . . . . . . . 13
Fact 2 . . . . . . . . . . . . . . . . . . . . . . . . . . . . . . . . . . . . . . . . . . . . . 16
Fact 3 . . . . . . . . . . . . . . . . . . . . . . . . . . . . . . . . . . . . . . . . . . . . . 18
Fact 4 . . . . . . . . . . . . . . . . . . . . . . . . . . . . . . . . . . . . . . . . . . . . . 20
Fact 5 . . . . . . . . . . . . . . . . . . . . . . . . . . . . . . . . . . . . . . . . . . . . . 22
Fact 6 . . . . . . . . . . . . . . . . . . . . . . . . . . . . . . . . . . . . . . . . . . . . . 25
Fact 7 . . . . . . . . . . . . . . . . . . . . . . . . . . . . . . . . . . . . . . . . . . . . . 27
Fact 8 . . . . . . . . . . . . . . . . . . . . . . . . . . . . . . . . . . . . . . . . . . . . . 29
Fact 9 . . . . . . . . . . . . . . . . . . . . . . . . . . . . . . . . . . . . . . . . . . . . . 33
Fact 10 . . . . . . . . . . . . . . . . . . . . . . . . . . . . . . . . . . . . . . . . . . . . 35
5 Methodology 38
5.1 Theoretical framework . . . . . . . . . . . . . . . . . . . . . . . . . . . . . . . . 39
5.2 Implications . . . . . . . . . . . . . . . . . . . . . . . . . . . . . . . . . . . . . . 41
5.3 Empirical strategy . . . . . . . . . . . . . . . . . . . . . . . . . . . . . . . . . . . 43
iii

6 Results 48
6.1 A typology of jobs portfolios . . . . . . . . . . . . . . . . . . . . . . . . . . . . . 48
6.2 Selection into jobs portfolios . . . . . . . . . . . . . . . . . . . . . . . . . . . . . 52
6.3 Conditional determinants of welfare . . . . . . . . . . . . . . . . . . . . . . . . . 56
7 Jobs simulations 62
7.1 Methodology . . . . . . . . . . . . . . . . . . . . . . . . . . . . . . . . . . . . . . 62
7.2 Results . . . . . . . . . . . . . . . . . . . . . . . . . . . . . . . . . . . . . . . . . 63
8 Policy implications 66
8.1 Challenges and trade-offs . . . . . . . . . . . . . . . . . . . . . . . . . . . . . . . 66
8.2 Jobs priorities . . . . . . . . . . . . . . . . . . . . . . . . . . . . . . . . . . . . . 69
8.2.1 Getting agriculture going . . . . . . . . . . . . . . . . . . . . . . . . . . . 70
8.2.2 Enhancing productive informality . . . . . . . . . . . . . . . . . . . . . . . 72
8.2.3 Stimulating labour-intensive exports . . . . . . . . . . . . . . . . . . . . . 73
8.3 Risks and obstacles . . . . . . . . . . . . . . . . . . . . . . . . . . . . . . . . . . 74
9 Conclusions 76
Bibliography 81
iv

List of Tables
1 Summary of labour market concepts . . . . . . . . . . . . . . . . . . . . . . . . . 5
2 Estimates of poverty evolution over time (% population) . . . . . . . . . . . . . . 10
3 Demographic profile of Mozambique, population in ’000s . . . . . . . . . . . . . . 14
4 Economic activity rates, by location and gender . . . . . . . . . . . . . . . . . . . 16
5 Distribution of work force by employment status . . . . . . . . . . . . . . . . . . 19
6 Distribution of work force by years of education . . . . . . . . . . . . . . . . . . . 23
7 Allocation of workers, by sector (%) . . . . . . . . . . . . . . . . . . . . . . . . . 26
8 Crop production estimates . . . . . . . . . . . . . . . . . . . . . . . . . . . . . . . 31
9 Agricultural technology adoption indicators (% farms) . . . . . . . . . . . . . . . 31
10 Comparative manufacturing performance metrics (2008) . . . . . . . . . . . . . . 32
11 Enumeration of household jobs portfolios, based on four activity types . . . . . . 49
12 Prevalence of household jobs portfolios, by survey and location . . . . . . . . . . 51
13 Goodness of fit estimates for alternative utility function specifications (models),by portfolio . . . . . . . . . . . . . . . . . . . . . . . . . . . . . . . . . . . . . . . 53
14 Summary of multinomial logit estimates, by portfolio . . . . . . . . . . . . . . . . 54
15 Selection-bias corrected analysis of welfare determinants, by jobs portfolio . . . . 58
16 Predicted household consumption poverty headcount rates under alternativelabour market scenarios . . . . . . . . . . . . . . . . . . . . . . . . . . . . . . . . 65
v

List of Figures
1 GDP in billions of real US$, by major sector, 1991-2009 . . . . . . . . . . . . . . 11
2 Structure of aggregate value added (in %), by major sector, 1991-2009 . . . . . . 11
3 Yields of staple cereal crops (maize), kg/ha . . . . . . . . . . . . . . . . . . . . . 12
4 Projected demographic trends in Mozambique, for adults (25-64) and youth (15-24)cohorts only . . . . . . . . . . . . . . . . . . . . . . . . . . . . . . . . . . . . . . . 15
5 Allocation of working age population by activity . . . . . . . . . . . . . . . . . . 17
6 Distribution of workers, by type of employment . . . . . . . . . . . . . . . . . . . 21
7 Mean years of education among workers, by broad economic sector . . . . . . . . 24
8 Distribution of workers, by broad economic sector . . . . . . . . . . . . . . . . . . 26
9 Spatial distribution of workers, by broad economic sector and geographical zone . 28
10 Estimates of average labour productivity, by economic sector . . . . . . . . . . . 30
11 Categorization of households (in %) by number of distinct sources of income . . . 34
12 Proportion of adults, by age, identifying jobs as a problem . . . . . . . . . . . . . 36
13 Share of rural/urban age cohorts trusting the President . . . . . . . . . . . . . . 36
14 Share of population subgroups, classified by income source, trusting the President 37
15 Estimated cumulative distribution functions of (per capita) welfare ratio, by jobsportfolio . . . . . . . . . . . . . . . . . . . . . . . . . . . . . . . . . . . . . . . . . 51
16 Estimated incremental returns to education, by jobs portfolio . . . . . . . . . . . 61
17 Demographic simulations of formal sector growth . . . . . . . . . . . . . . . . . . 67
vi

1 Introduction
This study examines the nature and functioning of the labour market in Mozambique. Thereis little disagreement that the country has achieved remarkable success over recent decades,particularly when viewed at the aggregate level. Over nearly 20 years, Mozambique has boastedone of the world’s highest rates of GDP growth and has successfully moved from post-conflictstabilization and reconstruction into a more mature developmental phase. Future prospects forthe economy are also strong due to investments and new discoveries in the natural resources sector(principally coking coal, thermal coal and natural gas). These will potentially turn Mozambiqueinto a significant global player in these commodities over the next couple of decades.
However, the country’s development record in not unblemished. In particular, there is growingevidence that macroeconomic success has not delivered unambiguous socio-economic benefits atthe household level. Mozambique remains one of the poorest countries in the world, ranked onthe UNDP’s 2011 Human Development Index at 184 out of 187 countries, below so-called failedstates such as Haiti (158), Afghanistan (172) and the Central African Republic (179). It is alsoincreasingly recognized that Mozambique’s growth has become less pro-poor over time, meaningthat consumption poverty rates have remained persistently high (DNEAP, 2010; Arndt et al.,2012). This is especially true in the rural sector, suggesting a widening urban-rural gap andupward pressure on income inequality. Social tensions have also been rising, spilling over intoisolated incidences of unrest, and reflecting concerns over the high cost of living in urban areasas well as a scarcity of good quality employment opportunities.
It is precisely this tension between growth and inequality that motivates a closer examination oftrends in Mozambique’s labour market. A key determinant of the extent to which macroeconomicgrowth produces gains in social welfare is the quality of jobs that an economy generates. Whereproductivity is increased by reallocating workers from lower to higher productivity activities, byadopting new technologies and practices in laggard sectors, or by creating new jobs in higherproductivity sectors (and thus absorbing under-employed labour), we should expect growth tohave a strong positive effect on individual and social welfare.
In light of the above, this study seeks to shed light on four main questions:
• What has happened to jobs (the labour market) in Mozambique over the past 15 years?
• What has been the nature of the link between jobs and (social) welfare?
• Where should Mozambican policymakers focus to create more good jobs?
• What are the risks to achieving these policy objectives?
1

The rest of the study is structured as follows: Section 2 addresses some preliminary issues oflabour market definitions and the sources of evidence used to analyse the Mozambican labourmarket. Household surveys (micro-data) are the most reliable and comprehensive source andone contribution of this study is to place a series of four nationally representative householdsurveys on a consistent basis for the purpose of deriving coherent labour market information.Section 3 goes on to introduce the case of Mozambique with a brief review of recent economicperformance. This sets the scene for Section 4, which describes broad trends in the Mozambicanlabour market over the period 1996-2009. We do so by presenting 10 stylized facts. Thesereveal that rapid macroeconomic growth has not been accompanied by transformation of thelabour market. Rather, it remains dominated by (low productivity) rural agricultural workers.Put differently, the economy has failed to generate sufficient high quality jobs that effectivelytranslate macroeconomic growth into welfare gains.
The remaining sections of the study investigate the connection between jobs and welfare moreformally. The fundamental analytical question is whether the limited transformation in jobs ismerely symptomatic of challenges in other domains (such as insufficient capital accumulation),or rather is a core reason for the persistence of poverty. This might be the case if labour marketimperfections led to very severe factor mis-allocations. To orient the analysis, Section 5 setsout a simple theoretical framework to understand how labour market processes might conditionobserved welfare outcomes. Where labour market imperfections, such as rationing are at play,households can be constrained to pool all labour into single activities, despite the fact they(hypothetically) could achieve higher utility from some alternative allocation. This provides adirect link to models of labour market sorting (or selection), configured at the household level,and suggests that where labour market imperfections are at play there may be large differencesin labour’s marginal product between labour market segments.
The framework motivates three specific empirical questions which are taken to the data in Section6. We classify households into discrete labour market segments (described as ‘jobs portfolios’)based on the type of labour activity undertaken. In turn we show these portfolios follow a clear(aggregate) welfare ranking with exclusively agricultural jobs being first-order dominated by alljobs. We then model the determinants of entry into these portfolios and the determinants ofhousehold consumption (our welfare metric), conditional on these prior labour market selectionprocesses. The results indicate that agriculture is a residual or default choice, driven by very lowhousehold endowments and an absence of outside opportunities (demand-side effects). There arelarge differences in returns to human capital between labour market segments, but also evidenceof very low returns to small numbers of years of schooling (sub-primary) across most activities.
Section 7 brings the analysis closer to policy, and simulates a range of stylized jobs scenarios.These show that the likely welfare benefits associated with removing labour market imperfections,
2

which appear to originate on the demand-side, are material but not transformational. Theargument is that factor endowments are crucial to observed welfare differences and unskilledlabour yields low returns across the economy. Consequently, raising returns in agriculture isa priority response, particularly given the volume of employment it represents as well as therapid population growth that is adding more than 300,000 potential workers to the Mozambicanworkforce each year. Section 8 focusses explicitly on the pro-jobs policy challenges and objectivesthat come out of this analysis. Section 9 concludes.
3

2 Definitions and data
2.1 Labour market concepts
The sheer number and variety of concepts used to define the labour market and measure itsconstituent objects can be bewildering. This is particularly the case in developing countries whereformal wage labour tends to be the exception, not the rule. Thus, before proceeding to the caseof Mozambique, it is helpful to clarify some of the main concepts that will be employed in thisstudy. At a broad level, many of these concepts are well-established and standardized definitionscan be found elsewhere.1 Nonetheless, at the country level, specific aspects of individual conceptsfrequently differ, and it is therefore important to be aware of these nuances so as to interpretresults correctly.
An appropriate starting point in any discussion of the labour market is a definition of the activelabour force or economically active population. This is a broad concept, which is somewhateasier to delimit with reference to what is excluded rather than specifically included. A firstexclusion from the active labour force is members of the population that are not of workingage. The working age population is defined here as all resident members of the population aged15-64 (inclusive). These age limits are made for practical purposes, and should not be seenas overlooking the existence of child labour or the contribution of the elderly to production.Within the working age population, individuals who are neither engaged in nor seeking workare also excluded from the active labour force. What constitutes ‘work’ is itself not necessarilystraightforward; however, a standard definition refers to labour supplied for the production ofthose goods and services recognised in the System of National Accounts.2 Again this is wide-ranging, but a key exclusion is domestic activities such as childcare undertaken by (extended)family members. Therefore, working-age individuals fully and exclusively dedicated to suchdomestic activities fall outside the definition of economically active. Other exclusions from theactive labour force are the long-term ill, the handicapped, full-time students and the ‘discouraged’,which refers to individuals that have ceased to actively seek employment opportunities and arepresently inactive.
Table 1 provides a summary of the interrelations between some key labour market concepts. Itindicates that the sub-group of labour market ‘insiders’ (the economically active) encompassesa wide variety of types of employment, with wage employment being one of many. Both self-employment outside the household as well as unpaid labour in productive household activities1The International Labour Organization (ILO) provides a wealth of information. For example, the definitionsemployed in its Key Indicators of the Labour Market (KILM) series are found here: kilm.ilo.org/manuscript/.
2For example, see the definition of economically active used in ILO’s LABORSTA database: laborsta.ilo.org/applv8/data/c1e.html.
4

Table 1: Summary of labour market concepts
Labour force position Employment type Employment status
In the labour force(either economically active or
seeking work)
Wage employedEmployedSelf-employed
Family / unpaid worker
UnemployedNEETOut of the labour force
(economically inactive and notseeking work)
DiscouragedInactive / housework
In education StudentNotes: NEET refers to “Not in Employment, Education or Training”.Source: adapted from African Development Bank (2012).
such as agriculture, petty commerce or artisanship are included. All of these types of employmentcome under the general rubric of a ‘job’, used in this expansive sense hereafter. The table alsosuggests that a strict definition of unemployment, referring to individuals who are out of workbut actively seeking employment, may represent only a narrow subgroup of the working agepopulation. Broader definitions of unemployment have been suggested, which can be morerelevant where employment is demand-constrained leading to large numbers of discouraged orinvoluntarily inactive individuals. One of these, shown in the table, is the NEET concept – Notin Employment, Education, or Training (see African Development Bank, 2012).
Aside from defining unemployment, for the present purposes it is arguably more useful to focuson differences in the quality of jobs. As Teal (2011); Fields (2011) inter alia note, in low incomecountries many people are just too poor not to engage in some form of work. Metrics of jobquality can refer to myriad work characteristics, including the degree of contractual vulnerability,the number of hours worked, the nature and regularity of payments to labour services, as wellas the real returns to these services. These characteristics are not easy to observe, and as aresult tend not to be fully captured either by aggregate statistics or by detailed labour forcesurveys (in developing countries). Thus, without claiming to provide a robust definition of highversus low quality jobs, two simple quality-type distinctions are used herein. The first is betweenfull- and under-employment, where the latter is defined in accordance with Mozambican officialstatistics, as working less than 40 hours per week. The second is between waged and unwagedjobs, where the former is generally taken to be of higher quality and located predominantly inthe formal sector, yielding a greater degree of job security and better attending conditions thanfound elsewhere. Thus, what is labelled the informal sector is defined to be synonymous withself-employed and household jobs. This mapping from waged (unwaged, under-employed) tohigher (lower) quality work is not watertight, and we appreciate that insecure, irregular and
5

informal forms of wage labour are found. However, as we will see for Mozambique (Section 6.1)and in keeping with evidence from other low income African countries (e.g., African DevelopmentBank, 2012), access to waged work is strongly associated with higher welfare outcomes comparedto other jobs on average.
An alternate perspective on job quality shifts attention from the private benefits of different jobs totheir wider, social contribution. This view, developed in the forthcoming 2013 World DevelopmentReport, identifies three distinct domains in which jobs can yield positive externalities. Theseare: raising living standards for the poorest (reducing rates of poverty); raising productivity(particularly through job creation, destruction and reallocation, within and between sectors);and supporting collective values and beliefs, thereby contributing to social cohesion. A keyconcept is that of ‘good jobs’ which can be are defined as those which support increases inhousehold expenditures over time, contribute to faster productivity growth at the aggregatelevel, or do more to foster social cohesion, in a particular country at a specific stage in itsdevelopment process. That is, in addition to providing private benefits, good jobs can make apositive long-term social contribution and underpin an inclusive process of transformation anddevelopment. Admittedly, it may be somewhat easier to identify such good jobs in hindsight,as opposed to ex ante. Nonetheless the distinction between good and bad jobs provides aconstructive framework to guide labour market analysis and inform policy debates.
Three final concepts used hereafter merit brief clarification. First, distinctions between differenttypes of informal jobs are informative.3 Particularly useful is the distinction between agriculturaland non-agricultural activities which, in turn, leads us to distinguish ‘non-farm householdenterprises’ – defined as the smallest scale of informal non-agricultural enterprise, typicallyoperating within the confines of the household and employing one or more family members.4
Scholarship has shown that such enterprises can constitute a crucial source of dynamism in bothrural and urban areas of low income Africa (e.g., Cook, 1999; Gulyani and Talukdar, 2010; Foxand Pimhidzai, 2011), a perspective which is endorsed herein (see Section 6).
Second is the simple distinction between youth and adult members of the labour force. Followingcommon practice, the former are represented by the 15-24 cohort, while adults are representedby the 25-64 cohort. Third, we also employ a standard distinction between aggregate economicsectors according to primary, secondary and tertiary activities. The former essentially refersto activities producing untransformed, primary goods such as in agriculture, fishing, forestryand mining. Secondary sectors refer to value-added transformative activities, principally inmanufacturing and construction. The tertiary sector thus refers to a wide range of service-relatedactivities, including transport and communications, commerce and the vast majority of public3For instance, see Fox and Kweka (2011) for a presentation and discussion of concepts used to describe theinformal sector.
4Such enterprises also have been called (non-farm) nano- or micro-enterprises in the literature.
6

sector jobs.
2.2 Sources of data
The above concepts gain traction when consistently applied to reliable information about thelabour force. This is a challenge in Mozambique (as elsewhere) due to data limitations. Asnoted in the Introduction (also see below Section 4, Stylized Fact 4), the size of the informalsector in both rural and urban areas renders official aggregate labour force statistics of limitedvalue. Instead, it is necessary to assemble the chosen measures directly from micro-data. Surveydatasets of this kind are available in Mozambique covering the period 1996 to 2009, but with gaps.Notably, however, no comprehensive or official work has been undertaken to derive consistentlabour force information from these surveys over the full post-conflict period.5 Thus, a firstcontribution of this study is to establish a consistent and detailed set of labour market data onMozambique, from which key characteristics and trends can be determined.
With respect to the specific sources of micro-data, we rely primarily on the set of three nationallyrepresentative household surveys of the living standards variety. These are the two ‘Inquéritosaos Agregados Familiares’ (IAFs) of 1996/97 and 2002/03, and the ‘Inquérito ao OrçamentoFamiliar’ (IOF) of 2008/09. The data collected under these three surveys share some commonfeatures. They include detailed household-level information, basic information about the labourservices supplied by each member (e.g., employment status, sector of activity, type of workperformed), the main sources of income for the household, and detailed information abouthousehold expenses. Importantly, these surveys have also constituted the information basefor Mozambique’s official national poverty assessments (DNEAP, 2010) and thus enable a linkto be made between jobs and welfare outcomes at the micro-level. In addition, we use the(one-off) dedicated labour force survey of 2004/05 (Inquérito à Força de Trabalho, IFTRAB)which collected more detailed information on labour force activity at the household level, butdid not include complementary information on household expenses from which consumptionpoverty measures could be built. Despite the latter drawback, use of the IFTRAB represents avaluable cross-check on the labour market information derived from the living standards surveys,and also fills an important temporal gap in the overall micro-data series, thereby allowing us toidentify trends with greater confidence.
Use of these surveys to derive labour market information is not without its challenges. Principalamong these is a variety of discrepancies in questionnaire design (and subsequent coding), whichmakes it rather painstaking to derive consistent measures over time. In particular, the treatment5This is not to say that no labour force analysis has been undertaken in Mozambique. Examples include Fox et al.(2005); Brück and van den Broeck (2006). However, none of these studies provide the same coverage as here,either in terms of the number of household surveys or the extent of labour market information derived.
7

of family domestic work is problematic, in part because there is frequent straddling betweendomestic and productive work, especially where the household has access to agricultural assets.Suffice to say that whilst considerable effort has been made to place the surveys on a consistentfooting, imperfections remain which implies non-sample error may be material in some instances.The conceptual challenge of how to deal with individuals that straddle different labour marketpositions is not exclusive to part-time domestic workers. Many individuals in the surveys reporthaving more than one job. However, on grounds of practicality and simplicity, we only reportresults for the stated principal occupation of each working-age person. Despite these caveats,the surveys remain a rich resource.
In addition to the above, two very different sources of data are also used in the analysis. Theseserve to complement the assembled micro-data. The first is official annual national accountsstatistics, including sector-specific measures of value added (real GDP at factor cost). These canbe mapped to the derived labour force statistics, yielding aggregate measures of labour forceproductivity by sector over time (see Section 4, Stylized Fact 8). Such evidence on productivityis further corroborated by appealing to existing secondary sources, specifically metrics takenfrom analyses of (formal) enterprise and agricultural income surveys in Mozambique. Second,we use the series of AfroBarometer opinion surveys (conducted in Mozambique in 2002, 2005and 2008) to shed light on the nature of links between jobs and social cohesion (see Section 4,Stylized Fact 10).6 In sum, therefore, a wide range of primary and secondary evidence will bedrawn upon to explore the job environment in Mozambique and how it has changed during thepost-conflict period.
6For an overview of the AfroBarometer surveys see Mattes (2009); also reference material can be found atwww.afrobarometer.org.
8

3 Context
The introduction noted a tension in Mozambique’s recent economic performance betweenaggregate success (stabilization and growth) and slowing poverty reduction. The former successstory has been reviewed in detailed elsewhere (e.g., Fox et al., 2005; Jones, 2006; Arndt et al.,2007; Clement and Peiris, 2008). It can be substantiated by recourse to a set of simple graphics,based on official statistics. Figures 1 and 2 show the evolution of Mozambique’s GDP over timesince the beginning of the 1990s which coincided with the end of a prolonged period of conflict(a cease fire was agreed in 1992) and the first multi-party elections (held in 1994). Over thisperiod real GDP growth averaged over 7%, which places Mozambique among the best performingcountries in the world from the perspective of this single metric.
This success must be placed in context. On the one hand, Mozambique started its recovery froman incredibly low base. Based on any metric of development you may wish, conditions in theearly 1990s were easily amongst the most challenging in the world. Thus, despite sustainedaggregate progress, poverty remains widespread. This is shown in Table 2, which estimatespopulation-wide consumption and asset poverty headcount rates from the series of householdsurveys described in Section 2. Two points can be highlighted. In 1996/97, slightly less than than90% the population could be unambiguously classified as poor (being either asset or consumptionpoor). The most recent household survey puts the same figure at just above 80%, meaning that4 out of every 5 members of the population remain poor by some metric. Second, looking atthe share of the population who are poor on both metrics (the final row of the table), whilethis fell from 54% to 43% between 1996/97 and 2002/03, progress has slowed since then suchthat the difference between 2002/03 and 2008/09 is statistically negligible. As discussed atlength in DNEAP (2010) (also Arndt et al., 2012, among others), a candidate explanationfor this is stagnation of the smallholder agricultural sector, where most Mozambicans earn aliving (see below). To give an example of the range of evidence that supports this conclusion,Figure 3 compares Mozambique’s annual average maize yields (a primary staple) to that of othersub-Saharan African countries. It shows that Mozambican yields have been the lowest of theselected countries and have been without any discernible upward trend. As elaborated in latersections of this study, this represents a (if not the) major concern.
Looking to the future, it should be noted that Mozambique is presently entering a very new phasein its developmental trajectory. In large measure, initial post-conflict problems of reconstructionand stabilization have been overcome. The priority now is to ensure that economic growthnot only remains robust bust also is more inclusive. Over at least the short term the formeris not doubted. Multi-billion dollar investments in the natural resources sector have recentlytaken place (by multinationals), of which some will go to support infrastructure development (toexport coal). Discoveries of large resources of natural gas also threaten to place Mozambique as
9

one of the top five global producers of liquefied natural gas within a decade. Thus, the principalpolicy challenge is to avoid a resource curse and ensure the benefits of this investment extend tonon-extractive sectors and, thereby, ‘good jobs’ are created throughout the economy.
With this context in mind, we can now examine the present jobs landscape.
Table 2: Estimates of poverty evolution over time (% population)
1996/97 2002/03 2008/09
Non-poor 12.83 14.75 19.32Consumption poor (only) 14.36 11.61 14.33Asset poor (only) 18.80 31.09 26.30Asset and Consumption poor 54.01 42.55 40.05Notes: consumption poverty refers to the official poverty estimates (see DNEAP, 2010),which follows a cost of basic needs approach; asset poverty is based on a multidimensionalindex of the Alkire and Foster (2011) type.Source: authors’ calculations from household survey series.
10

Source: authors’ calculations, based on official public statistics.
Figure 1: GDP in billions of real US$, by major sector, 1991-2009
Source: authors’ calculations, based on official public statistics.
Figure 2: Structure of aggregate value added (in %), by major sector, 1991-2009
11

Source: World Bank, World Development Indicators (online, retrieved July 2012).
Figure 3: Yields of staple cereal crops (maize), kg/ha
12

4 Stylized jobs facts
The preceding tour of Mozambique’s recent economic performance indicates something of aconundrum – how is it that rapid rates of economic growth have not (unambiguously) translatedinto sustained poverty reduction? This motivates a careful look at changes in the labourmarket. Thus, drawing on evidence from micro-data, the present section aims to characteriseMozambique’s jobs situation starting in the early post-conflict period (1996/97) through to themost recent household survey of 2008/09. To do so, we present a set of 10 stylized facts thatshould be read as broad generalizations of the Mozambican labour market, which admittedlyleave certain nuances and details aside.
Stylized Fact 1Mozambique’s population is young, rural and growing rapidly.
A simple but fundamental starting point is the demographic structure of the work force. As Table3 shows, presently a little under 50% of the population is of working age (but not necessarilyworking), meaning that there is more than one dependent to each potential worker. Thepopulation also remains largely located in rural areas, with an urbanization rate of approximately30% which is low in global terms but not exceptional for low income African countries in whichagriculture is a widespread occupation. Notably, the rate of urban growth appears to berelatively slow, meaning that the share of population residing in rural areas has remained broadlyunchanged since 1996/97.7 However, this is not because internal migration is unimportant. Asthe table indicates, some of the fastest growing population segments have been the urban youthand adult cohorts, evidently buoyed by in-migration from rural areas (particularly of youngpersons) which in turn has raised the dependency ratio in these areas to over 115%.
A critical implication of these demographic trends is that the working age population willcontinue to grow relatively rapidly over the next generation (30 years). Baseline simulationsbased on the UN’s core population estimates for Mozambique indicate that the overall populationgrowth rate is expected to be around 2.3% per annum (p.a.) over the period 2005-2050. However,the more rapid growth of the under 15 cohort that continues to take place now, in part linked tolarge reductions in infant mortality and improved health outcomes more generally, translatesinto expected increases in the working age population of approximately 2.7% p.a. over the sameperiod. These estimates are illustrated in Figure 4. From now to 2040, Mozambique shouldplan for its working age population to at least double (see panel [a]). Put differently, the cohort7One reason for this may simply be due to the fact that the urban/rural classification used in the 1997 censuswas not updated for the 2007 census. As Cunguara et al. (2011a) note, based on an urban agglomeration index,urbanization has increased from 15 to 21 percent over the same period. Whatever the correct measure, the keypoint is that the degree of urbanization remains low.
13
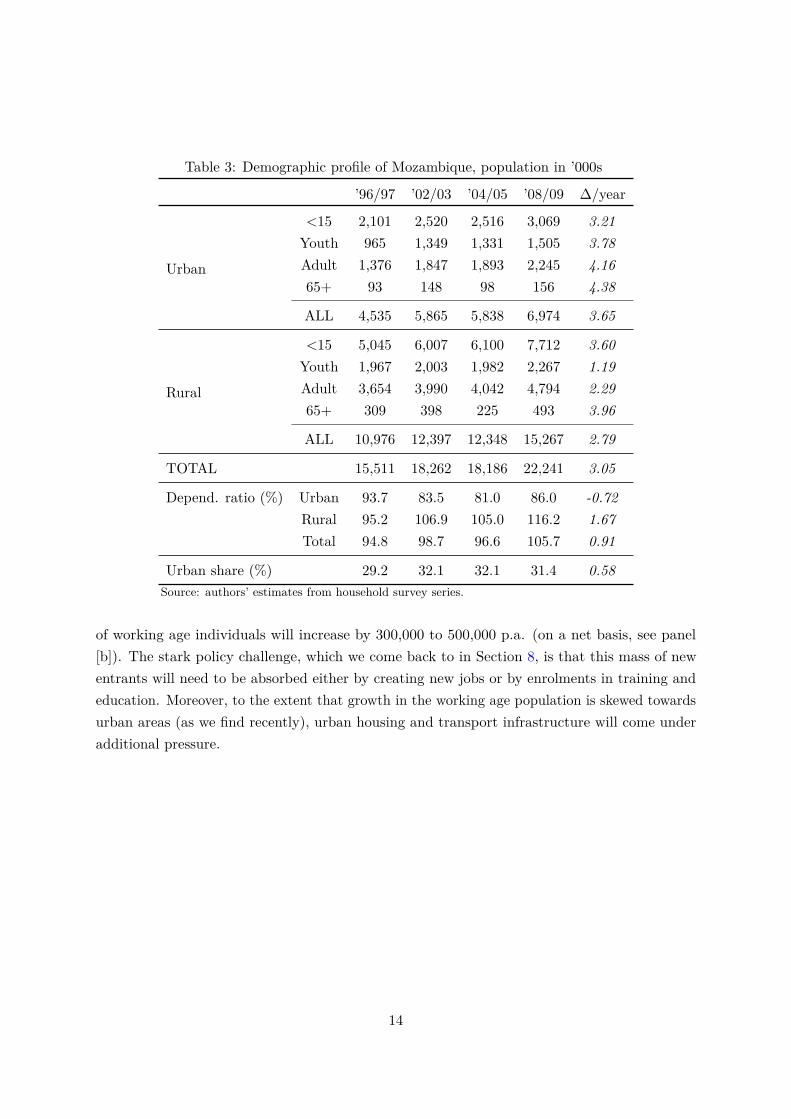
Table 3: Demographic profile of Mozambique, population in ’000s
’96/97 ’02/03 ’04/05 ’08/09 ∆/year
Urban
<15 2,101 2,520 2,516 3,069 3.21Youth 965 1,349 1,331 1,505 3.78Adult 1,376 1,847 1,893 2,245 4.1665+ 93 148 98 156 4.38
ALL 4,535 5,865 5,838 6,974 3.65
Rural
<15 5,045 6,007 6,100 7,712 3.60Youth 1,967 2,003 1,982 2,267 1.19Adult 3,654 3,990 4,042 4,794 2.2965+ 309 398 225 493 3.96
ALL 10,976 12,397 12,348 15,267 2.79
TOTAL 15,511 18,262 18,186 22,241 3.05
Depend. ratio (%) Urban 93.7 83.5 81.0 86.0 -0.72Rural 95.2 106.9 105.0 116.2 1.67Total 94.8 98.7 96.6 105.7 0.91
Urban share (%) 29.2 32.1 32.1 31.4 0.58Source: authors’ estimates from household survey series.
of working age individuals will increase by 300,000 to 500,000 p.a. (on a net basis, see panel[b]). The stark policy challenge, which we come back to in Section 8, is that this mass of newentrants will need to be absorbed either by creating new jobs or by enrolments in training andeducation. Moreover, to the extent that growth in the working age population is skewed towardsurban areas (as we find recently), urban housing and transport infrastructure will come underadditional pressure.
14

Source: authors’ calculations, using Spectrum software.
Figure 4: Projected demographic trends in Mozambique, for adults (25-64) and youth (15-24)cohorts only
15

Stylized Fact 2Rates of labour force participation are high; unemployment is low and principally confined
to urban youths.
As is common in low income countries, where social security systems have very limited coverage,rates of labour force participation are high in Mozambique. That is, virtually everyone ofworking age is economically active. This can be seen from Table 4, from which three importantpatterns can be highlighted. The first is that participation rates are consistently higher in ruralas opposed to urban areas, among both youth and adults. As also illustrated in Figure 5, onlyusing data from the 2008 survey, this reflects both lower participation in (full-time) education, aswell as almost non-existent rates of unemployment or NEET in rural areas. Second, participationrates of females are typically higher than (or at least as high as) that of males, except amongadults located in urban areas which appears to be driven by domestic work rather than narrowunemployment (not shown). Nonetheless, even in urban areas around 80% of all adult womenare economically active; thus, a key point is that female work is fundamental in the Mozambicanlabour market and even more so in rural areas. Third, while participation rates among menhave remained broadly stable over the period of the surveys, female participation rates appearto have increased in urban areas. While it is possible this is driven by non-sample error in the1996/97 survey, this pattern would be consistent with evidence of tightening livelihood conditionsintimated in Section 3 and detailed further below. A final point, which refers to Figure 4, is thatbroad rates of unemployment are not to be ignored, particularly among urban youths wheredomestic work is less prevalent. This is clarified by the next fact.
Table 4: Economic activity rates, by location and gender
Urban Rural
Age group Survey Male Female Male Female
Youth
96/97 52.0 49.2 74.2 90.102/03 48.5 54.3 67.7 86.204/05 51.2 58.0 79.0 92.008/09 50.2 57.1 77.1 89.3
Adult
96/97 91.3 74.8 96.8 97.502/03 97.1 85.4 99.6 99.204/05 90.5 86.5 95.8 97.708/09 90.5 88.2 97.6 97.6
Source: authors’ estimates from household survey series.
16

Source: authors’ calculations from 2008/09 household survey.
Figure 5: Allocation of working age population by activity
17

Stylized Fact 3Under-employment is rife.
Despite the fact that most of the economically active population are economically active andhave some form of job, only a minority of workers are fully employed. This suggests that lowproductivity, low quality (or bad) jobs are prevalent. Evidence on under-employment comesfrom reported number of hours worked, from which a simple differentiation between the fully-,under- and un-employed can be made.8 Data on the share of economically active persons fallinginto these categories for each survey is provided in Table 5. To assist interpretation, the tableincludes an additional category which refers to individuals who claim to be both working andstudying. As the education system has seen rapid expansion during the post-conflict period,allowing many youths and adults to further their education, it is helpful to keep this groupdistinct from the non-studying and (thus) ‘genuinely’ under-employed.
Table 5 indicates that urban areas have seen minimal changes in the degree of employment overtime. Around 50% of the labour force is fully employed, and narrow or open unemployment hashovered around 10%. The only significant change in the urban labour market appears to havebeen a shift of workers from under-employment to combining work and study, which would beconsistent with individuals investing spare time to raise their skills in order to secure a higherproductivity (full-time) occupation. In contrast, however, the same evidence on hours workedpoints to a gradual tightening of the rural labour market. Rates of underemployment have fallenfrom around 70% to 50% over the period and, correspondingly, full employment rates haverisen from 27% to 43%. These changes would be consistent with per capita consumption gainsthat are driven primarily by increased hours worked rather than any significant improvement in(agricultural) productivity such as via the introduction of new technology or capital accumulation.
Finally, a gender dimension in the degree of employment should be highlighted. Although notshown in the table, the data reveals that women in urban areas show comparatively higherrates of under- and unemployment, where the latter includes those being available for as well asactively seeking work. This is not the case in rural areas, potentially suggesting that gender-basedoccupational discrimination is more acute in urban occupations. A related explanation is thatwomen in urban areas often combine domestic work with productive activities (in the home),while men face fewer constraints on their availability to engage in work (outside the home).
8Data on hours worked should be treated with some caution given the prevalence of the informal sector (seebelow) and particularly because there are numerous missing values. Even so, these results are consistent withthe overall pattern in the labour market described in this section.
18

Table 5: Distribution of work force by employment status
’96/97 ’02/03 ’04/05 ’08/09 ∆
Urban Fully employed 52.6 42.5 46.4 49.0 -3.5Under-employed 37.5 39.5 33.1 34.5 -3.0Work + study 0.9 5.9 6.5 7.6 6.8Unemployed 9.1 12.2 13.9 8.9 -0.2
Rural Fully employed 27.3 36.5 37.3 42.9 15.7Under-employed 69.4 57.7 56.1 49.2 -20.2Work + study 0.5 3.2 5.8 7.5 7.0Unemployed 2.8 2.7 0.8 0.4 -2.4
Notes: the final column indicates the absolute difference between 2008/09 and1996/97.Source: authors’ estimates from household survey series.
19
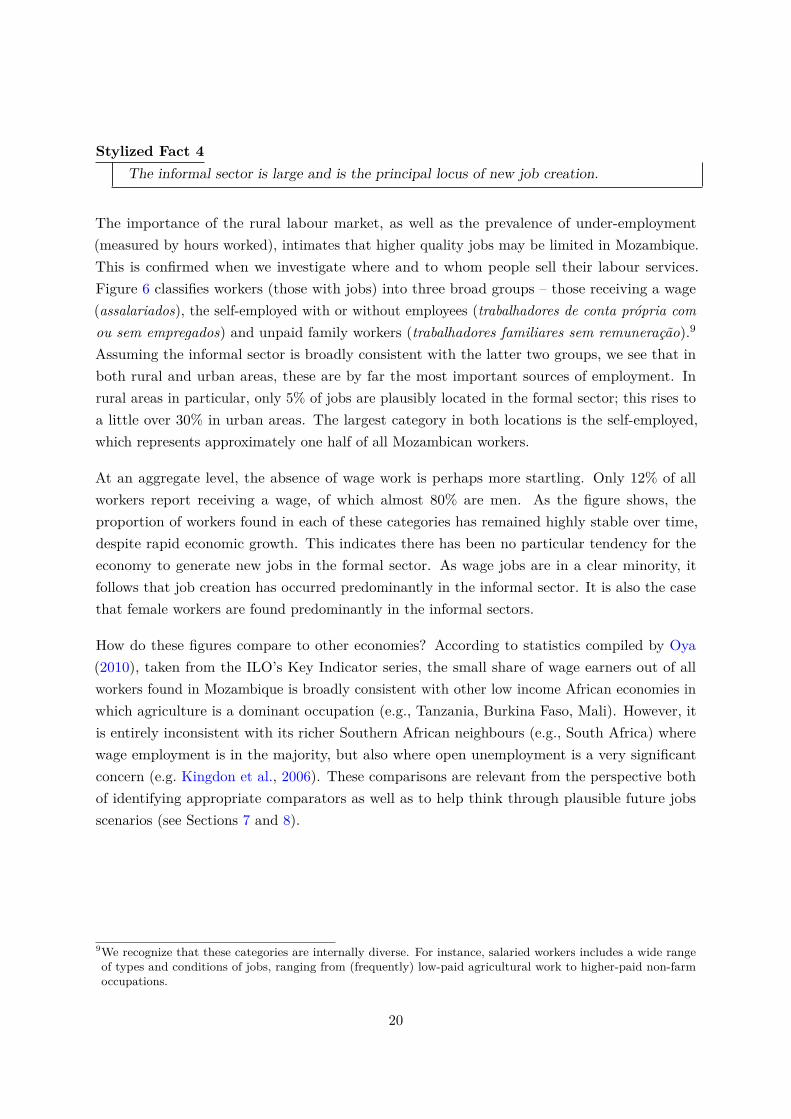
Stylized Fact 4The informal sector is large and is the principal locus of new job creation.
The importance of the rural labour market, as well as the prevalence of under-employment(measured by hours worked), intimates that higher quality jobs may be limited in Mozambique.This is confirmed when we investigate where and to whom people sell their labour services.Figure 6 classifies workers (those with jobs) into three broad groups – those receiving a wage(assalariados), the self-employed with or without employees (trabalhadores de conta própria comou sem empregados) and unpaid family workers (trabalhadores familiares sem remuneração).9
Assuming the informal sector is broadly consistent with the latter two groups, we see that inboth rural and urban areas, these are by far the most important sources of employment. Inrural areas in particular, only 5% of jobs are plausibly located in the formal sector; this rises toa little over 30% in urban areas. The largest category in both locations is the self-employed,which represents approximately one half of all Mozambican workers.
At an aggregate level, the absence of wage work is perhaps more startling. Only 12% of allworkers report receiving a wage, of which almost 80% are men. As the figure shows, theproportion of workers found in each of these categories has remained highly stable over time,despite rapid economic growth. This indicates there has been no particular tendency for theeconomy to generate new jobs in the formal sector. As wage jobs are in a clear minority, itfollows that job creation has occurred predominantly in the informal sector. It is also the casethat female workers are found predominantly in the informal sectors.
How do these figures compare to other economies? According to statistics compiled by Oya(2010), taken from the ILO’s Key Indicator series, the small share of wage earners out of allworkers found in Mozambique is broadly consistent with other low income African economies inwhich agriculture is a dominant occupation (e.g., Tanzania, Burkina Faso, Mali). However, itis entirely inconsistent with its richer Southern African neighbours (e.g., South Africa) wherewage employment is in the majority, but also where open unemployment is a very significantconcern (e.g. Kingdon et al., 2006). These comparisons are relevant from the perspective bothof identifying appropriate comparators as well as to help think through plausible future jobsscenarios (see Sections 7 and 8).
9We recognize that these categories are internally diverse. For instance, salaried workers includes a wide rangeof types and conditions of jobs, ranging from (frequently) low-paid agricultural work to higher-paid non-farmoccupations.
20

Source: authors’ calculations from household survey series.
Figure 6: Distribution of workers, by type of employment
21

Stylized Fact 5Levels of education (skills) remain low throughout the economy.
The consequences of Mozambique’s long and bitter experience of conflict are both numerous andpersistent. A major effect has been the retardation of the post-independence objective to revertthe legacy of Portuguese colonialism, which left the vast majority of Mozambicans without anyform of education or modern skills. During the recent post-conflict period, rehabilitation andexpansion of the school system has been a major policy objective, supported by large amounts offoreign aid. As Arndt et al. (2007) document (also DNEAP, 2010), results have been impressiveand enrolment rates have risen dramatically. However, aggregate measures of human capital –such as the mean years of schooling (used here) – only change slowly as education permeatesthrough younger cohorts into the work force.
Table 6 and Figure 7 indicate how the skill level of the work force has improved over time. Theformer divides the working population into youth/adult and rural/urban subgroups; the latterconsiders skills at the sectoral level. Which ever way the data is cut, the overriding point isthat while skills have clearly improved they remain low. In all of the subgroups and sectors, theaverage worker has less than a completed primary education (7 years of schooling). Tertiaryworkers, which include the majority of public servants, are the best educated in general; similarly,urban males (youth and adults) are the best educated of the subgroups shown.
Three further points can be highlighted about the distribution of skills in the work force(economy). First, Table 6 reveals a clear gender-gap whereby female workers typically have atleast one year less education than males. This difference is highest and most persistent amongadults, where the male-female education has risen to more than two years in both rural andurban areas. Bucking this trend are urban female youths, which appear to be (slowly) closingthe education gap with their male counterparts, although more data points will be necessary tosupport this trend. Second, and relatedly, youths now tend to be significant better educatedthan adults. This is most dramatically the case among rural workers (including women). Third,there are persistent and large education gaps between sectors. Unsurprisingly, primary sector(predominantly rural) workers have the lowest average level of education at less than three years.However, it is not the case that educated workers have been drawn to occupations where averageeducation levels are most scarce and therefore might yield higher returns. Rather, the averagelevel of education has risen slightly more in absolute terms in secondary and tertiary sectors overthe period of the surveys (see Figure 7). Thus the average tertiary worker has almost four yearsmore education than those in the primary sector. This is pertinent as the employment aspirationsof youth are likely to be conditioned by existing labour market structures and institutions.10
10Indeed, researchers have noted a concern that: “young Africans are increasingly reluctant to pursue agriculture-based livelihoods, which could have major implications for continent-wide initiatives to revitalise the agriculture
22

Table 6: Distribution of work force by years of education
Urban Rural
Age group Survey Male Female Male Female
Youth
96/97 4.91 3.56 2.45 1.4202/03 4.69 2.36 1.65 0.7704/05 4.72 3.83 3.21 1.9408/09 6.13 5.05 4.70 3.02
∆ 1.22 1.49 2.25 1.60
Adult
96/97 4.90 2.35 2.25 0.6402/03 5.21 2.29 1.59 0.3404/05 6.19 3.36 3.02 1.0608/09 6.13 3.70 3.27 1.26
∆ 1.23 1.35 1.03 0.62
Ratio 08/09 1.00 0.73 0.70 0.42Notes: ∆ gives the absolute difference in years of education between 2008/09 and1996/97 for each subgroup; ‘Ratio’ is the youth/adult years of education ratio in2008/09.Source: authors’ estimates from household survey series.
sector.”(Future Agricultures, 2010, p.3), which has been linked to perceptions of agriculture as a low-skill,distasteful occupation. See Perry (2009) for discussion of the complex cultural issues surrounding the employmentof young men in a rural Senegalese context.
23

Source: authors’ calculations from household survey series.
Figure 7: Mean years of education among workers, by broad economic sector
24
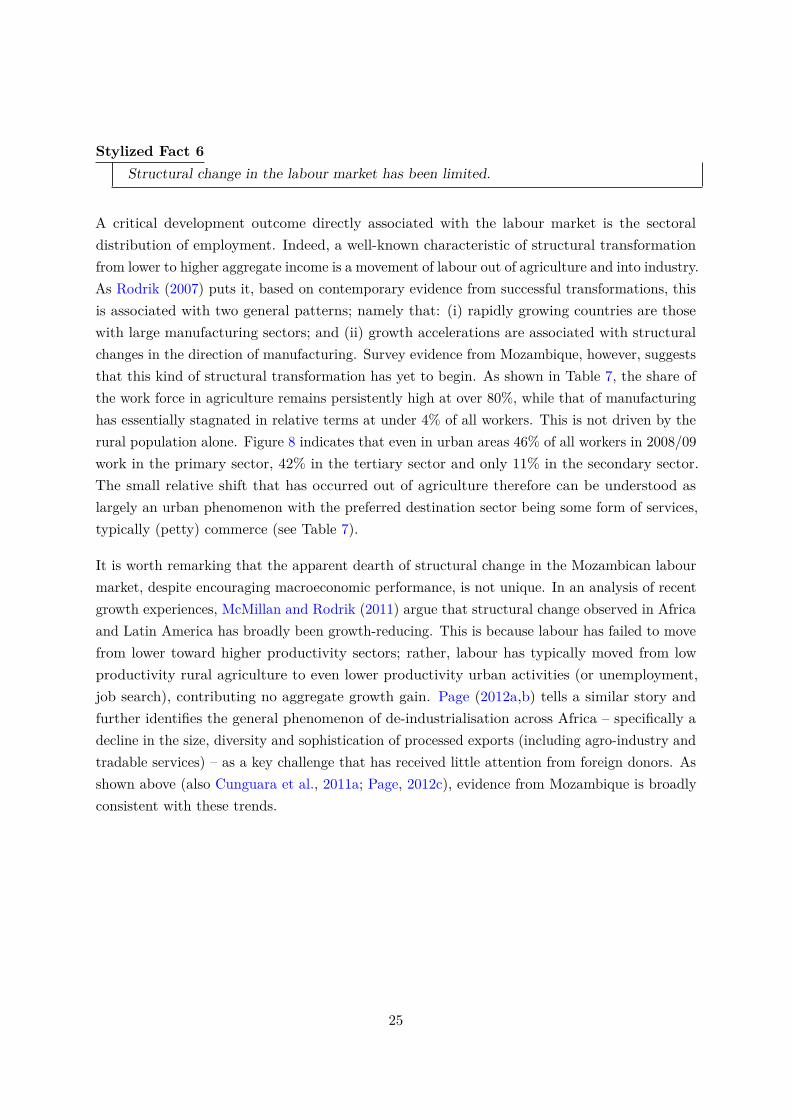
Stylized Fact 6Structural change in the labour market has been limited.
A critical development outcome directly associated with the labour market is the sectoraldistribution of employment. Indeed, a well-known characteristic of structural transformationfrom lower to higher aggregate income is a movement of labour out of agriculture and into industry.As Rodrik (2007) puts it, based on contemporary evidence from successful transformations, thisis associated with two general patterns; namely that: (i) rapidly growing countries are thosewith large manufacturing sectors; and (ii) growth accelerations are associated with structuralchanges in the direction of manufacturing. Survey evidence from Mozambique, however, suggeststhat this kind of structural transformation has yet to begin. As shown in Table 7, the share ofthe work force in agriculture remains persistently high at over 80%, while that of manufacturinghas essentially stagnated in relative terms at under 4% of all workers. This is not driven by therural population alone. Figure 8 indicates that even in urban areas 46% of all workers in 2008/09work in the primary sector, 42% in the tertiary sector and only 11% in the secondary sector.The small relative shift that has occurred out of agriculture therefore can be understood aslargely an urban phenomenon with the preferred destination sector being some form of services,typically (petty) commerce (see Table 7).
It is worth remarking that the apparent dearth of structural change in the Mozambican labourmarket, despite encouraging macroeconomic performance, is not unique. In an analysis of recentgrowth experiences, McMillan and Rodrik (2011) argue that structural change observed in Africaand Latin America has broadly been growth-reducing. This is because labour has failed to movefrom lower toward higher productivity sectors; rather, labour has typically moved from lowproductivity rural agriculture to even lower productivity urban activities (or unemployment,job search), contributing no aggregate growth gain. Page (2012a,b) tells a similar story andfurther identifies the general phenomenon of de-industrialisation across Africa – specifically adecline in the size, diversity and sophistication of processed exports (including agro-industry andtradable services) – as a key challenge that has received little attention from foreign donors. Asshown above (also Cunguara et al., 2011a; Page, 2012c), evidence from Mozambique is broadlyconsistent with these trends.
25
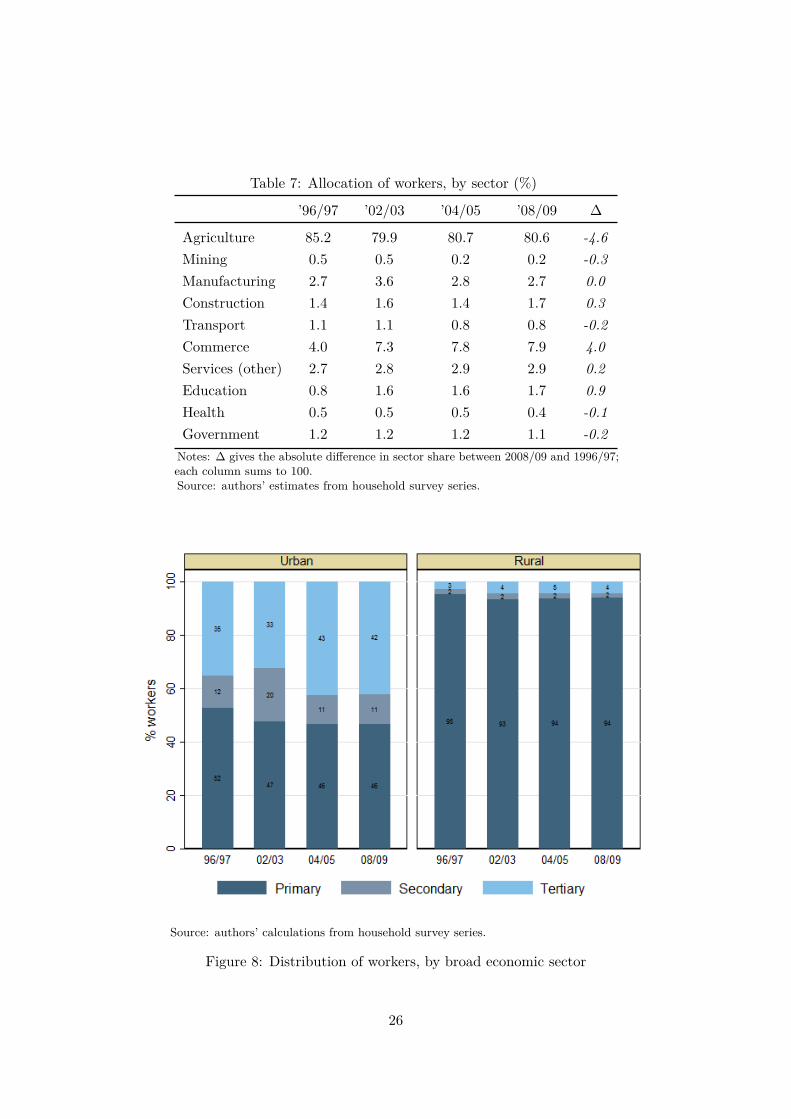
Table 7: Allocation of workers, by sector (%)
’96/97 ’02/03 ’04/05 ’08/09 ∆
Agriculture 85.2 79.9 80.7 80.6 -4.6Mining 0.5 0.5 0.2 0.2 -0.3Manufacturing 2.7 3.6 2.8 2.7 0.0Construction 1.4 1.6 1.4 1.7 0.3Transport 1.1 1.1 0.8 0.8 -0.2Commerce 4.0 7.3 7.8 7.9 4.0Services (other) 2.7 2.8 2.9 2.9 0.2Education 0.8 1.6 1.6 1.7 0.9Health 0.5 0.5 0.5 0.4 -0.1Government 1.2 1.2 1.2 1.1 -0.2Notes: ∆ gives the absolute difference in sector share between 2008/09 and 1996/97;each column sums to 100.Source: authors’ estimates from household survey series.
Source: authors’ calculations from household survey series.
Figure 8: Distribution of workers, by broad economic sector
26

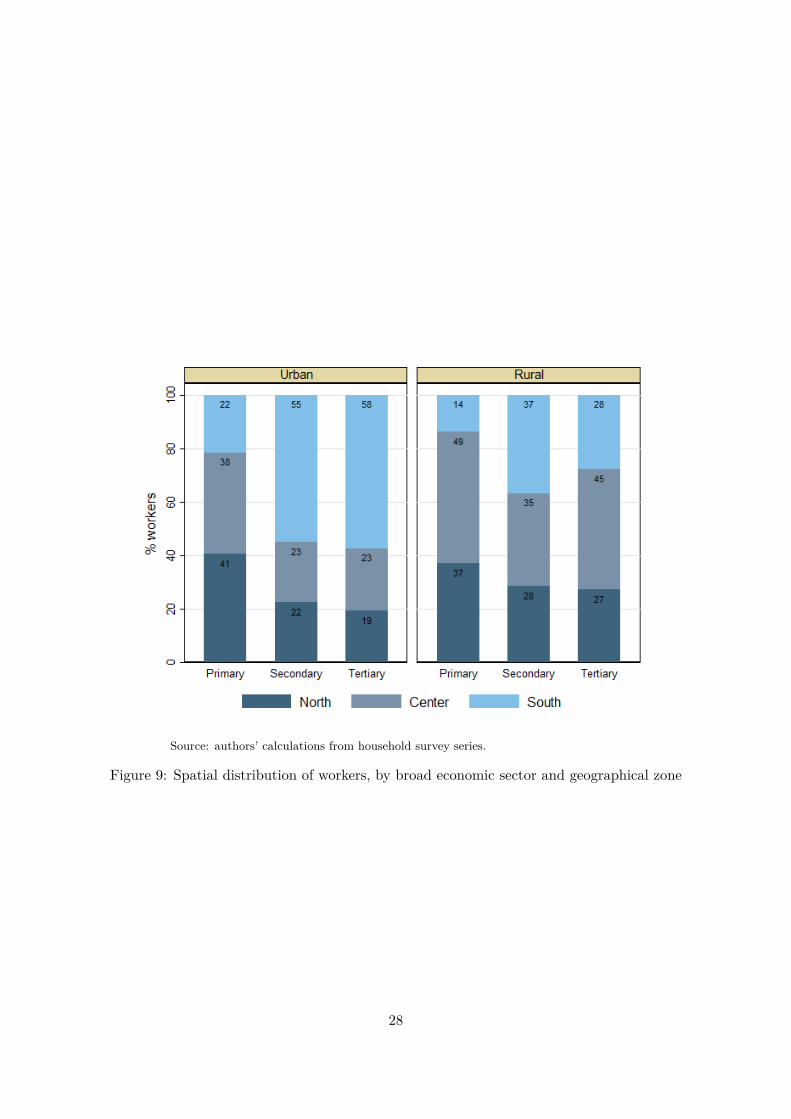
Stylized Fact 7There are large spatial differences in the distribution of Mozambican labour.
Mozambique’s climate and geography hold important implications for its labour markets, aswell as potential links between labour and product markets. On the one hand the capital city,Maputo, is located in the far southern tip of the country, close to South Africa. Indeed, Maputowas developed by the Portuguese precisely to facilitate the export of industrial goods from itsneighbour, being the closest deep water port to the Witwatersrand area. At the same time, thesouthern zone of Mozambique is comprised largely of arid and semi-arid agro-ecological zones,which are prone to drought and typically associated with lower soil fertility. The central andnorthern regions of Mozambique, which are separated from the capital city by more than 1000km, are generally more favourable to rain-fed and irrigated crops, including cash crops such astobacco, cotton, and coconut. As Figure 9 shows, it is precisely in the rural areas of these regionswhere one encounters the vast bulk of the agricultural workforce, as well as overall population.However, it is in the urban south that the bulk of all non-primary workers reside. Specifically,more than half of all urban secondary and tertiary sectors are located in the south (essentiallythe greater Maputo region).
This spatial variation in labour has been persistent over time, further underlining the thesisthat there has been minimal positive structural change. The disconnect between the southand the rest of the country is economically important because high transport costs (distances)limit the potential for positive multiplier effects running from agriculture to cheaper urbanwage goods, as well as from urban demand to agriculture. It also limits the scope for growth ofagro-processing focused on domestic markets as the locus of such demand is distant from regionswith the most productive potential. Indeed, the (substantially) better-off urban south has beenheavily reliant on South African agricultural imports, a trend that likely has been bolstered bythe recent expansion of large South African supermarket chains (e.g., Shoprite, Spar, Pick ‘n’Pay, Woolworths) in the Maputo region as well as a strong real exchange rate.
27
Source: authors’ calculations from household survey series.
Figure 9: Spatial distribution of workers, by broad economic sector and geographical zone
28

Stylized Fact 8Productivity gaps between sectors are large and widening, largely due to slow productivity
growth in agriculture.
Thus far, we have found persistent differences in the average level of skills (education), spatialdistribution and relative size of labour across sectors. The same goes for the productivity oflabour. Mapping total hours worked, estimated from the micro-data sources, to the aggregatesectoral classification employed in the Mozambican national accounts, we derive estimates ofthe real productivity of labour – i.e, the mean value added contributed by one hour of labourservices. Aggregated to the primary/secondary/tertiary industrial sectors, these estimates aredepicted in Figure 10, stated in constant international dollars (per hour).11 Four main pointscan be highlighted from these numbers. First, overall levels of productivity are low – on averageMozambican workers generate less than 1 dollar of value added per hour of work. It is interestingto compare these estimates to the statutory minimum wage rates in Mozambique (which applyacross the formal sector, with different rates for different occupations). These imply a far higheraverage level of productivity. For instance, monthly minimum wages in the agricultural sector areset at over 2,300 Meticais per month (in nominal 2012 wage rates). This translates to around 1international dollar per hour, which is three times higher than overall hourly labour productivityin that sector, even before separating out payments to labour and capital.
Second, there are very large productivity differences between sectors. The primary sector, whichis dominated by agriculture, has the lowest labour productivity. Based on estimates from 2009,labour productivity is almost 7 times higher in the tertiary sector and 10 times higher in thesecondary sector. Other sources of data support the general contention that productivity in theagricultural sector is not only especially low, but also has remained broadly stagnant over thepost-conflict period. For instance, calculations in Table 8 developed from successive agriculturalsurveys, show that crop productivity – whether measured as calories-produced per hectare undercultivation or as calories-produced per head of rural population – has marginally fallen over theperiod 2002-2008. This can be traced to the persistence of extremely rudimentary technologies(.e., non-use of fertilizers, lack of access to extension information etc.), a reliance on rain-fedcrops and poor rural infrastructure which in turn raises transaction costs. Indicative statisticsin this regard are found in Table 9.
Third, there is no evidence of convergence in sectoral productivity. Rather, the gap between theprimary and secondary sectors has widened over the period shown. This can be traced to two11We arrive at international dollars by first converting from 2003 constant values in New Mozambican Meticais (US$1 = 23.7 Meticais) and then apply the PPP conversion factor of 2.5 from the International Comparison Programme(see: siteresources.worldbank.org/ICPEXT/Resources/ICP_2011.html), yielding a PPP-adjusted exchangerate of 11.8 to the dollar. The resulting story from these figures is highly consistent with alternative labourproductivity measures, such as those based on the numbers of individuals working in each sector.
29

related phenomena – a small number of capital-intensive ‘mega-projects’ developed by foreigninvestors, such as the Mozal aluminium smelter, combined with weak employment growth inthe secondary sector. Fourth, the figure shows that productivity growth in the secondary sectorappears to have slowed over recent years. On a related note, firm survey evidence indicates thatthe productivity of Mozambique’s manufacturing firms remains low in relation to its low incomepeers and its geographical neighbours. This is revealed in Table 9 which reports estimates of salesand value added (per worker) for a representative small food processing firm. The point to noteis that despite nominal wages being at a similar level to its peers, productivity in Mozambiquemeasured in value added terms is just over half of those in other countries.
Notes: values are stated in real international dollars (2003 prices) per hour worked; see textfor details.
Source: authors’ calculations from household survey series.
Figure 10: Estimates of average labour productivity, by economic sector
30

Table 8: Crop production estimates
Total production Productivity Productivity Calories(index) (kcal / ha) (index) (person / day)
2002 100.0 2,307 100.0 2,1352003 124.2 2,643 114.6 2,5832005 111.3 1,935 83.9 2,1032006 140.9 2,424 105.1 2,7172007 128.6 2,189 94.9 2,4222008 113.8 1,961 85.0 2,000
∆ 13.8 -15.0 -15.0 -6.3Notes: ∆ gives the absolute difference between 2008 and 2002; indexes set at 2002=100.Source: DNEAP (2010).
Table 9: Agricultural technology adoption indicators (% farms)
2002 2003 2005 2006 2007 2008 ∆
Receipt of extension info. 13.5 13.3 14.8 12.0 10.1 8.3 -5.2Use of chemical fertilizer 3.8 2.6 3.9 4.7 4.1 4.1 0.3Use of pesticides 6.8 5.3 5.6 5.5 4.2 3.8 -3.0Use of irrigation 10.9 6.1 6.0 8.4 9.9 8.8 -2.1Receipt of credit - 2.9 3.5 2.9 4.7 2.6 -Used animal traction 11.2 10.9 9.3 12.4 11.5 14.3 3.1Membership of association 3.7 4.8 6.4 6.5 8.3 7.4 3.7Hired permanent labor 2.2 1.9 1.8 2.2 2.6 3.0 0.8Hired seasonal labor 15.5 15.3 17.6 23.8 20.8 19.6 4.1Notes: ∆ gives the absolute difference in each indicator between 2008 and 2002.Source: DNEAP (2010) and authors’ calculations using agricultural survey (TIA) data.
31

Table 10: Comparative manufacturing performance metrics(2008)
Sales/worker VA/worker Wage(annual) (annual) (US$ month)
Mozambique 11,932 3,516 53Indonesia 13,200 6,535 56Malawi 24,686 7,754 50Angola 24,053 8,476 139Zambia 22,948 8,725 69
South Africa 84,373 28,653 467Notes: numbers refer to a small company in the food industry; theestimates for each country come from different sources and thus cannotbe compared directly; they are nonetheless indicative.Source: World Bank (2009).
32
Stylized Fact 9Household income sources have become more diversified over time.
A complementary symptom of Mozambique’s failure to generate sufficient, higher productivity,good jobs is that households have increasingly come to diversify their jobs portfolios. Figure 11categorises households by the number of distinct sources of income they report as receiving.12
The figure reveals that multiple sources of income have become the norm. For workers inrural areas, around 43% of households report receiving more than one kind of income source,up from just 19% in 1996/97. An important driver of this trend is an increase in the shareof rural households reporting receipt of a transfer (or rental) income, which has increasedfrom 18% to 33% from 1996/97 to 2008/09. One interpretation is that some rural householdsincreasingly employ internal migration and extended family networks as a livelihood survivalstrategy, particularly in the context of weak agricultural productivity growth. It is also notablethat urban households have followed a similar pattern of pursuing multiple income sources. Thismay be because many jobs (such as in the informal sector) are vulnerable and generate lowreturns, which in turn cannot support a household. On the other hand, income diversificationalso could be indicative of (a tentative) movement into non-farm occupations, which can be seenas a first step in the direction of structural transformation. This theme is explored further inthe next sections.
12These sources are: non-wage agricultural income (excluding income from animal husbandry activities); non-wageincome from animal husbandry; non-agricultural income from self-employment; wage income and transfer orrental (non-labour) income.
33

Notes: income sources are as described in the text, the maximum being four.Source: authors’ calculations from household survey series.
Figure 11: Categorization of households (in %) by number of distinct sources of income
34

Stylized Fact 10Social discontent appears to be rising, particularly among the urban youth.
A vital aspect of jobs is their contribution to social cohesion (see Section 2). Where employmentis scarce or vulnerable, social cohesion becomes frayed, particularly where there are suddenshocks to living standards. Over the past few years Mozambique has suffered isolated incidentsof unrest of this kind. The first occurred in February 2008, largely in response to rises in thecost of collective transportation linked to fuel prices. The second occurred in September 2010,also due to rising utility, transport and food prices. However, an underlying aspect of theseevents is persistent poverty and perceptions of rising inequality.
What is the link between jobs and social cohesion in Mozambique? No doubt this is complexterrain, but some guidance comes from an analysis of the AfroBarometer opinion surveys,undertaken in Mozambique to (small) nationally representative samples of the adult populationin 2002, 2005 and 2008. The results indicate that concerns around lack of access to employmentare most acute among the urban youth. This is indicated in Figure 12, which plots the share ofrespondents from the 2005 and 2008 surveys at each age that consider jobs to be a key economicproblem. Almost 50% of all urban adults below 45 years of age consider jobs to be a problem;however, this view is supported by less than 30% of rural respondents. A closer look at the dataalso shows that there seems to be rising rates of mistrust of high level authorities (as based onthe perceived degree of trust of the President asked in the questionnaire) among urban youths,and particularly those that claim to receive some form of cash or wage remuneration. This isshown in Figures 13 and 14. The implication is that the most vocal concerns surrounding jobsare likely to emerge from younger urban cohorts, reflecting frustration from unmet expectationsof finding stable, quality employment. Without seeking to belittle their concerns, it should berealised that this (vocal) cohort is not necessarily the most disadvantaged. Thus, urban socialdiscontent around jobs may provide a misleading guide to policy priorities.
35

Notes: Median spline used to smooth age-specific responses.Source: authors’ calculations from from AfroBarometer surveys 2005 and 2008.
Figure 12: Proportion of adults, by age, identifying jobs as a problem
Notes: youths defined as 18-24; adults are above 24 years old.Source: authors’ calculations from AfroBarometer surveys 2002, 2005 and 2008.
Figure 13: Share of rural/urban age cohorts trusting the President
36

Notes: “Waged” refers to receiving some form of cash remuneration from sale oflabour services.Source: authors’ calculations from AfroBarometer surveys 2002, 2005 and 2008.
Figure 14: Share of population subgroups, classified by income source, trusting the President
37
5 Methodology
The previous section presented evidence that, despite rapid rates of aggregate economic growth,Mozambique’s labour market has undergone limited transformation. Similar to the immediatepost-conflict period, the vast majority of Mozambicans are engaged in low-productivity agricul-tural work. Even in urban areas, informal activity is predominant and, as a share of the workingpopulation, only a small minority are formally employed. The fundamental issue, particularlyfor policy-makers, is how this evidence should be interpreted. Is it explained by the existenceof imperfections directly associated with the labour market? Or, is it merely symptomatic ofweaknesses that originate outside the labour market? Taking the latter case, it could be thatlabour markets operate relatively efficiently and individuals are able to select occupations oractivities that maximise utility (see further below). Thus, the co-existence of (broad) labourmarket stagnation and persistent headcount poverty rates might principally reflect low (average)levels of technology, human and physical capital across the economy. Labour productivitydifferentials between sectors, equally could be explained by compensatory differentials – i.e.,from differences in endowments (including technology or capital per worker), individual abilityor preferences. In this case, the link between jobs and poverty outcomes reflects an accountingidentity, the policy remedy being to support enhancements on the supply-side of labour andcapital markets.
On the other hand, more specific mechanisms may be at play which constrain or trap individualsin lower-productivity activities. Thus, whilst in principle individuals could make a Pareto-improving movement out of one activity into another, imperfections of one sort or another(including absent or dysfunctional economic institutions) restrict their ability so to do. If this isthe case, then the connection between labour markets and poverty is more direct and causal innature. The diagnosis also would be different. Policy-makers would be advised to eliminate thesources of these market imperfections and improve the functioning of labour (and other factor)markets in order to allocate resources more efficiently across the economy.
The two opposite cases described above illustrate the importance of grasping labour marketoutcomes and processes (jobs) to sharpen our understanding of poverty. Whether or not labourmarket imperfections are an underlying explanation of persistent poverty, a jobs lens can providesubstantive policy-relevant insight to questions about enhancing social welfare. As ever, thechallenge is how to distinguish between these rival explanations. The remainder of this sectiondescribes our approach. First, we set up a simple theoretical framework. This provides amicroeconomic foundation to the analysis, thereby avoiding the charge of pursuing ‘measurementwithout theory’ (Koopmans, 1947). Second, we examine the empirical implications of themodel and identify a number of testable hypotheses that help distinguish between competingmechanisms. Third, we describe the specific empirical methods that will be used to answer these
38
questions.
5.1 Theoretical framework
Applying a jobs lens to the question of poverty outcomes requires a model of what determinesthe supply of labour to different activities – i.e., why do individuals do what they do? A usefulentry point is the canonical household time allocation problem, incorporating labour marketfailures, which has been used extensively to study the implications of perfect versus imperfectlabour market conditions in developing countries (e.g., de Janvry et al., 1991; Benjamin, 1992;Jacoby, 1993; Skoufias, 1994; Le, 2009, 2010). While this type of model has been applied mostfrequently to rural labour markets, in which household production is widespread, there is no apriori reason why it cannot be extended to cover labour supply decisions generically. Such ageneralisation is particularly apposite to the case of Mozambique. As noted in Section 4, the bulkof all households in both rural and urban settings are engaged in some form of household-levelproduction, as opposed to being engaged in an individualistic external wage labour market.
Following the above, a core assumption of the model is that the household acts as a unitarydecision-maker, meaning that household endowments are pooled into a single allocation strategyand preferences are jointly defined over consumption goods. For simplicity, the present modelfocusses primarily on labour-related inputs and constraints, thus placing to one side the specificsof fixed and variable inputs into household production. However, the intuition and results applygenerally to settings in which households face capital market constraints and/or transactioncosts that limit access to non-labour production inputs.
To begin, we assume the household maximises expected utility, defined as a deterministic functionof a single consumption good (C), leisure (l) and preference shifters (Z) (e.g., location and thenumber of children ): E(U) = U(C, l;Z), with the usual non-satiation properties: UC > 0, Ul > 0. Maximization is subject to budget constaints over time (labour supply) and expenditure. Withregard to the former, three potential productive activities are available – household labour inagriculture (La), household non-farm labour (Ln) and wage labour in the market (Lm). Totaltime available to the household is fixed by: T = La + Ln + Lm + l. Expenditure is constrainedby total income from each of the three sources of productive activity. Normalising the price ofconsumption goods to one and ignoring non-labour income and possible dissaving, this constraintis:
C = paYa(La, Xa,Ka) + pnYn(Ln, Xn,Kn) + w(Xm)Lm (1)
where pi are product prices, Xi characteristics that affect marginal returns to labour in activityi (e.g., skills), and Ki fixed inputs into household production, i ∈ (a, n,m). Ya, Yn representproduction functions for family farm and non-farm activities respectively, net of the contribution
39
of variable inputs and for which we assume the ‘no free lunch’ condition: Yi(Li = 0, . . .) = 0.Generic labour market imperfections are captured by the following set of constraints:
La ≥ 0 (2)
0 ≤ Ln ≤ L∗n (3)
0 ≤ Lm ≤ L∗m (4)
Consequently the household problem can be summarised as:
MaxLa,Ln,LmU(C, T − La − Ln − Lm) (5)
subject to: (1), (2), (3), (4)
Necessary Karush–Kuhn–Tucker (KKT) conditions for the solution of this problem yield thefollowing optimality properties of labour’s marginal product in different activities:
paY′
a + µa1λ
=Ul
λ(6)
pnY′
n + µn1 − µn2λ
=Ul
λ(7)
w(Xm) + µm1 − µm2λ
=Ul
λ(8)
where λ is the marginal utility of income and µi1, µi2 are the KKT multipliers associated withpotential labour market failures, derived from the Lagrangean. These multipliers can be read asshadow prices associated with particular labour market constraints. Specifically, for i ∈ (a, n,m),if labour does not face constraints in activity i then 0 ≤ Li ≤ Li
∗ and the complementaryslackness conditions are such that µi1 = 0, µi2 = 0 and the marginal product of labour in i isequal to the shadow or reservation wage, defined as the (unconstrained) opportunity cost oftime: w∗ = Ul/λ. However, if activity is bound by a non-negativity constraint, Li = 0, thenµi1 > 0, µi2 = 0. Alternatively, if labour supply is rationed (e.g., due to demand constraints),such that Li = Li
∗, then µi1 = 0, µi2 > 0. In the latter two cases, then, the reservation wagewill not equal the marginal product of labour in activity i, and the household may find itself ata corner solution.13
The above model of labour time allocation under labour market distortions provides one micro-foundation to models of labour market segmentation, an extreme case being the pure autarkymodel of Sen (1966). Although the particular source of market distortion is left open, thegeneral theoretical point is that where labour market constraints are binding, households maybe forced to allocate all labour time to a single activity. This is a rational response given the set13As noted above, other sources of market imperfection such as transaction costs can generate similar divergencesin labourŠs marginal product between sectors. The focus here, however, is on labour market issues only.
40
of constraints and simply represents a corner solution to the optimization problem set out inequation (5). To see this more clearly, it is helpful to define the full income constraint from (1),as:
C + lw∗ = paYa + pnYn + w(Xm)Lm + lw∗ (9)
= (paYa − Law∗) + (pnYn − Lnw
∗) + (w(Xm)− w∗)Lm + Tw∗
= πa + πn + πm + Tw∗
where the final line defines full income as the sum of shadow profits from labour activities plustotal income from potential labour priced at its opportunity cost. In the (stylized) case ofconstant returns to labour in household production, the same definition can be simplified usingequations (6) – (8) as follows:14
C + lw∗ =(w∗ − µa1
λ
)La +
(w∗ − µn1 − µn2
λ
)Ln +
(w∗ − µm1 − µm2
λ
)Lw + lw∗
By definition from the properties of the utility function and the optimization problem, expectedutility must be maximized when full income (C + lw∗ = Y ∗) is maximised at shadow priceswhich reflect the set of prevailing constraints. For instance, consider a case where a householdonly engages in family agricultural production, such that their activity profile is A = (La =T − l, Ln = 0, Lm = 0). This solution can be optimal under two main scenarios – the first is that,at the given solution, marginal returns in family agriculture are at least as high as in all otheractivity profiles and are equal to the shadow wage. Alternatively, labour’s marginal product ishigher in other profiles and thus is higher than the prevailing shadow wage. However, bindingdemand-side constraints at zero (L∗n = L∗m = 0) would mean that the household cannot allocatelabour to these other profiles, although it would be beneficial so to do.
5.2 Implications
Although the model developed in the previous subsection is both simple and stylized, it hasimportant implications. The most fundamental is that if labour market constraints are binding,then the shadow wage rate and the market wage rate generally will diverge. Two corollariesfollow immediately from this insight. First, the nature and degree of labour market constraintsshould be reflected by the sign and magnitude of differences in labour’s marginal product betweensegments or discrete activities, such as wage versus family labour. As the example noted abovemade clear, in the case of binding demand-side constraints one would expect to see the marginal14The point to note here is that full income is a function of the reserve wage and KKT multipliers. This resultdoes not require the assumption of constant returns to labour in household production, which is assumed heresimply for expository purposes.
41
product of labour in the chosen (corner) solution to be lower than its hypothetical value in othersegments.
The second corollary is that labour supply decisions are not separable from household preferencesand, thus, cannot be modelled as unique functions of a given market wage rate and fixedhousehold endowments. Consequently, empirical estimates of labour supply decisions musttake into account all terms that enter the household’s utility function. Continuing to assumethe existence of discrete labour market segments, this suggests that household labour supplydecisions can be characterised in a generalized Roy framework (see French and Taber, 2011).To do so, it is helpful to re-express the expected utility function according to the full incomeconstraint, thereby making the effects of labour market imperfections explicit via the shadowwage rate. That is, define expected utility as:
U(πa + πn + πm + (T − l)w∗, l;Z) (10)
Therefore, the core idea is that we observe labour is supplied to segment i ∈ P when ∀j ∈P, Ui ≥ Uj , i 6= j; and where Ui refers to the level of utility that would under be hypotheticallyobtained by choosing labour segment i.
With these general implications in mind, the next step is to identify specific, empirical teststhat can shed light on whether labour market constraints are at play and, if so, what formthey take.15 Unfortunately, as Leontaridi (1998) conclude (echoing the earlier conclusion ofHeckman and Hotz, 1986), existing empirical tests for labour market segmentation are subjectto substantial ambiguity. In particular, there are difficulties in distinguishing between potentialsegments prior to testing for their actual separation, as well as doubts over the correct empiricalspecification for labour’s marginal product (e.g., the correct functional relationship betweenearnings and education). Similar difficulties trouble tests for the separability between householdproduction and consumption decisions (e.g., Le, 2010). Thus, there is no unique, decisive test(no experimentum crucis) that will unambiguously deliver the desired insight. This is especiallyvalid given the nature of data available – e.g., we do not have experimental data, we do notfollow the same individuals over time, and information about labour market conditions at boththe household and local levels is limited.
Mindful of the limitations of any single test, it is appropriate to investigate the link betweenlabour markets and welfare outcomes from different perspectives. Specifically, we ask threecomplementary empirical questions to the data. The first is straightforward and asks whetherthere is any a priori evidence of labour market segmentation. Hereafter referring to the15Recall, the fundamental issue is whether the coexistence of poverty and labour market stagnation is attributableto labour market imperfections, as opposed to being symptomatic of other weaknesses, such as low levels ofhuman capital.
42

household’s labour allocation profile as its labour portfolio, suggestive evidence in favour of asegmentation hypothesis would be a combination of: (i) marked bunching of households intocorner solutions (single activities); and (ii) a clear welfare ranking of households compared acrossthese corner portfolios. Thus the key contribution is to use the observed labour time allocationof households (categorised into distinct portfolios) to define potential labour market segments.This is in contrast to defining segments according to an outcome such as income, which has beencommon in the literature (and a source of controversy).
The second step is to use the utility specification, as per equation (10), to consider the determi-nants of entry into different portfolios, which are now taken to represent potential labour marketsegments. Following Abowd and Killingsworth (1984) and others, the key question is whetherobservable household endowments (and preferences) consistently explain the choice of portfolio,as might be expected in a well-functioning labour market. Alternatively a range of externalfactors, including proxies for external labour market conditions, may be critical to explainingportfolio choices. Indeed, a wide literature (e.g., Stifel, 2010; Brown et al., 2006; Cunguara et al.,2011b) investigates jobs or livelihoods selection propensities to shed light on the principal pushand pull factors that underpin observed labour market patterns. Further details of how this isimplemented can be found in the next subsection.
Third, we look at the determinants of household consumption (household earnings-type equations)across different household portfolio types. A comparison of the estimated coefficients acrosspotential segments, as well as their relative explanatory power, provides insights into what islikely to be driving observed differences in welfare outcomes. Of particular interest is the degreeto which (marginal) returns to household endowments are equalised across portfolios, whichone would expect under a perfect labour markets scenario. As discussed extensively elsewhere(e.g., Heckman and Hotz, 1986), the magnitude and sign of differences in returns to humancapital (education and experience) across portfolios can shed light on the kind of labour marketimperfections that may be at play (if any).
5.3 Empirical strategy
Based on the above set of testable questions, we now discuss more specific details of empiricalimplementation. With respect to the delineation of potential portfolios, the starting point is toidentify the main types of labour activity undertaken by households. Following the discussionof Section 5.2, we isolate the following four broad types of activity: (AH) Family agriculture;(NH) Non-farm household or self-employed labour; (AW) Agricultural wage labour; and (NW)Non-farm wage labour. For each activity, a household is given the value of one if at least oneeconomically active member (of working age, defined as between 15 and 64) is engaged in this
43

activity as their primary occupation, and zero otherwise. At the extremes, a household that isnot employed in any activity receives a series of four zeros; at the other extreme, at least onefamily member is engaged in every type of activity.16 Based on an enumeration of all possibleactivity combinations, yielding (n = 24) unique categories, each household is then allocated toone of these portfolios. This provides a basis to analyse the prevalence of corner solutions, aswell as their comparative welfare ranking.
In order to model the determinants of entry into alternative portfolios (identified in the previousstep), assumptions must be made as to the form of equation (10) and the distribution of errorterms. A standard approach is to adopt a linear approximation; thus, for each portfolio (i ∈ P )the latent utility index can be empirically specified as:
Ui ≈ x′αi + z′βi + v′γi + ηi (11)
where x is a vector of household productive assets, including human and physical capitalendowments, z a vector of household characteristics (such as its available supply of labourand demographic composition) and v a vector of variables reflecting proxies for labour marketconditions. Under the assumption that ∀i ∈ P each respective ηi is normal and identicallyGumbel-distributed, the above specification can be estimated via a multinomial logit model,which focuses on estimating the contribution of these variables to the overall probability ofobserving a given household in each portfolio (for further details see Bourguignon et al., 2007).
Turning to the specific variables that enter on the RHS of equation (11), the vector of householdproductive assets includes measures of human capital and durable assets that plausibly enteraffect household production or wage rates. As the attributes of durable productive assets arenot measured in a consistent way across the surveys, we only use dummy variables reflectingownership (access to) agricultural land for crop or other form of cultivation, livestock, meansof transport, and communications technology (telephone, radio, TV). As the estimates areundertaken at the household level, choices must be made as regards how the human capitalvariables are specified. A variety of approaches are found in the literature; nonetheless we optfor the average work experience and years of education of all members of the household thatare currently working. Work experience for each individual is estimated as their reported ageminus their years of schooling minus 7. To capture possible non-linearities in these inputs (atthe household level), we include their square; also, to reflect the effect of differences in theintra-household distribution of these assets (e.g., a single very educated member), we includetheir standard deviation (which takes a value of zero if there is only one working householdmember). In order to capture the importance of the household head, who may be the primary16Note that we do not weight these different activities according to labour hours or numbers of household members.This would add substantial complexity to the analysis and is questionable given the quality of data available.Moreover, as discussed in Section 6, this is somewhat redundant given the prevalence of corner solutions.
44

earner of the household, we include variables capturing his/her the age, gender and literacy.
The variables included to capture the demographic composition of the household are as follows:the (logarithm of the) number of actual workers; their gender composition, measured as sharesof the household work force; the (logarithm of the) number of potential workers (i.e., anyoneaged 7 and above who is not working); the (logarithm of the) number of children aged under 7;and the overall dependency rate. It is important to note that these variables do not only reflecttaste shifters (preferences) over work, but those variables which refer to the number and type ofworkers in the household also are directly related to the household’s productive capacity.
With respect to the vector of proxies for local conditions, we include three sets of measures.The first seek to capture differences in local productive conditions, such as infrastructure andtransaction costs. To do so, we construct average measures of access to electricity, communicationstechnology and other public goods at the regional level. As we do not have separate community-level characteristics (for both rural and urban areas), these are generated from the (unweighted)average of relevant household asset dummy variables for each primary sampling unit (PSU) inthe survey (e.g., does the household use electricity?), from which we then calculate the averagefor all the PSUs in a given region. As the sample frame is representative at the regional level,these variables thus reflect proxies for regional averages of access to or penetration of these goodsand services.
The second set seeks to capture the diversity and thickness of the local labour market, includingthe availability of opportunities across the jobs portfolios we have defined. To do so, we calculatethe proportion of households engaged in each of the four portfolios at the regional level. Theseaverages are included directly in the specification (with ‘Ag’ excluded to avoid collinearity).From these average shares we also construct a Herfindahl concentration index, which takes avalue of one if all households in the region adopt the same portfolio. This can be read as a metricof the degree of labour market specialization in the region in which the household resides. Thethird set includes additional proxies for regional effects, namely the median wage rate and levelof consumption. These are included simply to reflect differences in overall living standards andcosts that are likely to map into differences in labour market conditions including on the labourdemand-side. It is important to note that all the above regional variables are time-varying acrossthe surveys, but would be absorbed by regional fixed effects if the analysis were undertaken foreach survey individually. Indeed, one advantage of pooling the surveys is that we can distinguishbetween these time-varying and ‘pure’ fixed effects. Thus, we also include dummy variables forthe regions employed, as well as dummy variables for each survey (in all cases excluding a basecategory).
Turing to the determinants of household consumption (welfare), an implication of the frameworkdeveloped herein is that, assuming households are sorted into unique labour market segments, the
45
income/consumption function for each household takes a different form for each portfolio. Forinstance, if a household is exclusively active in family agriculture, then the income/consumptionfunction can be seen as a household agricultural production function. However, if a household isexclusively active in wage labour, then the income/consumption function can be interpretedas a wage equation (of the Mincer sort). This underlines the relevance of investigating welfaredeterminants separately for each portfolio. However, as per the second step, it must be recognisedthat selection into each portfolios reflects a Roy-type sorting process which is not fully observed.In other words, welfare determinants must be investigated taking due account that they arepre-conditioned on labour market choices and possible imperfections, such as rationing.
Empirically, therefore, it is necessary to model the determinants of consumption in each of theseportfolios, correcting for potential selection bias. We do so by the semi-parametric generalizationof the Heckman correction proposed by Dahl (2002). This involves running the following empiricalspecification for each portfolio (i):
logWi = log(Ci/Z) = x′αi + z′1βi + v′1γi + µ(pj∈P ) + εi (12)
where W represents the welfare ratio aggregated to the household level (total household nominalconsumption C, divided by the poverty line, Z), z1 and v1 are subsets of the vectors in (11),thereby providing non-parametric identification of the model, and µ(pj∈P ) is an approximationto the expected value of the error term in the (uncorrected) consumption equation conditionalon the prior selection process. The approximation we use is a polynomial series expansion offitted probabilities from the multinomial logit step.17
Before proceeding to results, it is worth remarking on the choice of the household rather thanthe individual as the unit of analysis. Whilst labour market analysis in developed countrycontexts tends to be individualistic in nature, households tend to take centre stage in developingcountries. This is for two principal reasons. First, as shown in Section 3 for Mozambique, asubstantial portion of production is undertaken by household units, either on small farms orin informal household (micro) enterprises. In these cases, labour services are managed jointlyby the household rather than by the individual in a market. Indeed, the latter tends to bethe special case. Second, due to potential labour market imperfections (as discussed above)separability between production and consumption decisions should not be assumed a priori.Again, this points to focussing on pooled household-level decisions, rather taking individuals asindependent decision-makers.
Finally, the subsequent analysis is based on estimates from a single pooled cross-section of thethree surveys, including rural and urban areas. That is, we do not seek to provide survey- or17Further details available on request from the authors.
46

area-specific estimates. While the pooling assumption may be debatable, the Stylized Factsindicate broad stagnation in the labour market over time. Also, as the data is noisy andpotentially subject to year-specific shocks, the larger number of observations helps more preciseidentification of parameters. Correspondingly, then, the estimates should be considered asparameter averages covering the past 15 years rather than being specifically relevant to anysingle point in time. However, to absorb time-invariant fixed effects, region- and survey-specificdummy variables are included in all regressions (not shown).
47
6 Results
6.1 A typology of jobs portfolios
Taking the three household living standards surveys together (i.e., pooled), we start by enumer-ating all possible household jobs portfolios based on four distinct types of activity (AH; NH;AW; NW; see Section 5.3), the relevance of which can be ascertained from the earlier descriptiveanalysis. The results are summarised in Table 11, which places the portfolios in order from mostto least prevalent and provides summary statistics of consumption and asset poverty rates forhouseholds in each unique category (combination of activities).18
Two main points can be taken from the table. First, the vast majority of households are activein only one type of activity. That is, they appear to have adopted a corner solution in theportfolio space. By far the predominant portfolio is family agriculture, representing almost 53%of all households in the surveys (unweighted). Together such corner solutions, or single-activityportfolios, are pursued by 68% of households. Whilst the remaining households are active inmore than one activity, it remains the case that less than 2% of households are engaged in 3or more activities. Second, large welfare differences are associated with alternative portfoliochoices. The starkest difference is between a pure family agriculture portfolio (first row) anda pure non-agricultural wage portfolio (third row). On both metrics, a household adoptingthe latter portfolio is at least half as likely to be poor. Similarly, non-farm household workalso performs considerably better in welfare terms compared to pure family agriculture. Thiscombination of: (i) a substantial concentration of households in single-activity jobs portfolios;and (ii) a clear welfare ranking of such portfolios, is potentially consistent with the conceptualframework developed in Section 5, whereby labour market distortions ration households outof preferred labour market choices. However, this is not the only plausible explanation. Forexample, differences in household endowments, such as education, may well be driving theobserved sorting process such that it is not labour market imperfections per se that play acritical explanatory role.19
On this basis, it is appropriate to continue to the next step of the analysis. To do so it is helpfulto simplify (collapse) the portfolio space from 16 to a smaller number of distinct jobs portfolios.We select four, reported in the final column of Table 11, which are denoted by the following18Consumption poverty rates are the official national poverty numbers calculated from the same surveys; Assetpoverty is a multidimensional index on the form of Alkire and Foster (2011) where a household is deemed poorit is deprived in more than 5 of 7 dimensions, which cover human and physical asset ownership at the householdlevel.
19Imagine that household’s choose to undertake wage labour at a rate that reflects their productive capacity. Ifthese productive capacities are very low, the corresponding wage offer may also be very low, meaning that theyare indifferent between wage labour and (low-productivity) household agricultural production. In this case, then,the observed sorting pattern would substantially reflect low levels of human capital (e.g., in the rural economy).
48

Table 11: Enumeration of household jobs portfolios, based on four activitytypes
Activity types Poverty rates
% obs. Activities AH NH AW NW Consump. Asset Portfolio
52.66 1 1 0 0 0 63.8 87.5 Ag13.43 2 1 1 0 0 57.1 74.9 AgNf9.28 1 0 1 0 0 51.6 55.7 NfE7.13 2 1 0 0 1 56.4 47.2 AgNf6.19 1 0 0 0 1 37.1 16.2 NfW4.23 2 0 1 0 1 44.5 19.2 NfE3.10 0 0 0 0 0 49.3 57.8 -1.41 2 1 0 1 0 68.0 76.8 Ag1.31 3 1 1 0 1 56.3 39.9 AgNf0.38 3 1 1 1 0 66.1 56.8 AgNf0.29 1 0 0 1 0 58.5 56.1 Ag0.24 2 0 1 1 0 45.9 47.4 AgNf0.13 3 1 0 1 1 41.0 34.3 AgNf0.08 4 1 1 1 1 34.0 31.7 AgNf0.07 3 0 1 1 1 53.2 60.9 AgNf0.06 2 0 0 1 1 64.3 9.5 AgNf
Notes: activity types are household (family) agriculture (AH), household non-farm occupations(NH), wage labour in agriculture (AW), and non-farm wage labour (NW); ‘% obs.’ gives theproportion of households from the pooled series of household surveys (1996/97, 2002/03 and2008/09) which correspond to the specific combination of activities enumerated in each row;‘Activities’ indicates the number of unique activities in which the household is engaged, rangingfrom zero to four; consumption and asset poverty rates for each group of households arereported in the third- and second-to-last columns; ‘Portfolio’ maps each unique combinationof activities to a summary category (see text for description).Source: authors’ calculations from household survey series.
49
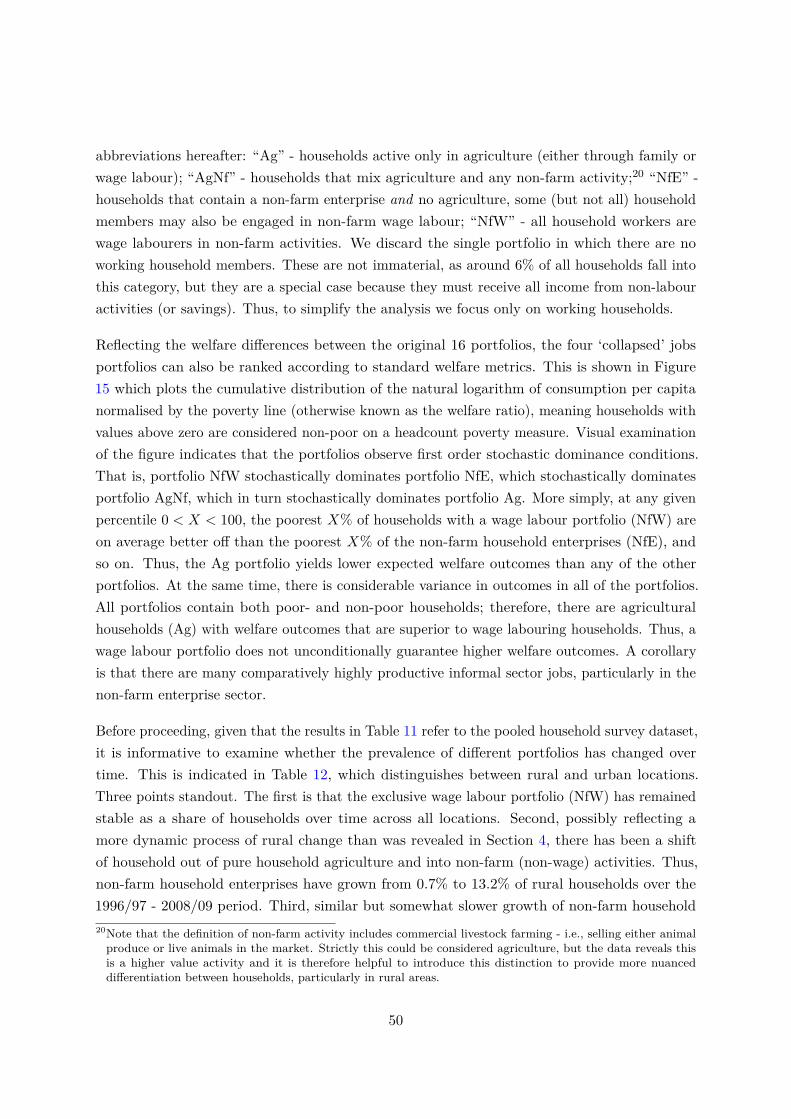
abbreviations hereafter: “Ag” - households active only in agriculture (either through family orwage labour); “AgNf” - households that mix agriculture and any non-farm activity;20 “NfE” -households that contain a non-farm enterprise and no agriculture, some (but not all) householdmembers may also be engaged in non-farm wage labour; “NfW” - all household workers arewage labourers in non-farm activities. We discard the single portfolio in which there are noworking household members. These are not immaterial, as around 6% of all households fall intothis category, but they are a special case because they must receive all income from non-labouractivities (or savings). Thus, to simplify the analysis we focus only on working households.
Reflecting the welfare differences between the original 16 portfolios, the four ‘collapsed’ jobsportfolios can also be ranked according to standard welfare metrics. This is shown in Figure15 which plots the cumulative distribution of the natural logarithm of consumption per capitanormalised by the poverty line (otherwise known as the welfare ratio), meaning households withvalues above zero are considered non-poor on a headcount poverty measure. Visual examinationof the figure indicates that the portfolios observe first order stochastic dominance conditions.That is, portfolio NfW stochastically dominates portfolio NfE, which stochastically dominatesportfolio AgNf, which in turn stochastically dominates portfolio Ag. More simply, at any givenpercentile 0 < X < 100, the poorest X% of households with a wage labour portfolio (NfW) areon average better off than the poorest X% of the non-farm household enterprises (NfE), andso on. Thus, the Ag portfolio yields lower expected welfare outcomes than any of the otherportfolios. At the same time, there is considerable variance in outcomes in all of the portfolios.All portfolios contain both poor- and non-poor households; therefore, there are agriculturalhouseholds (Ag) with welfare outcomes that are superior to wage labouring households. Thus, awage labour portfolio does not unconditionally guarantee higher welfare outcomes. A corollaryis that there are many comparatively highly productive informal sector jobs, particularly in thenon-farm enterprise sector.
Before proceeding, given that the results in Table 11 refer to the pooled household survey dataset,it is informative to examine whether the prevalence of different portfolios has changed overtime. This is indicated in Table 12, which distinguishes between rural and urban locations.Three points standout. The first is that the exclusive wage labour portfolio (NfW) has remainedstable as a share of households over time across all locations. Second, possibly reflecting amore dynamic process of rural change than was revealed in Section 4, there has been a shiftof household out of pure household agriculture and into non-farm (non-wage) activities. Thus,non-farm household enterprises have grown from 0.7% to 13.2% of rural households over the1996/97 - 2008/09 period. Third, similar but somewhat slower growth of non-farm household20Note that the definition of non-farm activity includes commercial livestock farming - i.e., selling either animalproduce or live animals in the market. Strictly this could be considered agriculture, but the data reveals thisis a higher value activity and it is therefore helpful to introduce this distinction to provide more nuanceddifferentiation between households, particularly in rural areas.
50
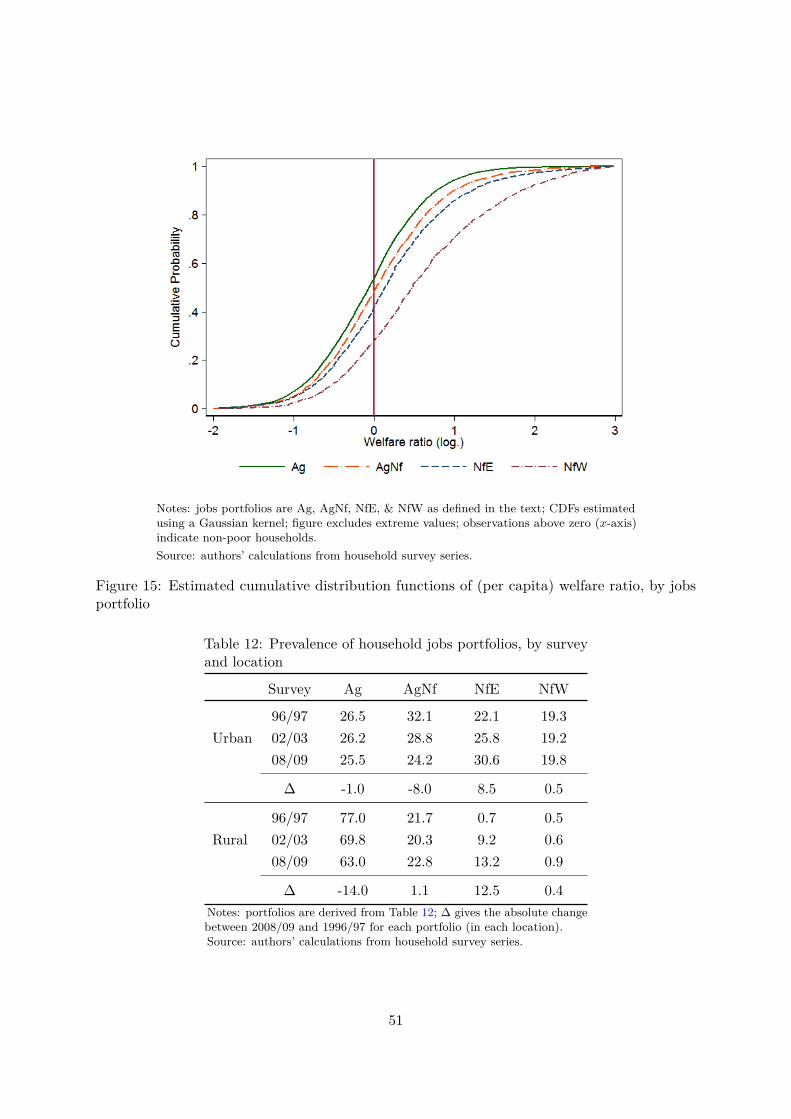
Notes: jobs portfolios are Ag, AgNf, NfE, & NfW as defined in the text; CDFs estimatedusing a Gaussian kernel; figure excludes extreme values; observations above zero (x-axis)indicate non-poor households.Source: authors’ calculations from household survey series.
Figure 15: Estimated cumulative distribution functions of (per capita) welfare ratio, by jobsportfolio
Table 12: Prevalence of household jobs portfolios, by surveyand location
Survey Ag AgNf NfE NfW
Urban96/97 26.5 32.1 22.1 19.302/03 26.2 28.8 25.8 19.208/09 25.5 24.2 30.6 19.8
∆ -1.0 -8.0 8.5 0.5
Rural96/97 77.0 21.7 0.7 0.502/03 69.8 20.3 9.2 0.608/09 63.0 22.8 13.2 0.9
∆ -14.0 1.1 12.5 0.4Notes: portfolios are derived from Table 12; ∆ gives the absolute changebetween 2008/09 and 1996/97 for each portfolio (in each location).Source: authors’ calculations from household survey series.
51

enterprises also has been registered in urban areas, meaning they now represent the portfolio ofchoice for almost a third of all urban households. This underpins the importance of discardingthe view that the informal sector is only comprised of homogenous, low-productivity activitiesbut rather can be an important source of growth and dynamism.
6.2 Selection into jobs portfolios
Retaining the focus on the four main jobs portfolios (potential segments) retained in the previoussection, we perform the multinomial logit analysis based on the latent utility specification inequation (11). Motivated by the simulation-type approaches employed elsewhere (e.g., Abowdand Killingsworth, 1984), we estimate alternative models, applying different restrictions on the setof included explanatory variables. This helps to gauge which sets of explanatory variables drivechanges in the estimated probability of a household choosing a specific portfolio. Specifically,we build-up sequentially to the full model and estimate portfolio selection propensities for themodel: (I) including specific taste shifters, rural/urban location and survey dummy variables;21
(II) adding human capital variables (experience and education); (III) adding household physicalcapital assets; (IV) adding the full set of demographic composition variables (number of workersand gender ratios); and (V) adding the set of external conditions including location dummies,thereby giving the full model.22
For each of these models (I)-(V), Table 13 reports the share of households in each segment thatare allocated correctly, meaning that the portfolio given the highest probability under the modelcorresponds to the household’s actually observed segment (and this probability is at least 50%).The results from this exercise are highly informative. The first point to note is that even the mostrestrictive model correctly allocates virtually all (≈ 90%) pure agricultural households (Ag) tothe correct labour market portfolio. This is hardly surprising – this portfolio is the most prevalentin the data (in each survey), and is especially dominant in rural areas. However, the fact thatthe inclusion of other variables (models II onwards) does not alter the goodness of fit for thiscategory, but does for the portfolios, indicates that allocating all labour to agriculture essentiallyamounts to a residual or default strategy. This is would imply that household agriculture remainsa low-productivity, low-returns activity and is one which households prefer to exit if they canaccumulate human and physical capital assets to engage in off-farm work.
Turning to the other portfolios, the fundamental insight from the table is that the inclusion21These taste shifters are access to non-labour income, the number of children under 7, and the dependency rate.22Note that the results from this procedure are sensitive to the order in which the variables are added. Nonetheless,the order of inclusion is motivated by our interest in identifying whether household endowments (and preferences)are sufficient to explain observed portfolio choices, or whether external constraints are also important. Thus,the latter variables enter last.
52

of human capital variables (model II) is most informative for the choice of (pure) wage labourportfolio, yielding a large jump in the goodness of fit measure for this category (from 28% to54%). That is, education or experience represent critical pre-conditions for securing wage work.In contrast, ownership of specific productive assets (model III) appears to be a more criticalprecondition for both of the household enterprise portfolios that include non-farm activities (AgNfand NfW). This may be symptomatic of the existence of asset accumulation traps, whereby (Ag)households are simply unable to generate sufficient savings (or gain access to credit) that enablethem to purchase productive equipment and move into higher-returns non-farm work. Additionof the remaining variables (models IV and V) generates minimal changes in all categories, theexception being the addition of demographic variables for the pure wage portfolio. Overall,this suggests that observable household endowments explain the bulk of labour market sortingpatterns in Mozambique. This does not discount the existence of labour market challenges,but in the minimum suggests that any such challenges are correlated with average endowmentsin different portfolios. A candidate example would be the restriction of (new) wage labouropportunities to those above specific education thresholds (discussed further below).
Table 13: Goodness of fit estimates for alternative utility function specifica-tions (models), by portfolio
Model
Portfolio I II III IV V
Ag 88.4 91.7 88.9 89.1 89.8AgNf 19.3 26.4 38.6 40.3 42.1NfE 21.9 17.0 36.0 38.8 43.8NfW 27.9 54.1 53.4 63.8 63.0
ALL 59.4 63.9 67.7 69.2 70.7
F-stat. 89.0 87.9 87.3 72.0 52.5prob. 0.00 0.00 0.00 0.00 0.00Notes: portfolios are as described in the text, see Table 11; for each portfolio (and allhouseholds), cells indicate the proportion of households observed to have selected thatportfolio that are predicted to do so by a given multinomial logit model (columns I-V);multinomial logit models build-up the specification sequentially; column (I) includes onlyspecific taste shifters, rural/urban location and survey dummy variables; col. (II) addshuman capital variables; col. (III) adds household physical capital assets; col. (IV) addsthe full set of demographic composition variables; and col. (V) adds the set of externalconditions including location dummies, yielding a full model; final two rows report overallmodel summary statistics.Source: authors’ calculations from household survey series.
The results from the preceding analysis can be refined by a more detailed review of the resultsfrom the full model (V). These are summarised in Table 14, showing only a selection of the
53

Table14
:Su
mmaryof
multin
omiallog
itestim
ates,b
ypo
rtfolio
Rural
Urban
Ag
AgN
fNfE
NfW
Ag
AgN
fNfE
NfW
Hou
seho
ldhead
female
-0.02
-0.04***
0.05***
0.01***
-0.02***
-0.07***
0.03*
0.06***
Hou
seho
ldhead
literate
-0.04***
0.03***
0.01
0.00***
-0.03***
0.01
-0.03*
0.05***
Logworking
mem
bers
-0.02
0.06
-0.01
-0.02***
0.01
0.10***
0.15***
-0.27***
Logno
n-workers
(>6)
-0.09***
0.08***
0.02
0.00
-0.06***
0.06***
0.02
-0.02
Adu
ltmales
(%workers)
-0.15***
-0.01
0.14***
0.02***
-0.14***
-0.11***
0.06
0.18***
Youn
gmales
(%workers)
-0.12***
-0.06**
0.16***
0.02***
-0.12***
-0.15***
0.11***
0.16***
Adu
ltfemales
(%workers)
0.01
-0.05**
0.04**
0.00
0.00
-0.07***
0.06*
0.00
Expe
rience
0.00
0.00
0.00
0.00
0.00
0.00
0.00
0.00
Expe
riencesqua
red
0.00
0.00
0.00
0.00
0.00
0.00
0.00
0.00
Education
-0.02***
0.02***
0.00
0.00
-0.02***
0.02***
-0.01
0.01
Educationsqua
red
-0.00*
0.00
0.00***
0.00***
-0.00**
-0.00*
0.00
0.00***
Asset:radio
-0.03***
0.02***
0.00
0.00
-0.02***
0.02*
0.00
0.01
Asset:teleph
one
-0.05***
0.01
0.04***
0.00***
-0.04***
-0.01
0.03*
0.03***
Asset:land
-0.03
0.09***
-0.06***
-0.00**
-0.01
0.11***
-0.08***
-0.02
Asset:liv
estock
-0.40***
0.17***
0.23***
0.00**
-0.29***
0.03***
0.30***
-0.04**
Asset:tran
sport
-0.04***
0.06***
-0.02**
-0.00***
-0.02***
0.06***
-0.01
-0.03***
Non
-labo
urincome
0.00
0.00
0.01
-0.00***
0.00
0.00
0.03**
-0.04***
Region:
access
totran
sport
0.10
-0.02
-0.08
0.00
0.07
0.01
-0.16
0.08
Region:
access
toelectricity
-0.42**
0.18
0.25**
0.00
-0.30**
0.06
0.39**
-0.15
Region:
access
toradio
-0.02
-0.13
0.16**
-0.01
-0.02
-0.16*
0.33***
-0.15**
Region:
%AgN
fhou
seho
lds
-0.62***
0.68***
-0.08
0.02**
-0.41***
0.56***
-0.36*
0.22**
Region:
%NfE
households
-0.81***
0.18
0.63***
0.00
-0.60***
-0.13
0.89***
-0.16
Region:
%NfW
households
-0.19
0.31**
-0.15
0.04***
-0.16
0.24
-0.56**
0.48***
Region:
specializ
ation
0.04
0.14
-0.19**
0.01
0.04
0.18*
-0.39***
0.17*
Rural
(dum
myvaria
ble)
-0.05
0.00
0.06*
-0.00*
-0.03
-0.02
0.13***
-0.08**
Obs.(A
ME)
5,256
5,256
5,256
5,256
4,682
4,682
4,682
4,682
Notes:thetablerepo
rtsaverag
emargina
leffe
cts(A
MEs
)calculated
forurba
nan
drurals
ubgrou
pssepa
rately,b
ased
onthesame
unde
rlying
regression
estim
ates;for
each
jobs
portfolio
indicated(colum
ns),
only
househ
olds
includ
edin
the2008/09survey
are
employed
tocalculatetheAMEs;
selected
coeffi
cients
show
n;stan
dard
errors
accoun
tforsurvey
design
(e.g.,clusterin
getc.).
Source:au
thors’
calculations
from
househ
oldsurvey
serie
s.
54

coefficients.23 To aid interpretation, the table reports average marginal effects (AMEs), whichare the sample average of individual marginal effects for chosen subgroups. In the present case,the subgroups we choose are distinguished between rural and urban locations (thus reportedseparately). Also, for each portfolio and location, we focus only on households in the samplefrom the latest survey round.
What do these results tell us? Consistent with earlier results, as well as the welfare rankingof portfolios (Section 6.1), a key finding is that there are few factors that pull households intothe agriculture portfolio (Ag) in the sense of making it an attractive, positive choice. Rather,ownership of assets (e.g., education, livestock, telephone, transport) reduces the propensity ofhouseholds to choose pure agriculture. We also see that larger households, and particularlythose with more male workers (either adult or youth), are less likely to prefer to adopt thisportfolio. A new insight is that the proxies for local labour market conditions appear to exerta comparatively strong influence on the likelihood of choosing an agricultural portfolio. Smallincreases in the proportion of households engaged in other portfolios, which can be interpretedas proxying an increase in the availability of outside opportunities, drives down the propensityto choose a pure agriculture portfolio. For example, a 10% point increase in the proportion ofhouseholds engaged in a non-farm enterprise reduces the propensity to select the Ag portfolio byaround 8% points in rural areas, and 6% points in urban areas. This again indicates that theAg portfolio often is a default or residual choice, driven both by low levels of asset accumulationbut also by a scarcity of outside options including low levels of local economic diversification.
As expected with respect to the other portfolios, the greater the share of households in theregion that are observed in a given portfolio, the higher the propensity for any given householdto choose the same. This is consistent with spatial concentration of labour (see Stylized Fact 7)as well as with peer-effects such as imitation and social learning. Interactions between portfoliosare also relevant. For example, in urban areas the more wage jobs there are, the lower is thepropensity for households to run a household enterprise. This suggests that the latter may be aconstrained response where wage work is scarce. External factors are also material in the guiseof local productive conditions (regional measures of access to transport etc.). These exert astrong positive effect on the propensity to select the NfE portfolio, suggesting that there can beparticularly large benefits to household enterprises from (higher quality) public infrastructuresuch as electricity and communications.
Concerning the results for the other portfolios, a few points can be highlighted. Gender anddemographic variables affect the propensity to select all the portfolios, in both rural and urbanareas, but in a relatively complex way. In urban areas, having a larger household works infavour of selecting either the AgNf or NfE portfolios but works against selecting against the NfW23Full details available on request from the authors.
55

portfolio. This could be indicative of various mechanisms including high urban transport andhousing costs that push larger families out of the urban core (where wage opportunities are moreprevalent) and into the urban periphery, but also that access to a high quality wage job canallow extended, multi-generation households to split into their respective core family units ratherthan pool their labour and household costs. With respect to gender, there is a clear tendencyof young males to prefer non-farm work, particularly in urban areas where wage work (andother non-farm) opportunities appear to be strongly skewed towards men. One explanation forthis effect is that as household duties such as childcare tend to fall exclusively on Mozambicanwomen, this can limit their availability to pursue fulltime work outside the home (unless theycan afford to hire-in a child carer, which is very common among better-off households).
Human capital also affects the portfolio choice propensities in different ways. For the (higherwelfare) NfE and NfW portfolios, education tends to exhibit a profile that is convex to theorigin, meaning that the value of an additional year of education is larger the more education thehousehold already has (on average). More straightforwardly, low levels of education have a smallpositive effect on the propensity to select a non-farm portfolio. Due to the non-linearity in theseestimates, it is only at higher levels of education that these propensities are more substantial,which is indicative of entry-thresholds as well as higher technological requirements in theseportfolios. Experience, in contrast, has no effect on portfolio choices.
The evidence of this section leads to two main conclusions. First, observed household endowmentsof human and physical capital play a fundamental role in observed labour market sorting patterns.Accumulation of human and and physical capital assets are key predictors of engagement innon-farm work. Thus, we cannot ascribe Mozambique’s absence of labour market transformationpurely to labour market distortions. However, and second, external labour market conditions domatter. In particular, there is evidence that opportunities to pursue non-farm work are limitedby scarce outside options and a lack of access to public goods. This close linkage between (lowproductivity) agriculture, weak external conditions and persistent poverty is indicative of theoperation of poverty trap mechanisms of some kind.
6.3 Conditional determinants of welfare
The previous subsection considered the determinants of selection into different labour marketsegments. The next step is to investigate whether these choices have material welfare implications.Following the methodology outlined in Section 5, observed welfare outcomes are determined onlabour market choices which may or may not be subject to constraints. Thus, due account mustbe made of (unobserved) and prior labour market sorting processes. To do so, we run separateregressions of the determinants of welfare for each of the four portfolios, where the dependent
56

variable is the natural logarithm of the welfare ratio (total household consumption dividedby the poverty line).24 To address selection bias we include a polynomial expansion of fittedprobabilities from the multinomial logit analysis (a type of first stage regression) as additionalexplanatory variables. Non-parametric identification of the model is achieved by excluding asmall number of variables used in the first stage from this second or outcome stage regression.The variables excluded are explicitly chosen as they are expected to uniquely affect the priorchoice of labour allocation (jobs portfolio) but should not have a direct effect on householdreturns. Specifically, variables excluded from the second stage regression are certain householdcharacteristics regarding non-workers (specifically, the number of children aged under 7 and thedependency ratio) as well as the second and third sets of the labour market conditions proxies.However, we include the Herfindahl concentration index, as there may be pecuniary externalitiesassociated with the extent of labour market specialization.
The results of these regressions are reported in Table 15, which again focuses only on selectedcoefficients.25 As suggested from the previous step, demographic composition matters. Asexpected, additional household workers directly increase household consumption. The coefficientson ‘log working members’ in fact provide direct estimates of productivity differences betweenalternative portfolios, holding all other effects fixed – being approximately equivalent to the effectof a young female member of the family with no education or prior labour market experienceentering the work force. We see that for the agriculture portfolio (Ag), the addition of one moreworker increases the log welfare ratio by 0.17 points, which is the lowest of all portfolios; thehighest contribution is in non-farm household enterprises (NfE) where the log welfare ratio isexpected to increase by 0.56 points (these coefficients are also the elasticity of consumption withrespect to workers in different portfolios). However, with the exception of Ag, there is in factno statistical difference between the coefficients on the number of workers across the remainingportfolios. This would suggest that there is no unconditional benefit from choosing the wagelabour portfolio relative to other non-farm portfolios. Put differently, informal activities can beequally productive as wage labour.
Other demographic effects are relevant. The contributions of non-working members, which canbe interpreted either as a time effect on existing workers or a direct (unpaid) contribution ofthese members, is positive in most cases, but generally lower than the contribution of workingmembers. The exception is the Ag portfolio where the two effects are approximately the same(statistically speaking), which is again indicative of low returns in agriculture per se. We alsosee a negative effect of a larger share of young men in the household work force (relative to a24In order to clearly model the relationship between demographic composition (e.g., number of workers) andhousehold consumption, we do not normalise household consumption by household size ex ante. Rather, we letthe data speak for itself. However, for ex post poverty calculations we adjust for household size by dividingtotal estimated household consumption by the number of household members.
25Full results are available from the authors on request.
57

Table 15: Selection-bias corrected analysis of welfare determinants, by jobs portfolio
Ag AgNf NfE NfWI II III IV
Household head female -0.04 -0.10** 0.07 0.04(0.02) (0.04) (0.05) (0.07)
Household head literate 0.05** 0.05 0.17*** 0.27***(0.02) (0.04) (0.05) (0.07)
Log working members 0.17*** 0.48*** 0.56*** 0.51**(0.06) (0.09) (0.08) (0.21)
Log non-workers (>6) 0.28*** 0.34*** 0.31*** 0.17***(0.02) (0.04) (0.04) (0.04)
Young males (% workers) -0.28*** -0.23** 0.09 -0.00(0.06) (0.11) (0.09) (0.13)
Experience 0.00 0.01* 0.03*** 0.02**(0.01) (0.01) (0.01) (0.01)
Experience squared -0.00 -0.00 -0.00 -0.00(0.00) (0.00) (0.00) (0.00)
Education -0.01 0.06*** 0.03 0.03(0.01) (0.02) (0.02) (0.03)
Education squared 0.00 0.00 0.01*** 0.00***(0.00) (0.00) (0.00) (0.00)
Asset: radio 0.13*** 0.19*** 0.07 0.02(0.02) (0.03) (0.04) (0.04)
Asset: telephone 0.31*** 0.47*** 0.58*** 0.48***(0.05) (0.05) (0.04) (0.05)
Asset: transport 0.20*** 0.26*** 0.27*** 0.40***(0.03) (0.03) (0.04) (0.05)
Region: access to transport 1.28*** 0.90*** 0.56 0.18(0.18) (0.28) (0.38) (0.44)
Region: access to electricity 0.01 -0.97* 0.06 1.41***(0.42) (0.52) (0.47) (0.54)
Region: specialization -0.45** -0.29 0.46 1.30***(0.22) (0.29) (0.31) (0.40)
Obs. 13,632 5,358 3,968 2,828F-stat. 50.56 33.57 34.22 30.97R2 0.29 0.37 0.48 0.49Human capital terms (prob.) 0.00 0.00 0.00 -Selection bias terms (prob.) 0.00 0.01 0.10 0.03Notes: columns report selected coefficients from separate OLS regressions for determinants of thelog. welfare ratio (total nominal household consumption / poverty line) for each observed householdjobs portfolio; selection bias terms, generated from results in Table 14, are included but not shown;however, their joint significance is reported in the final row; standard errors in parentheses reflectthe survey design.Source: authors’ calculations from household survey series.
58
base case that all workers are young women), but this occurs only in the portfolios involvingagricultural work (Ag and AgNf). This is consistent with evidence found elsewhere in Africa ofan absence of role models for young men in agriculture, meaning it is frequently perceived asa low status, undesirable occupation (reflecting its low average level of productivity) in turnleading to a low labour contribution – e.g., as they search for other jobs elsewhere.
Additionally, returns to durable assets and local (public) goods vary across the portfolios,reflecting their differential relevance. Notably, access to transport generates substantial returnsin the agricultural portfolios – indicative of the key role of rural infrastructure to address lowagricultural productivity. However, returns to electricity are highest in wage jobs, which may bedue to the location of higher quality wage jobs in locations with better infrastructure. Similarly,there are agglomeration benefits in wage work. This is revealed by the positive coefficient on theHerfindahl concentration index. Given the considerable spatial concentration in jobs portfolios(see Stylized Fact 7), an interpretation is that where there is a thicker wage labour market,average real wages tend to be higher. On the contrary, in agriculture (Ag), the greater theconcentration in portfolios (i.e., of other Ag households) the lower the average returns. Again,this is indicative of low productivity, (spatial) poverty trap processes in rural areas.
Returning to the hypothesis of labour market segmentation (see Section 5), it is helpful to testfor the equality of coefficients on the core human capital variables across the portfolios. Takingthe wage portfolio as the reference (recall that the under a null hypothesis of no segmentation,the shadow price of labour is equal to the market wage), the penultimate row of Table 15reports joint Wald tests for coefficient equality on the human capital terms.26 The differencesare statistically highly significantly, indicating that labour’s marginal product is not equalisedacross portfolios or that labour market constraints are likely to operate in some form. Lookingmore closely, the pure agricultural portfolio shows zero returns to experience and zero returns toeducation. In the mixed agricultural and non-farm portfolio (AgNf), we find relatively robustlinear returns to education (6% increase in household consumption for each additional averageyear of education among the household’s workers) and experience. Among non-farm householdenterprises, there returns to experience are higher (and linear), but returns to education areconcave. For wage labour, we also find (slightly lower) concave returns to education but alsolinear returns to experience.
To get a better sense of these differences with respect to education, Figure 16 plots the resultingprofile of returns to education for each of the different portfolios based on the estimatedcoefficients (statistically insignificant coefficients are given a zero). Importantly, this takes intoaccount any trade-off between experience and education, as per the definition of experiencedescribed in Section 5.3. Specifically, then, the incremental return to years of schooling (s) in26These are the number of workers, their gender composition and the experience and education terms).
59

portfolio i is calculated as:
ri = α1is+ α2is2 + β1i(7− s) + β2i(7− s)2 (13)
and where the parameters are taken from the corresponding regression estimates and the finaltwo terms assume potential labour market experience of 7 years (before schooling). At zeroyears of schooling the difference between the portfolios thus represent pure differences in returnsto experience – these are small but are zero for the agricultural portfolio. Moving along thex-axis simulates the expected impact from additional years of education and thus fewer yearsof accumulated experience. The flat profile of most portfolios in the figure at low levels ofeducation (less than around 7 years, or a full primary education), thus indicates that effectivereturns to an additional year of education are close to zero. Alternatively, there is no trade-offbetween schooling and experience at these levels. Equally, fixing all other coefficients to bethe same, there is no particular advantage for an agricultural household with a relatively lowlevel of education to adopt the wage portfolio. The exception is the AgNf portfolio – its linearreturns schedule in schooling and low returns to experience ensures that even small investmentsin education payoff. However, at higher levels of education, the exclusively non-farm portfoliosbecome superior; and non-farm enterprises yield the highest returns after approximately theconclusion of secondary school. This supports the view that not all informal activities generatelow returns; nonetheless, outside of agriculture, more substantial welfare benefits only tend toaccrue beyond primary school.27
Finally, it is worth remarking that the estimates on the variables included to address selectionbias are (jointly) significant for all portfolios excluding NfE. This is reported in the final row ofTable 15, also based on a joint Wald test. In the three cases where they are significant, coefficientson the remaining variables are not equivalent in regressions including and excluding the selectionbias terms. Overall, therefore this analysis supports the conclusion that Mozambique facessignificant challenges in the structure of its labour markets. On the one hand, the majorityof labour is found in low-productivity, low-returns agriculture. This is explained both by lowlevels of accumulation of human and physical assets, but also by the absence of wage offers tounskilled labour. That is, the evidence is strongly suggestive of labour market sorting accordingto education and productive asset thresholds (which enable access to non-farm activities). Onthe other hand, where they are available, non-farm informal jobs are crucial sources of dynamismand growth.
The findings of this section therefore echo those of Section 6.2. On the one hand, materialdifferences in expected welfare outcomes between households can be traced to differences in27The finding of low returns to schooling in low productivity sectors, such as agriculture, is not new and accordswith previous research for low income countries, including those in Africa. See, for example Gurgand (1997);Pritchett (2001); Weir and Knight (2007).
60

Notes: jobs portfolios are Ag, AgNf, NfE, & NfW as defined in the text; estimates based on theeducation and experience regression coefficients shown in Table 15 for the mean working age in thesample; statistically insignificant coefficients valued at zero; dependent variable is the log welfareratio; vertical lines represent the conclusion of primary and secondary schools (7 and 12 yearsrespectively).Source: authors’ calculations from household survey series.
Figure 16: Estimated incremental returns to education, by jobs portfolio
their endowments (correcting for selection bias). Very low levels of education in particularlimit the ability of households to gain from any kind of activity. Thus, inefficiencies in factorallocation cannot explain the persistence of poverty in Mozambique. On the other hand, labour’smarginal product is not equalised across activities and external labour market conditions matter.Demand-side constraints appear to be most material, which is consistent with the findingsof a very low marginal product of labour in agricultural activities relative to other activities.Additionally, the evidence here underlines the existence of productive and dynamic informalsector jobs, particularly in non-farm enterprises, where returns to education can be very high.
61

7 Jobs simulations
7.1 Methodology
To provide additional guidance as to the policy implications of our analysis, we now move to asimple set of simulations. These are useful because the regression coefficients estimated in Section6.3 do not (directly) indicate the expected aggregate welfare impacts associated with eitherindividual or joint changes in the explanatory variables (e.g., changes in endowments or returnsto these endowments). Put differently, the regression analysis does not indicate the welfarecosts associated with labour market imperfections that we see in the data, such as demand-sideconstraints. Consequently, simulations can be useful to think through the implications for welfareof loosening some of these labour market imperfections, albeit in a highly stylized fashion. Inother words, such simulations allow us to answer the important question: if households were(freely) able to sort into that jobs portfolio which yielded the highest economic returns, whatwould be the first-order effect on social welfare?28
In order to implement these simulations we proceed as follows: first, for each household inthe sample, we predict the expected value of the log welfare ratio under each alternative jobsportfolio (including the observed portfolio). These are just the predictions from the estimatedwelfare outcome regressions, based solely on their deterministic terms corrected for selection bias.Next, we compare these expected values across portfolios. If the highest value is associated withthe household’s observed portfolio, then we conclude the household has no incentive to switchjobs. However, if the largest expected value is significantly greater than the expected value underthe observed portfolio (i.e., taking into account variation in the estimated regression coefficients),we say that the household would prefer to move to this alternative portfolio.29 On this basiswe can calculate aggregate welfare in three alternative regimes. Under the first regime thehousehold is allocated the predicted value from the regression associated with its observed regime,(the in-sample predictions), which corresponds to labour market imperfections remaining fixed.Under a second regime we take the expected value of consumption permitting all households toswitch who wish to do so (as per the above conditions) – this is denoted ‘flexible’ and can beread as an upper limit on the potential benefits that may accrue to addressing labour marketconstraints.30 Finally, as a middle ground, we allow 20% of households who wish to switch to do28The effects are first-order in nature as they do not take into account general equilibrium effects, such as changesin the returns to different activities, which would be expected to move with shifts in labour supply.
29The underlying assumption here is that preferences for leisure are unchanged such that we assume there is nochange in the household composition or allocation of members to work/non-work under different portfolios.Consequently, under standard properties of a general utility function, more consumption is preferred to lessand utility is strictly increasing in consumption. A further assumption is that households do not factor in anychanges in aggregate labour market conditions (i.e., general equilibrium effects), such that observed returns inother portfolios are assumed to hold.
30Households which prefer not to switch are allocated the expected consumption under the fixed regime.
62

so, selected as those with the greatest distance between expected consumption under the fixedand flexible regimes (thereby having the highest incentives to switch). To each expected value(in each regime) we add a white noise error term to reflect unexpected, stochastic determinantsof household consumption such as health or weather shocks. These are based on the standarddeviation of the in-sample residuals from the original outcome regressions. From these totalfitted values we can calculate a variety of welfare metrics, including headcount poverty rates aswell as inequality measures. For simplicity, we focus only on the headcount poverty rate here.
The above simulations refer to changes in labour market conditions and, specifically, the abilityof households to adopt potentially welfare-improving jobs portfolios. As a complement, we alsoinclude a set of more specific policy measures aimed directly at the agricultural sector where,as we have seen, welfare generally is lowest. In each case the policy scenarios are implementedeither by making alterations to household characteristics, or by fixing the regression coefficientsat (preferred) values. Based on these changes, alternative predicted values for the welfaremeasure are generated. Four different policy scenarios are run, these are: (1) “baseline” – nochanges to household characteristics or regression coefficients; (2) “Education” – we increasethe average years of education by 5 years for a random selection of rural households with anaverage education level below 7 years and also increase the returns to education in agricultureto 5% per year (linear); (3) “Infrastructure” – we improve access to transport, electricity andcommunications infrastructure for a random selection of rural PSUs, we raise returns to thesame electricity and news communications infrastructures, and set the agglomeration effectsto zero (from negative) for households selecting the Ag portfolio; and (4) “Combined” – is thecombination of the second and third packages.
7.2 Results
Table 16 presents the principal results from the four scenarios under each of the three labourmarket regimes (fixed, rationed, flexible), and where the predicted headcount poverty rateis calculated separately for rural and urban households.31 The baseline scenario essentiallyrepresents an approximation to the current situation in which there are no specific policy changesand households are retained in their observed jobs portfolios. The approximation is good, asthere is no statistical difference between actually observed (final row) and predicted povertyrates in this case. Horizontal movements across the table capture the effects of loosening labourmarket imperfections in the current environment. Movements vertically down the table entailshifts between the different policy scenarios.31To enhance their current relevance, only households from the 2002/03 and 2008/09 surveys are employed withinthese simulations.
63

A principal finding is that the welfare implications of addressing labour market imperfectionsare significant but not transformative. In the baseline policy scenario, if a fifth of householdswho wish to switch to welfare-improving portfolios are able to do so, then the rural poverty ratewould fall by around 7 percentage points and 11 points under the flexible scenario (where all canshift if they so wish). The expected reductions in poverty are of a similar absolute magnitudefor urban households, and remain consistent (but somewhat smaller) across the different policyscenarios. The conclusion is that labour market segmentation, which may prevent householdsfrom shifting to welfare-enhancing jobs, explains a small share of observed poverty, but not itsbulk. This accords with the previous section which highlighted the low level of human andphysical capital across the economy, especially in rural areas. The point is that taking thescarcity of productive endowments as given, simply enabling households to select other jobs isunlikely to lead to dramatic welfare improvements.
Turning to differences between the various rural policy packages (vertically), gains from anyindividual package are moderate but compare favourably with the effects of loosening labourmarket constraints. The education package, for example, would generate a 9 percentage pointfall in the predicted poverty rate. This comes about through both an increase in the stock ofeducation as well as a corresponding increment in returns to education, for example throughaccess to new technology. Larger gains obtain from the infrastructure package, and combiningthe two packages yields a predicted reduction in the poverty rate of around 22 percentage pointsleaving labour market distortions unchanged.
We now move on to reflect on the policy implications of these results.
64

Table 16: Predicted household consumption poverty headcount rates under alternativelabour market scenarios
Portfolio choice constraints → Fixed Rationed Flexible
Policy scenario ↓ Rural Urban Rural Urban Rural Urban
Baseline 56.1 49.5 49.1 42.9 44.5 38.6(0.75) (1.01) (0.79) (1.02) (0.84) (1.08)
Education 46.8 46.8 41.7 42.3 38.5 37.1(0.86) (0.98) (0.80) (0.88) (0.81) (0.89)
Infrastructure 39.3 42.1 33.7 40.0 30.0 34.6(0.86) (1.03) (0.89) (0.98) (0.88) (0.91)
Combined 33.9 43.1 28.8 41.7 25.6 34.1(0.77) (0.95) (0.72) (0.95) (0.68) (0.86)
Observed poverty headcount 56.3 50.5 - - - -(1.23) (1.42)
Notes: cells report estimated consumption poverty rates and corresponding standard errors (inparentheses) based on the regression estimates in Table 15; ‘Portfolio choice constraints’ refer to thedegree to which household are constrained in selecting welfare-improving alternative jobs portfolios;policy scenarios apply alternative hypothetical policy packages focusing on the rural sector (see textfor details).Source: authors’ calculations from household survey series.
65
8 Policy implications
8.1 Challenges and trade-offs
The empirical analysis has provided a number of insights about the functioning of the Mozambicanlabour market. Four principal conclusions can be drawn, each of which maps to a specific jobschallenge. First, there is a consistent association between low-productivity agriculture, viewedoften as a default jobs portfolio, and persistent poverty. This can be traced to weak householdendowments, demand-side weaknesses and threshold effects (entry barriers) to higher-return,non-farm occupations. From a policy perspective, careful interpretation must be given to thesefindings. Despite the importance of supply-side weaknesses, it must be recognised that policiesaimed at strengthening household endowments (e.g., adding years of schooling) not only tend todeliver aggregate results over long time frames but also may not yield large returns in isolation.A rather more pointed focus for policy is how to raise returns to unskilled labour, especially inrural areas. Indeed, a fundamental part of the reason why addressing labour market distortionsis unlikely to be transformative is because given current technologies and economic structures,unskilled labour delivers low returns everywhere. An appropriate response is to raise returns inlow productivity activities, especially agriculture where the majority of jobs are found, ratherthan aim for some kind of mass movement into (currently) higher productivity activities ashousehold endowments strengthen.
This point gains substantive force in the context of rapid population growth and a smallexisting wage labour (formal employment) sector. Figure 17 takes the demographic projectionsfrom Figure 4, and estimates the absolute and relative size of the informal sector (principallyagriculture) under alternative hypothetical rates of growth in the number of formal employmentpositions. The basic assumption for the figure is that the informal sector absorbs all residualnew entrants to the labour market that are unable to find formal sector jobs. Thus if the sizeof the formal sector remained stagnant in absolute terms, then the informal sector is assumedto absorb all growth in the work force, such that it would grow according to the demographicprojections in panel (b) of Figure 4. Historically, however, the growth rate of the formal sectorhas been positive but below 5%, and appears to have slowed to around 3% over the most recentperiod (2002/03 - 2008/09), which is consistent with a stagnant relative size of the formal sectorin total employment. Figure 17 shows that if these historically observed growth rates continue,the informal sector will grow rapidly in absolute terms. In the ‘worst case’ 3% scenario, theinformal sector doubles in size in about 25 years (2010-2035); at the (hardly pessimistic) 5%growth rate, the informal sector would be double its present size in 40 years (2010-2050) andwould still be growing in 2050. The optimistic scenario of an 8% sustained growth rate in wageemployment would not lead to an immediate decline in the absolute size of the informal sector;
66

Notes: the figure shows relative and absolute projected size of the informal sector (non-wageemployment) based on hypothetical growth rates of wage employment; underlying demographicprojections are based on those of Figure 4.Source: authors’ calculations.
Figure 17: Demographic simulations of formal sector growth
however, over the simulated time frame it would be sufficient to largely formalise the productiveeconomy.
The fundamental implication of these projections is that, over the next generation, the vastmajority of all new jobs will be created in the informal sector. It is therefore unrealistic topresume that any feasible solution to the present set of jobs challenges lies uniquely in themodern sector, to the exclusion of rural agriculture. Addressing the jobs challenges now, whichare pressing, thus must involve promoting good jobs within the informal sector. That beingsaid, due to the presently low level of agricultural productivity, even moderate improvementsin that sector are unlikely to have a transformative impact on the economy at large, such assignificantly raising aggregate productivity levels. This suggests that while there is clear scope toachieve transformation in the agricultural sector, through (inter alia) the introduction of moreproductive technologies, agriculture should not be the sole focus of jobs-based policy initiatives.
Second, our analysis has shown that the informal sector is not homogeneous and cannot be fullyunderstood as referring only to low productivity activities. Recall that the highest returns to
67

education, as well as certain public sector goods, are located in the household enterprise sector.Following the previous point, it is therefore reasonable to assume that the latter portion of theinformal sector will also remain a key source of employment and poverty reduction. Thus, a policychallenge is how to nurture these enterprises such that they represent sources of entrepreneurialdynamism and innovation, thereby contributing more significantly to productivity growth. Thispolicy challenge is important in Mozambique as the current urban policy stance, if any clearposition can be identified, tends to view household enterprises as a problem and source of ‘bad’competition with the formal sector. This tension has already led to overt conflict in someinstances as government attempts to control (and contain) the household enterprise sector havebeen resisted. A policy rethink in this area is necessary.
Third, returns to human capital vary across occupations (jobs portfolios) – whilst they arelowest in agricultural activities, such returns remain low across most activities at sub-primarylevels of education. This casts doubt on the specific economic effectiveness of certain ‘standard’policy responses to rural disadvantages, such as expanding primary education, undertaken inthe absence of complementary policies that raise returns to education for lower skilled workers.If anything, it reveals that the jobs challenge is complex and demands a nuanced response thattakes due account of underlying labour market characteristics. A further implication is thatreturns to specific investments in other aspects of human capital and household assets, such asvocational skills and access to training in the use of appropriate technologies, may be critical.There are other reasons to promote education beyond its narrow economic impact. Also, anadditional explanation for low returns in education is that primary schooling is of a low quality.The point is that careful evaluation of the cost-effectiveness of expansion of primary educationvis-à-vis other potential interventions is essential.
Fourth, complex gender and age-related dimensions to jobs must be given due attention. We haveseen that the propensity of young males to contribute (more) productively in the agriculturalsector tends to be low. Additionally, it appears that women face greater difficulties in pursuing(higher quality) wage labour positions, likely because they principally bear the load of domesticresponsibilities. This is relevant because recent expansion of the education system has beenrelatively gender-neutral, meaning that among young cohorts women are much less educationallydisadvantaged than older generations. Changing expectations about what constitute good jobsthus is an additional challenge to which policy must be sensitive.
Finally, it should be recognised that labour market policies can have profound effects onthe balance of incentives between the rural and urban sectors. Policies that might appear(superficially) supportive of the urban informal sector, particularly more vocal cohorts of urbanyouths, may have negative long term consequences, especially if they stimulate rural-urban
68

migration and reduce incentives for investment in smallholder agriculture.32 This is particularlythe case for broad-based (poorly targeted) palliative social policies such as transfers or subsidiesthat fail to raise informal-sector productivity.33 However, effective urban and rural sectorpolicies focused on the informal sector are inherently difficult to implement and are unlikely toyield immediate improvements in well-being. Where social cohesion is under stress, short termpalliative responses may be favoured. The challenge, therefore, is that jobs policies must bepursued strategically and within a long term vision; the trade-off is that these may only yieldpay-offs over long time horizons.
8.2 Jobs priorities
Moving from the reporting of research findings to the making of specific policy recommendationsis rarely straightforward. It is all the more so here because (whether or not based on rigorousanalysis), Mozambique faces a plethora of suggestions regarding the policy reforms expected toinduce more and better growth. The present study does not seek to provide another list of suchsuggestions. Rather, we focus on where we believe the strategic priorities should lie, leavingdetailed recommendations to one side.
At an overall level, the key objective must be to leverage forthcoming natural resource revenuesto stimulate a pro-jobs structural transformation of the economy. A policy focus on creatinggood jobs is fundamental precisely because of the economic shift Mozambique is presentlystarting to experience toward capital intensive natural resource extraction. Both internationaland local experience shows that mega-projects generate few sustained employment posts and, inthe absence of countervailing policy measures tend to appreciate the real exchange rate.34 Onthe other hand, the opportunity of this economic shift is that, where managed appropriately(see below), it will loosen immediate budget constraints and place economic governance firmly inthe hands of the government. Thus, there should be financial capital and policy space to makelarge, long-term, credible public investments and policy commitments.
Based on our empirical analysis, we recommend that three principal, complementary objectivesbe adopted as cornerstones of a pro-jobs policy agenda. These are to:
1. achieve a step-increase in agricultural productivity across the rural sector (comprisingboth small family farms and larger commercial operations);
32Note that rural-urban migration has not yet proved to be a major policy challenge in Mozambique.33This is not to dismiss the role of social safety nets or redistributive policies per se. The point is that these mustbe targeted and, ideally, combine a productive component such as training or access to new technology.
34This is shown by evidence of employment generated by foreign investment projects in Mozambique over thepast 10 years. Rosenfeld (2012), for instance, estimates that massive investments in the coal sector will generatearound 7,500 jobs for Mozambicans over the long-run.
69

2. foster the non-farm informal sector as a source of dynamism and entrepreneurship; and
3. aggressively support the growth of labour intensive secondary and tertiary industries withexport potential
The following sub-sections justify the selection of these objectives and, without claiming to becomprehensive, suggest a number of areas where payoffs to specific policy interventions are likelyto be high.
8.2.1 Getting agriculture going
The choice of agriculture as a policy priority follows directly from the findings and discussion ofthis study (e.g., Section 6), as well as a significant volume of prior scholarship on Mozambique(e.g., Heltberg and Tarp, 2002; Tarp et al., 2002; Arndt et al., 2012; Cunguara et al., 2011a).Support to agriculture can also be justified on the grounds that many productive investmentsin this sector have important public goods characteristics (e.g., indivisibility). In Mozambique,taking the perspective of ‘good jobs’ (Section 2), a main reason to focus on enhancing agriculturaljobs is simply to raise living standards. Recall from Table 11 that 64% of all households engagedexclusively in household agricultural work are consumption poor and 87% are asset poor. Also,given the sheer weight of this sector in the volume of employment (plus the limited endowmentsof these households), only over the very long term is it conceivable to expect large numbers ofexisting (or future) households to accumulate sufficient human and physical assets to engage inhigher-productivity non-farm work. Put bluntly, to make progress on poverty reduction, progressmust be made in transforming agricultural jobs.
To do so, a starting point is to recognise past failings in policy coherence and policy implemen-tation toward the sector. To date, it is difficult to argue that a clear and coherent set of policypriorities are in place. On the one hand, the government approved in May 2011 a strategic planfor the sector (Plano Estratégico para o Desenvolvimento do Sector Agrário 2011-2020, PEDSA).This made almost no reference to the role of large-scale (foreign) investments in a range of agricul-tural activities, including bio-fuels and cattle ranches that have been and continue to take place.Nonetheless, the latest priority idea (according to the Prime Minister’s office) is ‘ProSavana’, anabbreviation for the Programme of Triangular Cooperation for Developing Agriculture in theTropical Savannas of Mozambique. Although details are sketchy, the principal idea is to allocatelarge tracts of savanna land in the North of the country to Brazilian commercial farmers forthe produce of soya and other commercial crops. These dual intentions to support smallholdersand encourage foreign investment in agriculture are not necessarily contradictory if they arecarefully planned and conflicts over land and the distribution of benefits are managed. Indeed, a
70

number of experiences in smallholder out-grower schemes in cash crops in Mozambique, such astobacco, cotton and sugar, suggest that a combination of foreign investment (bringing know-how,provision of inputs, and access to markets) can be highly productive (Benfica et al., 2002; Benfica,2007; Boughton et al., 2007). However, presently, this linkage is only encouraged, there is not aclear policy direction as regards the role of large scale land concessions (agri-businesses) andthere also is no explicit set of incentives or regulatory regime which might pro-actively supportand protect the development of modern contract grower schemes (see Jones and Gibbon, 2011, fora discussion of such schemes in the context of organic farming). Thus, clarifying and consistentlysupporting a coherent set of agricultural policies is fundamental. Additionally, a transparentregulatory structure for the sector which addresses the links between smaller and larger farmersis necessary.
Another critical area to address is how public funds are allocated. A number of reviews haveidentified that despite numerous public commitments, not only has the overall volume of publicfunds to agriculture fallen far short of what is required, but also the majority of such funds tendto be spent on central administration rather than on core functions such as extension, research,or productive investments (World Bank, 2011; Zavale et al., 2011). Equally, there is minimalcoordination along agricultural value chains which means that bottlenecks frequently developthat undermine individual (isolated) investments. Thus, more coherent and transparent planningis required.
In addition to the above, we would suggest further measures to support agriculture. Thefirst is to undertake large scale investments in rural infrastructure, including water storage,water management (e.g., irrigation), transport and electrification; these are fundamental tostimulate productive value chains (in new and old crops) and have been frequently identifiedas key constraints at the local level (see also Section 6). Second, recognising the presentscarcity of access to extension services and modern inputs in the smallholder rural sector, thegovernment must draw-in private sector energy and creativity, not least to allow a sustainableexit from support of the sector over the longer term. Targeted public-private partnerships(PPPs), (e.g., using performance-based subsidies), to deliver open pollinated high yielding seedvarieties represent just one example of a range of possible schemes that are likely to bringlarge welfare gains at a relatively low cost. A key policy challenge is to design appropriateeconomic governance structures for such PPPs in agriculture, which reward genuine outcomeswhilst recognising that these initiatives are inherently risky and some will fail. Consequently, anexperimental mind-set is necessary to deal with the complexity of designing and implementingeffective rural sector policies.35 Third, we would recommend interventions on the demand-side35This is underlined by Kajisa and Payongayong (2011) who provide a detailed analysis of the potential for a GreenRevolution in low-land rice farming in the Chokwe irrigation scheme in southern Mozambique. In particularthey note the need to carefully nurture local land and factor markets, taking account of specific constraintssuch as labour shortages in peak (harvesting) season and costly access to inputs. The point is that challenges
71

to loosen cash constraints (poverty traps) and open-up opportunities for diversification intosmall-scale processing and non-farm activities.36 To an extent, public programmes do exist thatseek to achieve such outcomes (e.g., the Fundo Distrital de Desenvolvimento). However, thishas been beset by implementation problems, has been prone to capture by local elites, andhas frequently funded non-productive activities such as petty commerce and housing. In theminimum, a redesign of the latter scheme would be appropriate, taking account of lessons learnt.
8.2.2 Enhancing productive informality
A consistent theme of this study is the dynamic role that informal enterprises can play. Giventhe absence of widespread opportunities in the wage labour market (not least due to its limitedsize), non-farm informal enterprises both are and must continue to be a key source of ‘goodjobs’. As such they can make three vital contributions. They can: (i) provide a stepping stonefrom very low productivity agriculture to higher returns activities, thereby contributing topositive welfare-enhancing structural transformation in the sense of Fox and Pimhidzai (2011);(ii) support higher living standards in rural and urban locations; and (iii) provide a meansto assuage social tensions to the extent that these activities are seen as credible, reliable andprofitable.
What can be done to support the emergence of higher returns informal enterprises? In the caseof Mozambique, a first step would be for the government to recognise the contribution of theseenterprises, rather than treating them as a scourge. A corollary is for this sector to be includedin the government’s policy and institutional framework. To do so effectively, more specificresearch is required that can help identify the main constraints and opportunities, thus sheddinglight on the most suitable public policy interventions. Evidence both from this study andother countries (e.g., Fox and Kweka, 2011), however, indicates that ensuring affordable accessto public infrastructure such as electricity, communications and transport is vital. Removingobstacles to access to land and improving access to credit for productive investments are alsolikely to yield high returns, particularly as higher-productivity household enterprises typicallyfall between very small-scale micro-finance (which often only fund petty commerce) and formalbank finance. Finally, targeted work experience and training programmes should be considered,especially for the urban youth. These can serve a dual purpose as a social safety net and buildskills to contribute more productively in informal enterprises.
differ hugely across the country and no grand plan is likely to be effective (for further discussion of technologytransfer in Africa see Otsuka and Kijima, 2010).
36We recognize that interventions in these areas are complex. Thus, further research and rigorous evaluation ofpotential interventions is recommended.
72
8.2.3 Stimulating labour-intensive exports
Finally, although the informal sector will remain a key source of jobs over the medium termat least, formal jobs cannot be ignored. Given the advantages associated with formal sectoremployment, including enhanced stability and legal protection, these should be a key source ofnew jobs creation. Critically, in part due to the link with foreign investment and know-how,these jobs also are a main locus of higher value added activities and aggregate productivityexpansion. They are therefore essential for long-term growth, especially in the secondary andtertiary sectors. At the same time, given the scale of the jobs challenge, it is desirable thatincentives are created to promote labour- as opposed to capital-intensive enterprise growth. Also,for the dual reasons that domestic demand is limited by the size of the market and that exportindustries have enhanced incentives to reach the technological frontier, export-oriented activitiesmust be given specific support.37
With respect to how these activities should be stimulated, a range of sensible suggestions canbe found in Page (2012c). A key recommendation is to pursue spatial industrial policy, whichrefers to measures that stimulate the agglomeration of specific types of industries and tasks inparticular geographical areas. This goes beyond a generic ‘Doing Business’ agenda, which tendsto focus on the formal content of regulations, but rather places emphasis on putting in hard andsoft infrastructure necessary for the private sector to compete at an international level. Thus,a leap forward in logistics capacity, transport links, customs administration and reliability ofcore public services such as electricity and water in specific areas are required. Importantly,it is unlikely that any kind of detailed national blueprint of what is necessary here is possible.Rather, devolved authority that is willing and able to learn how best to do spatial industrialpolicy is needed. In this light, a constructive focus of critical infrastructure investments shouldbe around the needs of specific export value chains (from farm gate to ship) where Mozambiquehas comparative advantage.
Three other areas merit attention. The first are mechanisms to quality-certify and coordinatesmall and medium sized firms, such that they can effectively link to larger firms particularly butnot exclusively in the natural resources sector. These are core public goods that no individualoperator has any interest in supplying. Second, the current tax system remains overly complexand riddled with tax exemptions, particularly for capital investments, which tend to favour large(foreign) firms relative to smaller local operators (Byiers et al., 2010). The greater budget spacethat is likely to appear from the exploration of natural resources could be leveraged to levelthe tax playing field and strengthen the social compact between public authorities and smalllocal firms.38 Third, significant investments in technical skills are vital to ensure that firms face37See Feder (1983) (also Alvarez and López, 2008) for further reasons to explicitly support the export sector.38See Rosenfeld (2012) for discussion of revenue implications of recent coal mining investments. A conservative
73
a sufficiently large pool of competent workers that are able to quickly add value in technicaloccupations.39
8.3 Risks and obstacles
Before concluding, it is worth reflecting on factors that may jeopardise the effective advancementof a jobs agenda. Most of these refer to the management of natural resources, which has beenproblematic in many lower income countries to date. A principal risk is that poor managementof these resources, either during their development or exploration phases, leads to excess fiscaland macroeconomic volatility and a loss of aggregate competitiveness. The latter can occurthrough various channels, such as directly raising the real price of exports through exchange rateappreciation, as well as indirectly by raising the cost of labour and inputs due to competition fromnatural resource operators. As Mozambique has a weak and limited industrial base, and minimalmacroeconomic management tools, there are good reasons to “go slow” with the development ofnatural resources in order not to overwhelm the economy as well as to foster skills and capacityover time. While some exchange rate appreciation is likely to be inevitable, any negative long-runeffects on economic competitiveness can be more than offset by effective supply-side investmentsof the sort suggested in the previous section.
A related risk is that as natural resources flow into the public purse, public spending increases butdoes so in an inefficient and unsustainable way. Unproductive subsidies, inefficient investment,and a rising public wage bill are concrete examples of such effects which would likely furtherundermine incentives to generate good jobs throughout the economy. At the same time, if gainsfrom natural resources are perceived to be unequally distributed, or simply not visible, socialand political cohesion may be placed under stress. This is particularly the case because naturalresource development is occurring far from the national capital in locations where support ofthe current ruling party (Frelimo) has been historically weaker. So, as noted previously, the riskis that palliative measures are employed so as to suppress conflict, but these have a negativeeffect on long term (good) jobs creation.
A fourth risk is that failure to raise the low level of smallholder agricultural productivity leads toa widening rural-urban gap and increased incentives to migrate into urban areas. This will likelyplace greater stress on the latter, including land, transport, housing, and social cohesion, andmay quicken the kind of negative structural transformation seen in both Mozambique and othercountries in Africa where labour is absorbed into an increasingly unproductive urban informal
estimate is that these will generate around US$ 12 billion of government revenues from now to 2030. Largereserves of natural gas are also likely to even larger revenues over the longer term.
39The benefits of agglomeration economies and investments in training are not only relevant for formal sector jobsbut also for those in the informal sector, directly and indirectly via spillovers.
74

sector. It would also make developing a framework that supports productivity increases in thehousehold enterprise sector even more challenging.
What can be done to address these risks? Up front it must be recognised that there are nosimple answers, and that in the ultimate instance effective management of natural resourcescomes down to a question of politics (governance). However, there are three simple instrumentsthat can play a highly constructive role in fostering an environment that is conducive to higherquality management of natural resources. The first is monitoring and transparency, both at thelevel of the resource flows and of the economy more generally. Setting up an autonomous fund(or fiscal pot) to collect natural resource revenues and publishing detailed data about that fund(who pays in, how much goes out, and to where etc.) must be a priority. At the same time, thereis need for better quality and more regular data to follow developments in the real economy,including of the labour market, exports, enterprises, farms and individual welfare. This leads tothe second instrument, which is establishment of an independent national commission or panelto report on the country’s state of macroeconomic competitiveness as well as on social cohesionand inequality. The idea is for this to be a credible, local exercise that can promote constructivedebate about appropriate policy responses.
Third, there are large advantages to enacting a (detailed) set of fiscal rules into law which governhow natural resources revenues are to be spent. Such rules should not only set out clear ruleson saving/spending from a natural resources fund, but also should assure that spending fromthe fund conforms to agreed principles such as investment in infrastructure, agriculture, specificregional allocations etc. Also, fiscal rules can stipulate that spending over a given size must beaccompanied by (public) ex ante due diligence and ex post monitoring, thereby supporting amore transparent and effective public investment portfolio.
None of the above suggestions are guaranteed to be effective and, in themselves, they depend bothon high–level political commitment as well as effective leadership. Thus, delivering on the jobsagenda in Mozambique will hinge on developing robust economic governance structures that aresensitive to macroeconomic competitiveness and supportive of positive structural transformationin the real economy.
75

9 Conclusions
Mozambique faces a number of acute jobs challenges. Impressive aggregate economic growthover the past twenty years has not been accompanied by sustained, rapid improvements inwelfare at the household level. The majority of Mozambicans earn a living from smallholderagriculture, and the low productivity of these activities is a key reason why poverty (measuredeither by assets or by consumption) remains high. At the same time, population growth remainsrobust, which means that over the medium term more than 300,000 individuals will enter thelabour market each year potentially increasing to 500,000 by 2025 (see Figure 4). Moreover,Mozambique’s economic structure is shifting. Capital intensive natural resource extraction isbecoming a dominant target of investment and export growth. As is well known, this entailslarge socio-economic risks and must be carefully managed to avoid a resource curse scenario, inparticular, that of constricting growth in other sectors of the economy.
In light of these challenges, this paper aimed to take a close look at the Mozambican labourmarket and understand how jobs condition welfare outcomes. Employing survey micro-dataas our information base, we started by setting out a set of 10 stylized facts about jobs inMozambique, covering the period 1996 to 2009. These painted a gloomy picture, although onethat is not uncommon to other low income African countries (e.g., see African DevelopmentBank, 2012). There is no evidence of a positive process of structural transformation in theemployment landscape; rather, underemployment is rife, education levels remain extremelylow across the workforce and levels of labour productivity remain extremely divergent acrosssectors. In particular, we presented evidence of the state of agriculture, highlighting stagnantcrop productivity (in terms of caloric production per person) and very limited access to moderninputs or technologies (e.g., less than 5% of farms use fertilizer or pesticide).
Reflecting on these stylized facts, the fundamental question is whether it is labour marketimperfections that explain these outcomes, or whether these outcomes are symptomatic of deeperchallenges that lie elsewhere. This motivates applying a jobs lens to the study of poverty. To doso, we elaborated a simple theoretical model. This showed that various of forms of labour marketsegmentation would be consistent with two empirical regularities: (i) the pooling of householdlabour into single activity portfolios (corner solutions); and (ii) differences in the marginalproduct of labour between these portfolios (labour market segments). Taking these empiricalquestions to the series of Mozambican household surveys, we find strong evidence of markedwelfare differences between jobs portfolios and in particular that an exclusively agriculturalportfolio is first-order dominated by all other portfolios (which contain a non-farm element; seeFigure 15). More careful analysis, however, based both on the propensity to select into theseportfolios and the determinants of consumption (correcting for labour market selection effects)reveal that a principal explanation for these labour market patterns is factor accumulation.
76
Households with low levels of human and physical capital are expected to receive low returnsacross all activities. This is not to say that the labour market operates efficiently, and we findsome evidence of demand-side rationing. Nonetheless these distortions are simply not sufficientto fully account for the jobs challenges we observe.
These findings are confirmed by a set of policy scenario simulations (Section 7). They showthat given current household endowments and the structure of returns to different activities,hypothetically allowing all households to select that labour portfolio which would yield the highestexpected income would lead to roughly a 10 percentage point fall in the observed headcountpoverty rate (from around 54% now). This is material but not transformational. Alternatively,targetted policies aimed at enhancing levels of rural education, returns to education and localinfrastructure would generate poverty reductions of over 20% in rural areas (keeping labourmarket imperfections fixed).
Our analysis of the Mozambican labour market points to three jobs priorities. Arguably themost important is to address low levels of agricultural productivity. The rationale is simple – tomake progress on poverty reduction, progress must be made in transforming agricultural jobs.This is also urgent. Given the sheer weight of this sector in the volume of employment (plus thelimited endowments of these households), only over the very long term would it be conceivableto expect large numbers of existing (or future) households to accumulate sufficient assets to liftthemselves into non-farm work and out of poverty.
However, jobs policy cannot limit itself only to the agricultural sector. Even substantial increasesin agricultural productivity are unlikely to generate any form of stepwise increment in aggregateproductivity. Also, there is a large informal urban sector which could represent a source of socialtension if the productivity of these enterprises remains low, and access to urban employmentremains limited, especially for youth cohorts. Thus, two other priorities need to be addressedsimultaneously. The first is to foster the non-farm informal sector as a source of dynamismand entrepreneurship. Indeed, our analysis has shown that many non-farm jobs can be highlyprofitable and generate returns in excess of those available in formal wage employment. Goodjobs are not just formal sector jobs. However, the government currently tends to see these firmsas a source of unhealthy competition to the formal sector and thus they face serious difficultiesof expansion and access to finance. A change of attitude and policy stance is required. Second,we recommend that government aggressively supports the growth of labour intensive secondaryand tertiary industries with export. These are essential to aggregate productivity expansionand long-term growth. Spatial industrial policy and leveraging of natural resource revenues tosubstantially improve infrastructure and logistics services along key value chains need to be givenattention. Thus, the jobs challenge in Mozambique is acute; but there are definite opportunitiesto pursue a developmental trajectory that addresses these challenges head on.
77

ReferencesAbowd, J. and Killingsworth, M. (1984). Do minority/white unemployment differences reallyexist? Journal of Business & Economic Statistics, 2(1):64–72.
African Development Bank (2012). African Economic Outlook 2012: Promoting Youth Employ-ment. OECD Publishing. doi:10.1787/aeo-2012-en.
Alkire, S. and Foster, J. (2011). Counting and multidimensional poverty measurement. Journalof Public Economics, 95:476–487.
Alvarez, R. and López, R. (2008). Is exporting a source of productivity spillovers? Review ofWorld Economics, 144(4):723–749.
Arndt, C., Hussain, M.A., Jones, E.S., Nhate, V., Tarp, F. and Thurlow, J. (2012). Explainingthe evolution of poverty: the case of Mozambique. American Journal of Agricultural Economics.doi:10.1093/ajae/aas022.
Arndt, C., Jones, S. and Tarp, F. (2007). Aid and Development: The Mozambican Case.In S. Lahiri (Ed.), Theory and practice of foreign aid, volume 1, pp. 235–288. Amsterdam:Amsterdam: Elsevier B.V.
Benfica, R. (2007). Income poverty effects of expansion and policies in cash cropping economies inrural Mozambique: An Economy-wide Approach. Food Security Collaborative Working Papers64E, Michigan State University, Department of Agricultural, Food and Resource Economics.
Benfica, R., Tschirley, D. and Sambo, L. (2002). Agro-industry and smallholder agriculture:institutional arrangements and rural poverty reduction in Mozambique. Flash Brief 33E,Directorate of Economics, Ministry of Agriculture and Rural Development, Government ofMozambique.
Benjamin, D. (1992). Household composition, labor markets, and labor demand: testing forseparation in agricultural household models. Econometrica, pp. 287–322.
Boughton, D., Mather, D., Barrett, C., Benfica, R., Abdula, D., Tschirley, D. and Cunguara, B.(2007). Market participation by rural households in a low-income country: An asset-basedapproach applied to Mozambique. Faith and Economics, 50(1):64–101.
Bourguignon, F., Fournier, M. and Gurgand, M. (2007). Selection bias corrections basedon the multinomial logit model: Monte Carlo comparisons. Journal of Economic Surveys,21(1):174–205.
Brown, D., Stephens, E., Ouma, J., Murithi, F., Barrett, C. and Were Omamo, S. (2006).Livelihood strategies in the rural Kenyan highlands. African Journal of Agricultural andResource Economics, 1(1):21–35.
Brück, T. and van den Broeck, K. (2006). Growth, Employment and Poverty in Mozambique.Issues in Employment and Poverty Discussion Paper 21, ILO.
Byiers, B., Rand, J., Tarp, F. and Bentzen, J. (2010). Credit demand in Mozambican manufac-turing. Journal of International Development, 22(1):37–55.
78

Clement, J. and Peiris, S. (2008). Post-stabilization economics in Sub-Saharan Africa: lessonsfrom Mozambique. International Monetary Fund.
Cook, S. (1999). Surplus labour and productivity in Chinese agriculture: evidence from householdsurvey data. The Journal of Development Studies, 35(3):16–44.
Cunguara, B., Fagilde, G., Garrett, J., Uaiene, R. and Heady, D. (2011a). Growth withoutchange: The elusiveness of agricultural and economic transformation in Mozambique. Paperpresented at ‘Dialogue on Promoting Agricultural Growth in MozambiqueŤ’ 21 July 2011,Hotel VIP, Maputo.
Cunguara, B., Langyintuo, A. and Darnhofer, I. (2011b). The role of nonfarm income in copingwith the effects of drought in southern Mozambique. Agricultural Economics, 42(6):701–713.
Dahl, G. (2002). Mobility and the return to education: Testing a Roy model with multiplemarkets. Econometrica, 70(6):2367–2420.
DNEAP (2010). Pobreza e bem-estar em Moçambique: Terceira avaliação nacional. Technical re-port, Ministry of Planning and Development, Government of Mozambique. URL www.dneapmpd.gov.mz/index.php?option=com_docman&task=doc_download&gid=133&Itemid=54.
Feder, G. (1983). On exports and economic growth. Journal of development economics, 12(1-2):59–73.
Fields, G.S. (2011). Labor market analysis for developing countries. Labour Economics, 18(Sup-plement 1):S16–S22.
Fox, L., Bardasi, E. and Van den Broeck, K. (2005). Poverty in Mozambique: Unraveling changesand determinants. World Bank.
Fox, L. and Kweka, J. (2011). The Household Enterprise Sector in Tanzania: Why It Mattersand Who Cares. Policy Research Working Paper 5882, World Bank, Africa Region, PovertyReduction and Economic Management Unit.
Fox, L. and Pimhidzai, O. (2011). Is Informality Welfare-Enhancing Structural Transformation?Evidence from Uganda. Policy Research Working Paper 5866, World Bank, Africa Region,Poverty Reduction and Economic Management Unit.
French, E. and Taber, C. (2011). Identification of models of the labor market. Handbook ofLabor Economics, 4:537–617.
Future Agricultures (2010). Future Farmers? Exploring Youth Aspirations for African Agriculture.Policy Brief 037, www.future-agricultures.org.
Gulyani, S. and Talukdar, D. (2010). Inside Informality: The Links Between Poverty, Microen-terprises, and Living Conditions in Nairobi’s Slums. World Development, 38(12):1710–1726.
Gurgand, M. (1997). L’éducation est-elle rentable dans l’agriculture? Une approche dualeappliquée à la Côte-d’Ivoire. Cahiers d’économie et sociologie rurales, (42-43):113–144.
Heckman, J. and Hotz, V. (1986). An investigation of the labor market earnings of panamanianmales evaluating the sources of inequality. Journal of Human Resources, 21(4):507–542.
79
Heltberg, R. and Tarp, F. (2002). Agricultural supply response and poverty in Mozambique.Food Policy, 27(2):103–124.
Jacoby, H. (1993). Shadow wages and peasant family labour supply: an econometric applicationto the Peruvian Sierra. The Review of Economic Studies, 60(4):903–921.
de Janvry, A., Fafchamps, M. and Sadoulet, E. (1991). Peasant household behaviour withmissing markets: some paradoxes explained. The Economic Journal, 101(409):1400–1417.
Jones, S. (2006). Growth accounting for Mozambique (1980-2004). Discussion Paper 22E,National Directorate of Studies and Policy Analysis, Ministry of Planning and Development,Republic of Mozambique, Discussion paper.
Jones, S. and Gibbon, P. (2011). Developing Agricultural Markets in Sub-Saharan Africa:Organic Cocoa in Rural Uganda. Journal of Development Studies, 47(10):1595–1618.
Kajisa, K. and Payongayong, E. (2011). Potential of and constraints to the rice Green Revolutionin Mozambique: A case study of the Chokwe irrigation scheme. Food Policy, 36(5):615–626.
Kingdon, G., Sandefur, J. and Teal, F. (2006). Labour Market Flexibility, Wages and Incomesin Sub-Saharan Africa in the 1990s. African Development Review, 18(3):392–427.
Koopmans, T. (1947). Measurement without theory. The Review of Economics and Statistics,29(3):161–172.
Le, K. (2009). Shadow Wages and Shadow Income in Farmers’ Labor Supply Functions. AmericanJournal of Agricultural Economics, 91(3):685–696.
—— (2010). Separation Hypothesis Tests in the Agricultural Household Model. AmericanJournal of Agricultural Economics, 92(5):1420–1431.
Leontaridi, M. (1998). Segmented labour markets: theory and evidence. Journal of economicsurveys, 12(1):103–109.
Mattes, R. (2009). The material and political bases of lived poverty in Africa: Insights from theAfrobarometer. Barometers of Quality of Life Around the Globe, pp. 161–185.
McMillan, M.S. and Rodrik, D. (2011). Globalization, Structural Change and ProductivityGrowth. Working Paper 17143, National Bureau of Economic Research. URL http://www.nber.org/papers/w17143.
Otsuka, K. and Kijima, Y. (2010). Technology policies for a green revolution and agriculturaltransformation in Africa. Journal of African Economies, 19(suppl 2):ii60–ii76.
Oya, C. (2010). Rural inequality, wage employment and labour market formation in Africa:Historical and micro-level evidence. Working Paper 97, Policy Integration Department,International Labour Office.
Page, J. (2012a). Aid, Structural Change and the Private Sector in Africa. Working Paper2012/21, World Institute for Development Economics Research (UNU-WIDER).
—— (2012b). Can Africa Industrialise? Journal of African Economies, 21(suppl 2):ii86–ii124.
80

—— (2012c). Mozambique: Structural change in an evolving natural resources economy.Unpublished report (based on a public lecture given at the Mozambique Growth Forumsponsored by the International Growth Centre, Maputo , 9 March 2012), Brookings Institution.
Perry, D. (2009). Fathers, Sons, and the State: Discipline and Punishment in a Wolof Hinterland.Cultural Anthropology, 24(1):33–67.
Pritchett, L. (2001). Where has all the education gone? The World Bank Economic Review,15(3):367–391.
Rodrik, D. (2007). Industrial development: Some stylized facts and policy directions. In UnitedNations Deptartment of Economic and Social Affairs (UNDESA) (Ed.), Industrial DevelopmentFor The 21st Century: Sustainable Development Perspectives, chapter 1, pp. 7–28. Geneva:United National Publications.
Rosenfeld, D. (2012). The coal mining sector in Mozambique: A simple model for prediction ofgovernment revenue. Unpublished background paper; forthcoming as a DNEAPWorking Paper,Direcção Nacional de Estudos e Análise de Políticas (DNEAP), Ministério de Planificação eDesenvolvimento, República de Moçambique.
Sen, A. (1966). Peasants and Dualism with or without Surplus Labor. The Journal of PoliticalEconomy, 74(5):425–450.
Skoufias, E. (1994). Using shadow wages to estimate labor supply of agricultural households.American Journal of Agricultural Economics, 76(2):215–227.
Stifel, D. (2010). The rural non-farm economy, livelihood strategies and household welfare.African Journal of Agricultural and Resource Economics, 4(1):82–109.
Tarp, F., Arndt, C., Jensen, H.T., Robinson, S. and Heltberg, R. (2002). Facing the developmentchallenge in Mozambique: an economywide perspective. Research reports 126, InternationalFood Policy Research Institute (IFPRI).
Teal, F. (2011). The price of labour and understanding the causes of poverty. Labour Economics,Volume 18(Supplement 1):S7–S15.
Weir, S. and Knight, J. (2007). Production Externalities of Education: Evidence from RuralEthiopia. Journal of African Economies, 16(1):134–165. URL http://ideas.repec.org/a/oup/jafrec/v16y2007i1p134-165.html.
World Bank (2009). Mozambique – Investment Climate Assessment 2009: sustaining andbroadening growth. Washington D.C.: World Bank. URL hdl.handle.net/10986/3158.
—— (2011). Mozambique – Analysis of public expenditure in agriculture. Washington D.C.:World Bank. URL hdl.handle.net/10986/2750.
Zavale, H., Mlay, G., Boughton, D., Chamusso, A. and Chilonda, P. (2011). The Structure andTrends of Public Expenditure on Agriculture in Mozambique. ReSAKSS Working Paper 34,Regional Strategic Analysis and Knowledge Support System.
81