Embed Size (px)
Citation preview
Natural Resources Defense Council
issue paper: february 2005
JOBS AND THE CLIMATE STEWARDSHIP ACT How Curbing Global Warming Can Increase Employment
Principal Authors James Barrett, Director, Sustainable Economics Program, Redefining Progress, Washington, D.C. J. Andrew Hoerner, Director, Research, Redefining Progress, Oakland, CA Jan Mutl, Assistant Professor of Economics, Johann Wolfgang Goethe Universität, Frankfurt, Germany Contributing Authors Alison Bailie, Tellus Institute, Boston, MA Bill Dougherty, Tellus Institute, Boston, MA Analysis conducted on behalf of the Natural Resources Defense Council

Natural Resources Defense Council Jobs and the Climate Stewardship Act
2
ABOUT NRDC NRDC (Natural Resources Defense Council) is a national, nonprofit organization of scientists, lawyers, and environmental specialists dedicated to protecting public health and the environment. Founded in 1970, NRDC has more than 1 million members and e-activists nationwide, served from offices in New York, Washington, Los Angeles, and San Francisco. For more information, visit www.nrdc.org.
Copyright 2005 by the Natural Resources Defense Council.
Natural Resources Defense Council Jobs and the Climate Stewardship Act
3
TABLE OF CONTENTS
Executive Summary 4
Chapter 1: Background on Global Warming 7 Environmental, Social, and Economic Consequences 8
Chapter 2: Overview of the Climate Stewardship Act (CSA) 9
Chapter 3: Methodology for Modeling the Effects of the CSA on Employment 11
Chapter 4: Results 13 Job Changes by Sector, Nationally 13 Job Changes by State 14
Chapter 5: Comparison to Previous Modeling Efforts 16 Assumptions Affecting Estimates 17
Conclusion 21
Endnotes 22
Natural Resources Defense Council Jobs and the Climate Stewardship Act
4
EXECUTIVE SUMMARY
America’s current energy system endangers public health, the economy, and national security. Reliance on the dirty and inefficient burning of fossil fuels for energy contributes to global warming and asthma in children; our addiction to oil makes us dependent on antidemocratic regimes and distorts our foreign policy; and shocks to the energy supply continue to create economic disruption and threaten to trigger recessions and related job loss.1 It’s not surprising, then, that energy has again risen to the top of the national policy agenda.
The Climate Stewardship Act
Among current legislative proposals, the broadest and most comprehensive effort to reduce the pollution that causes global warming, and thus shift away from the dirty and insecure energy sources of the past, is the Climate Stewardship Act of 2004 (CSA), sometimes called the McCain-Lieberman bill. The CSA would limit total U.S. emissions of carbon dioxide, the primary source of global warming pollution, and five other heat-trapping gases, through a tradable permit system analogous to the highly successful sulfur dioxide permit system used to reduce acid rain. In so doing, the CSA would also reduce many other dangers posed by our current energy system, including the risk of energy-caused recessions, our dependence on foreign oil, and energy-related air pollution. It would also, according to the modeling results presented in this study, have an overall positive effect on U.S. employment.
Energy and Jobs
Energy is a critical factor in economic growth, but also a major source of almost every type of pollution, including heat-trapping carbon dioxide. A primary goal of energy policy should be to harmonize economic and environmental concerns, assuring that one does not come at the expense of the other. Reducing carbon dioxide emissions can create or destroy jobs, depending on how the policies are selected and how they are implemented. The CSA incorporates, explicitly promotes, or allows for certain key policy features that tend to reduce the costs or increase the economic benefits of energy efficiency and environmental programs. These include the use of flexible, market-based approaches; recycling the revenues generated by these systems to reduce distorting taxes on work or investment; gradual phase-in to allow for planning and effective use of capital replacement cycles; and policies to encourage the development, commercialization, diffusion, and adoption of new clean technologies and remove market barriers to their adoption.2
Approach
To assess the employment impacts of the CSA, this study used results from a highly disaggregated engineering model of the energy sector, the National Energy Modeling System (NEMS), developed by the Energy Information Administration of the U.S. Department of Energy, augmented by other modeling tools. These systems are used to estimate the impact of the CSA and associated policies on energy prices and costs, investment levels, permit prices, and other energy-related variables. The Tellus Institute performed this portion of the analysis.3 We then estimated the outcomes of these changes on labor demand on 192 industries through the use of a Leontief input-output model developed by the U.S. Bureau of Labor Statistics (BLS). These
Natural Resources Defense Council Jobs and the Climate Stewardship Act
5
outcomes were estimated for the period from 2010 to 2025. Finally, the employment changes for 192 industries were distributed to the 50 states plus the District of Columbia.
Key Findings
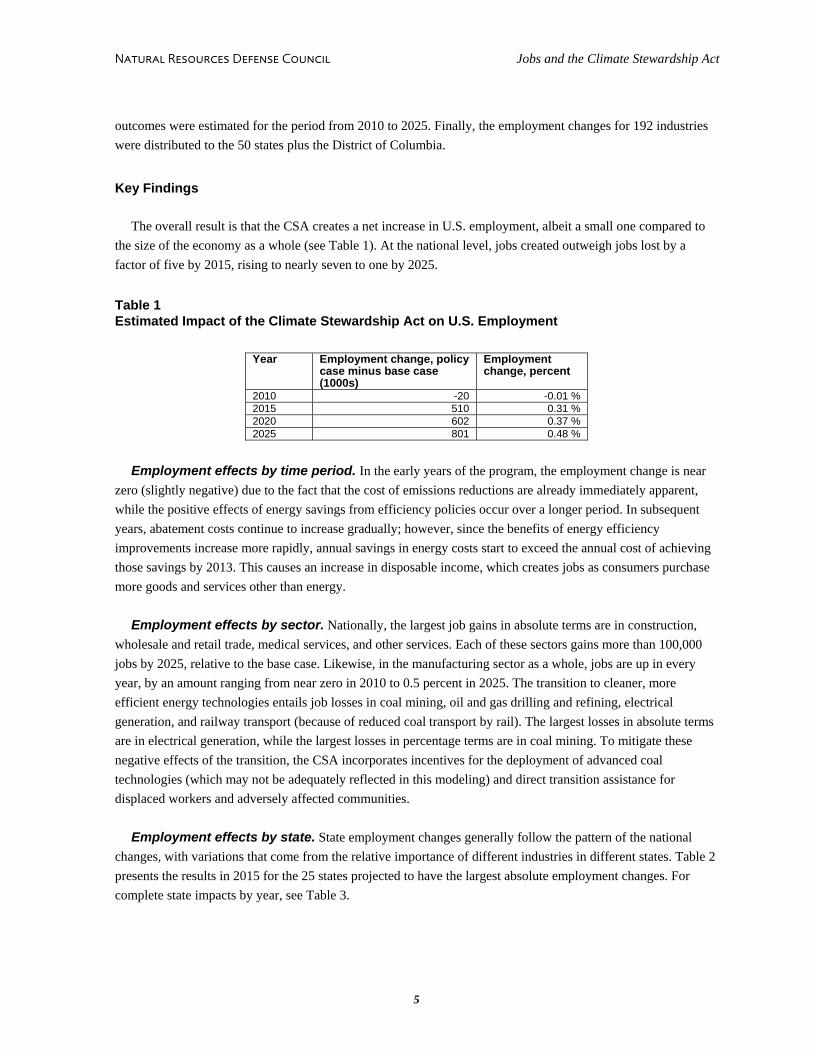
The overall result is that the CSA creates a net increase in U.S. employment, albeit a small one compared to the size of the economy as a whole (see Table 1). At the national level, jobs created outweigh jobs lost by a factor of five by 2015, rising to nearly seven to one by 2025.
Table 1 Estimated Impact of the Climate Stewardship Act on U.S. Employment
Year Employment change, policy case minus base case (1000s)
Employment change, percent
2010 -20 -0.01 % 2015 510 0.31 % 2020 602 0.37 % 2025 801 0.48 %
Employment effects by time period. In the early years of the program, the employment change is near
zero (slightly negative) due to the fact that the cost of emissions reductions are already immediately apparent, while the positive effects of energy savings from efficiency policies occur over a longer period. In subsequent years, abatement costs continue to increase gradually; however, since the benefits of energy efficiency improvements increase more rapidly, annual savings in energy costs start to exceed the annual cost of achieving those savings by 2013. This causes an increase in disposable income, which creates jobs as consumers purchase more goods and services other than energy.
Employment effects by sector. Nationally, the largest job gains in absolute terms are in construction,
wholesale and retail trade, medical services, and other services. Each of these sectors gains more than 100,000 jobs by 2025, relative to the base case. Likewise, in the manufacturing sector as a whole, jobs are up in every year, by an amount ranging from near zero in 2010 to 0.5 percent in 2025. The transition to cleaner, more efficient energy technologies entails job losses in coal mining, oil and gas drilling and refining, electrical generation, and railway transport (because of reduced coal transport by rail). The largest losses in absolute terms are in electrical generation, while the largest losses in percentage terms are in coal mining. To mitigate these negative effects of the transition, the CSA incorporates incentives for the deployment of advanced coal technologies (which may not be adequately reflected in this modeling) and direct transition assistance for displaced workers and adversely affected communities.
Employment effects by state. State employment changes generally follow the pattern of the national
changes, with variations that come from the relative importance of different industries in different states. Table 2 presents the results in 2015 for the 25 states projected to have the largest absolute employment changes. For complete state impacts by year, see Table 3.
Natural Resources Defense Council Jobs and the Climate Stewardship Act
6
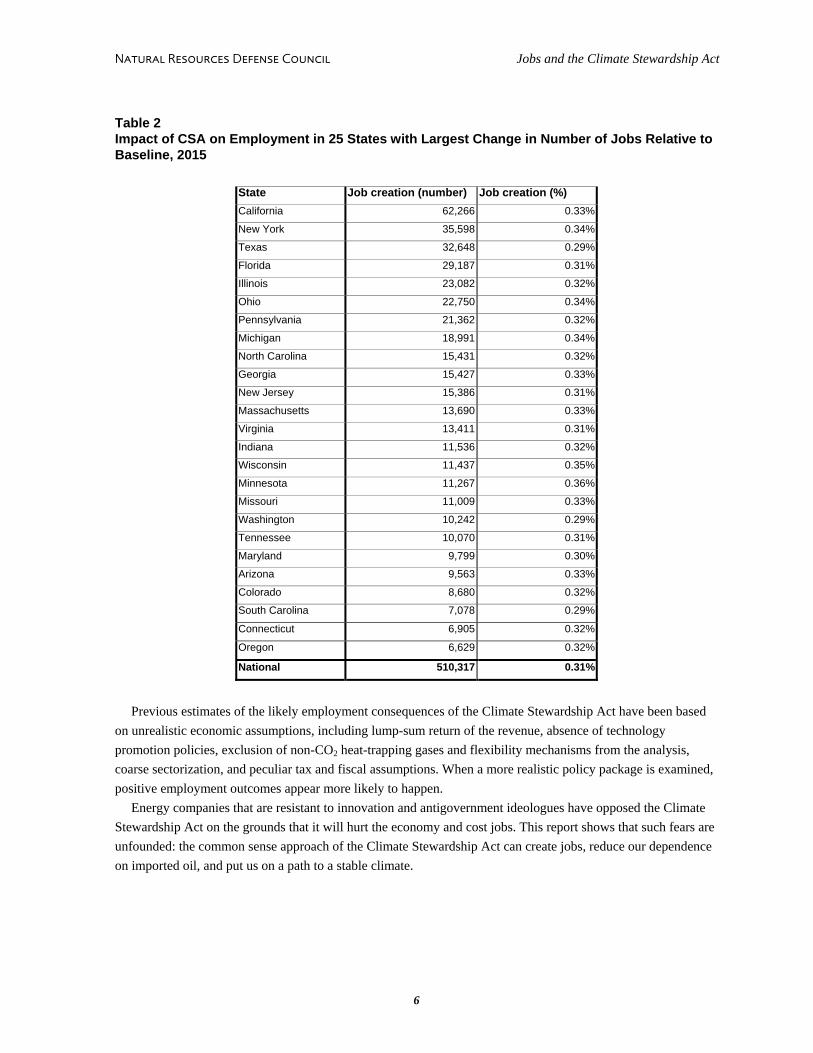
Table 2 Impact of CSA on Employment in 25 States with Largest Change in Number of Jobs Relative to Baseline, 2015
State Job creation (number) Job creation (%) California 62,266 0.33%
New York 35,598 0.34%
Texas 32,648 0.29%
Florida 29,187 0.31%
Illinois 23,082 0.32%
Ohio 22,750 0.34%
Pennsylvania 21,362 0.32%
Michigan 18,991 0.34%
North Carolina 15,431 0.32%
Georgia 15,427 0.33%
New Jersey 15,386 0.31%
Massachusetts 13,690 0.33%
Virginia 13,411 0.31%
Indiana 11,536 0.32%
Wisconsin 11,437 0.35%
Minnesota 11,267 0.36%
Missouri 11,009 0.33%
Washington 10,242 0.29%
Tennessee 10,070 0.31%
Maryland 9,799 0.30%
Arizona 9,563 0.33%
Colorado 8,680 0.32%
South Carolina 7,078 0.29%
Connecticut 6,905 0.32%
Oregon 6,629 0.32%
National 510,317 0.31%
Previous estimates of the likely employment consequences of the Climate Stewardship Act have been based
on unrealistic economic assumptions, including lump-sum return of the revenue, absence of technology promotion policies, exclusion of non-CO2 heat-trapping gases and flexibility mechanisms from the analysis, coarse sectorization, and peculiar tax and fiscal assumptions. When a more realistic policy package is examined, positive employment outcomes appear more likely to happen.
Energy companies that are resistant to innovation and antigovernment ideologues have opposed the Climate Stewardship Act on the grounds that it will hurt the economy and cost jobs. This report shows that such fears are unfounded: the common sense approach of the Climate Stewardship Act can create jobs, reduce our dependence on imported oil, and put us on a path to a stable climate.
Natural Resources Defense Council Jobs and the Climate Stewardship Act
7
CHAPTER 1
BACKGROUND ON GLOBAL WARMING
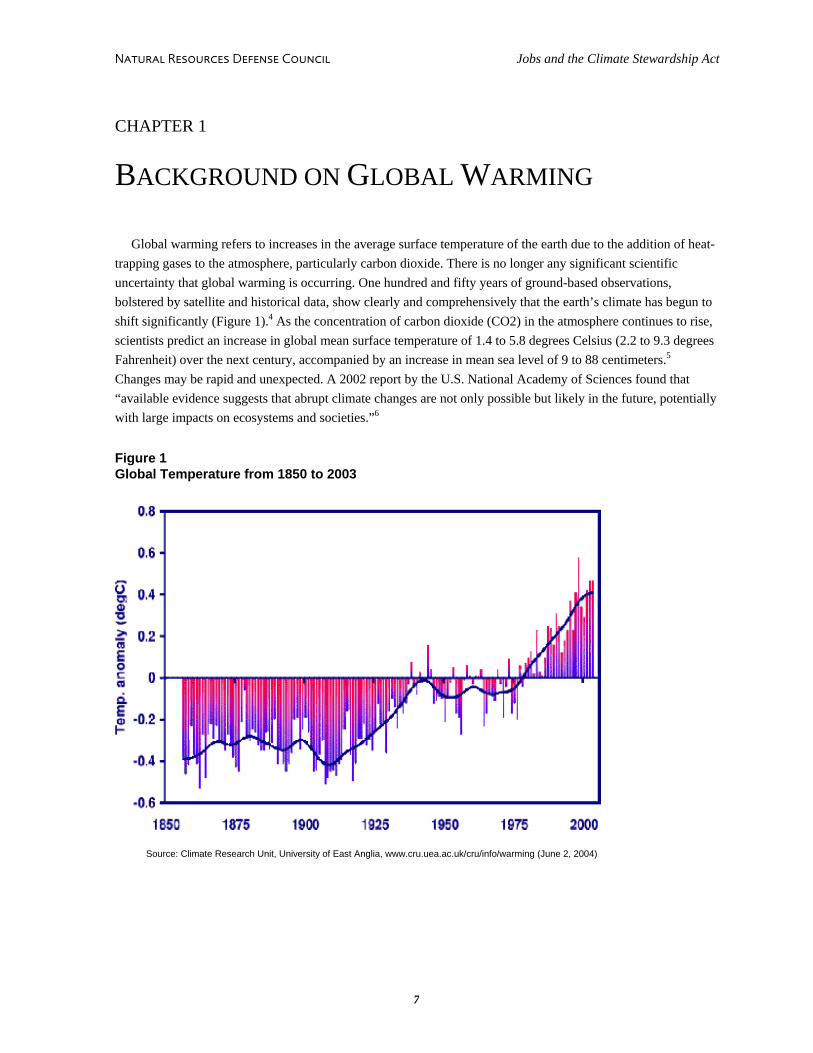
Global warming refers to increases in the average surface temperature of the earth due to the addition of heat-trapping gases to the atmosphere, particularly carbon dioxide. There is no longer any significant scientific uncertainty that global warming is occurring. One hundred and fifty years of ground-based observations, bolstered by satellite and historical data, show clearly and comprehensively that the earth’s climate has begun to shift significantly (Figure 1).4 As the concentration of carbon dioxide (CO2) in the atmosphere continues to rise, scientists predict an increase in global mean surface temperature of 1.4 to 5.8 degrees Celsius (2.2 to 9.3 degrees Fahrenheit) over the next century, accompanied by an increase in mean sea level of 9 to 88 centimeters.5 Changes may be rapid and unexpected. A 2002 report by the U.S. National Academy of Sciences found that “available evidence suggests that abrupt climate changes are not only possible but likely in the future, potentially with large impacts on ecosystems and societies.”6
Figure 1 Global Temperature from 1850 to 2003
Source: Climate Research Unit, University of East Anglia, www.cru.uea.ac.uk/cru/info/warming (June 2, 2004)

Natural Resources Defense Council Jobs and the Climate Stewardship Act
8
Environmental, Social, and Economic Consequences
Rising temperatures and changes in climate patterns are expected to significantly affect biodiversity and ecological productivity. Recent estimates indicate that under midrange business-as-usual scenarios, 15 to 37 percent of species in certain biological hotspots will go extinct by 2050, due to climatic changes. The study also found that prompt, effective action to reduce emissions of global warming pollution would significantly reduce the expected loss of species.7
In human terms, such large-scale changes are likely to affect health and the economy. In 2003, for example, Europe suffered the worst heat wave in recorded history, with weeks of record hot days and an estimated 35,000 heat-related deaths.8 A Harvard Medical School study has forecast comparable increases in heat deaths in the United States, especially in inner city areas, should climate change continue unchecked.9
More generally, most economic studies indicate that climate change will reduce gross domestic product (GDP) in developing and tropical nations under most warming scenarios, and negatively affect GDP in developed nations under some scenarios. The potential for social disruption is also significant. In February 2004, the Pentagon released findings that global warming increases the potential for international conflict, border disputes, and war due to water and food shortages, forced migration, extreme weather events, and other factors.10
Natural Resources Defense Council Jobs and the Climate Stewardship Act
9
CHAPTER 2
OVERVIEW OF THE CLIMATE STEWARDSHIP ACT (CSA)
The Climate Stewardship Act (CSA) would curb global warming pollution by creating a comprehensive system of tradable emissions permits. Entities responsible for emissions of global warming pollution would be required to have a permit for each ton of carbon dioxide (CO2) emitted, or the equivalent of a ton of CO2 for other heat-trapping gases. If a company acquires permits in excess of its needs, it can sell those permits to other companies.
This program covers industrial emitters of more than 10,000 tons of CO2-equivalent per year as well as distributors of transportation fuels (which would emit more than 10,000 tons of CO2-equivalent per year when consumed), accounting for more than 80 percent of all emissions of global warming pollution in the United States. Smaller industrial emitters, households, and farmers are not required to acquire emission permits, but can go through a certification process and enter the system voluntarily. Some may choose to do this in order to enter the permit market as sellers.
Starting in 2010, the CSA would cap emissions at the levels of 2000. (Earlier versions of the bill included a further phase-down to 1990 levels, but the current version does not include these reductions.) All the major heat-trapping gases are covered: carbon dioxide, methane, nitrous oxide, HFCs, PFCs, and sulfur hexafluoride.
In general, covered entities are those that actually emit global warming pollution through the combustion of fossil fuels. There is an important exception for oil products and heat-trapping industrial gases—HFCs, PFCs, and sulfur hexafluoride. For these sources, those entities that produce or import the substances are treated as the emitters, rather than those that consume them.
The bill includes a number of flexibility mechanisms designed to further reduce the cost of compliance: banking of allowances for future use, international trading of allowances with approved entities, and credit for sequestration of carbon through biological processes (such as growing plants to absorb carbon dioxide) or underground storage.
The greenhouse gas reductions required under the CSA are significantly smaller than those that would be required if the United States had ratified the Kyoto Protocol. Nonetheless, the CSA would help make U.S. products and technologies more compatible with those of the rest of the industrial world, which will be complying with their Kyoto commitments by moving toward higher efficiency standards in virtually all energy-using products and processes.
The CSA leaves many decisions to subsequent administrative determination, including the allocation of allowances and the nature and extent of the energy efficiency and renewable energy programs to be financed by allowance sales. We follow Tellus in assuming that the following measures will be implemented either under or ancillary to the CSA:
! Provisions to save 600,000 barrels of oil per day by 2020, primarily through enhanced auto efficiency ! A national renewable transportation fuels standard ! A national renewable portfolio standard

Natural Resources Defense Council Jobs and the Climate Stewardship Act
10
! Emissions caps for sulfur dioxide, nitrogen oxides, and mercury emissions from electric generating facilities, as proposed in the Clean Air Planning Act of 2003
! Measures to accelerate penetration of combined heat and power (CHP) systems in the commercial and industrial sectors
! A slight reduction in vehicle miles traveled through measures such as incentives for transit-oriented development
Natural Resources Defense Council Jobs and the Climate Stewardship Act
11
CHAPTER 3
METHODOLOGY FOR MODELING THE EFFECTS OF THE CSA ON EMPLOYMENT
A broad survey of the literature suggests that there are smart and foolish ways to move toward a cleaner, leaner, more efficient energy system, and that the economic effect of any given reduction in pollution varies considerably depending how one goes about achieving that reduction.11 Some studies funded by the fossil fuel industries have predicted dire consequences should the United States adopt policies to limit emissions of heat-trapping gases, in terms of lost jobs and decreased GDP.12 However, these studies have generally assumed that the reductions will be implemented through heavy carbon taxes, with no gradual phase-in, no technology promotion policies, and no recycling of the revenue to cut other taxes. In contrast, several recent theoretical analyses suggest that when a market-based approach to reducing global warming pollution (such as pollution taxes or auctioned pollution permits) is combined with revenue recycling, in the form of cuts to other distorting taxes and with polices that promote cost-effective new clean technologies, net economic gains will often result.13 This study’s results are consistent with this line of literature.
Our analysis starts with a baseline forecast drawn from the Energy Information Administration’s (EIA) Annual Energy Outlook 2004. We then constructed a policy scenario, starting with the provisions of the CSA as outlined in the preceding section. The impacts of the policies on energy prices and costs, investment levels, permit prices, and other energy-related variables were then estimated with the public-use version of the National Energy Modeling System (NEMS), the same model that the EIA uses to prepare the Annual Energy Outlook, supplemented with other modeling tools. The Tellus Institute performed this portion of the analysis.14
We then estimated the employment effects of the policy scenario relative to the base case, using a 192 industry Leontief input-output (IO) model developed by the U.S. Bureau of Labor Statistics (BLS). The IO model provides current and projected inputs of labor and materials per unit of final demand. Final demand is divided into 156 categories, including consumer goods, investment goods, government purchases, and net imports. The model includes a bridge matrix to distribute final demand values among the 192 industries in the production portion of the model. The production portion of the model is divided into two submodules: one focusing on the necessary inputs of materials and services from other industries (the interindustry module) and the other on the necessary inputs of labor and capital required from households (the value-added module).
The Tellus results were converted into two types of model inputs: changes in final demand and changes in
technology. Changes in final demand include: ! Reduced household consumption of energy ! Increased household investment in energy-related consumer durables and construction services ! Spending of household energy savings net of household investment costs (positive or negative) ! Increased annual industrial investment ! Spending of industrial energy savings net of investment costs (positive or negative) ! Revenues from auctioned permits returned to consumers
Natural Resources Defense Council Jobs and the Climate Stewardship Act
12
Changes in technology include: ! Decreased industrial energy requirements plus fuel switching ! Capital costs for efficiency investments ! Substantial changes in the inputs to electric generation, and more modest changes in the technical
requirements for producing other energy types ! Increased labor and materials requirements for production of more efficient automobiles
We then used the same methodology as the BLS to determine the output of each industry that is required to deliver the amount of commodities demanded by final consumers. The methodology of Lenotief IO analysis uses historical data on the amount of capital, labor, and materials required in production of each commodity. The input requirements for individual commodities are then used to determine the total economy-wide production of commodities for use in either the production of other goods or final consumption by consumers, government, or export. The BLS also provides forecasts for the labor and materials requirements in future years. For description of the input-output calculations involved, see, for example, Miller and Blair (1984) or the BLS website.15
For each industry we derived the decrease (in real units) of oil, natural gas, coal, and electricity usage under the scenario relative to the base case. We then adjusted the entries in the input-output table to reflect the increased efficiency of the economy. We also made an adjustment in the auto sector, where we assumed that the higher fuel economy standards in the policy scenario case were reflected in an increased use of intermediate as well as labor inputs in proportion to the price increases induced by the fuel economy policy. We made a similar adjustment in the electric generation sector, where we have predictions from the NEMS analysis on the relative size of operation and maintenance costs under the base and policy scenario cases. We therefore adjusted the nonfuel inputs and labor requirements in the electric generation sector in the same proportions.
Finally, to make sure that the higher order effects were accounted for (such as reduction of inputs into production of inputs, etc.), we applied the standard balancing procedure (RAS balancing) to our adjusted input-output tables. See Mutl (2004) for a more detailed description of this methodology of accounting for technological change in an input-output framework.16
We carried out the analysis described above for industries at the national level to obtain real output of each national industry and hence also a vector of national industry employment levels under base and scenario cases for the different years considered. Finally, we used data on state-by-industry employment in our base year (2000) to calculate the employment effects at the state level under the assumption that employment changes for a given industry are distributed among states proportionally to that industry’s current employment share.17 The state employment data comes from the Census of Employment and Wages (CEW) program of the BLS.18
Natural Resources Defense Council Jobs and the Climate Stewardship Act
13
CHAPTER 4
RESULTS
Job Changes by Sector, Nationally
The Climate Stewardship Act creates a growing net increase in U.S. employment over time. In 2010, the impact on employment overall is approximately zero but slightly negative, down 20,000 jobs (0.01 percent). By 2015, employment is up 510,000 jobs (0.31 percent). Gains increase further in 2020 and 2025, to 602,000 jobs (0.37 percent) and 801,000 jobs (0.48 percent), respectively.
Employment changes are not distributed evenly among economic sectors. Job gains are seen in manufacturing and services, while job losses would be expected in the energy supply industries. The major economic sectors being affected are as follows:
Non-energy manufacturing industries.19 The energy savings in the policy scenario are achieved primarily through the substitution of capital for fuel via the adoption of new clean technologies. The increased investment required to achieve this capital/fuel substitution results in increased employment in non-energy manufacturing industries in every year relative to the baseline. This is particularly important given the recent declines in manufacturing employment in the United States.
Service industries. Service industries account for two-thirds of total U.S. employment, and account for the largest portion of the employment increase. Under the CSA, service industry jobs are up in every year as consumers spend a share of their energy bill savings on additional services of all kinds
Motor vehicles. The policy scenario includes measures complementary to the CSA to increase fuel efficiency that would increase the cost of cars and light trucks, and the labor requirements per car. Using historical own-price demand elasticities and domestic-price trade elasticities, we estimate that about half of this labor increase would be offset by decreased domestic sales and increased imports. However, employment in the auto industry would still rise in relation to the baseline as more workers are required to build more efficient, higher value vehicles.
Agriculture. Increases in agricultural jobs track, but are slightly larger than, national employment increases. Energy and fuel industries. The energy and fossil fuel industries, and a handful of related industries such
as rail transport of coal and natural gas pipelines, suffer job losses. Job losses in ancillary industries are generally smaller than those in the energy industries themselves. These losses are small relative to the economy as a whole or to job gains in other industries (roughly six jobs gained per job lost in 2015 and thereafter). While they could be significant as a percentage of employment in those industries, in most cases, the bulk of these job losses can probably be achieved through normal turnover. Even in well-paid and heavily unionized industries such as coal mining and oil refining, annual turnover rates from retirement, migration, firing for cause, voluntary decisions to leave the labor force, return to school, or move to another industry generally exceed 10 percent per year. This may not be true in the coal mining industry because, due to increasing labor productivity, employment in that industry is already declining rapidly.
Reductions in coal demand and associated coal industry jobs could be mitigated through investments in advanced technology to use coal without incurring the high carbon dioxide emission rates associated with current
Natural Resources Defense Council Jobs and the Climate Stewardship Act
14
coal-fired power plants. Power plants using a process known as integrated gasification combined cycle (IGCC) generate electricity efficiently from coal, while facilitating carbon dioxide capture and indefinite storage in geologic formations. Two IGCC power plants are in commercial operation in the United States and carbon capture and geologic storage (CCS) is being tested at a few locations internationally. Nonetheless, complete systems for generating electricity from coal with CCS are not commercially mature, which makes it difficult to predict how widely used this technology will be in the future. The CSA includes incentives to deploy IGCC+CCS power plants, which Tellus attempted to model. The NEMS model was not very responsive to these incentives, however, indicating limited deployment of IGCC+CCS over the time frame of this study. A more aggressive program to deploy IGCC+CCS and/or a more responsive model would result in higher coal demand and employment than estimated in this study.
The CSA legislative text provides transitional assistance to workers who lose their jobs in adversely affected industries and to communities with significant job losses, using a portion of the revenue from selling carbon allowances. However, the amount of revenue so directed is not specified in the legislation and we have not modeled such a program in this analysis. For a more complete discussion of the issues surrounding transitional assistance to workers under a carbon dioxide reduction program, see Barrett20 and Hoerner and Barrett.21 Note that including such a program in the analysis would alter the state results described below, increasing the employment benefit in coal-intensive states and the states with high levels of employment in fossil fuel industries and fossil electric generation, while slightly lowering the employment benefit in other states.
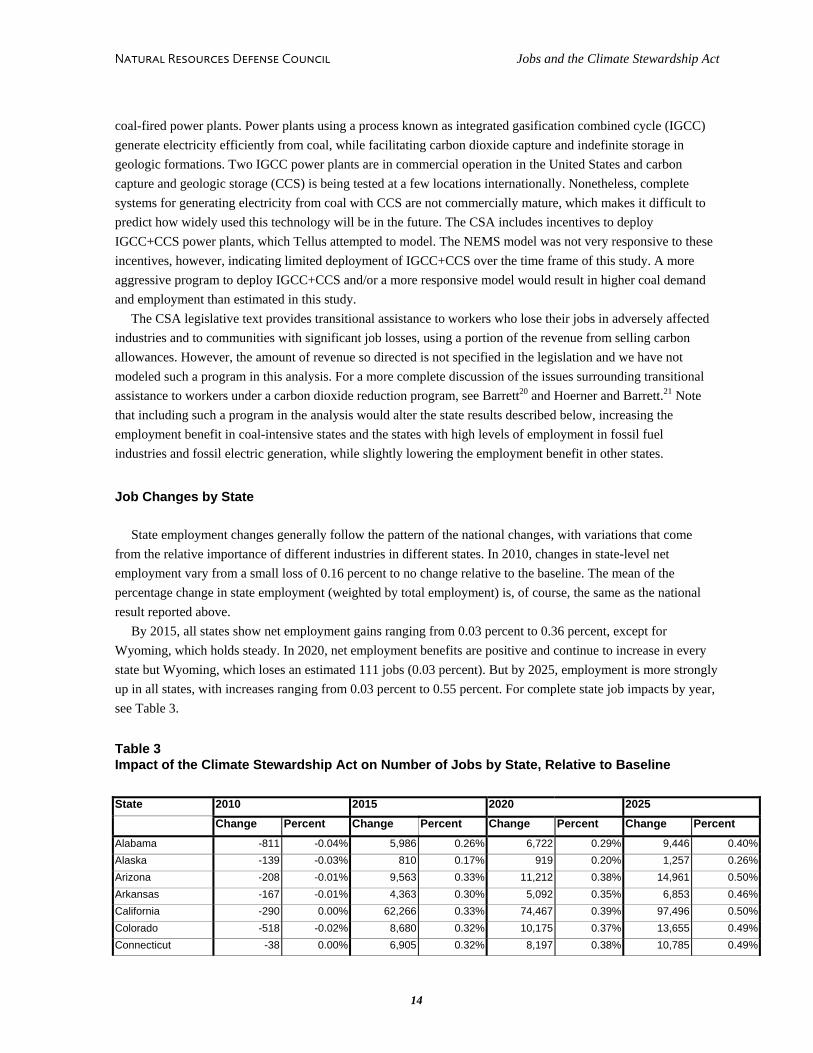
Job Changes by State
State employment changes generally follow the pattern of the national changes, with variations that come from the relative importance of different industries in different states. In 2010, changes in state-level net employment vary from a small loss of 0.16 percent to no change relative to the baseline. The mean of the percentage change in state employment (weighted by total employment) is, of course, the same as the national result reported above.
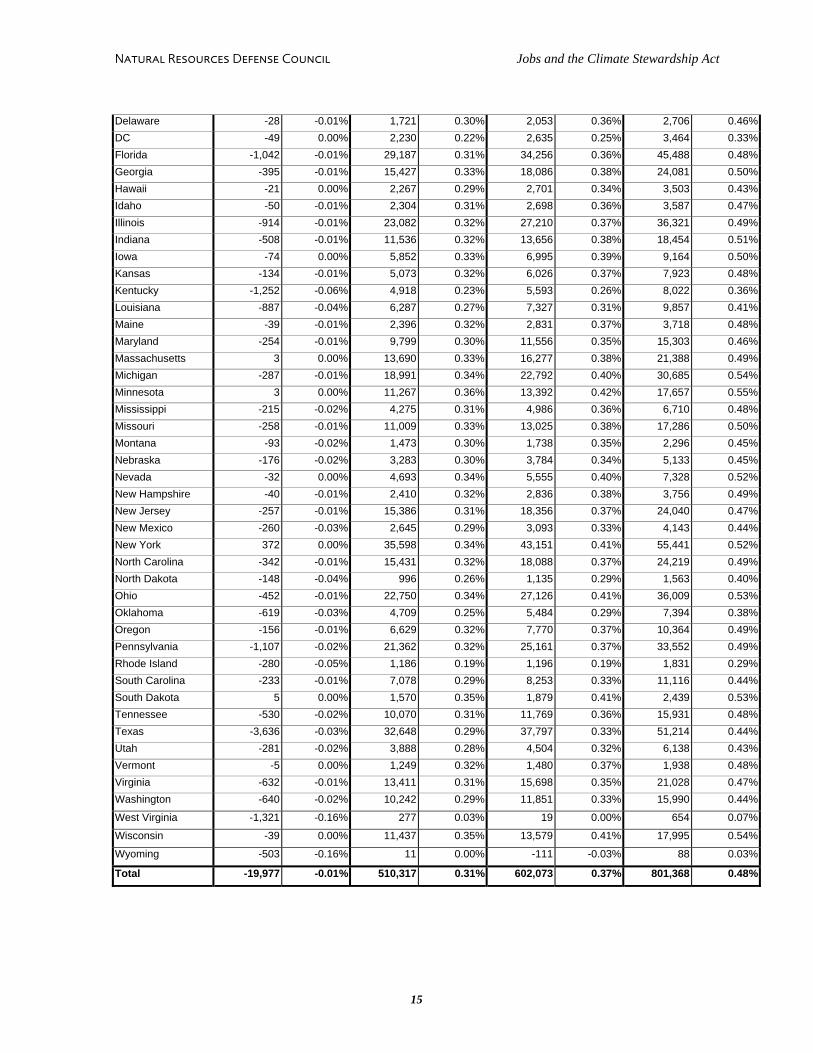
By 2015, all states show net employment gains ranging from 0.03 percent to 0.36 percent, except for Wyoming, which holds steady. In 2020, net employment benefits are positive and continue to increase in every state but Wyoming, which loses an estimated 111 jobs (0.03 percent). But by 2025, employment is more strongly up in all states, with increases ranging from 0.03 percent to 0.55 percent. For complete state job impacts by year, see Table 3.
Table 3 Impact of the Climate Stewardship Act on Number of Jobs by State, Relative to Baseline
State 2010 2015 2020 2025 Change Percent Change Percent Change Percent Change Percent Alabama -811 -0.04% 5,986 0.26% 6,722 0.29% 9,446 0.40%Alaska -139 -0.03% 810 0.17% 919 0.20% 1,257 0.26%Arizona -208 -0.01% 9,563 0.33% 11,212 0.38% 14,961 0.50%Arkansas -167 -0.01% 4,363 0.30% 5,092 0.35% 6,853 0.46%California -290 0.00% 62,266 0.33% 74,467 0.39% 97,496 0.50%Colorado -518 -0.02% 8,680 0.32% 10,175 0.37% 13,655 0.49%Connecticut -38 0.00% 6,905 0.32% 8,197 0.38% 10,785 0.49%
Natural Resources Defense Council Jobs and the Climate Stewardship Act
15
Delaware -28 -0.01% 1,721 0.30% 2,053 0.36% 2,706 0.46%DC -49 0.00% 2,230 0.22% 2,635 0.25% 3,464 0.33%Florida -1,042 -0.01% 29,187 0.31% 34,256 0.36% 45,488 0.48%Georgia -395 -0.01% 15,427 0.33% 18,086 0.38% 24,081 0.50%Hawaii -21 0.00% 2,267 0.29% 2,701 0.34% 3,503 0.43%Idaho -50 -0.01% 2,304 0.31% 2,698 0.36% 3,587 0.47%Illinois -914 -0.01% 23,082 0.32% 27,210 0.37% 36,321 0.49%Indiana -508 -0.01% 11,536 0.32% 13,656 0.38% 18,454 0.51%Iowa -74 0.00% 5,852 0.33% 6,995 0.39% 9,164 0.50%Kansas -134 -0.01% 5,073 0.32% 6,026 0.37% 7,923 0.48%Kentucky -1,252 -0.06% 4,918 0.23% 5,593 0.26% 8,022 0.36%Louisiana -887 -0.04% 6,287 0.27% 7,327 0.31% 9,857 0.41%Maine -39 -0.01% 2,396 0.32% 2,831 0.37% 3,718 0.48%Maryland -254 -0.01% 9,799 0.30% 11,556 0.35% 15,303 0.46%Massachusetts 3 0.00% 13,690 0.33% 16,277 0.38% 21,388 0.49%Michigan -287 -0.01% 18,991 0.34% 22,792 0.40% 30,685 0.54%Minnesota 3 0.00% 11,267 0.36% 13,392 0.42% 17,657 0.55%Mississippi -215 -0.02% 4,275 0.31% 4,986 0.36% 6,710 0.48%Missouri -258 -0.01% 11,009 0.33% 13,025 0.38% 17,286 0.50%Montana -93 -0.02% 1,473 0.30% 1,738 0.35% 2,296 0.45%Nebraska -176 -0.02% 3,283 0.30% 3,784 0.34% 5,133 0.45%Nevada -32 0.00% 4,693 0.34% 5,555 0.40% 7,328 0.52%New Hampshire -40 -0.01% 2,410 0.32% 2,836 0.38% 3,756 0.49%New Jersey -257 -0.01% 15,386 0.31% 18,356 0.37% 24,040 0.47%New Mexico -260 -0.03% 2,645 0.29% 3,093 0.33% 4,143 0.44%New York 372 0.00% 35,598 0.34% 43,151 0.41% 55,441 0.52%North Carolina -342 -0.01% 15,431 0.32% 18,088 0.37% 24,219 0.49%North Dakota -148 -0.04% 996 0.26% 1,135 0.29% 1,563 0.40%Ohio -452 -0.01% 22,750 0.34% 27,126 0.41% 36,009 0.53%Oklahoma -619 -0.03% 4,709 0.25% 5,484 0.29% 7,394 0.38%Oregon -156 -0.01% 6,629 0.32% 7,770 0.37% 10,364 0.49%Pennsylvania -1,107 -0.02% 21,362 0.32% 25,161 0.37% 33,552 0.49%Rhode Island -280 -0.05% 1,186 0.19% 1,196 0.19% 1,831 0.29%South Carolina -233 -0.01% 7,078 0.29% 8,253 0.33% 11,116 0.44%South Dakota 5 0.00% 1,570 0.35% 1,879 0.41% 2,439 0.53%Tennessee -530 -0.02% 10,070 0.31% 11,769 0.36% 15,931 0.48%Texas -3,636 -0.03% 32,648 0.29% 37,797 0.33% 51,214 0.44%Utah -281 -0.02% 3,888 0.28% 4,504 0.32% 6,138 0.43%Vermont -5 0.00% 1,249 0.32% 1,480 0.37% 1,938 0.48%Virginia -632 -0.01% 13,411 0.31% 15,698 0.35% 21,028 0.47%Washington -640 -0.02% 10,242 0.29% 11,851 0.33% 15,990 0.44%
West Virginia -1,321 -0.16% 277 0.03% 19 0.00% 654 0.07%
Wisconsin -39 0.00% 11,437 0.35% 13,579 0.41% 17,995 0.54%
Wyoming -503 -0.16% 11 0.00% -111 -0.03% 88 0.03%
Total -19,977 -0.01% 510,317 0.31% 602,073 0.37% 801,368 0.48%
Natural Resources Defense Council Jobs and the Climate Stewardship Act
16
CHAPTER 5
COMPARISON TO PREVIOUS MODELING EFFORTS
There have been three previous efforts to model the outcomes of versions of the Climate Stewardship Act on the economy: Charles River Associates,22 the Energy Information Administration (EIA),23 and the Joint Program on Science and Policy of Global Change at the Massachusetts Institute of Technology (MIT).24 All three have made estimates both for the original version of the bill and for the amended version, which includes only the “Phase 1” emission limit at year 2000 levels, and lacks the “Phase 2” reductions after 2015. This section compares these previous studies to our results and describes some of the key factors that account for the differences.
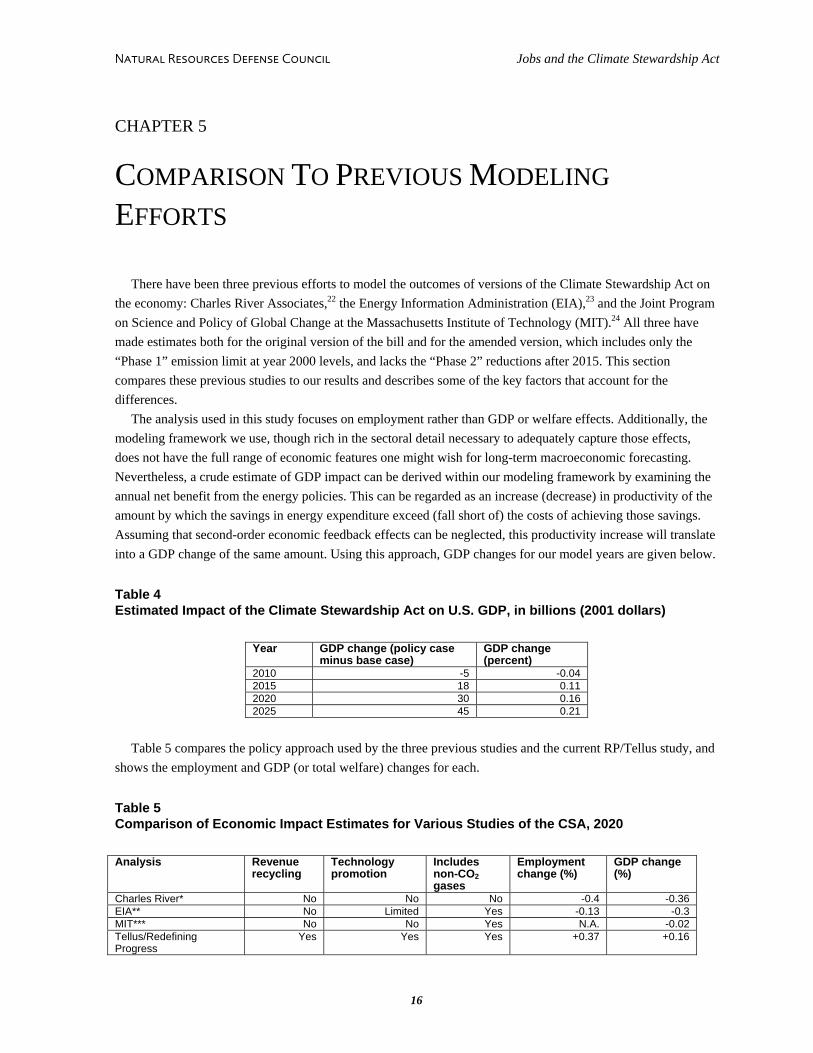
The analysis used in this study focuses on employment rather than GDP or welfare effects. Additionally, the modeling framework we use, though rich in the sectoral detail necessary to adequately capture those effects, does not have the full range of economic features one might wish for long-term macroeconomic forecasting. Nevertheless, a crude estimate of GDP impact can be derived within our modeling framework by examining the annual net benefit from the energy policies. This can be regarded as an increase (decrease) in productivity of the amount by which the savings in energy expenditure exceed (fall short of) the costs of achieving those savings. Assuming that second-order economic feedback effects can be neglected, this productivity increase will translate into a GDP change of the same amount. Using this approach, GDP changes for our model years are given below.
Table 4 Estimated Impact of the Climate Stewardship Act on U.S. GDP, in billions (2001 dollars)
Year GDP change (policy case minus base case)
GDP change (percent)
2010 -5 -0.04 2015 18 0.11 2020 30 0.16 2025 45 0.21
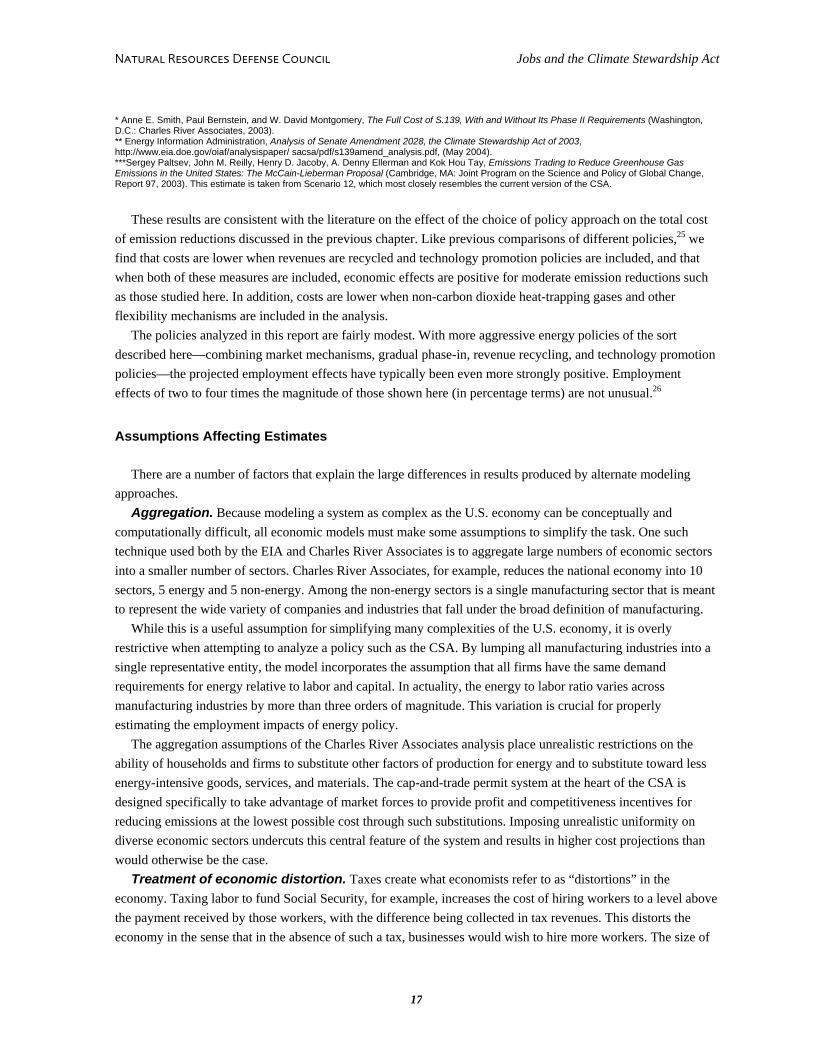
Table 5 compares the policy approach used by the three previous studies and the current RP/Tellus study, and
shows the employment and GDP (or total welfare) changes for each.
Table 5 Comparison of Economic Impact Estimates for Various Studies of the CSA, 2020
Analysis Revenue recycling
Technology promotion
Includes non-CO2 gases
Employment change (%)
GDP change (%)
Charles River* No No No -0.4 -0.36 EIA** No Limited Yes -0.13 -0.3 MIT*** No No Yes N.A. -0.02 Tellus/Redefining Progress
Yes Yes Yes +0.37 +0.16
Natural Resources Defense Council Jobs and the Climate Stewardship Act
17
* Anne E. Smith, Paul Bernstein, and W. David Montgomery, The Full Cost of S.139, With and Without Its Phase II Requirements (Washington, D.C.: Charles River Associates, 2003). ** Energy Information Administration, Analysis of Senate Amendment 2028, the Climate Stewardship Act of 2003, http://www.eia.doe.gov/oiaf/analysispaper/ sacsa/pdf/s139amend_analysis.pdf, (May 2004). ***Sergey Paltsev, John M. Reilly, Henry D. Jacoby, A. Denny Ellerman and Kok Hou Tay, Emissions Trading to Reduce Greenhouse Gas Emissions in the United States: The McCain-Lieberman Proposal (Cambridge, MA: Joint Program on the Science and Policy of Global Change, Report 97, 2003). This estimate is taken from Scenario 12, which most closely resembles the current version of the CSA.
These results are consistent with the literature on the effect of the choice of policy approach on the total cost
of emission reductions discussed in the previous chapter. Like previous comparisons of different policies,25 we find that costs are lower when revenues are recycled and technology promotion policies are included, and that when both of these measures are included, economic effects are positive for moderate emission reductions such as those studied here. In addition, costs are lower when non-carbon dioxide heat-trapping gases and other flexibility mechanisms are included in the analysis.
The policies analyzed in this report are fairly modest. With more aggressive energy policies of the sort described here—combining market mechanisms, gradual phase-in, revenue recycling, and technology promotion policies—the projected employment effects have typically been even more strongly positive. Employment effects of two to four times the magnitude of those shown here (in percentage terms) are not unusual.26
Assumptions Affecting Estimates
There are a number of factors that explain the large differences in results produced by alternate modeling approaches.
Aggregation. Because modeling a system as complex as the U.S. economy can be conceptually and computationally difficult, all economic models must make some assumptions to simplify the task. One such technique used both by the EIA and Charles River Associates is to aggregate large numbers of economic sectors into a smaller number of sectors. Charles River Associates, for example, reduces the national economy into 10 sectors, 5 energy and 5 non-energy. Among the non-energy sectors is a single manufacturing sector that is meant to represent the wide variety of companies and industries that fall under the broad definition of manufacturing.
While this is a useful assumption for simplifying many complexities of the U.S. economy, it is overly restrictive when attempting to analyze a policy such as the CSA. By lumping all manufacturing industries into a single representative entity, the model incorporates the assumption that all firms have the same demand requirements for energy relative to labor and capital. In actuality, the energy to labor ratio varies across manufacturing industries by more than three orders of magnitude. This variation is crucial for properly estimating the employment impacts of energy policy.
The aggregation assumptions of the Charles River Associates analysis place unrealistic restrictions on the ability of households and firms to substitute other factors of production for energy and to substitute toward less energy-intensive goods, services, and materials. The cap-and-trade permit system at the heart of the CSA is designed specifically to take advantage of market forces to provide profit and competitiveness incentives for reducing emissions at the lowest possible cost through such substitutions. Imposing unrealistic uniformity on diverse economic sectors undercuts this central feature of the system and results in higher cost projections than would otherwise be the case.
Treatment of economic distortion. Taxes create what economists refer to as “distortions” in the economy. Taxing labor to fund Social Security, for example, increases the cost of hiring workers to a level above the payment received by those workers, with the difference being collected in tax revenues. This distorts the economy in the sense that in the absence of such a tax, businesses would wish to hire more workers. The size of
Natural Resources Defense Council Jobs and the Climate Stewardship Act
18
these distortions is the source of considerable debate, yet there is little doubt that they exist. Both the Charles River Associates and EIA models recognize this fact and account for the distortions caused by taxes on labor and other factors of production.
Standard economic theory states that optimal environmental charges improve economic efficiency because the cost of the tax, including distortional effects, is less than the value of a cleaner environment.27 All the studies examined here include measures of the economic distortion caused by the CSA’s permitting system, but do not account for the value of the environmental benefit, thus overstating the net cost of the act.
In addition, the CSA is designed to be a revenue-neutral policy. The nonprofit Climate Change Credit Corporation (CCCC) established by the act would be required to return any revenues generated by the sale of emissions allowances to the economy, neither increasing nor decreasing net government revenues. How this is done is an important input into the modeling process with significant implications for projected costs, because it will influence the size of the economic distortion and how the CSA would interact with existing economic distortions. The act specifically calls for the CCCC to use any such revenues in a way that helps reduce or mitigate any cost increase created by the emissions cap. This could be done in a number of ways, such as discounts for purchases of energy efficient appliances, incentives for clean energy production, transitional assistance to affected workers, or returning revenue to consumers in other ways. Each of these methods of returning the revenues would reduce distortions elsewhere in the economy.
Rather than modeling policies that would put auction revenues to productive use, both Charles River Associates and the EIA assume that the allowance revenues would be redistributed in a lump-sum fashion. This is one of very few feasible options for redistribution that would have no beneficial impacts on other distortions. It provides no incentives for reducing current or future emissions and would do little to lower the overall costs of reducing carbon emissions. Precluding such options in their analysis helps guarantee that the macroeconomic costs associated with the CSA projected by these reports will be higher than they are likely under more realistic assumptions regarding implementation.
Efficiency and technology assumptions. A central assumption of many economic models, particularly Computable General Equilibrium (CGE) models, of which the Charles River Associates model is one type, but also of macroeconometric models such as the one used by the EIA, is that the economy allocates all available resources in an efficient manner. While this may accurately reflect the long-term tendency of the economy towards efficiency, it carries substantial and misleading implications about concurrent economic behavior. Such models take as their starting point an economy that already puts resources to their most productive uses and has already exhausted all available options for increasing economic efficiency. A major implication of this assumption is that there can be no improvements in the way the economy employs available technologies. While individuals and companies may strive to find and use the most economical technologies available, these models assume that they have already achieved this state.
In contrast, real world experience has repeatedly shown that gaps—often quite substantial gaps—exist between technologies currently in use and the most cost-effective currently available technologies, particularly in the energy arena, and that firms vary enormously in the efficiency with which they use various resources.28 By assuming away this efficiency gap, these economic models explicitly preclude any possibility of options that would increase energy efficiency and reduce energy costs enough to offset the cost of investing in these options. It assumes that no individual firm or industry can specialize in finding new and less expensive means of reducing emissions and that finding and employing low-cost abatement methods confers no competitive advantage for one firm over another. Assuming these opportunities don’t exist ensures that the results of these models will show a higher economic cost than real world experience would indicate.
Natural Resources Defense Council Jobs and the Climate Stewardship Act
19
The effect of these types of assumptions is compounded by the fact that the CSA is designed to provide funds to advance the rate of technology adoption and technological progress. The creation of new technology provides benefits, not only to the innovator, but also to others who copy the innovation. Technology is therefore a public good, and standard economic theory suggests that the supply of technology by private industry will be inefficiently low.29 By providing incentives for firms and households to adopt existing underutilized energy efficient and renewable technologies, the CSA would help reduce the efficiency gap and achieve some carbon reductions at a net savings or at low net cost. At the same time, by providing incentives to accelerate technological progress, the act would help create further opportunities for increasing energy efficiency and reducing emissions at low cost.
In contrast, models such as that of Charles River Associates, which assume the economy operates at or very near full efficiency, eliminate any such opportunities. By assuming perfect efficiency, these models also assume that markets are already producing economically optimal levels of technology and are progressing at an optimal rate. Investing public funds in additional technological progress is assumed to be an economically inferior undertaking. While advancing energy or abatement technology may yield some benefits, the economy would have been better off had the resources been invested elsewhere. Under these assumptions there is no possibility of economic improvement by increased investments in energy efficiency or renewable technology.
Fiscal policy. The Charles River Associates results suffer further from fiscal assumptions that are at odds with their treatment of the revenues from the permits. Though there is no such requirement either in the CSA or in existing law, the Charles River Associates modelers imposed the requirement that implementing the CSA would have no effect on the federal budget. As they estimate economic costs created by the act, estimates that, as shown above, are artificially high, the reduction in economic activity reduces government tax revenues, increasing the federal budget deficit. Since they have already returned the revenue from the permitting system in lump-sum fashion, they then increase the personal income tax to achieve budget neutrality. This adds to the economic distortion already estimated by the model and compounds the shortcomings in their analysis identified above. According to Charles River Associates, this assumption increases their estimated economic losses by 60 percent.
The Charles River Associates modelers thus assume (artificially) that the federal budget must be balanced and that it must be balanced by increasing economic distortions, yet they simultaneously assume that the revenues generated by the CSA must be disposed of in a way that cannot reduce such distortions. Individually, either one of these assumptions would inflate the projected costs of the act. Taken together, they reinforce one another and call into question the consistency of the modeling effort and the reliability of the results. An internally consistent approach would include the distortional effect of either both revenue streams or neither of them. Instead, without apparent economic justification, the Charles River Associates modelers have chosen the two options that would tend to exacerbate any costs of the CSA policies rather than to minimize them as the act requires.
Additionally, the method they choose to increase tax revenues has further implications that are common in CGE models like the one Charles River Associates uses. Their model assumes that consumers constantly optimize their work and consumption patterns to maximize their well-being. In such models there is no such thing as involuntary unemployment. Any hours not spent working are assumed to be the result of a rational choice by consumers to substitute leisure for income, and thus do not represent unemployment. It is thus unusual for a CGE modeling scenario to report unemployment as the Charles River Associates model does. In their current analysis, Charles River Associates’ assumption of increased income taxes causes after-tax wages to fall. At lower take-home wages, some workers are assumed to prefer the leisure of unemployment to continued work. All the employment change in the Charles River Associates model is this sort of voluntary, “optimal”

Natural Resources Defense Council Jobs and the Climate Stewardship Act
20
unemployment. The Charles River Associates analysis assumes that workers simply adjust their budgets downward as they choose to work fewer hours for less money, without regard to budget constraints such as the costs of housing, food, transportation, etc. Whether or not this assumption is realistic, by choosing to increase taxes on income, which is derived mostly from labor, the Charles River Associates modelers have assumed a policy that would have large and negative impacts on employment levels. Again, Charles River Associates has eschewed other options with smaller employment impacts in favor of an assumption that maximizes the job losses they project.
Natural Resources Defense Council Jobs and the Climate Stewardship Act
21
CONCLUSION
Previous estimates of the likely employment impact of the Climate Stewardship Act have been based on unrealistic economic assumptions, including lump-sum return of the revenue, absence of technology promotion policies, exclusion of non-CO2 heat-trapping gases and flexibility mechanisms from the analysis, coarse sectorization, and peculiar tax and fiscal assumptions. When a more realistic policy package is examined, positive employment effects appear more likely to occur. We find such positive impacts in nearly all years and in all but one state. Employment will decline in some energy-related industries, but these declines will be small relative to the associated employment gains in other industries. Overall, economic effects will be small and positive.
This report has made no attempt to assess the negative economic impacts of global warming or of other pollutants that are emitted together with heat-trapping gases, nor of the economic benefits of reducing such pollutants. Those benefits should be added to the benefits analyzed in this report for a more comprehensive assessment.
Investing in new energy for America will create more jobs, reduce our dependence on imported oil, and put us on a path to a stable climate. Energy companies that are resistant to innovation and antigovernment ideologues have opposed the Climate Stewardship Act on the grounds that it will hurt the economy and cost jobs. This report shows that such fears are unfounded. The common sense approach of the Climate Stewardship Act can reduce global warming pollution and increase employment.
Natural Resources Defense Council Jobs and the Climate Stewardship Act
22
ENDNOTES
1 It is important to understand that, because oil prices are set in international markets, the key measure of our vulnerability to global price
shocks is the amount of oil that we consume, not the amount of oil that we import. Even if the United States reduces oil imports, foreign shocks to oil supply will still increase domestic prices by the same amount. If U.S. consumption of oil is not reduced, these price increases will produce the same negative effect on the U.S. economy as if imports had not been decreased. Conversely, even if imports remain high, decreases in U.S. consumption of oil will mean that oil price shocks will have a smaller impact on the economy, because the price increase applies to a smaller consumption base.
2 See Chapter 3 for a more detailed discussion of these factors.
3 Alison Bailie and William Dougherty, Analysis of the Climate Stewardship Act (Cambridge, MA: Tellus Institute, 2003); and Alison Bailie and William Dougherty, Analysis of the Climate Stewardship Act Amendment (Cambridge, MA: Tellus Institute, 2004).
4 Intergovernmental Panel on Climate Change, Climate Change 2001: Synthesis Report (Summary for Policymakers) (Cambridge University Press: Cambridge, UK, 2001).
5 Ibid.
6 U.S. National Academy of Sciences, National Research Council Committee on Abrupt Climate Change, Abrupt Climate Change: Inevitable Surprises (Washington, D.C.: National Academy Press, 2002).
7 Chris D. Thomas et al., “Extinction Risk from Climate Change,” Nature, Volume 427 (8 January, 2004): pp. 145-148.
8 Janet Larsen, Record Heat Wave in Europe Takes 35,000 Lives (Washington, D.C.: Earth Policy Institute, October 2003.)
9 Center for Health and the Global Environment, Inside the Greenhouse: The Impact of CO2 and Climate Change on Public Health in the Inner City (Cambridge, MA: Harvard Medical School, April 2004).
10 Thomas F. Stocker and Andreas A. Schmitter, “Influence of Carbon Dioxide Emission Rates on the Stability of the Thermohaline Circulation,” Nature, Volume 388 (28 August, 1997): pp.862-865.
11 J. Andrew Hoerner and Benoit Bosquet, Environmental Tax Reform: the European Experience (Washington, D.C.: Center for a Sustainable Economy, 2001). http://www.redefiningprogress.org/programs/sustainableeconomy/eurosurvey.htm.
12 WEFA, Inc., Global Warming: the High Cost of the Kyoto Protocol (Eddystone, PA: WEFA 1998); Consad Research Corp., The Kyoto Protocol: A Flawed Treaty Puts America at Risk (Pittsburgh, PA: Consad, 1998); Charles River Associates, Economic Implications of the Adoption of Limits on Carbon Emissions from Industrialized Countries (Washington, D.C.: Charles River Associates, 1997); Charles River Associates, The Post-Kyoto Climate: Impacts on the U.S. Economy (Washington, D.C.: Charles River Associates 1999).
13 Florentin Krause et al., “Cutting Carbon Emissions at a Profit (Part I): Opportunities for the United States,” Contemp Econ Policy, Volume 20 (2002): pp. 339-36; see also Interlaboratory Working Group, Scenarios for a Clean Energy Future, LBNL-44029 and ORNL/CON-476 (Washington, D.C.: U.S. Government Printing Office, 2000): Appendix E-4.
14 Alison Bailie and William Dougherty, Analysis of the Climate Stewardship Act Amendment (Cambridge, MA: Tellus Institute, 2004); in addition to the results published here, additional, unpublished model results were provided by the authors for purposes of this analysis.
15 Ronald E. Miller and Peter D. Blair, Input-Output Analysis: Foundations and Extensions (Prentice Hall, 1984); BLS, http://www.bls.gov/emp/empind3.htm.
16 Jan Mutl, “Capturing Technological Change in an IO Model with Application to Calculation of Embodied Carbon Emissions,” Climate Change and Technological Innovation: New Input-Output Analysis Methods, ed. Martin Cloutier (Quebec: Presses de l’Universite de Quebec, 2004) pp. 91-103. http://www.wiwi.uni-frankfurt.de/profs/binder/mutl/papers/IOtechchange.pdf.
17 There were a small number of withheld values censored for statutory privacy reasons in the survey data. However, the state and industry totals were reported and hence we have used a RAS balancing procedure to impute the missing values. In most cases there were instances of earlier year surveys where a particular missing value was reported and, as a result, we were able to obtain starting values for the algorithm by assuming that the missing employment in a given industry and state has remained constant in proportion to the national total.
18 See http://stats.bls.gov/cewhome.htm.
19 This category includes SIC industries 20 through 39, excluding industry 29 (NAICS sectors 311 to 339, excluding 324). In the categorization given in Table 2, it consists of the following industries: Wood Products, Furniture & Fixtures, Stone, Clay & Glass, Primary Metals, Fabricated Metals, Machinery & Equipment, Motor Vehicles, Other Transport. Equip., Instruments, Foods & Tobacco, Textiles, Paper, Printing & Publishing, Chemicals, Rubber & Leather, and Misc. Manufactures.
20 Jim Barrett, Worker Transition and Global Climate Change (Washington, D.C.: The Pew Center on Climate Change, 2001).
Natural Resources Defense Council Jobs and the Climate Stewardship Act
23
21 Jim Barrett and J. A. Hoerner, Clean Energy and Jobs: A Comprehensive Approach to Climate and Energy Policy (Washington, D.C.:
Center for a Sustainable Economy and the Economic Policy Institute, 2002).
22 Anne E. Smith, Paul Bernstein, and W. David Montgomery, The Full Cost of S.139, With and Without Its Phase II Requirements (Washington, D.C.: Charles River Associates, 2003).
23 Energy Information Administration, Analysis of S.139, the Climate Stewardship Act of 2003 (Washington, D.C.: U.S. Department of Energy, SR/OIAF/2003-02). http://www.eia.doe.gov/oiaf/servicerpt/ml/pdf/sroiaf(2003)02.pdf; Energy Information Administration, Analysis of Senate Amendment 2028, the Climate Stewardship Act of 2003, http://www.eia.doe.gov/oiaf/analysispaper/sacsa/pdf/s139amend_analysis.pdf (May 2004).
24 Sergey Paltsev et al., Emissions Trading to Reduce Greenhouse Gas Emissions in the United States: The McCain-Lieberman Proposal (Cambridge, MA: Joint Program on the Science and Policy of Global Change, Report 97, 2003).
25 Robert Repetto and Duncan Austin, The Costs of Climate Protection: A Guide for the Perplexed (Washington, D.C.: World Resources Institute, 1997); Florentin Krause et al., “Cutting Carbon Emissions at a Profit (Part I): Opportunities for the United States,” Contemp Econ Policy, Volume 20 (2002): pp. 339-36; J. A. Hoerner and B. Bosquet, Environmental Tax Reform: The European Experience (Washington, D.C.: Center for a Sustainable Economy, 2001). http://www.redefiningprogress.org/programs/sustainableeconomy/eurosurvey.htm.
26 Florentin Krause et al., “Cutting Carbon Emissions at a Profit (Part II): Impacts on U.S. Competitiveness and Jobs,” Contemp Econ Policy, Volume 21 (2003); Energy Innovations: A Prosperous Path to a Clean Environment (American Council for an Energy-Efficient Economy (ACEEE), The Alliance to Save Energy, Natural Resources Defense Council, Tellus Institute, and Union of Concerned Scientists, June 1997); Jim Barrett and J. A. Hoerner, Clean Energy and Jobs: A Comprehensive Approach to Climate and Energy Policy (Washington, D.C.: Center for a Sustainable Economy and the Economic Policy Institute, 2002); Angela Köppl, “Empirical Assessment of an Energy Tax Proposal for Austria,” Green Budget Reform in Europe: Countries at the Forefront, ed. Kai Schlegelmilch (Berlin: Springer, 1999): pp. 33-40; Angela Köppl et al., “Macroeconomic and Sectoral Effects of Energy Taxation in Austria,” Environmental and Resource Economics Volume 8 (4) (December 1996): pp. 417-30; Danish Ministry of Taxation, Energy Taxes: The Danish Model (Copenhagen: Ministry of Taxation, September 6, 1998): p. 31; Stephen Tindale and Gerald Holtham, Green Tax Reform: Pollution Payments and Labour Tax Cuts (London: Institute for Public Policy Research, 1996): 98-122; F. Bossier and T Bréchet, “A Fiscal Reform for Increasing Employment and Mitigating CO2 Emissions in Europe,” Energy Policy 23(9) (1995): pp. 789-98; F. Bossier et al., Un redéploiement fiscal au service de l’emploi en Europe: Réduction du coût salarial financée par une taxe CO2 /énergie, Planning paper no.65 (Brussels: Bureau du Plan, November 1993): p. 45.
27 William J. Baumol and Wallace E. Oates, The Theory of Environmental Policy (Boston, MA: Cambridge University Press, January 1988); A. Myrick Freeman III, The Measurement of Environmental and Resource Values: Theory and Methods, Second Edition, (Washington, D.C.: RFF Press, 2003).
28 Alan H. Sanstad, Stephen J. DeCanio, and Gale A. Boyd, “Estimating Bounds on the Macroeconomic Effects of the Clean Energy Future Policy Scenarios,” Energy Policy, Volume 29, Issue 14 (November 2001).
29 This has been shown both theoretically and empirically. For good discussions of the theoretical implications of positive technological externalities, see Paul Roemer, “Endogenous Technological Change,” Journal of Political Economy, Volume 94(5) (1986) and “Increasing Returns and Long-Run Growth,” Journal of Political Economy, Volume 94(5) (1986); also Gene M. Grossman and Elhanan Helpman, Innovation and Growth in the Global Economy (Cambridge, MA: MIT Press, 1991); for a review, see E. Helpman, “Endogenous Macroeconomic Growth Theory,” European Economic Review, Volume 36(2-3) (1992). The substantial weight of empirical studies shows that returns to research and development are far in excess of measured private rates of return. See, e.g., Zvi Griliches, “The Search for R&D Spillovers,” Scandinavian Journal of Economics, Volume 94 (3, supplement) (1992): pp. 529-47; Edwin Mansfield, “The Contributions of New Technology to the Economy,” Technology, R&D, and the Economy, ed. Bruce L. Smith and Claude E. Barfield (Washington, D.C.: Brookings Institution, 1996); and Michael J. Boskin and Lawrence J. Lau, “Capital, Technology, and Economic Growth,” Technology and the Wealth of Nations, ed. Nathan Rosenberg, Ralph Landau, and David C. Mowrey (Stanford, CA: Stanford University Press, 1992).


![[PROPOSED] CONSENT DECREE - NRDC](https://img.pdfslide.us/doc/110x75/620cff0a282b357906659994/proposed-consent-decree-nrdc.jpg)