Embed Size (px)
Citation preview
FE Results for the Web
Page 1 of 23 July 30, 2012
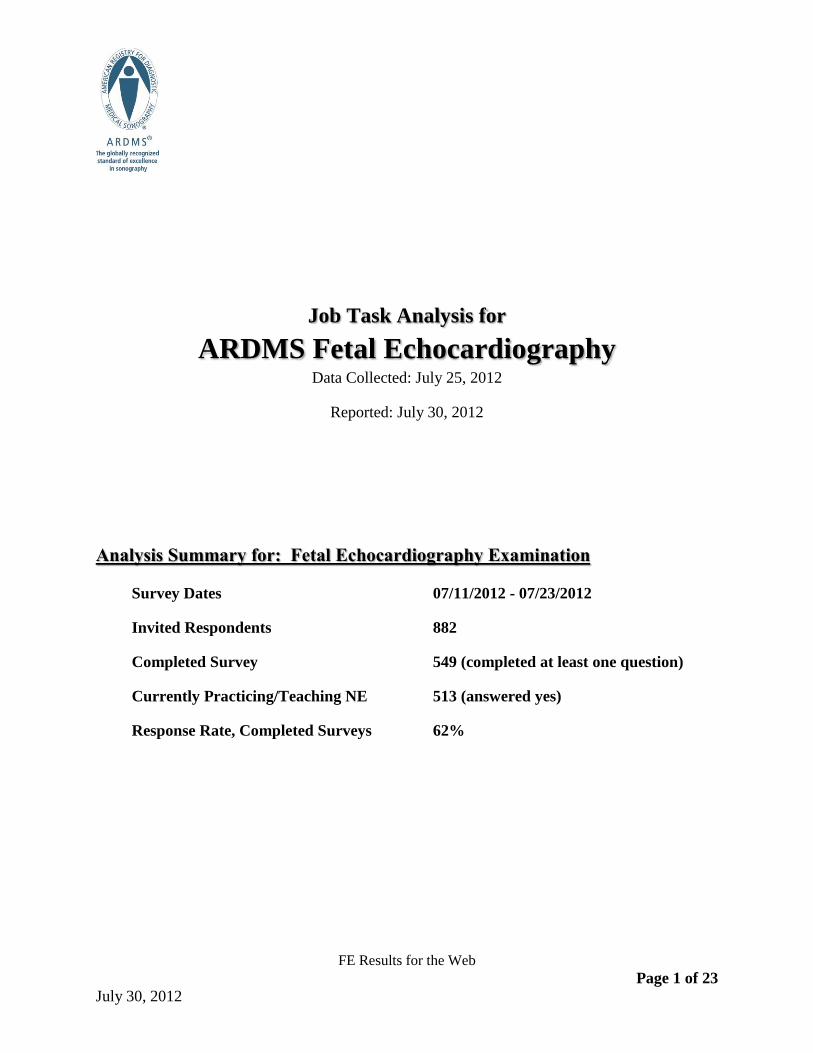
Job Task Analysis for
ARDMS Fetal Echocardiography Data Collected: July 25, 2012
Reported: July 30, 2012
Analysis Summary for: Fetal Echocardiography Examination
Survey Dates 07/11/2012 - 07/23/2012
Invited Respondents 882
Completed Survey
Currently Practicing/Teaching NE
549 (completed at least one question)
513 (answered yes)
Response Rate, Completed Surveys 62%

FE Results for the Web
Page 2 of 23 July 30, 2012
Demographics
Education Level
Sonography Education Level
N Percent
No-formal / on-the-job training 110 22%
Certificate program 196 38%
2-year college degree 92 18%
4-year college degree 80 16%
Master's degree 8 2%
Doctoral degree 4 1%
Professional degree 20 4%
Total 510 100%
Table 1. Sonography Education Level
Graphically, the sonography education level of respondents is represented below.
Figure 1. Sonography Education Level

FE Results for the Web
Page 3 of 23 July 30, 2012
Highest level of education overall is displayed in the table and figure below.
Highest Education Level
N Percent
Some secondary-level education 14 3%
High school diploma / GED 17 3%
Some college 58 11%
2-year college degree 152 30%
4-year college degree 191 37%
Master's degree 30 6%
Doctoral degree 9 2%
Professional degree 39 8%
Total 510 100%
Table 2. Highest Education Level
Figure 2. Highest Education Level
FE Results for the Web
Page 4 of 23 July 30, 2012
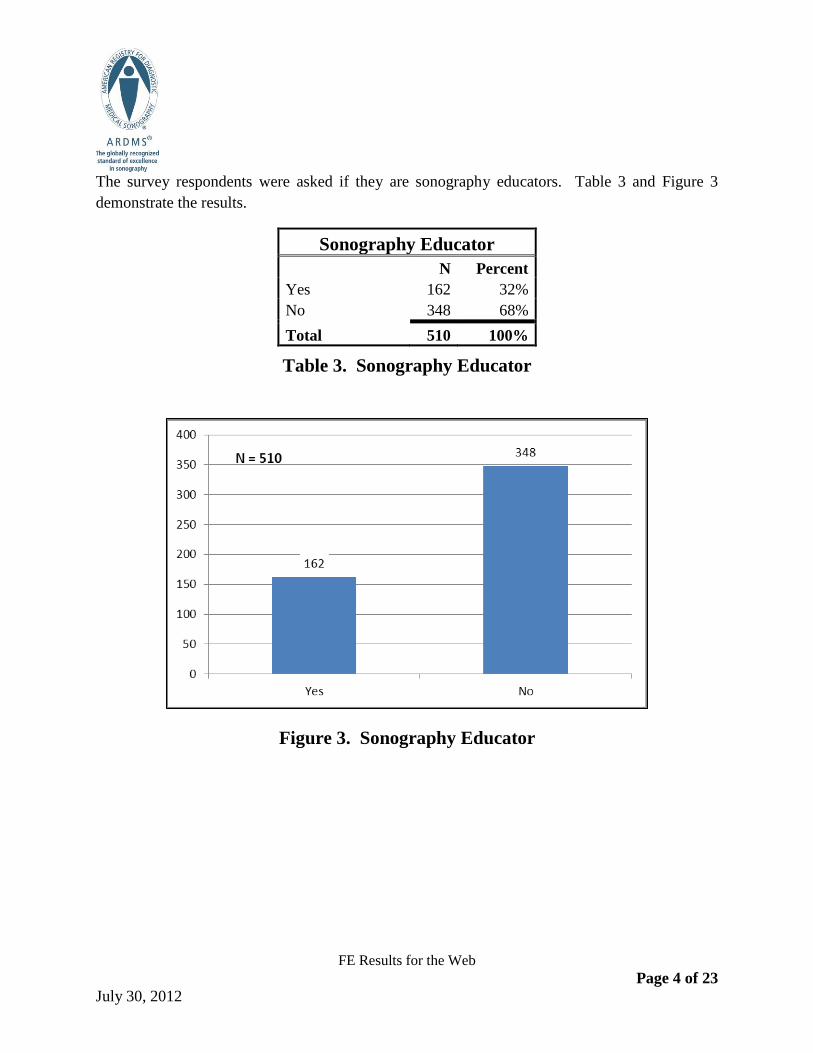
The survey respondents were asked if they are sonography educators. Table 3 and Figure 3
demonstrate the results.
Sonography Educator
N Percent
Yes 162 32%
No 348 68%
Total 510 100%
Table 3. Sonography Educator
Figure 3. Sonography Educator
FE Results for the Web
Page 5 of 23 July 30, 2012
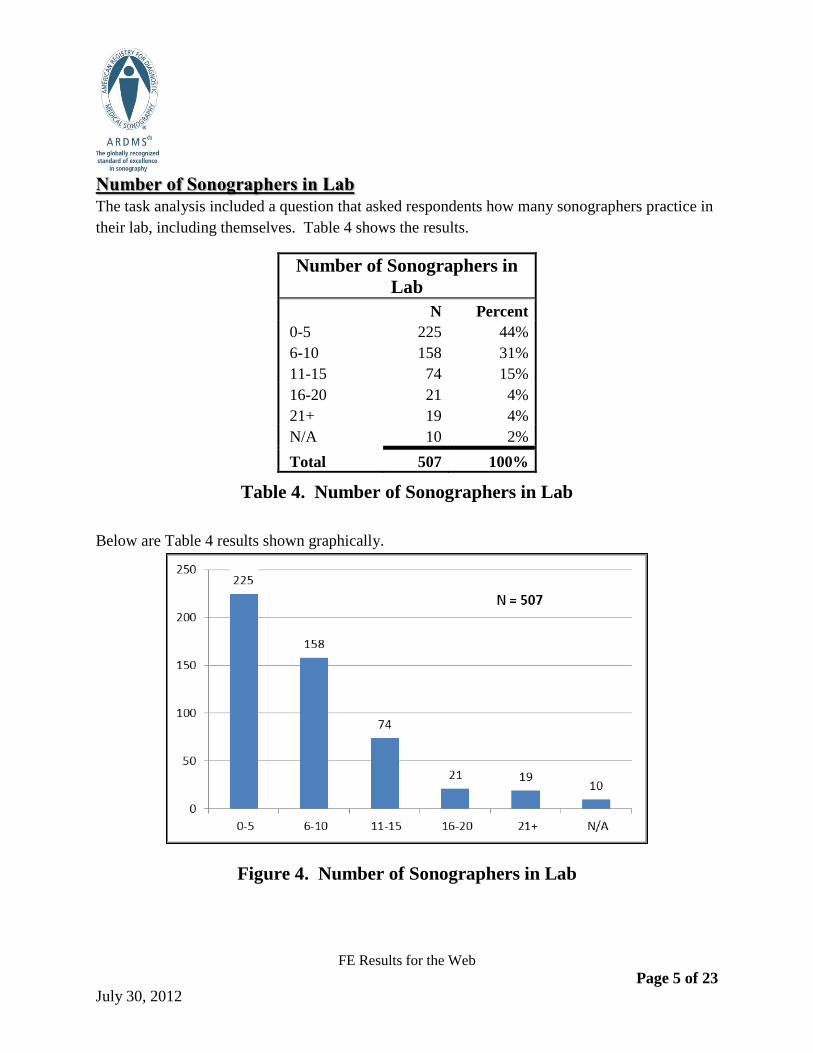
Number of Sonographers in Lab
The task analysis included a question that asked respondents how many sonographers practice in
their lab, including themselves. Table 4 shows the results.
Number of Sonographers in
Lab
N Percent
0-5 225 44%
6-10 158 31%
11-15 74 15%
16-20 21 4%
21+ 19 4%
N/A 10 2%
Total 507 100%
Table 4. Number of Sonographers in Lab
Below are Table 4 results shown graphically.
Figure 4. Number of Sonographers in Lab
FE Results for the Web
Page 6 of 23 July 30, 2012
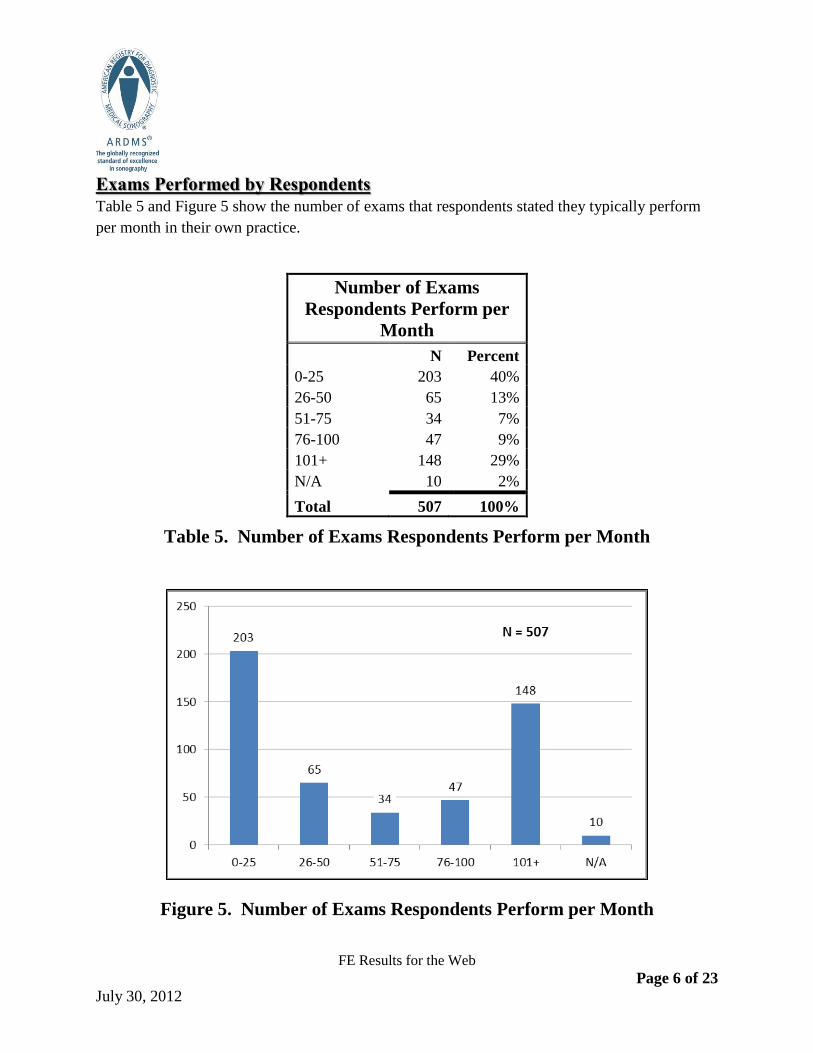
Exams Performed by Respondents
Table 5 and Figure 5 show the number of exams that respondents stated they typically perform
per month in their own practice.
Number of Exams
Respondents Perform per
Month
N Percent
0-25 203 40%
26-50 65 13%
51-75 34 7%
76-100 47 9%
101+ 148 29%
N/A 10 2%
Total 507 100%
Table 5. Number of Exams Respondents Perform per Month
Figure 5. Number of Exams Respondents Perform per Month
FE Results for the Web
Page 7 of 23 July 30, 2012
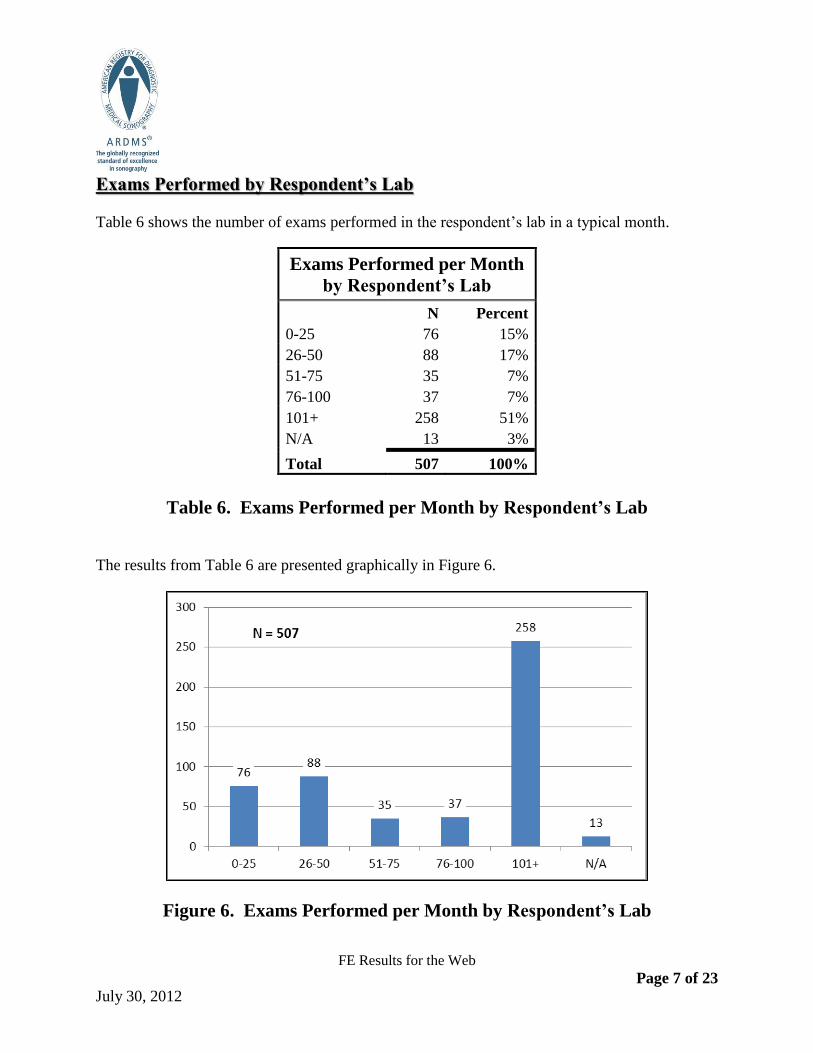
Exams Performed by Respondent’s Lab
Table 6 shows the number of exams performed in the respondent’s lab in a typical month.
Exams Performed per Month
by Respondent’s Lab
N Percent
0-25 76 15%
26-50 88 17%
51-75 35 7%
76-100 37 7%
101+ 258 51%
N/A 13 3%
Total 507 100%
Table 6. Exams Performed per Month by Respondent’s Lab
The results from Table 6 are presented graphically in Figure 6.
Figure 6. Exams Performed per Month by Respondent’s Lab
FE Results for the Web
Page 8 of 23 July 30, 2012
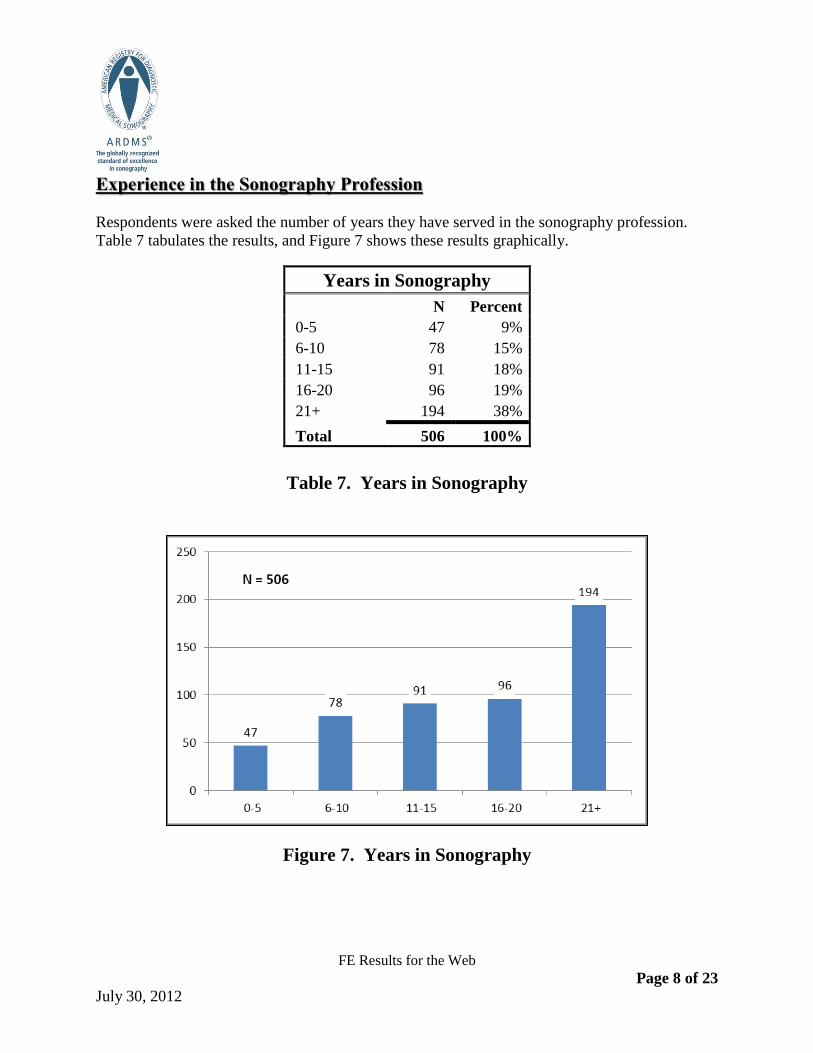
Experience in the Sonography Profession
Respondents were asked the number of years they have served in the sonography profession.
Table 7 tabulates the results, and Figure 7 shows these results graphically.
Years in Sonography
N Percent
0-5 47 9%
6-10 78 15%
11-15 91 18%
16-20 96 19%
21+ 194 38%
Total 506 100%
Table 7. Years in Sonography
Figure 7. Years in Sonography
FE Results for the Web
Page 9 of 23 July 30, 2012
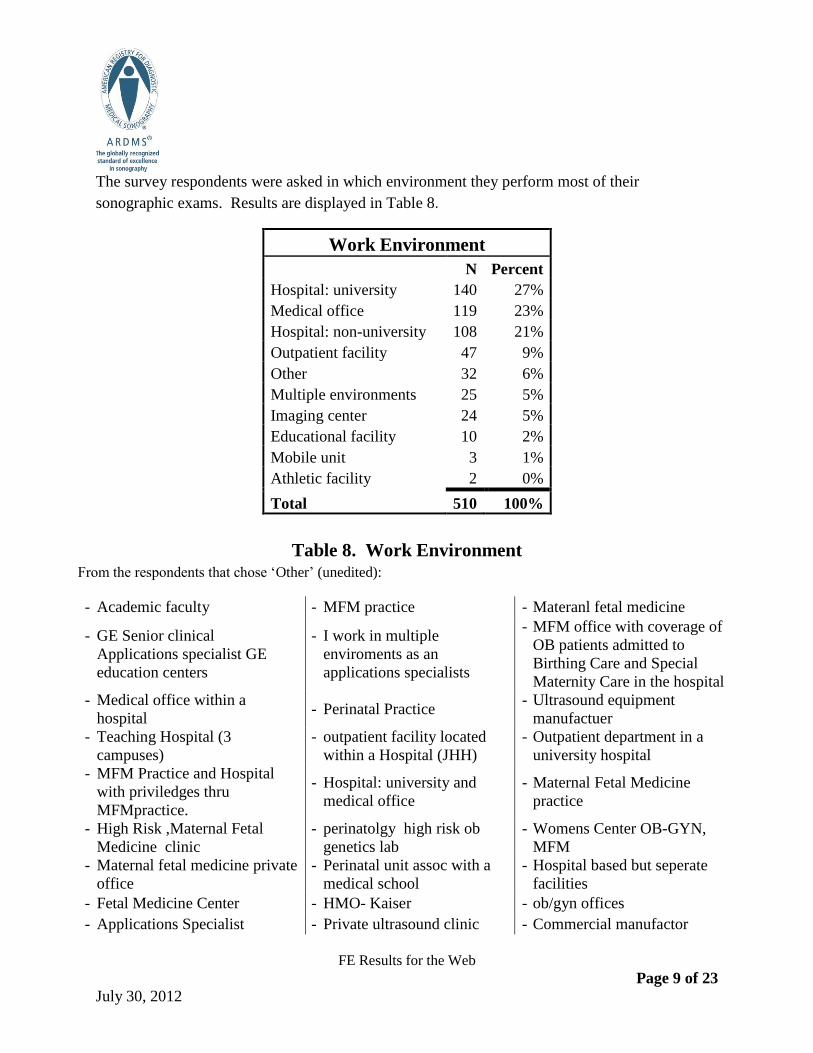
The survey respondents were asked in which environment they perform most of their
sonographic exams. Results are displayed in Table 8.
Work Environment
N Percent
Hospital: university 140 27%
Medical office 119 23%
Hospital: non-university 108 21%
Outpatient facility 47 9%
Other 32 6%
Multiple environments 25 5%
Imaging center 24 5%
Educational facility 10 2%
Mobile unit 3 1%
Athletic facility 2 0%
Total 510 100%
Table 8. Work Environment From the respondents that chose ‘Other’ (unedited):
- Academic faculty - MFM practice - Materanl fetal medicine
- GE Senior clinical
Applications specialist GE
education centers
- I work in multiple
enviroments as an
applications specialists
- MFM office with coverage of
OB patients admitted to
Birthing Care and Special
Maternity Care in the hospital
- Medical office within a
hospital - Perinatal Practice
- Ultrasound equipment
manufactuer
- Teaching Hospital (3
campuses)
- outpatient facility located
within a Hospital (JHH)
- Outpatient department in a
university hospital
- MFM Practice and Hospital
with priviledges thru
MFMpractice.
- Hospital: university and
medical office
- Maternal Fetal Medicine
practice
- High Risk ,Maternal Fetal
Medicine clinic
- perinatolgy high risk ob
genetics lab
- Womens Center OB-GYN,
MFM
- Maternal fetal medicine private
office
- Perinatal unit assoc with a
medical school
- Hospital based but seperate
facilities
- Fetal Medicine Center - HMO- Kaiser - ob/gyn offices
- Applications Specialist - Private ultrasound clinic - Commercial manufactor
FE Results for the Web
Page 10 of 23 July 30, 2012
- Out patient clinic connected to
university hospital
- Maternal fetal medicine
office
- MFM office within the
hospital
- Maternal fetal medicine - perinatal center
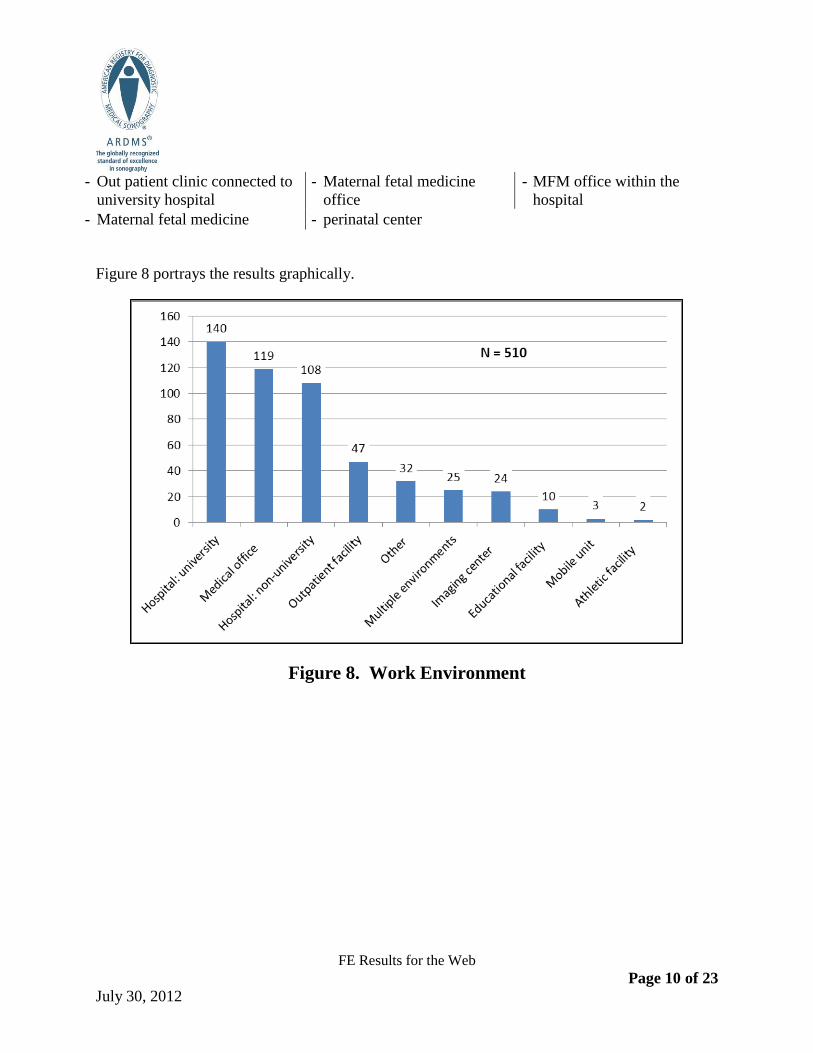
Figure 8 portrays the results graphically.
Figure 8. Work Environment
FE Results for the Web
Page 11 of 23 July 30, 2012
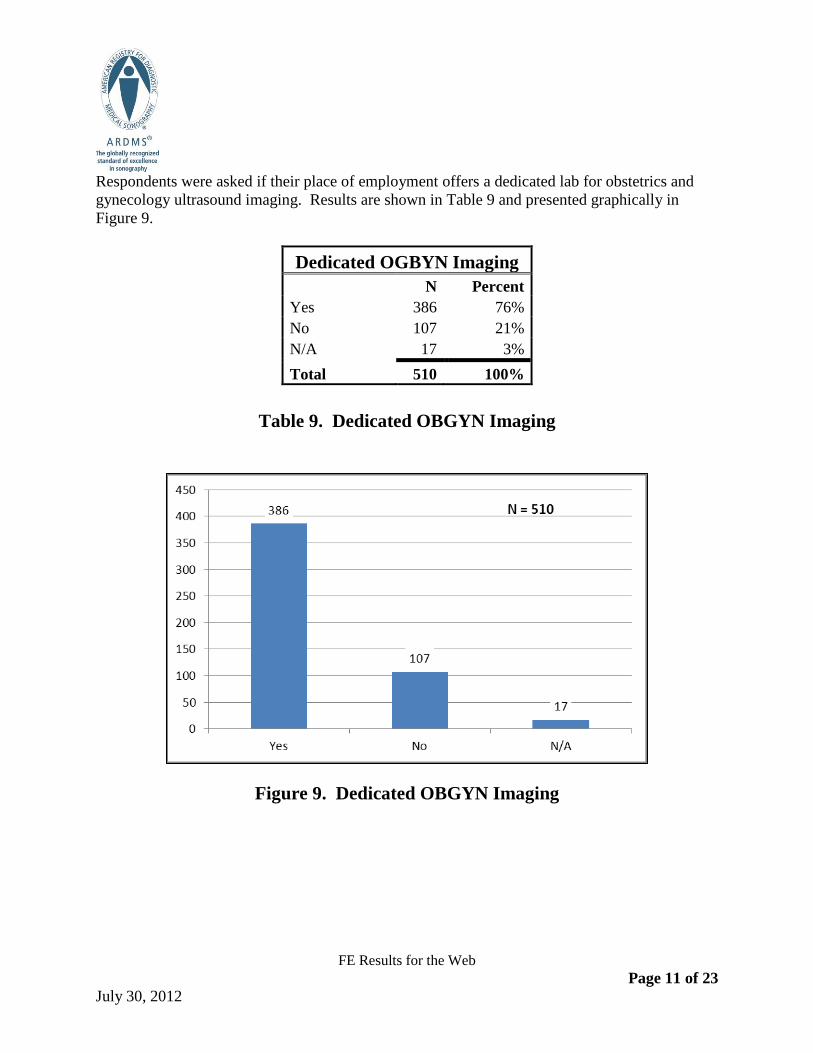
Respondents were asked if their place of employment offers a dedicated lab for obstetrics and
gynecology ultrasound imaging. Results are shown in Table 9 and presented graphically in
Figure 9.
Dedicated OGBYN Imaging
N Percent
Yes 386 76%
No 107 21%
N/A 17 3%
Total 510 100%
Table 9. Dedicated OBGYN Imaging
Figure 9. Dedicated OBGYN Imaging
FE Results for the Web
Page 12 of 23 July 30, 2012
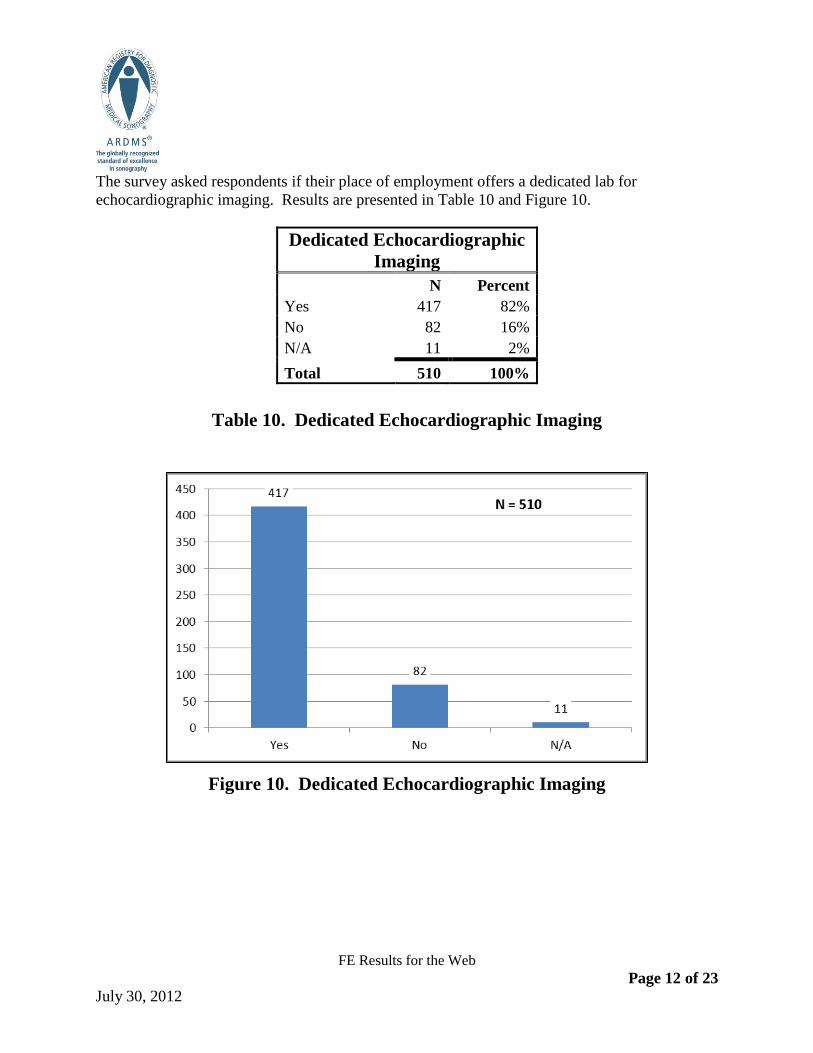
The survey asked respondents if their place of employment offers a dedicated lab for
echocardiographic imaging. Results are presented in Table 10 and Figure 10.
Dedicated Echocardiographic
Imaging
N Percent
Yes 417 82%
No 82 16%
N/A 11 2%
Total 510 100%
Table 10. Dedicated Echocardiographic Imaging
Figure 10. Dedicated Echocardiographic Imaging
FE Results for the Web
Page 13 of 23 July 30, 2012
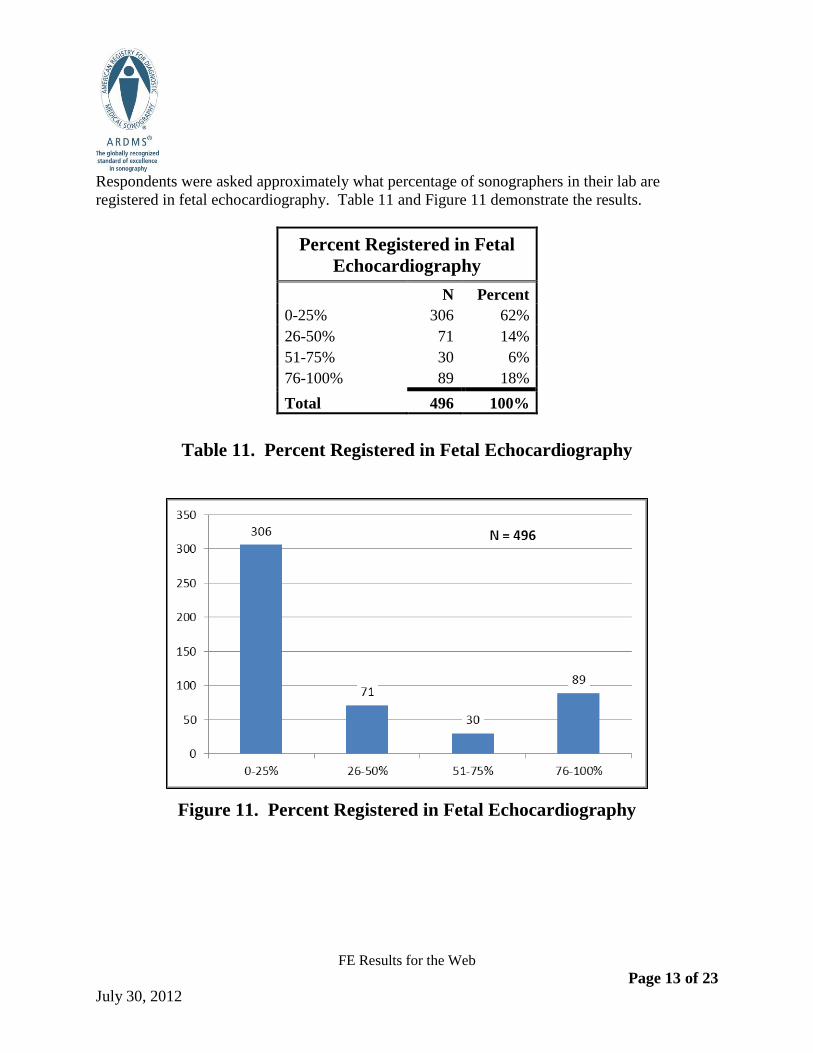
Respondents were asked approximately what percentage of sonographers in their lab are
registered in fetal echocardiography. Table 11 and Figure 11 demonstrate the results.
Percent Registered in Fetal
Echocardiography
N Percent
0-25% 306 62%
26-50% 71 14%
51-75% 30 6%
76-100% 89 18%
Total 496 100%
Table 11. Percent Registered in Fetal Echocardiography
Figure 11. Percent Registered in Fetal Echocardiography
FE Results for the Web
Page 14 of 23 July 30, 2012
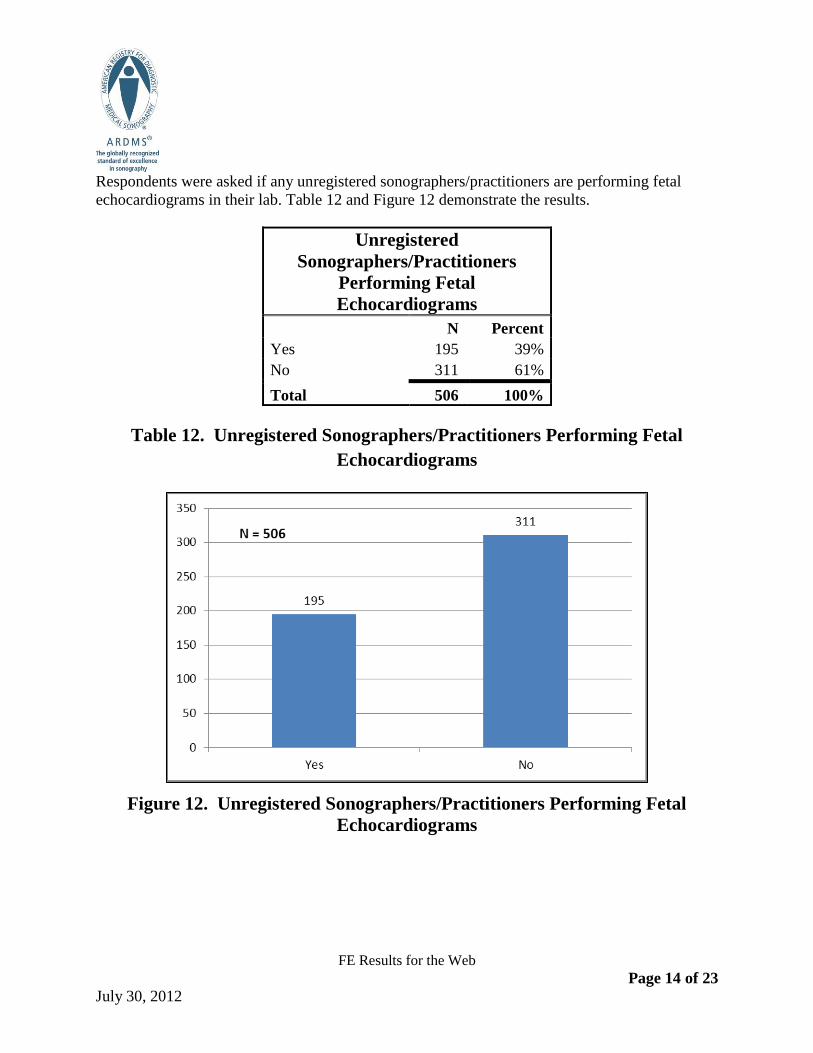
Respondents were asked if any unregistered sonographers/practitioners are performing fetal
echocardiograms in their lab. Table 12 and Figure 12 demonstrate the results.
Unregistered
Sonographers/Practitioners
Performing Fetal
Echocardiograms
N Percent
Yes 195 39%
No 311 61%
Total 506 100%
Table 12. Unregistered Sonographers/Practitioners Performing Fetal
Echocardiograms
Figure 12. Unregistered Sonographers/Practitioners Performing Fetal
Echocardiograms
FE Results for the Web
Page 15 of 23 July 30, 2012
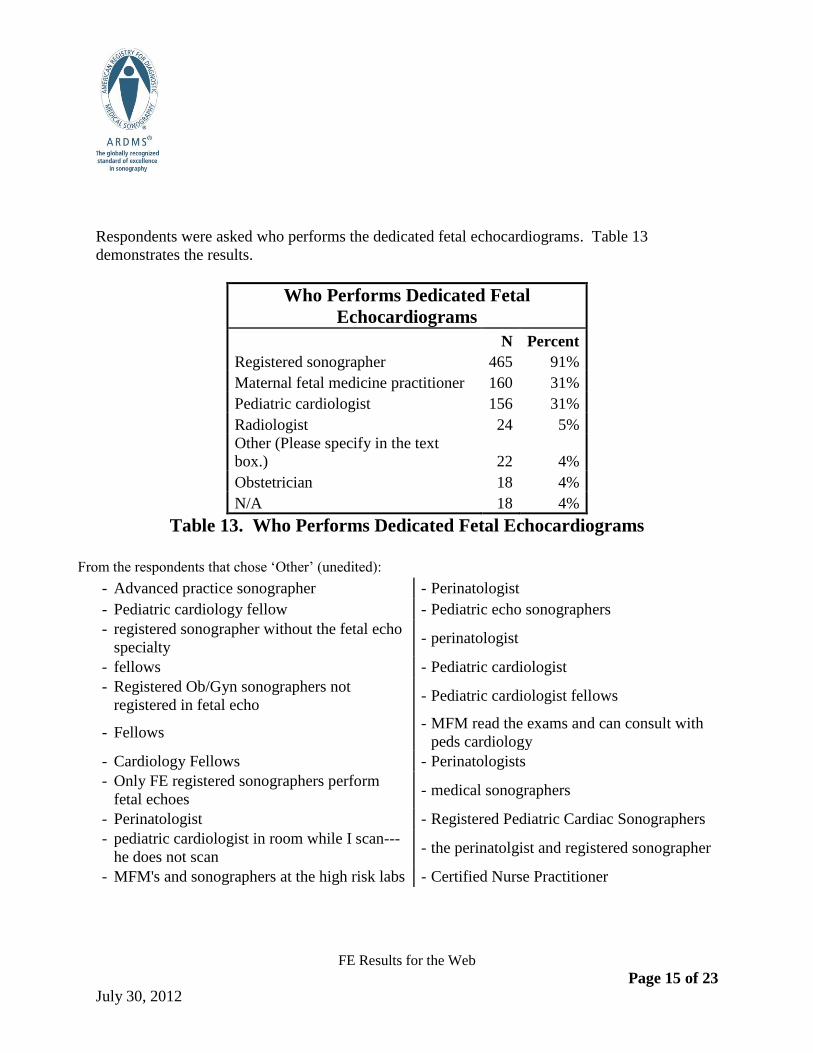
Respondents were asked who performs the dedicated fetal echocardiograms. Table 13
demonstrates the results.
Who Performs Dedicated Fetal
Echocardiograms
N Percent
Registered sonographer 465 91%
Maternal fetal medicine practitioner 160 31%
Pediatric cardiologist 156 31%
Radiologist 24 5%
Other (Please specify in the text
box.) 22 4%
Obstetrician 18 4%
N/A 18 4%
Table 13. Who Performs Dedicated Fetal Echocardiograms
From the respondents that chose ‘Other’ (unedited):
- Advanced practice sonographer - Perinatologist
- Pediatric cardiology fellow - Pediatric echo sonographers
- registered sonographer without the fetal echo
specialty - perinatologist
- fellows - Pediatric cardiologist
- Registered Ob/Gyn sonographers not
registered in fetal echo - Pediatric cardiologist fellows
- Fellows - MFM read the exams and can consult with
peds cardiology
- Cardiology Fellows - Perinatologists
- Only FE registered sonographers perform
fetal echoes - medical sonographers
- Perinatologist - Registered Pediatric Cardiac Sonographers
- pediatric cardiologist in room while I scan---
he does not scan - the perinatolgist and registered sonographer
- MFM's and sonographers at the high risk labs - Certified Nurse Practitioner
FE Results for the Web
Page 16 of 23 July 30, 2012
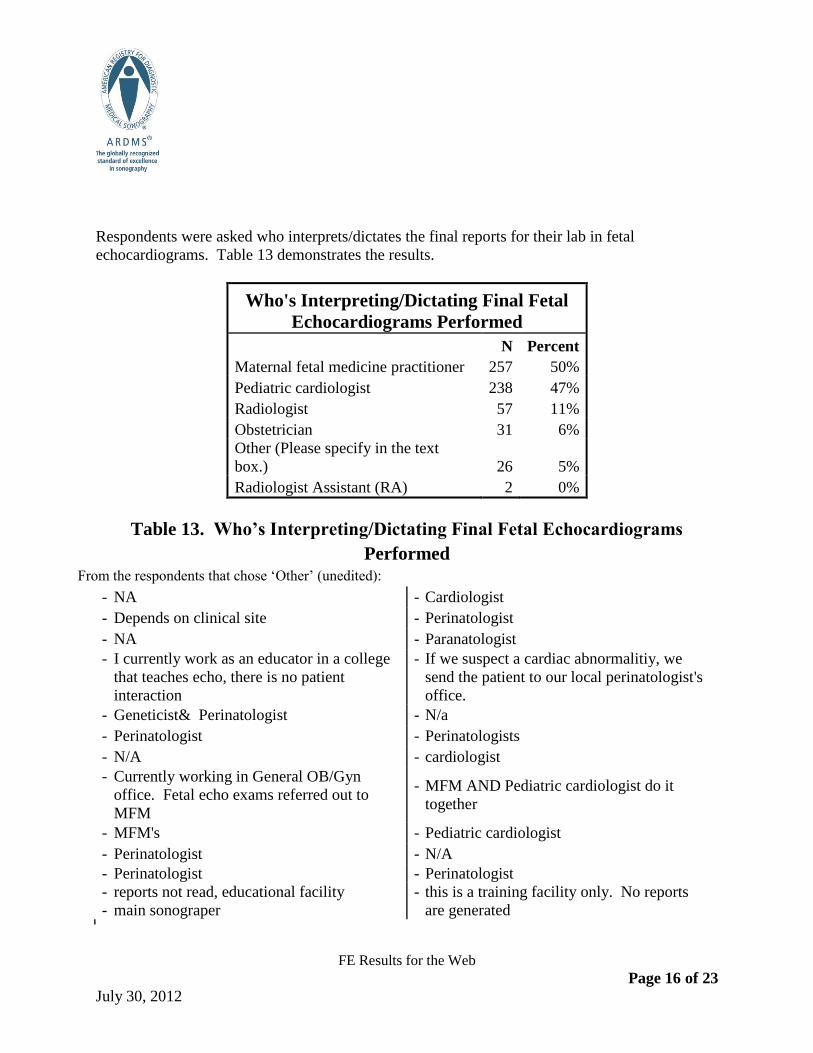
Respondents were asked who interprets/dictates the final reports for their lab in fetal
echocardiograms. Table 13 demonstrates the results.
Who's Interpreting/Dictating Final Fetal
Echocardiograms Performed
N Percent
Maternal fetal medicine practitioner 257 50%
Pediatric cardiologist 238 47%
Radiologist 57 11%
Obstetrician 31 6%
Other (Please specify in the text
box.) 26 5%
Radiologist Assistant (RA) 2 0%
Table 13. Who’s Interpreting/Dictating Final Fetal Echocardiograms
Performed From the respondents that chose ‘Other’ (unedited):
- NA - Cardiologist
- Depends on clinical site - Perinatologist
- NA - Paranatologist
- I currently work as an educator in a college
that teaches echo, there is no patient
interaction
- If we suspect a cardiac abnormalitiy, we
send the patient to our local perinatologist's
office.
- Geneticist& Perinatologist - N/a
- Perinatologist - Perinatologists
- N/A - cardiologist
- Currently working in General OB/Gyn
office. Fetal echo exams referred out to
MFM
- MFM AND Pediatric cardiologist do it
together
- MFM's - Pediatric cardiologist
- Perinatologist - N/A
- Perinatologist - Perinatologist
- reports not read, educational facility
- main sonograper
- this is a training facility only. No reports
are generated
FE Results for the Web
Page 17 of 23 July 30, 2012
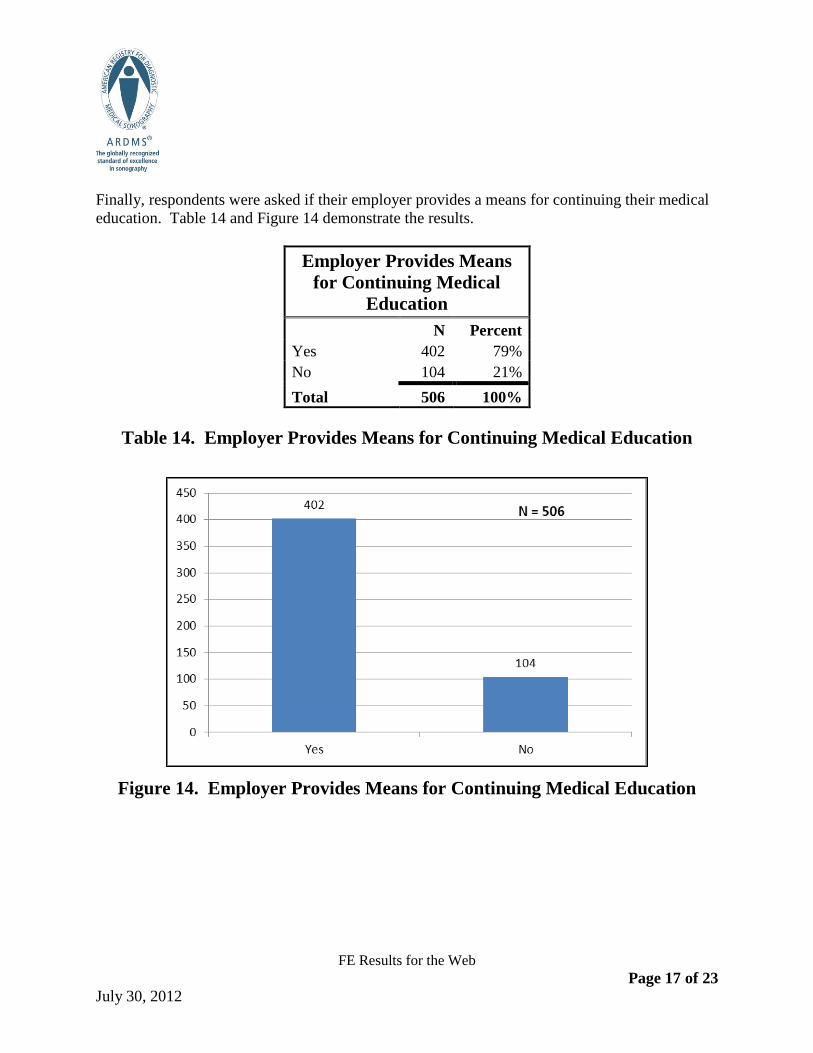
Finally, respondents were asked if their employer provides a means for continuing their medical
education. Table 14 and Figure 14 demonstrate the results.
Employer Provides Means
for Continuing Medical
Education
N Percent
Yes 402 79%
No 104 21%
Total 506 100%
Table 14. Employer Provides Means for Continuing Medical Education
Figure 14. Employer Provides Means for Continuing Medical Education

FE Results for the Web
Page 18 of 23 July 30, 2012
Primary Work Location
Respondents were asked to designate the primary country in which they work. Results are
presented in Table 15.
Primary Country of Work
N Percent
United States of America 466 91%
Canada 20 4%
Republic of Korea 8 2%
China 3 1%
India 3 1%
Afghanistan 1 0%
Australia 1 0%
Bulgaria 1 0%
Democratic People's Republic of Korea 1 0%
Egypt 1 0%
Iran 1 0%
Italy 1 0%
Pakistan 1 0%
Romania 1 0%
United Arab Emirates 1 0%
Total 510 100%
Table 15. Primary Country of Work
FE Results for the Web
Page 19 of 23 July 30, 2012
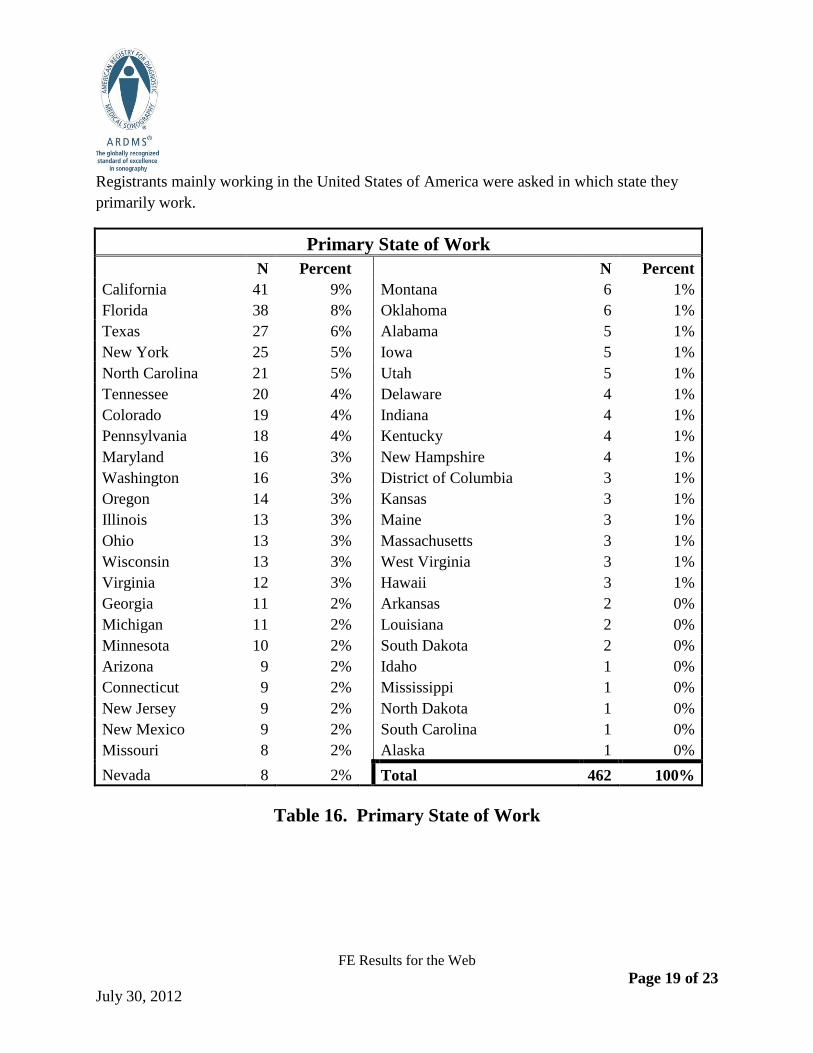
Registrants mainly working in the United States of America were asked in which state they
primarily work.
Primary State of Work
N Percent
N Percent
California 41 9%
Montana 6 1%
Florida 38 8%
Oklahoma 6 1%
Texas 27 6%
Alabama 5 1%
New York 25 5%
Iowa 5 1%
North Carolina 21 5%
Utah 5 1%
Tennessee 20 4%
Delaware 4 1%
Colorado 19 4%
Indiana 4 1%
Pennsylvania 18 4%
Kentucky 4 1%
Maryland 16 3%
New Hampshire 4 1%
Washington 16 3%
District of Columbia 3 1%
Oregon 14 3%
Kansas 3 1%
Illinois 13 3%
Maine 3 1%
Ohio 13 3%
Massachusetts 3 1%
Wisconsin 13 3%
West Virginia 3 1%
Virginia 12 3%
Hawaii 3 1%
Georgia 11 2%
Arkansas 2 0%
Michigan 11 2%
Louisiana 2 0%
Minnesota 10 2%
South Dakota 2 0%
Arizona 9 2%
Idaho 1 0%
Connecticut 9 2%
Mississippi 1 0%
New Jersey 9 2%
North Dakota 1 0%
New Mexico 9 2%
South Carolina 1 0%
Missouri 8 2%
Alaska 1 0%
Nevada 8 2%
Total 462 100%
Table 16. Primary State of Work

FE Results for the Web
Page 20 of 23 July 30, 2012
Respondents mainly working in Canada were asked in which province or territory they primarily
work.
Primary Province or Territory of
Work
N Percent
Ontario 13 65%
Alberta 3 15%
British Columbia 1 5%
Manitoba 1 5%
Nova Scotia 1 5%
Saskatchewan 1 5%
Total 20 100%
Table 17. Primary Province or Territory of Work
FE Results for the Web
Page 21 of 23 July 30, 2012
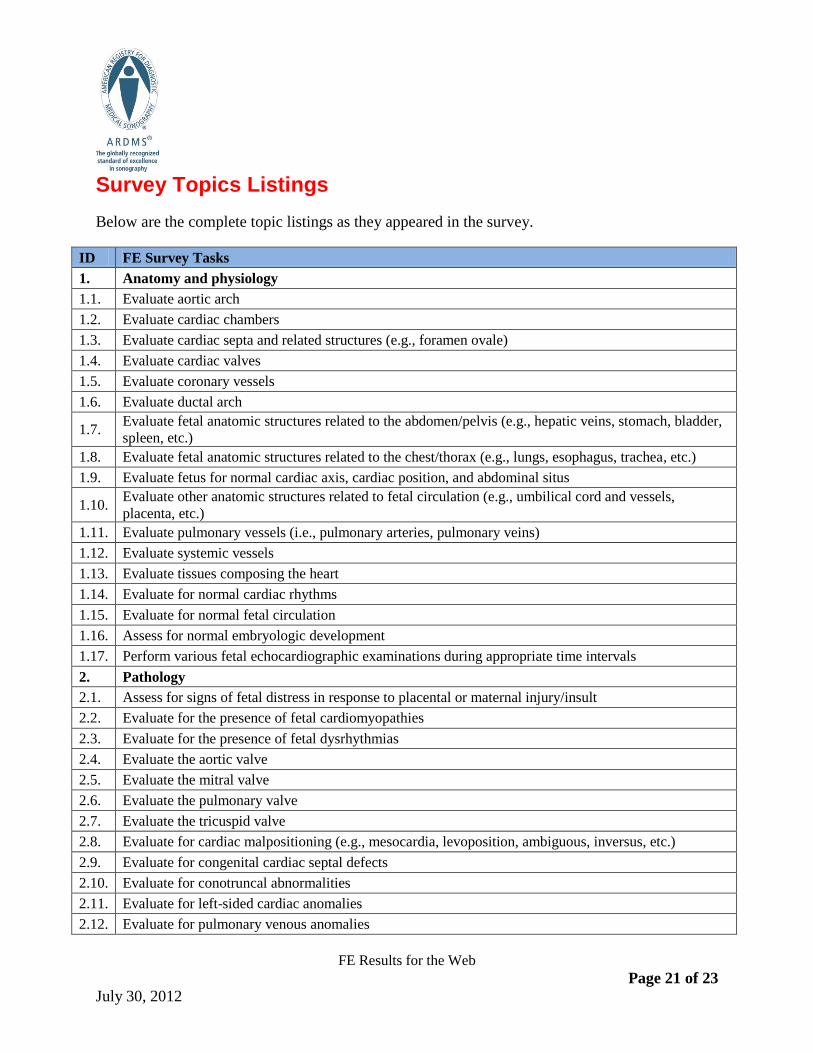
Survey Topics Listings
Below are the complete topic listings as they appeared in the survey.
ID FE Survey Tasks
1. Anatomy and physiology
1.1. Evaluate aortic arch
1.2. Evaluate cardiac chambers
1.3. Evaluate cardiac septa and related structures (e.g., foramen ovale)
1.4. Evaluate cardiac valves
1.5. Evaluate coronary vessels
1.6. Evaluate ductal arch
1.7. Evaluate fetal anatomic structures related to the abdomen/pelvis (e.g., hepatic veins, stomach, bladder,
spleen, etc.)
1.8. Evaluate fetal anatomic structures related to the chest/thorax (e.g., lungs, esophagus, trachea, etc.)
1.9. Evaluate fetus for normal cardiac axis, cardiac position, and abdominal situs
1.10. Evaluate other anatomic structures related to fetal circulation (e.g., umbilical cord and vessels,
placenta, etc.)
1.11. Evaluate pulmonary vessels (i.e., pulmonary arteries, pulmonary veins)
1.12. Evaluate systemic vessels
1.13. Evaluate tissues composing the heart
1.14. Evaluate for normal cardiac rhythms
1.15. Evaluate for normal fetal circulation
1.16. Assess for normal embryologic development
1.17. Perform various fetal echocardiographic examinations during appropriate time intervals
2. Pathology
2.1. Assess for signs of fetal distress in response to placental or maternal injury/insult
2.2. Evaluate for the presence of fetal cardiomyopathies
2.3. Evaluate for the presence of fetal dysrhythmias
2.4. Evaluate the aortic valve
2.5. Evaluate the mitral valve
2.6. Evaluate the pulmonary valve
2.7. Evaluate the tricuspid valve
2.8. Evaluate for cardiac malpositioning (e.g., mesocardia, levoposition, ambiguous, inversus, etc.)
2.9. Evaluate for congenital cardiac septal defects
2.10. Evaluate for conotruncal abnormalities
2.11. Evaluate for left-sided cardiac anomalies
2.12. Evaluate for pulmonary venous anomalies
FE Results for the Web
Page 22 of 23 July 30, 2012
2.13. Evaluate for right-sided cardiac anomalies
2.14. Evaluate for systemic venous anomalies
2.15. Evaluate for the presence of congenital cardiac masses
2.16. Evaluate the fetus for sonographic signs related to various genetic syndromes (e.g., Down, Noonan,
Turner, etc.)
3. Patient care
3.1. Maintain infection control
3.2. Practice Universal Precautions
4. Integration of data
4.1. Assess indications for performing a fetal echocardiogram
4.2. Obtain pertinent medical history of patient
4.3. Use chromosomal anomalies or genetic syndromes as exam indicators
4.4. Use family history as exam indicator
4.5. Use fetal clinical signs and symptoms to guide the echocardiogram
4.6. Use fetal dysrhythmias as exam indicators
4.7. Use fetal extracardiac malformations as exam indicators
4.8. Use hydrops as exam indicator
4.9. Use maternal clinical signs and symptoms related to fetal pathology as guidance for the
echocardiogram
4.10. Use maternal diseases as exam indicators
4.11. Use maternal drug exposure as exam indicators
4.12. Use suspected cardiac abnormality on an outside scan as exam indicator
4.13. Use thickened nuchal translucency as exam indicator
4.14. Compare echocardiographic results to other imaging modalities
5. Protocols
5.1. Demonstrate the cardiac five-chamber view
5.2. Demonstrate the four-chamber views (i.e., apical, subcostal)
5.3. Demonstrate the long-axis views (i.e., aorta, pulmonary artery)
5.4. Demonstrate the pulmonary vein and branches views
5.5. Demonstrate the short-axis views (i.e., ventricles, great vessels)
5.6. Demonstrate the orientation of the great vessels using various cardiac views
5.7. Demonstrate the three-vessel view
5.8. Demonstrate the various views of the arches (i.e., aortic, ductal)
5.9. Demonstrate the vena caval views
5.10. Use Doppler to evaluate fetal heart rate
5.11. Use M-mode to evaluate fetal heart rate
5.12. Perform various gray-scale measurements to assess visualized pathology
5.13. Perform various gray-scale measurements to assess visualized cardiac structures
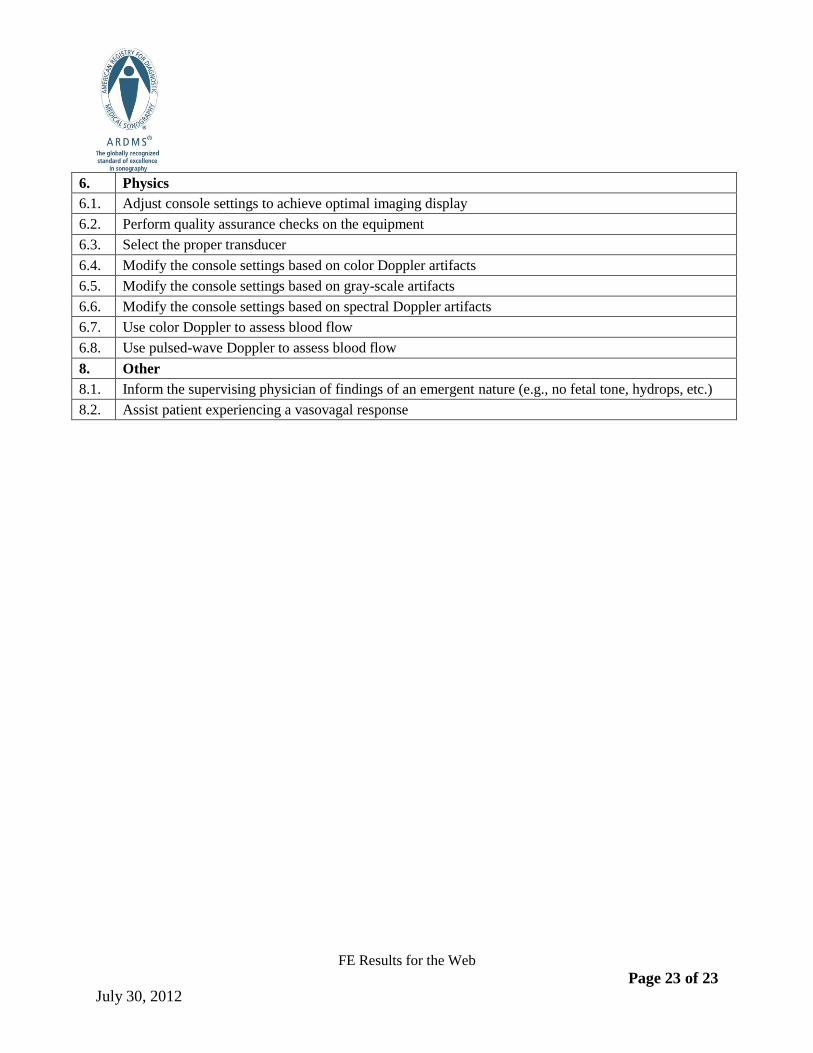
FE Results for the Web
Page 23 of 23 July 30, 2012
6. Physics
6.1. Adjust console settings to achieve optimal imaging display
6.2. Perform quality assurance checks on the equipment
6.3. Select the proper transducer
6.4. Modify the console settings based on color Doppler artifacts
6.5. Modify the console settings based on gray-scale artifacts
6.6. Modify the console settings based on spectral Doppler artifacts
6.7. Use color Doppler to assess blood flow
6.8. Use pulsed-wave Doppler to assess blood flow
8. Other
8.1. Inform the supervising physician of findings of an emergent nature (e.g., no fetal tone, hydrops, etc.)
8.2. Assist patient experiencing a vasovagal response