Embed Size (px)
Citation preview
Job search methods, intensity and success in Britain in the 1990s
by
René Böheim
and
Mark P Taylor*)
Working Paper No. 0206
July 2002
DDEEPPAARRTTMMEENNTT OOFF EECCOONNOOMMIICCSS
JJOOHHAANNNNEESS KKEEPPLLEERR UUNNIIVVEERRSSIITTYY OOFF LLIINNZZ
Johannes Kepler University of Linz Department of Economics
Altenberger Strasse 69 A-4040 Linz - Auhof, Austria
www.economics.uni-linz.ac.at
*) corresponding author: [email protected]
1
Job search methods, intensity and success in Britain in the 1990s
René Böheim Department of Economics
Johannes Kepler University Linz, Austria
and
Mark P. Taylor∗
Institute for Social and Economic Research University of Essex Colchester, Essex
CO4 3SQ
17 July 2002
Word count: 10280
Abstract: We investigate the use of various job search strategies and their impact on the probability of subsequent employment and the re-employment wage among working age men in Britain. We find that replying to advertisements and using Job Centres are the two most common methods of job search and that job search intensity, and direct applications to employers in particular, result in a higher probability of subsequent employment. Conditional on finding work, replying to advertisements results in higher paying employment. Age, education, family circumstances and local labour demand emerge as key determinants of job search strategy use. JEL classification: J11, J20, J62, J64, C33 Keywords: Job Mobility, Unemployment, BHPS, Panel data, Job search Acknowledgements: Thanks to Alison Booth, and participants at the TSER/CEPR meeting, Labour Demand, Education and Social Exclusion, Florence, Italy (June, 2001), the European Society of Population Economics Annual Congress, Athens, Greece (June, 2001) and the BHPS 2001 conference for helpful comments. Financial support from the ESRC, University
∗ Corresponding author: [email protected]
2
of Essex and Leverhulme Trust is gratefully acknowledged. This research derives from an Institute for Labour Research programme on “Labour Market Dynamics in a Changing Environment” funded by the Leverhulme Trust. Introduction
Osberg (1993) famously compares job search to fishing. Like a fisherman, the job seeker uses
various forms of lure and tries different locations in an attempt to catch the big fish. However,
the actual process of job search has received relatively little attention in the job search
literature, which has generally focussed on the determinants of the reservation wage in a
framework that assumes the job offer arrival rate to be exogenous (e.g. Narendranathan and
Nickell, 1985). The probability of receiving an offer is likely to depend on an individual’s job
search strategy - a greater investment in search activity will yield more information on
vacancies which is likely to result in a higher probability of receiving a job offer. Job search
methods differ in their time and money costs and in their expected returns, while individuals
differ in their motives for job search, and their job search competence and constraints.
Different job search strategies will typically attract different types of employment.
Furthermore, if different strategies draw offers from different pools of potential employers
with different distributions of potential wage offers, then it is desirable for individuals to vary
their search effort across strategies as the marginal returns in each strategy will differ. An
individual’s choice of search strategy will reflect their perceptions of the costs and benefits
associated with each method. Our aim in this paper is to investigate the use of various job
search strategies among unemployed men in Britain in the 1990s, and examine their impact
on the probability of entering employment and on the re-employment wage.
Recent British studies have shown that unemployment has scarring effects on individuals.
Arulampalam et al (2000) conclude that for mature men some 40% of the observed
2
persistence in the unemployment probability is accounted for by state dependence. Gregg
(2001) reaches similar conclusions – a man’s previous unemployment experience has
implications for his future labour market behaviour. Gregory and Jukes (2001) and
Arulampalam (2001) provide evidence suggesting that unemployment results in earnings
some 10% lower than pre-unemployment earnings. This effect is found to persist. Gregory
and Jukes (2001) also find unemployment duration to have a permanent impact on subsequent
earnings, proportional to the length of the unemployment spell. The latter in particular
highlights the importance of using efficient job search methods when unemployed if the loss
of current income during unemployment is not to be compounded by earnings reductions and
further scarring on re-entry to work.
Sociologists have linked the probability of finding a job to ‘social cohesion’ – Granovetter
(1974) finds that the majority of white collar workers report obtaining their current job
through personal contacts, while more recently Hannan (1999) concludes that informal
contacts and strong social networks are important in finding work. This has also long been
known to economists. Rees (1966) suggests that good jobs are usually found through informal
information networks and personal contacts. More recently however Gregg and Wadsworth
(1996) find such effects to be negligible for the long-term unemployed. Although Pissarides
(1979) and Gregg and Wadsworth (1996) focus on the use of state employment agencies, and
Jones (1989) presents evidence on search intensity in a variety of search methods, there are
few British studies that explicitly incorporate search method and intensity into an
econometric framework.
Previous research has shown that Job Centres and replying to advertisements are the two most
commonly used methods of job search for the unemployed in Britain (Jones, 1989; Gregg and
3
Wadsworth, 1996; Labour Market Trends, 1999). The most common ways of obtaining a job
are from hearing from someone who already works in the establishment, and from replying to
an advertisement (Labour Market Trends, 1999). In the U.S. and Canada, direct applications
to firms and using friends and family contacts are more frequent methods of job search, and
these are also associated with an above average probability of job search success (Holzer,
1988; Osberg, 1993). Holzer (1988) suggests that employers regard referrals from employees
as more informative and reliable than direct applications and use them as a relatively cheap
screening and signalling mechanism, while Rees (1966) indicates that employees only refer
capable workers to ensure that their own reputation with their employer is not tarnished.
Evidence suggests that job seekers in Britain use multiple search methods rather than rely on
a single method strategy. Gregg and Wadsworth (1996) report that on average unemployed
individuals in Britain use three job search methods, similar to the number used by
unemployed youth in the U.S. (Holzer, 1988) but more than that recently found for the
unemployed in Portugal (Addison and Portugal, 1998). A positive relationship between job
search intensity and the probability of receiving and accepting a job offer is a common
finding in the literature (Holzer, 1988; Gregg and Wadsworth, 1996). Wanberg et al (1999)
suggest that search intensity is determined by the degree of financial hardship and
commitment to the labour market.
An individual’s choice of job search strategy will also reflect employers’ recruitment policies,
which vary according to firm and job characteristics (Gregg and Wadsworth, 1996; Manning,
2000). Manning (2000) finds that approaches to existing staff and Job Centres are the most
frequently used recruitment methods, but his sample of employers in Britain is non-random
and his conclusions cannot be generalised to the behaviour of all British employers. Roper
4
(1988) conducts a detailed analysis of employer variation in recruitment strategy. The author
reports that all formal methods of recruitment are significantly slower in filling vacancies
than Job Centres, and that newspaper advertisements are slowest of all. Informal methods are
found to be fastest. The choice of recruitment method has the largest effect on the probability
of filling a job vacancy.
We find that replying to advertisements, using Job Centres and friends and contacts are the
most common methods of job search among unemployed men in the 1990s, while the average
unemployed male in Britain uses three search methods as part of their job search strategy. Our
estimates show that direct contact with employers is associated with a higher probability of
subsequent employment, all things equal, especially if used in combination with responding
to advertisements, Job Centres or friends and contacts. Conditional on finding work, replying
to advertisements results in higher paying employment. Job search intensity, as measured by
the number of search methods used, has a positive and significant association with both the
probability of employment at the subsequent date of interview and with the re-employment
wage, all things equal.
Data
Panel data are required to address the impact of job search methods and intensity on the
probability of finding a job. These enable us to observe the search methods and intensity of
the unemployed at time t and any subsequent change in employment status between times t
and t+1. They also allow us to use econometric techniques that control for different individual
and household circumstances. Our data source is waves 6, 7, 8 and 9 of the British Household
5
Panel Survey (BHPS) which provides detailed information on individual, household and job
related characteristics on an annual basis from 1996 to 1999.1 The first wave was designed as
a nationally representative random sample of the population of Great Britain living in private
(non-institutional) households in the Autumn of 1991, consisting of 5,500 households
covering approaching 10,000 individuals. These original respondents have been followed and
they and any adult co-residents are interviewed at annual intervals. Children in original
sample households are also interviewed when they reach the age of sixteen. The sample
therefore remains broadly representative of the British population as it changes through the
decade. Our sub-sample consists of men who are unemployed for at least one of the dates of
interview at wave 6, 7, 8, or 9 and who are under 65 years of age at that date of interview. We
do not investigate the job search strategies of women because of small sample sizes – less
than one hundred women considered themselves to be out of work and actively searching for
employment at each year. To prevent the possibility of counting one unemployment spell that
overlaps two or more consecutive dates of interview more than once, we restrict analysis to
one unemployment spell per individual – we only include information from the first date of
interview at which a respondent is unemployed. Our definition of unemployment is currently
not working, having looked for work in the past four weeks, and being available to start work
within the next two weeks. Respondents are not required to be interviewed at each wave to
remain in the sample, and nor are new entrants to the survey prevented from entering our
sample.
At each interview, respondents are asked detailed questions relating to their current
employment status and their household composition, individual demographics and income.
1 Respondents were not asked about their job search strategies prior to wave 6.
6
From this we observe whether individuals are in work, whether they are out of work and
looking for a job, or whether they are economically inactive. If in work, respondents are asked
for information on a range of job characteristics and for their usual labour market earnings
and working hours, allowing calculation of an hourly wage rate. To these data we have
matched the unemployment rate in each individual’s travel-to-work area at each date of
interview to provide information on local labour demand.2 The job search questions which are
of primary interest here are asked of all those in unemployment at the relevant date of
interview. In particular, respondents are asked:
“In the past four weeks what active steps have you taken to find work? Have you…….. Applied directly to an employer? Studied or replied to an advertisement? Used a Job Centre/employment agency? Asked friends or contacts? Taken steps to start your own business?”
Respondents are asked to list all which apply.3 Relating the answers to this question to
individual characteristics and demographics provides rich information on the determinants of
job search strategies while unemployed, while relating them to labour market status at the
subsequent date of interview provides details regarding the effectiveness of various search
methods. In addition, job search intensity can be estimated by adding the number of search
methods used by each unemployed individual. This allows investigation of the impact of
search intensity on employment outcomes.4
2 The local labour market information is taken from the National Online Manpower Information Service (NOMIS), and is matched into the BHPS by month of interview and travel-to-work area. 3 This question is not ideal, as there is no ‘other’ category. There are a small proportion of the unemployed who do not use any of the listed search methods, and we therefore construct a sixth category to allow for this. 4 Of course this is only an approximation for search intensity. It is quite possible for an individual who uses one search method to be searching more intensively for work than another individual using three or four methods.
7
These data on the job search strategy of the unemployed are collected for each unemployed
individual at each date of interview, rather than at regular periods throughout an
unemployment spell. Therefore rather than investigating the impact of search strategy on the
hazard rate from unemployment into employment, we focus on the employment status at the
subsequent date of interview of currently unemployed individuals. Our estimates can be
interpreted as the impact of job search strategy on the joint probability of receiving an
acceptable job offer between the dates of interview (approximately 12 months apart), and of
remaining in employment until the subsequent date of interview.5
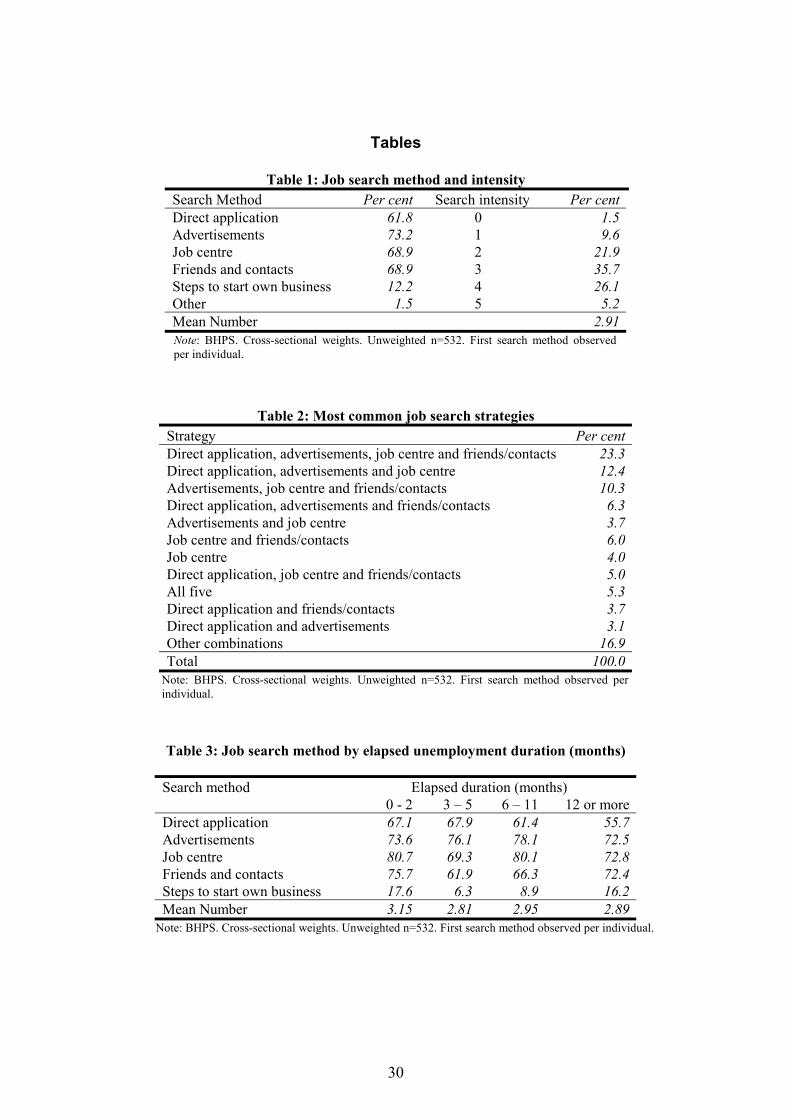
Table 1 provides information on the proportion of unemployed men who use each job search
method. This shows that on average, the most commonly used methods of job search over the
period under consideration are replying to advertisements, used by 73% of unemployed men,
and job centres and friends and contacts used by 69%. Direct application to employers is used
by 62% of unemployed men while only 12% take steps to start their own business. These
figures are consistent with previous findings for both Britain (Schmitt and Wadsworth, 1993;
Gregg and Wadsworth, 1996; Labour Market Trends, 1999) and France (Sabatier, 2000), and
contrast with the U.S. where 80% of the unemployed use direct applications and friends and
family contacts (Holzer, 1988), and Canada, where direct application is the most common
job search method (Osberg, 1993). Heath (1999) finds that using newspapers and the media
Unfortunately the data do not provide information on the number of hours spent searching or on the costs incurred. Jones (1989) reports that the average unemployed individual spends six hours per week looking for work. Jackman et al (1991) report that unemployed men in Britain make only one or two job applications per month on average. St. Louis et al (1986) argue that the most appropriate measure of job search effort is the number of actual job contacts made. Such information is not available in the BHPS.
8
are the most common search methods among unemployed young Australians, followed by the
public employment service and direct employer contact. This evidence suggests that job
search in Britain is more institutionalised than in other countries (see also Wadsworth, 1991).
Table 1 also summarises the number of search methods used, which we use as our measure of
job search intensity. On average 2% of unemployed men, although currently searching for
work, do not use any of the methods listed, while 10% use only one method. 22% of
unemployed men use two job search methods, while the mode is three, used by 36%. 26% use
four of the listed search methods while 5% use all five. The mean and median are 3 search
methods per unemployed man. This is consistent with the average of 3 for unemployed men
and women in Britain reported in Gregg and Wadsworth (1996), and of 3.3 for American
unemployed youth (Holzer, 1988), and is greater than the mean of 2 found for the
unemployed in Portugal (Addison and Portugal, 1998). Job search does not appear to be a
single, uniform activity for the unemployed seeking work.
Table 2 investigates these issues in more detail by listing the most common search strategies
within the sample. This shows that 23% of the unemployed use a combination of direct
application to employers, replying to advertisements, visiting a Job Centre and friends and
contacts. A further 34% use some combination of three out these four search methods. About
4% of the sample reply to advertisements and visit a Job Centre, while 6% use Job Centres
and friends and contacts. Visiting Job Centres is the most common single search strategy,
used by 4% of the sample.
5 Most previous studies of job search success use data on how workers found their current job. While this provides accurate information on the successful method of job search, such data may suffer from selection biases
9
Table 3 explores the relationship between the elapsed duration of the unemployment spell and
the choice of job search method and intensity. This reveals a negative relationship between
directly applying to potential employers and elapsed duration, with 67% of men unemployed
for under 6 months using this method compared with 56% of the long-term unemployed. Men
who take steps to start a business are most likely to do so either immediately on entry into
unemployment, or as a response to long-term unemployment. This table also reveals a
consistent decline in the number of search methods used with elapsed unemployment
duration. Men who have been unemployed for a short period (under 3 months) on average use
3.15 search methods, compared to an average of 2.89 among the long-term unemployed. This
reduction in search intensity could reflect either disincentive effects or men exhausting search
methods with the passage of time.
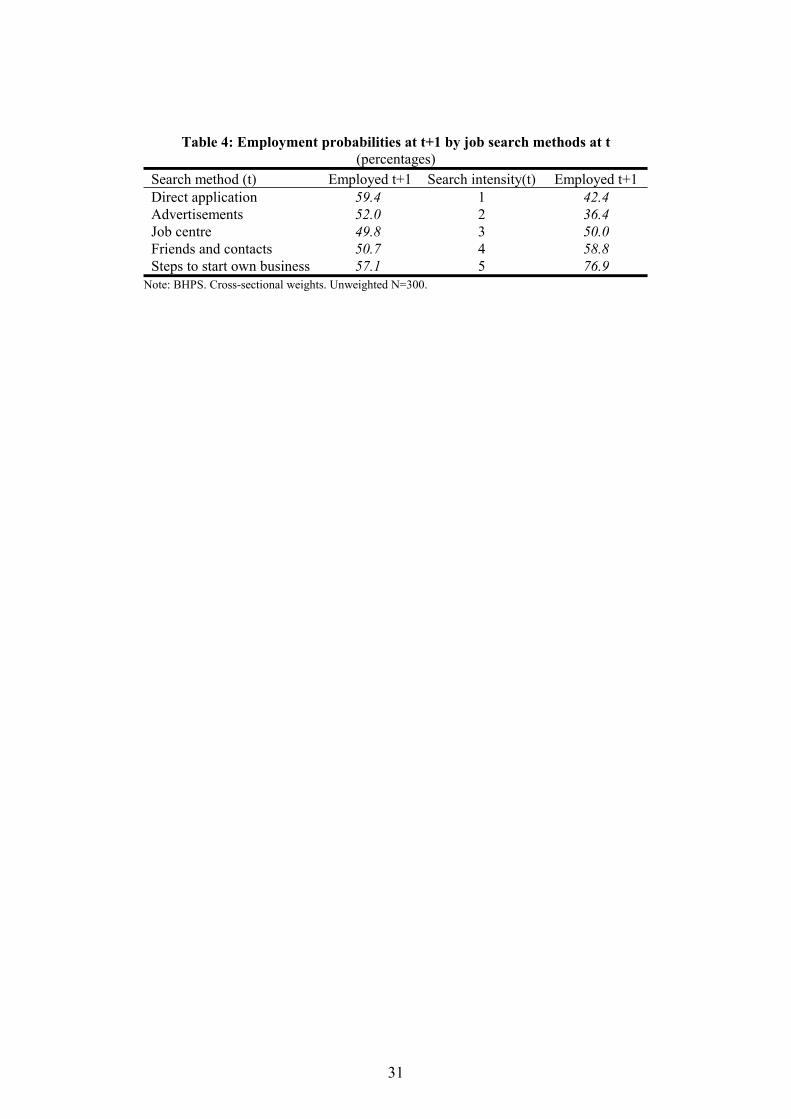
Table 4 examines the success of job search methods and intensity by focussing on the
employment status at the following date of interview of currently unemployed individuals. In
particular it provides the proportions using each job search method that are in employment at
the next date of interview.6 This shows that men who apply directly to firms are the most
likely to be employed (59% are in work at the subsequent wave), followed by men taking
steps to start their own business (57%), those that reply to advertisements (52%) and who use
friends and contacts (51%). The least successful search method in terms of employment at the
(see Korpi, 2001, for a summary). 6 This does not necessarily imply that individuals found employment as a direct result of using any particular job search method. We only have information on the methods used at the date of interview, and individuals may vary their strategy depending on their unemployment duration. Also, it is possible that an individual may have experienced other employment or even unemployment spells in between their unemployment spell at t and their job at t+1. This measure however provides an indicator of the probability of finding a job, and remaining in work, associated with each search method.
10
subsequent date of interview is using a Job Centre or employment agency. Labour Market
Trends (1999) reports that hearing from someone already working at an establishment and
replying to an advertisement are the two most common ways of finding a job. Gregg and
Wadsworth (1996) similarly find personal contacts, media and Job Centre use as the most
effective job search methods. These different results may be explained by different definitions
of success. Gregg and Wadsworth (1996) and Labour Market Trends (1999) examine the re-
employment probability, while we focus on the probability of employment at a point in the
future.
Table 4 also reveals a positive relationship between the number of search methods used by
the unemployed and the probability of being employed at the subsequent date of interview.
Only 40% of men using one or two job search methods are subsequently employed, compared
to 50% of those using three methods and 59% of men using four methods. Three quarters of
men using all five listed methods are in work at the following date of interview. These
findings are consistent with previous work (Holzer, 1988; Gregg and Wadsworth, 1996) and
imply that greater investment in search effort yields more information on existing job
vacancies and results in a higher probability of receiving an (acceptable) job offer (Sabatier,
2000).
11
Estimation Framework and model specification
The first step in our econometric analysis is to investigate the determinants of the choice of
job search strategy used by the unemployed. Search strategy is defined as the combination of
search method and search intensity used in looking for work. The (latent) probability that an
unemployed man (i) uses a particular job search method ( jM ) can be written:
ijjiij vZM += γ* [1]
where
1=ijM if 0>+ ijji vZ γ
0=ijM if 0≤+ ijji vZ γ
for i=1,..,n; j=1,..,5. iZ is a vector of demographic, household and local labour market
characteristics that determine an individual’s propensity to use a particular search method, jγ
is the associated vector of coefficients to be estimated and ijv is random error. This set of
(five) equations are estimated as probit models.7 These independent equations for each search
method used are complemented with an ordered probit model to investigate the determinants
of job search intensity. Job search intensity takes a value between 0 and 5, depending on the
number of search methods used, and is also modelled as a function of demographic,
household and local labour market characteristics. The (unobserved) propensity to use S
search methods is specified as:
iii uZS += β* [2]
where
0=iS if 1* µ≤iS
1=iS if 2*
1 µµ ≤< iS
7 Estimating a joint model is complicated by the fact that the search method categories are not mutually exclusive, and the wide variety of search strategies used (see Table 2).
12
2=iS if 3*
2 µµ ≤< iS
3=iS if 4*
3 µµ ≤< iS
4=iS if 5*
4 µµ ≤< iS
5=iS if *5 iS<µ
The results from these procedures provide important information on the determinants of job
search strategies used by unemployed men in the 1990s.
Our second aim in this paper is to examine the effectiveness of different job search strategies.
We do this in two ways, by investigating the impact of various search strategies on the
probability of re-employment at the subsequent date of interview and, conditional on re-
employment, the impact of search strategy on the re-employment wage. To estimate the re-
employment probability, we specify the following (latent) model:
ijijttiitti MMXR εααϖ ++++=+ .....11*
1, [3]
where *1, +tiR is the unobserved propensity for an unemployed man at t to be in employment at
t+1. This is observed as a binary variable where:
11, =+tiR if 0*1, >+tiR
01, =+tiR if 0*1, ≤+tiR
The probability of receiving and accepting a job offer depends on a set of exogenous
demographic, household and local labour market characteristics, itX , measured at the same
point in time as the choice of search method, and on the selected method of job search,
ijtti MM .....1 , 5,...,1=j . Estimating equation [3] as a binary choice model yields consistent
estimates of the parameters of interest if all explanatory variables are exogenous. However,
there is the question of self-selection in the use of job search methods to be addressed. If job
seekers do (or do not) use a particular search method because of a common but unobservable
characteristic, then the estimated coefficients will be biased. Job centre use, for example, may
13
be an indicator of the relative unavailability of other labour market contacts – individuals
with good contacts have no need to use job centres. To correct for this, we decompose the
random error term in [3] into two parts:
21 iii εεε +=
where
jijii MM δδε *1
*11 ..++=
identifies the unobservable component that is correlated with the decision to use a particular
job search method and which depends on the set of latent variables **1 ..... ijtti MM , 5,...,1=j .
2iε captures the random error component that is uncorrelated with the *M s. Although the
*M s are unobserved, we replace them with the estimated probabilities resulting from
equation [1].8
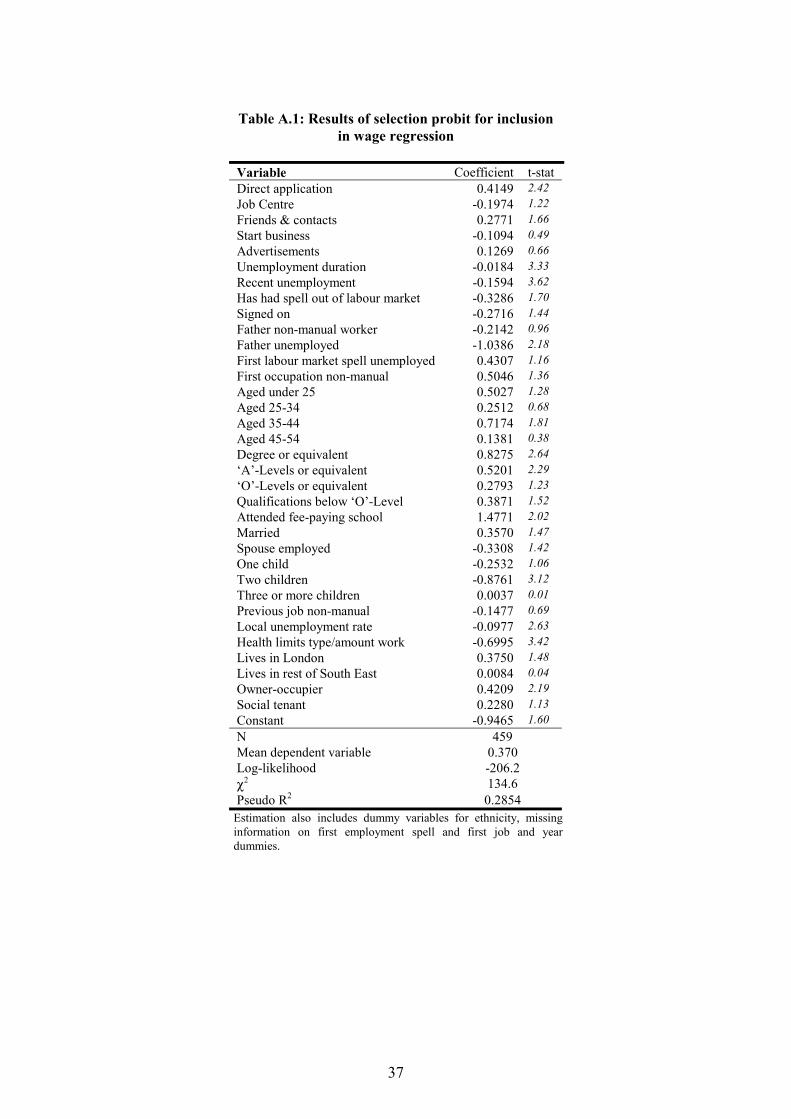
The impact of job search strategy on the re-employment wage is estimated using an OLS
wage equation. However, inclusion into this estimating sample is conditional on being in
employment at the subsequent date of interview. To control for any selection bias this may
introduce, we estimate a two-step model. The first step is to estimate a reduced form probit
equation where the dependent variable takes the value 1 if an unemployed man at t is in work
at t+1. The dependent variable takes the value 0 if the unemployed man at t is either not
interviewed at t+1 or is not in work at t+1. We calculate the inverse Mill’s ratio from this
selection equation and enter it as a correction term in the OLS wage equation (Heckman,
1979). Our estimated hourly wage equation therefore takes the following form:
8 A similar estimation procedure has been used by Osberg (1993) and Gregg and Wadsworth (1996).
14
iijijttiittiti kMkMhWaYY σρλ ++++++== +++ ...ln 1111,1, [4]
where 1, +tiY is the hourly wage received at the date of interview following the unemployment
spell, 1, +tiW is a set of demographic, household, local labour market and job related
characteristics that determine wages, tjiM ,, indicates the choice of job search method when
unemployed, iλ is the inverse Mill’s ratio, iσ is random error, and jkh, and ρ are (vectors
of) coefficients to be estimated.9 Father’s employment status and occupation and pre-sample
information on first labour market experiences are used as identifying variables – they are
used to explain selection into the estimating sample, but not wages conditional on
employment.10
Model specification
The vectors of explanatory variables we use in these analyses cover a range of individual,
household and local labour market characteristics. An individual’s age is likely to partly
determine their number of contacts in the labour market, their attitude towards risk, their
financial and familial responsibilities, and their level of savings. Labour market mobility is
also known to be higher for younger individuals, for whom spells of unemployment are less
likely to have a scarring effect (Arulampalam, Booth, and Taylor, 2000). Marital status,
spouses’ employment status, the number of children and level of education are all likely to
determine attachment to and opportunities in the labour market, job search efficiency, the
utility of leisure, the marginal value of income, job search constraints and the number of
9 Clearly these coefficients will be biased if higher wage-earning workers select different job search strategies than lower wage-earning workers. To correct for this, we have also estimated an instrumental variables specification, replacing the job search method used with the probability of using each method derived from equation [1]. The results from doing so differ little from those reported here and are therefore excluded for brevity. 10 The results of the selection probit are shown in Appendix Table A1 and are not discussed for brevity.
15
contacts in the labour market. More highly educated individuals may have access to a
geographically larger labour market and respond to advertisements placed in the national or
international media, while the less educated may search more locally through friends and
local labour market contacts. Montgomery (1991) suggests that there is a social structure
within which highly skilled, high productivity workers are more likely to associate with each
other rather than with lesser skilled, lower productivity workers. Demographic and family
variables are also likely to affect both search intensity and marginal productivity, and
therefore affect job offer arrival and retention rates. The number and age of children in the
family, for example, may restrict the employment opportunities of parents (Wanberg et al,
1999). Household income captures the level of financial hardship which in other studies has
been found to determine job search intensity (Wanberg et al, 1999). It may also determine the
probability of accepting a job offer. Signing on implies a requirement for more visible,
ascertainable job search activity which may induce a shift towards more demonstrable
methods.11 It may also be an indicator of financial hardship. We include these variables in the
models determining job search methods, intensity, and job search success.
A key parameter in the job search literature is the reservation wage, the wage at which an
individual is indifferent between accepting a job offer and rejecting it in favour of continued
search. The BHPS data allow calculation of the reservation wage for each individual
unemployed at the date of interview, defined in the survey as “the lowest weekly take home
pay you would consider accepting for a job”. This is likely to be an important determinant of
both choice of search method and intensity. By directly influencing the probability of
11 “Signing on” means registration with the unemployment agency for the receipt of unemployment related benefits.
16
receiving an acceptable job offer, the reservation wage also determines the likelihood of
employment at the subsequent date of interview.
We might expect an individual’s job search strategy to vary according to the length of the
unemployment spell, either because the unemployed change their strategies as different search
methods are exhausted, or because of disincentive effects. Search effort may decline if
unemployed workers contact their most favourable options at the start of the spell. Schmitt
and Wadsworth (1993) find unemployment duration to be one of the most important
determinants of job search method choice in Britain. There is also a consistent finding in the
literature of negative duration dependence (e.g. Nickell, 1979; Van den Berg and Van Ours,
1994; Böheim and Taylor, 2000), indicating that the probability of re-employment falls with
the elapsed duration of the unemployment spell due to either scarring effects or unobserved
heterogeneity. The current state of the labour market also affects the arrival rate of job offers,
and there may be cyclical dependence in job search strategies. The local level of labour
demand will constrain the job seeker, and men may change their job search behaviour in
response to different labour market conditions (Osberg, 1993). In depressed labour markets
for example, more of one’s normal contacts may be unemployed or working in establishments
laying off rather than recruiting workers. McGregor (1983) hypothesises that higher local
unemployment rates increase search through advertisements and employment agencies, while
job seekers in low unemployment areas are more likely to use friends and contacts. He argues
that information about jobs is more likely to originate from employed workers and therefore
less information on jobs will be available in high unemployment neighbourhoods. Elapsed
unemployment duration and the local unemployment rate are therefore included as
explanatory variables in all models. To capture the impact of previous unemployment
experience, we include a variable (“Number of unemployment spells”) measuring the number
17
of unemployment spells each respondent has experienced since 1/9/1990.12 Employers may
use an individual’s previous unemployment record as a signal of low productivity, or previous
unemployment may otherwise scar a worker (see, for example, Heckman and Borjas, 1980;
Arulampalam et al, 2000; Böheim and Taylor, 2002a). We also include region of residence to
capture any spatial dimension in job search strategy choice and success.
Other variables will influence only the choice of search strategy and intensity, and have no
direct impact on the probability of re-employment. Wanberg et al (1999) show that
commitment to the labour market has a direct impact on job search intensity. We capture this
through a variable indicating whether an individual has had a spell of economic inactivity in
the 12 months before being observed as unemployed. This may determine search intensity,
but is unlikely to independently influence job search success. On the other hand, having a
health condition that limits the type or amount of work possible is likely to affect the
probability of receiving an acceptable offer, but not the choice of job search strategy.
Similarly, the probability of unemployment has been linked to housing tenure, with the
relative residential immobility of social tenants and owner-occupiers hypothesised to increase
their propensity to experience unemployment and reduce their exit rate from it (Oswald,
1996, 1998; Böheim and Taylor, 2002b). However, housing tenure is unlikely to directly
influence the choice of job search strategy.
Our specification of the re-employment wage equation is empirically driven. We include a
range of individual characteristics and demographics and employer, workplace and job
12 We also include a variable capturing the number of times each individual has been interviewed to control for the fact that individuals have been interviewed a different number of times.
18
characteristics which have a significant impact on the re-employment wage. These include
age, education, occupation, marital status, spouse’s employment status, region of residence,
housing tenure, job tenure and job type (permanent, seasonal or temporary, fixed term
contract) and the sample selection correction term. We also include the wage received in the
most recent previous job.
Estimation Results
Search method used.
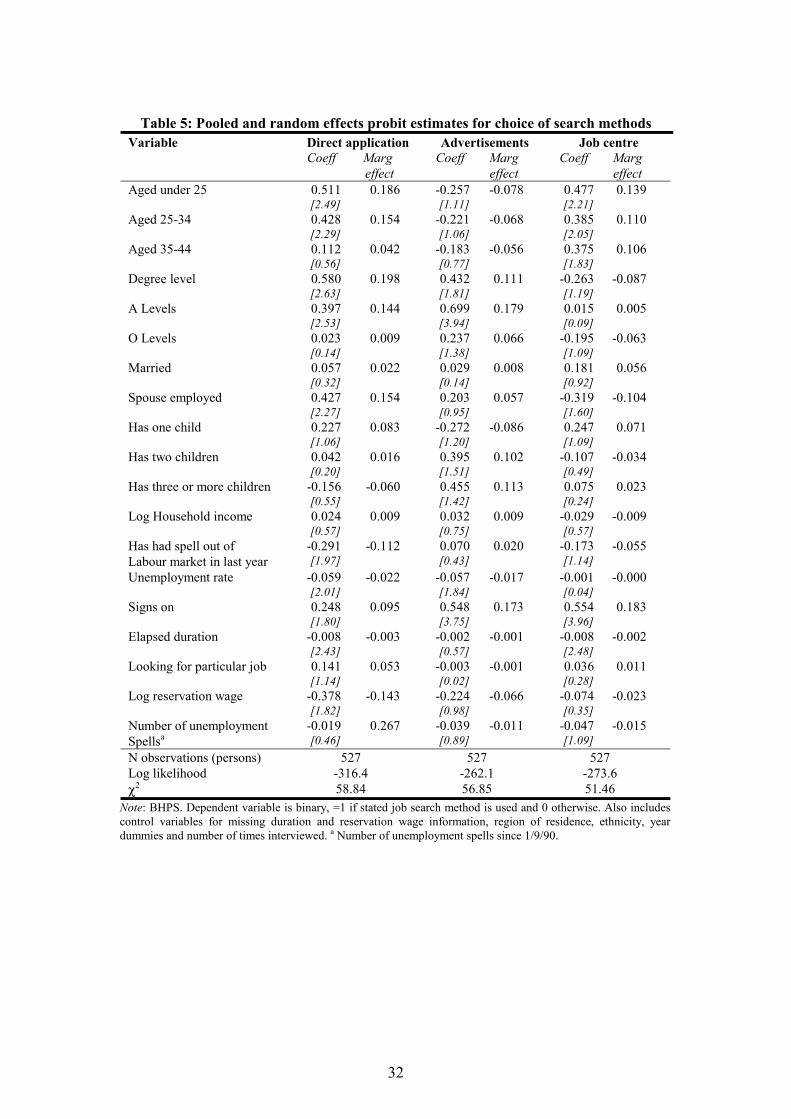
Table 5 presents the results from the probit models estimating the determinants of the choice
of search method. The first set of estimates show that unemployed men aged under 35, and
particularly those aged under 25, are more likely than those aged 45 and over to apply directly
to firms (by 15-20 percentage points).13 Schmitt and Wadsworth (1993) report similar results.
Men educated to degree or ‘A’-Level standard are more likely than those educated to below
‘O’-Level standard to use this method of job search, all things equal (by 14-19 percentage
points). Highly educated and skilled individuals may use a more pro-active approach to job
search, and offer their skills directly to potential employers rather than respond to available
opportunities (see also Heath, 1999; Sabatier, 2000). An inverse relationship emerges
between the probability of direct application and the elapsed duration of the unemployment
spell. This form of job search is less likely among men who have been unemployed for a
longer period indicating that either men use direct application early in the job search process,
or that individuals who use this search method find a job quickly (see also Schmitt and
Wadsworth, 1993). Signing on and having an employed spouse are both associated with a
significantly higher probability of applying directly to firms (by 10 and 15 percentage points).
19
A negative relationship emerges between applying directly to firms and an unemployed man’s
reservation wage – men with higher reservation wages are less likely to use this job search
approach, all else equal.
The second set of estimates show that unemployed men educated to ‘A’-Level or degree
standard have a higher probability of replying to advertisements than those holding
qualifications below ‘O’-Level standard (by 18 and 11 percentage points). Schmitt and
Wadsworth (1993) and Sabatier (2000) report similar findings for Britain and France. This
form of job search is also more likely to be used by individuals who are signing on (by 17
percentage points), perhaps reflecting institutional requirements of visible and demonstrable
job search activity for the receipt of unemployment benefits. The probability of replying to
advertisements declines with the local unemployment rate (see also Schmitt and Wadsworth,
1993), fewer jobs are advertised during a recession. This highlights the importance of local
labour market conditions in explaining job search behaviour.
Job Centre use is more prevalent among the young, all things equal (see also Osberg, 1993,
Schmitt and Wadsworth, 1993, Heath, 1999). Men aged under 25 are 14 percentage points
more likely than those aged 45 and over to report using Job Centres or other employment
agencies as part of their job search strategy, while 25-44 year olds are 11 percentage points
more likely. The probability of using a Job Centre or employment agency declines with the
elapsed duration of the unemployment spell (see also Schmitt and Wadsworth, 1993), and is
higher for men who sign on. The latter again reflects a visible commitment to finding work
and institutional requirements.
13 These marginal effects are evaluated at the variable sample means.
20
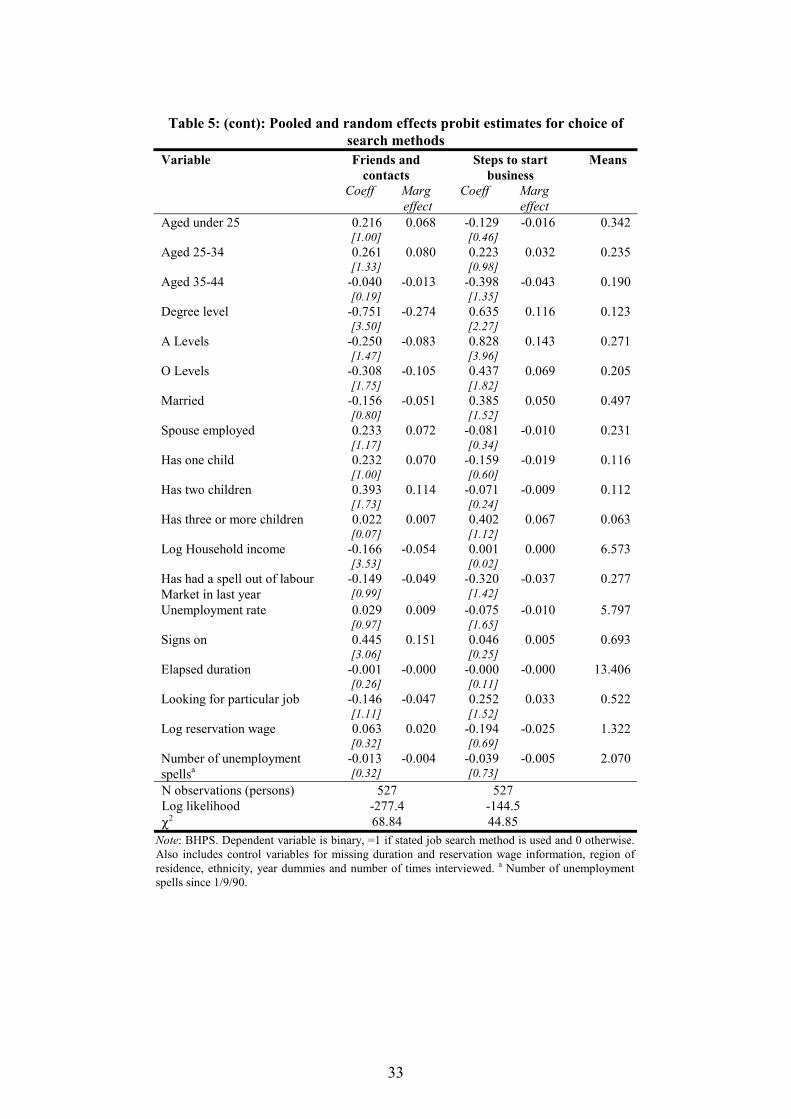
The highly educated are less likely to use informal networks as part of their job search
process. The coefficient on the degree level variable is particularly large and statistically
significant, reducing the probability of using friends and contacts by 27 percentage points
relative to an individual with no qualifications. This suggests that the less educated are more
likely to use local information networks and search for work in their immediate labour
market. The negative coefficient on household income is consistent with this argument. The
more skilled, educated and wealthy operate within a geographically larger labour market and
are less reliant on localised informal information networks in looking for work. Men who
sign on have a higher probability than those who do not of using friends and contacts when
searching for work.
Unemployed men educated to degree or ‘A’-Level standard have a higher probability than
those with no higher or further education qualifications of taking steps to start their own
business (by 12-14 percentage points). This could be caused by a greater ability to identify
potential business opportunities. An inverse relationship between taking steps to start a
business and the local unemployment rate emerges. Attempts at business start up are more
common when labour demand is high.
Search intensity
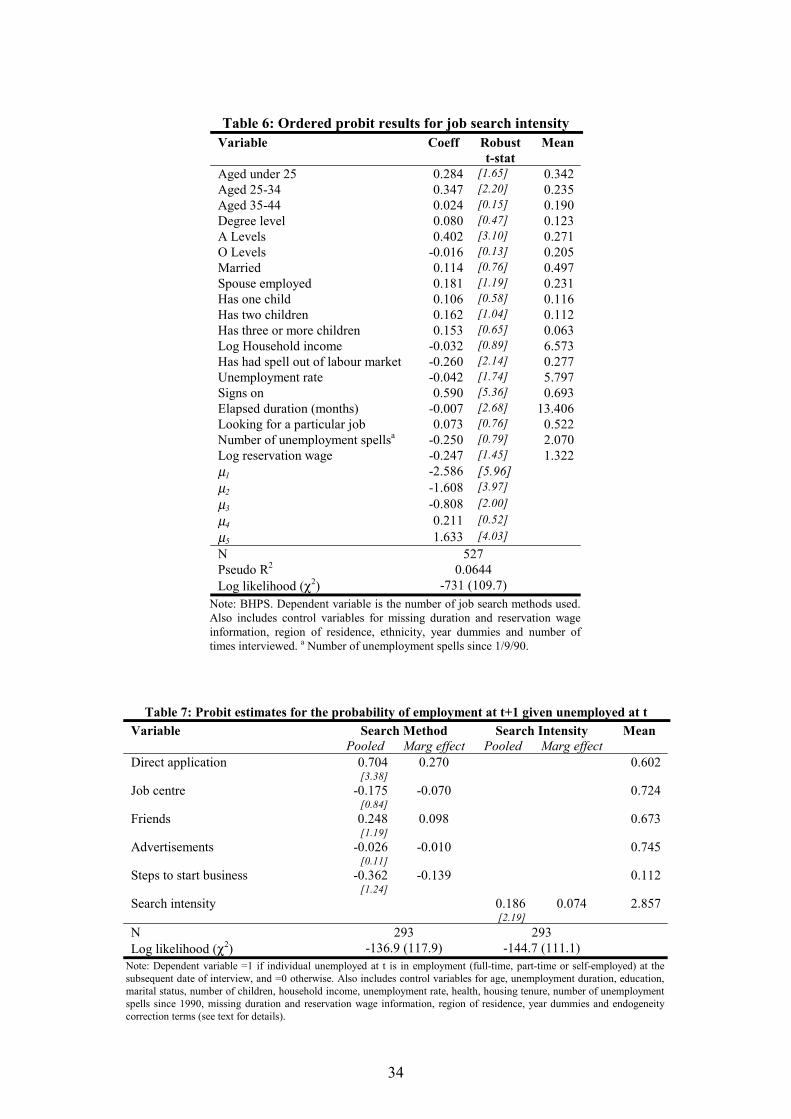
The results of the ordered probit estimates for job search intensity, measured by the number
of search methods used, are shown in Table 6.14 We might expect older workers’ expected
14 We have also estimated count data models to examine the determinants of search intensity. The results are similar to those presented here.
21
return from search to be lower given their shorter active labour market future and therefore
for a negative relationship between search intensity and age to emerge. The coefficients on
the age variables are consistent with this, although only that on the aged 25-34 variable is
statistically significant at conventional levels. Job search intensity appears to increase with
education, although only the coefficient on the ‘A’-Level variable is statistically significant.
This relationship is consistent with previous research (Blau and Robins, 1990; Schmitt and
Wadsworth, 1993; Wanberg et al, 1999; Sabatier, 2000). Unemployment deprives skilled
individuals of their (high) wages and may also depreciate their human capital. Therefore the
highly educated have a bigger incentive to exit unemployment rapidly and to adopt a greater
search effort than the less educated. Workers with different skill levels may also search in
different labour markets, which could partly determine their level of search effort. The
number of search methods used is negatively related to elapsed unemployment duration – the
longer the unemployment spell the less intensively the unemployed worker searches.15 This
could be a disincentive effect, where individuals who have been unemployed for a relatively
long time are discouraged from further search. Alternatively, the decrease in search intensity
over the duration of the unemployment spell may be caused by individuals who exhaust
search methods as their unemployment spell lengthens. Our evidence suggests that job search
intensity is also inversely related to the local unemployment rate – the higher the local
unemployment rate, the less intensely individuals search for work. Therefore individuals
increase their search effort as job competition falls and the probability of receiving a job offer
rises.16 Individuals who have had a recent spell of economic inactivity have lower levels of
search intensity, all things equal. Note that household income has no significant impact on job
15 Schmitt and Wadsworth (1993) report similar findings for unemployed men in Britain in the early 1980s. 16 Jones (1989) and Wadsworth (1991) report similar findings.
22
search intensity. This suggests that, all things equal, the level of financial well-being does not
influence the job search intensity of an unemployed worker. However, our results also suggest
that job search intensity is positively related to signing on, which may indicate financial
hardship and also reflect institutional factors.
Probability of re-employment
The results from the models estimating the probability of employment at t+1 given that an
individual is unemployed at t are presented in Table 7.17 Our estimates show that applying
directly to an employer increases the probability of employment at the subsequent date of
interview by 27 percentage points all else equal. This suggests that searching for a job
through making direct applications has a very large positive impact on an individual’s
medium term employment prospects.18 Gregg and Wadsworth (1996) also report a positive
(although smaller) effect of direct contact on the re-employment probability in Britain, as do
Osberg (1993), Addison and Portugal (1998) and Sabatier (2000) for Canada, Portugal and
France respectively. It can be argued that applying to potential employers is the final stage of
the job search process, and therefore its positive relationship with the probability of re-
employment is not surprising. However, our indicator of re-employment is measured
approximately 12 months later, and is therefore less sensitive to this potential bias than, for
example, duration models. We argue that applying directly to firms has a positive impact on
the medium term employment prospects of the currently unemployed.
17 Note that there is no omitted search category. This is because the categories are not mutually exclusive. 18 Interacting job search method with most recent occupation shows that this result holds for both manual and non-manual workers. However, the quantitative impact is about twice as large for non-manual workers, increasing the probability of subsequent employment by about 40 percentage points compared to 20 percentage points for manual workers. We have also tried interacting search method and intensity with age to investigate whether any differential re-employment effects emerge for younger workers. No significant differences were found.
23
Using friends and contacts also has a positive, although more modest and statistically
insignificant impact. Replying to advertisements, using a job centre/employment agency and
taking steps to start a business, however, reduce the probability of being employed at t+1,
although these effects are not statistically significant.19 The finding that Job Centre use is not
an effective job search method is consistent with previous research. For example, Wielgosz
and Carpenter (1987), using U.S. data, conclude that “almost all methods of job search are
associated with significantly shorter durations of search when compared to the state
employment service.” Osberg (1993) and Sabatier (2000) report a negative relationship
between public employment agency use and the probability of finding a job for Canada and
France respectively. However, Gregg and Wadsworth (1996), using British data, report that
the use of Job Centres is associated with a higher than average probability of re-entering
work. The differences between our results and those of Gregg and Wadsworth are not
inconsistent and can be explained by the different definitions of the dependent variables. The
dependent variable in the Gregg and Wadsworth study is the probability of re-employment
across a three month period while our dependent variable is the probability of being employed
approximately one year in the future. Combining these results suggests that although Job
Centres may increase the short run probability of re-employment, individuals are no more
likely to find themselves in employment in the medium term. This implies that either the jobs
people find through Job Centres are of low quality with relatively high rates of destruction, or
19 These findings are robust to including the job search method dummy variables in independent equations. It is possible that these results reflect the time spent in each job search method. Holzer (1988) for example finds that young unemployed American men spend more hours searching through friends and relatives and direct employer contact than through state employment agencies or newspapers. We have no information on this.
24
that Job Centres are poor at matching unemployed workers with suitable jobs. This is a
potential avenue for future research.
The second specification suggests that job search intensity, as measured by the number of
search methods used, has a positive and statistically significant impact on the probability of
employment at the subsequent date of interview, holding other characteristics constant. At the
sample means, using one additional job search method (i.e. using 4 methods rather than 3)
increases the probability of subsequent employment by 7 percentage points. This is consistent
with previous studies (Holzer, 1988; Gregg and Wadsworth, 1996; Sabatier, 2000).20
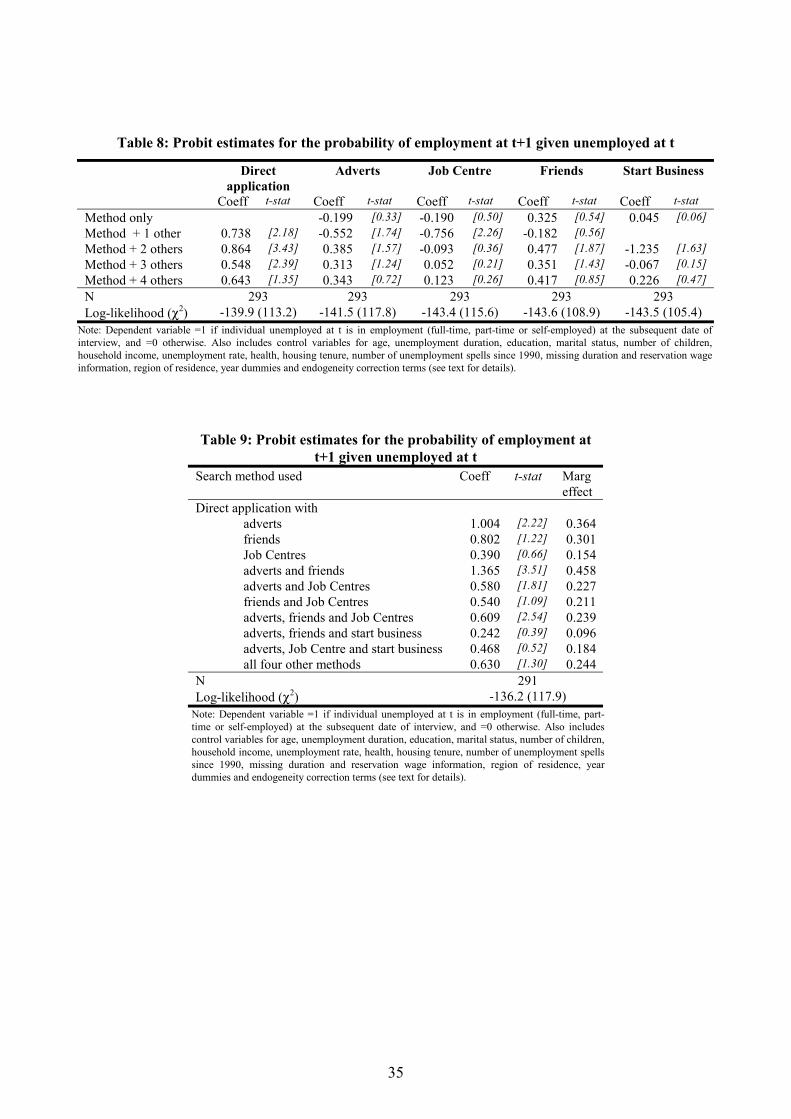
Table 8 and Table 9 investigate the impact of various job search strategies on the probability
of employment at the subsequent date of interview. Table 8 focuses on the impact of using
each search method, either alone or in combination with others, relative to not using that
method. The estimates suggest that combining direct application with one or more other
search methods significantly increases the probability of subsequent employment relative to
not using direct application. The use of other search strategies has little statistically
significant impact on the probability of employment 12 months later. Table 9 examines the
impact of search strategies involving direct application to employers in more detail. This
shows that applying directly to potential employers has the largest quantitative impact on the
subsequent employment when used together with replying to advertisements and friends and
contacts, increasing the probability of employment by 46 percentage points, and with just
20 A comparison of the log-likelihoods of the two specifications suggests, however, that the search method used is more informative than an aggregation. The LR test statistic is calculated as 15.6 with χ2(4)=9.5.
25
replying to advertisements (increasing the probability of subsequent employment by 36
percentage points).
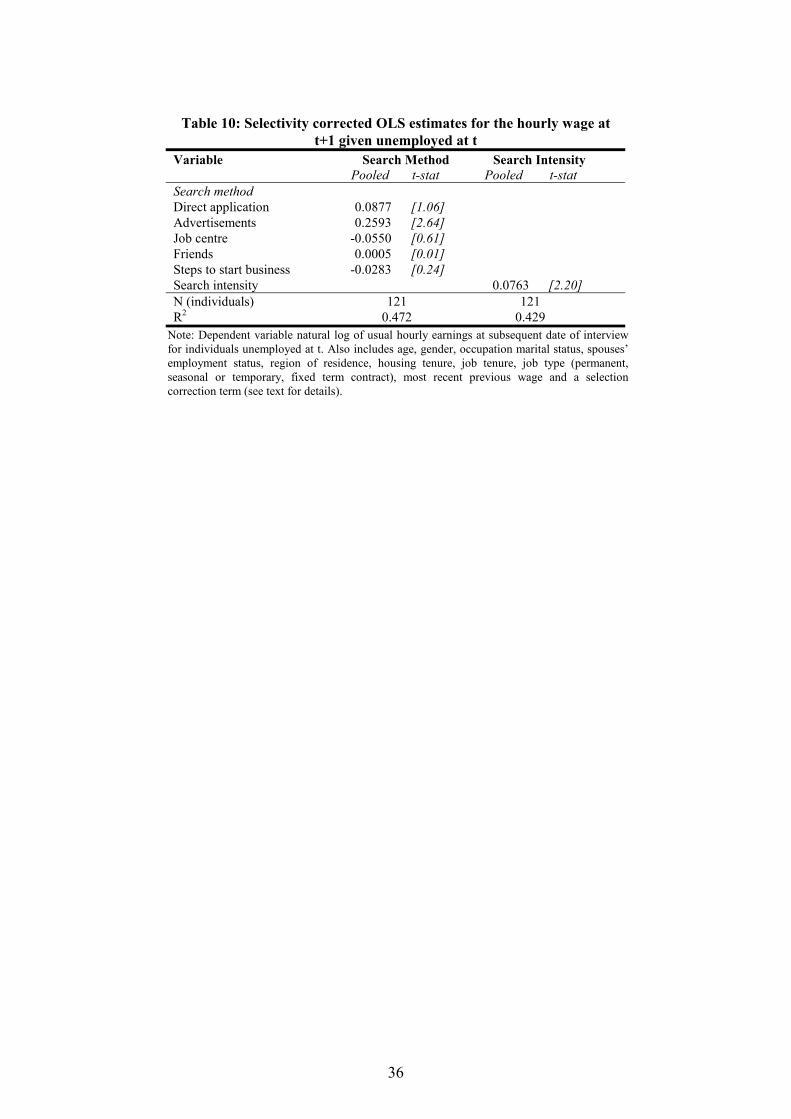
Re-employment wage
Finally we examine whether the job search strategy used by unemployed workers determines
the quality of subsequent employment measured by the hourly wage. Table 10 presents the
selectivity corrected OLS estimates of the natural log of the usual hourly wage at the
subsequent date of interview, with search method and intensity when unemployed as
explanatory variables. The results show that using a Job Centre or other employment agency,
direct application to employers, friends or labour market contacts or steps to start a business
as part of a job search strategy have small and statistically insignificant impacts on the wage
received at the subsequent date of interview, all things equal. The coefficients on these
variables are poorly determined. However, replying to advertisements has a relatively large,
positive and well determined effect on the hourly wage subsequently received. The coefficient
suggests that replying to advertisements while unemployed results in subsequently receiving
approximately 26% higher earnings. Therefore using market methods to seek work are more
successful in the sense of gaining relatively highly paid employment. The wage received at
the subsequent date of interview also increases with the number of search methods used when
unemployed. Therefore job search intensity not only increases the probability of subsequent
employment, it also increases the subsequent wage, perhaps because search intensity
increases the (unobserved) offer arrival rate, providing individuals with a wider draw from
the wage offer distribution.
26
Conclusions
The job search strategies used by unemployed individuals and their contribution to the job
matching process is crucial to understanding individuals’ labour market behaviour. We
contribute to this level of understanding by examining the determinants of job search
strategies, and the impact these strategies have on subsequent employment and wages. This is
important as different job search strategies will typically attract different types of employment
and draw offers from different pools of potential employers with different distributions of
potential wages. Furthermore, there is little work in the British literature that explicitly
incorporates job search method and intensity in the analysis of labour market behaviour.
We find that replying to advertisements and using Job Centres or employment agencies are
the two most common methods of job search, while the average unemployed man in Britain
uses three search methods as part of their job search strategy. The most common strategy
involves a combination of direct application, replying to advertisements, visiting a Job Centre
and friends and contacts, used by 23% of unemployed men. Age, education and family
circumstances emerge as key determinants of which job search strategy individuals use.
Our estimates show that applying directly to potential employers significantly increases the
probability of being employed at the subsequent date of interview, particularly when used in
combination with replying to advertisements and friends and contacts. Therefore the most
common methods of job search used by unemployed men do not correspond to the most
successful in terms of the probability of subsequent employment. This suggests that policies
aimed at returning the unemployed to work should focus on improving specific job search
skills. Replying to advertisements results in higher paying employment, all things equal. Job
27
search intensity, as measured by the number of search methods used, is positively related to
both the probability of employment at the subsequent date of interview and, conditional on
working, a higher wage. Nevertheless, it appears that the choice of search method is more
important than search intensity.
Local labour demand is an important influence on the choice of job search strategy. In
particular, unemployed individuals living in areas of low labour demand search less
intensively than those in areas of high labour demand. It is therefore important to improve job
search effectiveness of the unemployed in areas of high unemployment if the problem of
persistent joblessness is not to deteriorate further, and if unemployment is not to become
more spatially concentrated. Our analysis reveals significant differences in job search
strategies between individuals, and furthermore that the choice of job search strategy
influences the probability of re-entering employment. We however focus only on the
individual job seeker. Further research is required to aid understanding of the job search and
matching process, incorporating demand side factors such as how recruitment strategies vary
across vacancy type.
28
References Addison, J.T. and P. Portugal (1998), “Job search methods and outcomes”, ZEW Discussion
Paper 98-41, Mannheim: ZEW. Arulampalam, W. (2001), “Is unemployment really scarring? Effects of unemployment
experiences on wages”, Economic Journal, 111 (475), pp.F585-F606. Arulampalam, W., A.L. Booth and M.P. Taylor (2000), “Unemployment persistence”,
Oxford Economic Papers, 52, pp. 24-50. Blau, D.M. and P.K. Robins (1990), “Job search outcomes for the employed and
unemployed”, Journal of Political Economy, 98, pp. 637-655. Böheim, R. and M.P. Taylor (2000), “Unemployment duration and exit states in Britain”,
ISER working paper number 2000-1, Colchester: University of Essex. Böheim, R. and M.P. Taylor (2002a), “The Search for Success: do the unemployed find stable
employment?”, Labour Economics (forthcoming). Böheim, R. and M.P. Taylor (2002b), “Tied down or room to move? Investigating the
relationships between housing tenure, employment status and residential mobility in Britain”, Scottish Journal of Political Economy (forthcoming).
Granovetter, M. (1974), Getting a job: A study of contacts and careers, London: Havard University Press.
Gregg, P. (2001), “The impact of youth unemployment on adult unemployment in the NCDS”, Economic Journal, 111 (475), pp.F626-F653.
Gregg, P. and J. Wadsworth (1996), “How effective are state employment agencies? Jobcentre use and job matching in Britain”, Oxford Bulletin of Economics and Statistics, 58(3), pp. 443—467.
Gregory, M. and R. Jukes (2001), “Unemployment and subsequent earnings: Estimating scarring among British men 1984-94”, Economic Journal, 111 (475), pp.F607-F625.
Hannan, C. (1999), “Beyond networks: ‘social cohesion’ and unemployment exit rates”, Institute of Labour Research Working Paper 99/28, Colchester: University of Essex.
Heath, A. (1999), “Job-search methods, neighbourhood effects and the youth labour market”, Research Discussion Paper 1999-07, Reserve Bank of Australia.
Heckamn, J.J. (1979), “Sample selection bias as a specification error”, Econometrica, Vol. 47, pp. 475-492.
Heckman, J.J. and G. Borjas (1980) "Does unemployment cause future unemployment? Definitions, questions and answers from a continuous time model for heterogeneity and state dependence", Economica, 47, pp.247-283.
Holzer, H.J. (1988), “Search method use by unemployed youth”, Journal of Labor Economics, Vol. 6 (1), pp. 1-20.
Jackman, R., R. Layard and S. Nickell (1991), “Job search: The duration of unemployment”, Chapter 5 in Unemployment, macroeconomic performance and the labour market, Oxford: OUP.
Jones, S. (1989), “Job search methods, intensity and effects”, Oxford Bulletin of Economics and Statistics, Vol. 51, pp. 277-296.
Korpi, T. (2001), “Good friends in bad times? Social networks and job search among the unemployed in Sweden”, Acta Sociologica, 44, pp.157-170.
Labour Market Trends (1999), “Methods of job search”, January, pp. 17—18. Manning, A. (2000), “Pretty vacant: Recruitment in low-wage labour markets”, Oxford
Bulletin of Economics and Statistics, Vol. 62, Special Issue, pp. 747-770.
29
McGregor, A. (1983), “Neighbourhood influence on job search and job finding methods”, British Journal of Industrial Relations, 21 (1), pp.91-99.
Montgomery, J. (1991), “Social networks and labour market outcomes: Towards an economic analysis”, American Economic Review, 81 (5), pp.1408-1418.
Narendranathan, W. and S. Nickell (1985), “Modelling the process of job search”, Journal of Econometrics, Vol. 28, pp. 29-49.
Nickell, S. (1979), “The effect of unemployment and related benefits on the duration of unemployment”, Economic Journal, Vol. 89, pp. 34-49.
Osberg, L. (1993), “Fishing in different pools: job-search strategies and job-finding success in Canada in the early 1980s”, Journal of Labour Economics, 11(2), pp. 348—386.
Oswald, A.J. (1996), “A conjecture on the explanation for high unemployment in the industrialised nations: Part 1”, University of Warwick Economic Research Papers, no. 475.
Oswald, A.J. (1998), “The missing piece of the unemployment puzzle”, Paper presented at CEPR, ESRC Workshop on Unemployment Dynamics, London, 4th November, 1998.
Pissarides, C. (1979), “Job matchings with state employment agencies and random search”, Economic Journal, 89, 818—833.
Rees, A. (1966), “Information networks in labor markets”, American Economic Review, Vol 56, pp. 559-566.
Roper, S. (1988), “Recruitment methods and vacancy duration”, Scottish Journal of Political Economy, Vol. 35 (1), pp. 51-64.
Sabatier, M. (2000), “Job search model with endogenous search methods: An application on young unemployment spells in France”, Paper presented at the 15th Annual congress of the European Economic Association, Bozen-Bolzano, 30th August – 2nd September 2000.
Schmitt, J. and Wadsworth, J. (1993), “Unemployment benefit levels and search activity”, Oxford Bulletin of Economics and Statistics, Vol. , pp. 1-20.
St. Louis, R., P. Burgess and J. Kingston (1986), “Reported vs actual job search by unemployment insurance claimants”, Journal of Human Resources, Vol. 18, pp. 92-117.
Van den Berg, G. and J.C. van Ours (1994), “Unemployment dynamics and duration dependence in France, the Netherlands and the United Kingdom”, Economic Journal, Vol 104, pp. 432-443.
Wadsworth, J. (1991), “Unemployment benefits and search effort in the UK labour market”, Economica, Vol. 58, pp. 17-34.
Wanberg, C.R., R. Kanfer and M. Rotundo (1999), “Unemployed individuals: Motives, job search competencies, and job search constraints as predictors of job seeking and reemployment”, Journal of Applied Psychology, 84 (6), pp.987-910.
Wielgosz, J.B. and S. Carpenter (1987), “The effectiveness of alternative methods of searching for jobs and finding them”, American Journal of Economics and Sociology, Vol. 46 (2), pp. 151-164.
30
Tables
Table 1: Job search method and intensity Search Method Per cent Search intensity Per cent Direct application 61.8 0 1.5 Advertisements 73.2 1 9.6 Job centre 68.9 2 21.9 Friends and contacts 68.9 3 35.7 Steps to start own business 12.2 4 26.1 Other 1.5 5 5.2 Mean Number 2.91 Note: BHPS. Cross-sectional weights. Unweighted n=532. First search method observed per individual.
Table 2: Most common job search strategies Strategy Per cent Direct application, advertisements, job centre and friends/contacts 23.3 Direct application, advertisements and job centre 12.4 Advertisements, job centre and friends/contacts 10.3 Direct application, advertisements and friends/contacts 6.3 Advertisements and job centre 3.7 Job centre and friends/contacts 6.0 Job centre 4.0 Direct application, job centre and friends/contacts 5.0 All five 5.3 Direct application and friends/contacts 3.7 Direct application and advertisements 3.1 Other combinations 16.9 Total 100.0
Note: BHPS. Cross-sectional weights. Unweighted n=532. First search method observed per individual.
Table 3: Job search method by elapsed unemployment duration (months)
Search method Elapsed duration (months) 0 - 2 3 – 5 6 – 11 12 or more Direct application 67.1 67.9 61.4 55.7 Advertisements 73.6 76.1 78.1 72.5 Job centre 80.7 69.3 80.1 72.8 Friends and contacts 75.7 61.9 66.3 72.4 Steps to start own business 17.6 6.3 8.9 16.2 Mean Number 3.15 2.81 2.95 2.89
Note: BHPS. Cross-sectional weights. Unweighted n=532. First search method observed per individual.
31
Table 4: Employment probabilities at t+1 by job search methods at t (percentages)
Search method (t) Employed t+1 Search intensity(t) Employed t+1 Direct application 59.4 1 42.4 Advertisements 52.0 2 36.4 Job centre 49.8 3 50.0 Friends and contacts 50.7 4 58.8 Steps to start own business 57.1 5 76.9
Note: BHPS. Cross-sectional weights. Unweighted N=300.
32
Table 5: Pooled and random effects probit estimates for choice of search methods
Variable Direct application Advertisements Job centre
Coeff Marg effect
Coeff Marg effect
Coeff Marg effect
Aged under 25 0.511 0.186 -0.257 -0.078 0.477 0.139 [2.49] [1.11] [2.21] Aged 25-34 0.428 0.154 -0.221 -0.068 0.385 0.110 [2.29] [1.06] [2.05] Aged 35-44 0.112 0.042 -0.183 -0.056 0.375 0.106 [0.56] [0.77] [1.83] Degree level 0.580 0.198 0.432 0.111 -0.263 -0.087 [2.63] [1.81] [1.19] A Levels 0.397 0.144 0.699 0.179 0.015 0.005 [2.53] [3.94] [0.09] O Levels 0.023 0.009 0.237 0.066 -0.195 -0.063 [0.14] [1.38] [1.09] Married 0.057 0.022 0.029 0.008 0.181 0.056 [0.32] [0.14] [0.92] Spouse employed 0.427 0.154 0.203 0.057 -0.319 -0.104 [2.27] [0.95] [1.60] Has one child 0.227 0.083 -0.272 -0.086 0.247 0.071 [1.06] [1.20] [1.09] Has two children 0.042 0.016 0.395 0.102 -0.107 -0.034 [0.20] [1.51] [0.49] Has three or more children -0.156 -0.060 0.455 0.113 0.075 0.023 [0.55] [1.42] [0.24] Log Household income 0.024 0.009 0.032 0.009 -0.029 -0.009 [0.57] [0.75] [0.57] Has had spell out of -0.291 -0.112 0.070 0.020 -0.173 -0.055 Labour market in last year [1.97] [0.43] [1.14] Unemployment rate -0.059 -0.022 -0.057 -0.017 -0.001 -0.000 [2.01] [1.84] [0.04] Signs on 0.248 0.095 0.548 0.173 0.554 0.183 [1.80] [3.75] [3.96] Elapsed duration -0.008 -0.003 -0.002 -0.001 -0.008 -0.002 [2.43] [0.57] [2.48] Looking for particular job 0.141 0.053 -0.003 -0.001 0.036 0.011 [1.14] [0.02] [0.28] Log reservation wage -0.378 -0.143 -0.224 -0.066 -0.074 -0.023 [1.82] [0.98] [0.35] Number of unemployment -0.019 0.267 -0.039 -0.011 -0.047 -0.015 Spellsa [0.46] [0.89] [1.09] N observations (persons) 527 527 527 Log likelihood -316.4 -262.1 -273.6 χ2 58.84 56.85 51.46
Note: BHPS. Dependent variable is binary, =1 if stated job search method is used and 0 otherwise. Also includes control variables for missing duration and reservation wage information, region of residence, ethnicity, year dummies and number of times interviewed. a Number of unemployment spells since 1/9/90.
33
Table 5: (cont): Pooled and random effects probit estimates for choice of
search methods Variable Friends and
contacts Steps to start
business Means
Coeff Marg effect
Coeff Marg effect
Aged under 25 0.216 0.068 -0.129 -0.016 0.342 [1.00] [0.46] Aged 25-34 0.261 0.080 0.223 0.032 0.235 [1.33] [0.98] Aged 35-44 -0.040 -0.013 -0.398 -0.043 0.190 [0.19] [1.35] Degree level -0.751 -0.274 0.635 0.116 0.123 [3.50] [2.27] A Levels -0.250 -0.083 0.828 0.143 0.271 [1.47] [3.96] O Levels -0.308 -0.105 0.437 0.069 0.205 [1.75] [1.82] Married -0.156 -0.051 0.385 0.050 0.497 [0.80] [1.52] Spouse employed 0.233 0.072 -0.081 -0.010 0.231 [1.17] [0.34] Has one child 0.232 0.070 -0.159 -0.019 0.116 [1.00] [0.60] Has two children 0.393 0.114 -0.071 -0.009 0.112 [1.73] [0.24] Has three or more children 0.022 0.007 0.402 0.067 0.063 [0.07] [1.12] Log Household income -0.166 -0.054 0.001 0.000 6.573 [3.53] [0.02] Has had a spell out of labour -0.149 -0.049 -0.320 -0.037 0.277 Market in last year [0.99] [1.42] Unemployment rate 0.029 0.009 -0.075 -0.010 5.797 [0.97] [1.65] Signs on 0.445 0.151 0.046 0.005 0.693 [3.06] [0.25] Elapsed duration -0.001 -0.000 -0.000 -0.000 13.406 [0.26] [0.11] Looking for particular job -0.146 -0.047 0.252 0.033 0.522 [1.11] [1.52] Log reservation wage 0.063 0.020 -0.194 -0.025 1.322 [0.32] [0.69] Number of unemployment -0.013 -0.004 -0.039 -0.005 2.070 spellsa [0.32] [0.73] N observations (persons) 527 527 Log likelihood -277.4 -144.5 χ2 68.84 44.85
Note: BHPS. Dependent variable is binary, =1 if stated job search method is used and 0 otherwise. Also includes control variables for missing duration and reservation wage information, region of residence, ethnicity, year dummies and number of times interviewed. a Number of unemployment spells since 1/9/90.
34
Table 6: Ordered probit results for job search intensity
Variable Coeff Robust t-stat
Mean
Aged under 25 0.284 [1.65] 0.342 Aged 25-34 0.347 [2.20] 0.235 Aged 35-44 0.024 [0.15] 0.190 Degree level 0.080 [0.47] 0.123 A Levels 0.402 [3.10] 0.271 O Levels -0.016 [0.13] 0.205 Married 0.114 [0.76] 0.497 Spouse employed 0.181 [1.19] 0.231 Has one child 0.106 [0.58] 0.116 Has two children 0.162 [1.04] 0.112 Has three or more children 0.153 [0.65] 0.063 Log Household income -0.032 [0.89] 6.573 Has had spell out of labour market -0.260 [2.14] 0.277 Unemployment rate -0.042 [1.74] 5.797 Signs on 0.590 [5.36] 0.693 Elapsed duration (months) -0.007 [2.68] 13.406 Looking for a particular job 0.073 [0.76] 0.522 Number of unemployment spellsa -0.250 [0.79] 2.070 Log reservation wage -0.247 [1.45] 1.322 µ1 -2.586 [5.96] µ2 -1.608 [3.97] µ3 -0.808 [2.00] µ4 0.211 [0.52] µ5 1.633 [4.03] N 527 Pseudo R2 0.0644 Log likelihood (χ2) -731 (109.7)
Note: BHPS. Dependent variable is the number of job search methods used. Also includes control variables for missing duration and reservation wage information, region of residence, ethnicity, year dummies and number of times interviewed. a Number of unemployment spells since 1/9/90.
Table 7: Probit estimates for the probability of employment at t+1 given unemployed at t Variable Search Method Search Intensity Mean Pooled Marg effect Pooled Marg effect Direct application 0.704 0.270 0.602 [3.38] Job centre -0.175 -0.070 0.724 [0.84] Friends 0.248 0.098 0.673 [1.19] Advertisements -0.026 -0.010 0.745 [0.11] Steps to start business -0.362 -0.139 0.112 [1.24] Search intensity 0.186 0.074 2.857 [2.19] N 293 293 Log likelihood (χ2) -136.9 (117.9) -144.7 (111.1)
Note: Dependent variable =1 if individual unemployed at t is in employment (full-time, part-time or self-employed) at the subsequent date of interview, and =0 otherwise. Also includes control variables for age, unemployment duration, education, marital status, number of children, household income, unemployment rate, health, housing tenure, number of unemployment spells since 1990, missing duration and reservation wage information, region of residence, year dummies and endogeneity correction terms (see text for details).
35
Table 8: Probit estimates for the probability of employment at t+1 given unemployed at t
Direct application
Adverts Job Centre Friends Start Business
Coeff t-stat Coeff t-stat Coeff t-stat Coeff t-stat Coeff t-stat Method only -0.199 [0.33] -0.190 [0.50] 0.325 [0.54] 0.045 [0.06] Method + 1 other 0.738 [2.18] -0.552 [1.74] -0.756 [2.26] -0.182 [0.56] Method + 2 others 0.864 [3.43] 0.385 [1.57] -0.093 [0.36] 0.477 [1.87] -1.235 [1.63] Method + 3 others 0.548 [2.39] 0.313 [1.24] 0.052 [0.21] 0.351 [1.43] -0.067 [0.15] Method + 4 others 0.643 [1.35] 0.343 [0.72] 0.123 [0.26] 0.417 [0.85] 0.226 [0.47] N 293 293 293 293 293 Log-likelihood (χ2) -139.9 (113.2) -141.5 (117.8) -143.4 (115.6) -143.6 (108.9) -143.5 (105.4)
Note: Dependent variable =1 if individual unemployed at t is in employment (full-time, part-time or self-employed) at the subsequent date of interview, and =0 otherwise. Also includes control variables for age, unemployment duration, education, marital status, number of children, household income, unemployment rate, health, housing tenure, number of unemployment spells since 1990, missing duration and reservation wage information, region of residence, year dummies and endogeneity correction terms (see text for details).
Table 9: Probit estimates for the probability of employment at t+1 given unemployed at t
Search method used Coeff t-stat Marg effect
Direct application with adverts 1.004 [2.22] 0.364 friends 0.802 [1.22] 0.301 Job Centres 0.390 [0.66] 0.154 adverts and friends 1.365 [3.51] 0.458 adverts and Job Centres 0.580 [1.81] 0.227 friends and Job Centres 0.540 [1.09] 0.211 adverts, friends and Job Centres 0.609 [2.54] 0.239 adverts, friends and start business 0.242 [0.39] 0.096 adverts, Job Centre and start business 0.468 [0.52] 0.184 all four other methods 0.630 [1.30] 0.244
N 291 Log-likelihood (χ2) -136.2 (117.9)
Note: Dependent variable =1 if individual unemployed at t is in employment (full-time, part-time or self-employed) at the subsequent date of interview, and =0 otherwise. Also includes control variables for age, unemployment duration, education, marital status, number of children, household income, unemployment rate, health, housing tenure, number of unemployment spells since 1990, missing duration and reservation wage information, region of residence, year dummies and endogeneity correction terms (see text for details).
36
Table 10: Selectivity corrected OLS estimates for the hourly wage at
t+1 given unemployed at t Variable Search Method Search Intensity Pooled t-stat Pooled t-stat Search method Direct application 0.0877 [1.06] Advertisements 0.2593 [2.64] Job centre -0.0550 [0.61] Friends 0.0005 [0.01] Steps to start business -0.0283 [0.24] Search intensity 0.0763 [2.20] N (individuals) 121 121 R2 0.472 0.429
Note: Dependent variable natural log of usual hourly earnings at subsequent date of interview for individuals unemployed at t. Also includes age, gender, occupation marital status, spouses’ employment status, region of residence, housing tenure, job tenure, job type (permanent, seasonal or temporary, fixed term contract), most recent previous wage and a selection correction term (see text for details).
37
Table A.1: Results of selection probit for inclusion
in wage regression
Variable Coefficient t-stat Direct application 0.4149 2.42 Job Centre -0.1974 1.22 Friends & contacts 0.2771 1.66 Start business -0.1094 0.49 Advertisements 0.1269 0.66 Unemployment duration -0.0184 3.33 Recent unemployment -0.1594 3.62 Has had spell out of labour market -0.3286 1.70 Signed on -0.2716 1.44 Father non-manual worker -0.2142 0.96 Father unemployed -1.0386 2.18 First labour market spell unemployed 0.4307 1.16 First occupation non-manual 0.5046 1.36 Aged under 25 0.5027 1.28 Aged 25-34 0.2512 0.68 Aged 35-44 0.7174 1.81 Aged 45-54 0.1381 0.38 Degree or equivalent 0.8275 2.64 ‘A’-Levels or equivalent 0.5201 2.29 ‘O’-Levels or equivalent 0.2793 1.23 Qualifications below ‘O’-Level 0.3871 1.52 Attended fee-paying school 1.4771 2.02 Married 0.3570 1.47 Spouse employed -0.3308 1.42 One child -0.2532 1.06 Two children -0.8761 3.12 Three or more children 0.0037 0.01 Previous job non-manual -0.1477 0.69 Local unemployment rate -0.0977 2.63 Health limits type/amount work -0.6995 3.42 Lives in London 0.3750 1.48 Lives in rest of South East 0.0084 0.04 Owner-occupier 0.4209 2.19 Social tenant 0.2280 1.13 Constant -0.9465 1.60 N 459 Mean dependent variable 0.370 Log-likelihood -206.2 χ2 134.6 Pseudo R2 0.2854
Estimation also includes dummy variables for ethnicity, missing information on first employment spell and first job and year dummies.