Embed Size (px)
Citation preview

Leipzig/Halle airport Job ReportLeipzig/Halle airport
Testing the unbound layeron the South runway and taxiways
using SCCC

Introduction Following the construction of the North run-way, Leipzig/Halle airport now has a newSouthern runway. First the old runwayoriginating from 1960 had to be removed.The original runway was subject to limited
use due to cracks, acidic reactions and arunway length of only 2500 m.
The first stage on the 3600 m long and60 m wide new South runway began on31.08.2005. The runway was designed for
24 hours/day operation and bad weatheroperation CAT IIIb for both landing directions.Approx. 5,000,000 m 3 of soil had to bemoved and approx. 1,200,000 m 2 of con-crete surface had to be placed in order toconstruct the runway and aprons. Altogether,approx. 80 contractors with a total of approx.1000 construction workers participated onthe section. The total investment was around290 million Euros. Figure 2 shows a site planof the runway with taxiways, aprons andparking areas. The earthworks and concretework were largely finished at the start of2007. The South runway should be up andrunning mid-2007.
Bearing capacity and compaction require-ments were specified for the South runwayas well as taxiways, aprons and parkingareas for the subsurface, subbase andunbound layers. This article is intended toreport on tests on the bearing capacity and
Leipzig/Halle airport
Bild 2 – Site plan of the South runway (green) with taxiways (dark blue) and aprons.
Authors:Hans-Josef Kloubert, Ralf Thiele, Felix Dietl Author’s address:Hans-Josef Kloubert Dip. Eng., BOMAG, Hellerwald, 56154 Boppard/Germany, [email protected]. Eng. Ralf Thiele, FUGRO CONSULT GmbH, Department of Geomonitoring, Hauptstraße 103, 04416 Markkleeberg/Germany,[email protected] Dietl Dip. Eng. (FH), FUGRO CONSULT GmbH, Department of Geomonitoring, Hauptstraße 103, 04416 Markkleeberg/Germany,[email protected]
Figure 1 – Herstellen des Erdplanums mit BOMAG Bodenstabilisierer MPH 122 und BOMAG Walzenzüge BW 226PDH-4 und BW 226 DH-4.

Leipzig/Halle airport
compaction levels in the unbound layer onthe South runway and taxiways. These testswere put out for tender by the contractor assurface covering dynamic compaction con-trol and additionally as work procedure tests.
Work on the South runway was carried outby ARGE Flughafen Leipzig/Halle (Heilit +Wörner Bau GmbH, Max Bögl Bau-unternehmung GmbH & Co. KG, STRABAGStraßen- und Tiefbau AG) and on the taxi-ways by Bilfinger Berger VerkehrswegebauGmbH. Self-monitoring of both sections wasexecuted by FUGRO CONSULT GmbH,department for geomonitoring. Control moni-toring was carried out by BAUGEO –Ingenieurbüro für Baugrund und GeotechnikGmbH. The compaction equipment and testrollers used came from BOMAG. The follow-ing will first present the SCCC test methodand then report on its use at Leipzig/Halleairport.
2. Surface covering dynamic compaction control
2.1 The measuring principle of theBOMAG TerrameterA precondition for surface covering dynamiccompaction control is that the compactionequipment is fitted with measuring anddocumentation systems. The BOMAGTerrameter (BTM) records data and uses asimple display. BOMAG CompactionManagement (BCM) is a complex displayand evaluation system. At different timesduring construction of the new South run-way, 25 BOMAG single drum rollers inweight classes ranging from 13 to 26 t wereused. 18 single drum rollers, primarily fromthe BW 213 DH-4 and BW 213 DH-4 BVCVARIOCONTROL range were equipped withthe Terrameter BTM prof measuring system.The documentation system BCM 05 wasalso installed on six of the single drumrollers.
The measuring principle of the TerrametersBTM prof is based on determining the dy-
namic stiffness of the soil. A force-travel dia-gram stemming from the vertical equilibriumof forces and the vertical oscillating path of
the drum is created for each eccentric revo-lution from the acceleration signals measu-red by the vibrating roller body.
Figure 3 – Determining the EVIB value.
Figure 4 – BOMAG Terrameter BTM prof and the BCM 05 documentation system.
engl. Übersetzung
engl. Übersetzung

The stiffness is calculated on the load axis ofthe force-travel diagram with �F/�S.Increasing levels of stiffness lead to steeperload curves. Taking the linear, elastic andisotropic relations as a basis, the dynamicstiffness module for the soil can be derivedfrom the stiffness; this dynamic stiffnessmodule is in direct correlation to the defor-mation module EV of the static load platetest. The dynamic stiffness module of thesoil which is designated with EVIB describesthe bearing capacity of the soil, similar to thedeformation module EV, but on the basis ofthe dynamic measurement of the vibratoryroller (Figure 3).
Here we are dealing with a physically verifi-able measuring variable which in contrast tothe nondimensional dynamic measuredvalues can be referred to not only for quali-tative but also for quantitative evaluation ofthe compaction status and level of bearingcapacity. Calibration between EVIB and EV is
necessary while taking into account differentmaterial behaviour under static and dynamicload on the soil.
2.2 Roller integrated measuring anddocumentation systemsThe Terrameter BTM prof essentially con-sists of the recorder unit with two accelera-tion sensors (which are not arranged on therotating part of the drum), the electronic unit,a travel sensor, the operating and displayunit and a printer. The Terrameter displaycontinuously shows the EVIB value, theworking speed, frequency and amplitude.The printer enables printouts to be madedirectly on-site for paths up to 150 m long.The paper strip documents the recordedEVIB value as a continuous line record andalso documents the operating parameters ofthe compaction equipment. The measure-ment printout is particularly helpful onsmaller construction sites and for case-by-
case control of compaction on larger pro-jects. Weak points and areas with a low bea-ring capacity can be precisely localizedalong the measuring route. By comparingthe measurement printouts from severalpasses, you can also identify and documentthe compaction progress and the maximumcompaction level possible with the equip-ment.
The BCM 05 documentation system is in-dispensable for surface covering measure-ment of the site and for exchanging databetween roller and site office on medium-sized and large construction jobs, such ashighways or preparing sites for commercialand industrial buildings and container termi-nals.
During the compaction process, any meas-ured data coming from the BTM prof isdisplayed graphically and numerically to theroller driver on the colour display of the BCM05 system and is analysed, managed anddocumented on a PC using the evaluationprogram BCM 05 office. Data transfer be-tween display and PC is by USB memorystick (Figure 4).
The BCM 05 software creates meaningfuland detailed data summaries with calcula-tions of areas and static examination of theEVIB values for assessing compaction quali-ty both on the BCM display for the roller driv-er and in the site office for the data evalua-tor (test engineer for self-monitoring). Thegraphic display can either be a top view with
Einsatzmöglichkeiten von BOMAG BTM prof und BCM 05
Figure 6 – BOMAG BW 213 DH-4 BVC with GPS receiver and BCM 05 display.
Figure 5 – Track-bound documentation with the BOMAG BW 213 DH-4 and BCM 05.
Figure 7 – Example of GPS based SCCC with colourallocations corresponding to the compaction level achieved.

Einsatzmöglichkeiten von BOMAG BTM prof und BCM 05
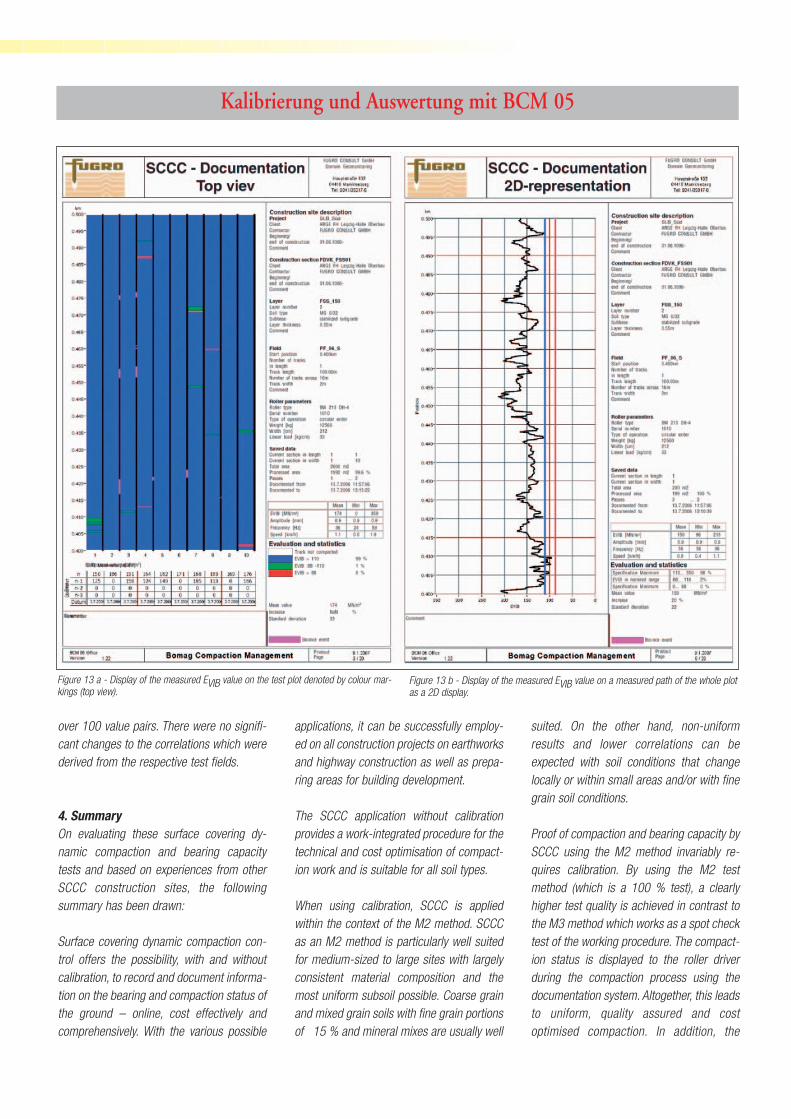
colour allocations or a 2D representation(Figures 13a and 13b) (EVIB value overthemeasured length). In this respect, the 2Drepresentation corresponds to the measuredprintout display of the Terrameters (Figure5).
Without GPS, documentation is implementedon a track-bound basis using path lengths of 100 m. For this purpose, the area to be pro-cessed is subdivided into a roller path grid;grid size, positioning within the field by XYcoordinates and other data important fordescribing compaction work are prepared inthe site office using BCM 05 office andsaved onto as USB stick.
The documentation system not only offerstrack-oriented documentation with manualpositioning in the section but also a satellite
supported documentation solution with thesoftware module BCM 05 positioning devel-oped by BOMAG (Figures 6, 7).
This not only provides continuous recordingand documentation of the EVIB value, butalso of the locational and height-relatedposition of the roller, the operating parame-ters of the roller and the time of measure-ment. In principle, all conventional, differen-tial GPS systems with correction signalsfrom reference stations or with satellite sup-ported reference services can be used.Depending on the system and receiver qua-lity, positioning accuracies of 2-5 cm (RTK-GPS) or 10-30 cm can be achieved using areference satellite. The BCM 05 positioningsoftware transforms incoming satellite datainto the Gauß-Krüger coordinate system orinto another local system if the appropriate
transformation parameters have been enter-ed. Axes and outlines can be easily incorpo-rated for orientation within documentedareas by recording special points in the con-struction measure.
2.3 SCCC applicationsSince the introduction of ZTVE – StB 94/97(additional technical specifications andguidelines in earthworks for road construc-tion), roller integrated measuring and docu-mentation systems can be used within thecontext of self-monitoring and external qual-ity control of earthworks in road construc-tion. In this case, special emphasis is on theapplication of SCCC (as a one hundred per-cent test based on calibration of the dynamicmeasured values of the roller) on the testfeatures defined in the building contract,compaction degree and deformation mod-ule. The procedural method is laid down asthe M2 test method in the ZTVE – StB 94/97and in the technical test specifications forsoil and field in road construction (TP BF –StB) SCCC method – Part E2. The applica-tion of SCCC as a one hundred percent testis explained in section 3 using the construc-tion of the South runway and taxiways as anexample.
In addition, SCCC offers a range of otherapplication options which do not require cali-bration (Figure 8). A surface covering searchfor weak points carried out with the BCM 05by proof rolling can be applied to all types ofsoil. Weak points with low EVIB values canthus be identified and documented.Compaction can be assessed at these weakpoints in a targeted way using individualtests. The area can be assessed as a wholeby combining the dynamic measured valueof the roller and an individual test. Anotherimportant application is the documentationof compaction based on trial compactionand the related determination of a workinstruction. To this end, the EVIB values andposition of the roller are continuously docu-mented using the BCM 05 system and aGPS connection which consequently means
Figure 8 – Application options of SCCC.

that the compaction passes are also con-trolled. The advantages of SCCC, for in-creasing compaction performance andimproving compaction quality, can besummarized as follows:• Non-uniform and poorly compacted sites
are localized and documented• The compaction process and the level of
compaction achieved can be documentedin a continuous line
• The risk of under- and overcompaction isreduced
• The use of compaction equipment is opti-mised
• The lower expenditure for compaction andcompaction control lead to time and costsavings
• Testing efficiency can be increased consi-derably
3. Surface covering dynamic compaction testing (SCCC) as a test and control method on the South runway and taxiways
3.1 Structural layout and test require-mentsThe layout of the South runway and taxiwaysis shown in the following together with thebearing capacity and compaction require-ments (Figure 9). Layout and test require-ments for both construction areas are iden-tical. The surface area to be processed perlocation is 280,000 m 2 on the South runwayand 280,000 m 2 on the taxiways. Accordingto site regulations, the subgrade is primarilymade up of a mixed-grain soil in thicknessesof up to 4 m. Figure 9 shows the further lay-out of and requirements on the bearingcapacity and compaction levels.
The contractor requested the surface cover-ing dynamic compaction control method(SCCC) in addition to quality control withinthe scope of the M3 method for testing thebearing capacity and compaction of theunbound bearing layers (anti-frost layer andcrushed stone subbase). Based on existingexperience with SCCC, a 100% test of all
surfaces and all test levels with SCCC wasaimed for, whereby the expenditure forsupplementary quality assurance tests wasto be considerably reduced. Extensive testand calibration fields form the basis for thisreduction in conventional tests.
3.2 Test planA test plan was prepared for both sectionsin graphic and tabular form by FUGROCONSULT GmbH, department of geomonitor-ing, as self-monitoring supervisor. This planwas confirmed in agreement with theconstruction companies by quality controlmonitoring and by the contractor.
Verdichtungsanforderungen und Prüfplan für ungebundenen Oberbau
Figure 10 – An extract from the graphic test plan for the taxiways - the crushed stone subbase here is shown as a 2ndanti-frost layer.
Figure 9 – Structural layout of the South runway andtaxiways including test requirements.

Verdichtungsanforderungen und Prüfplan für ungebundenen Oberbau
Each test plot was checked over 100% ofthe area using the SCCC method. Testingwas based on a calibration of the SCCCvalue EVIB for bearing capacity andcompaction. On each test plot, the bearingcapacity was measured directly with thestatic load plate and the compaction levelwas measured directly using the sandsubstitution method or the Troxler probe inthe area with the lowest recorded value(EVIB) from the SCCC test. The scope of testsaccording to M3 was thereby reduced to onedirect test each. In addition to the M2method, a weak point search was still car-ried out with subsequent direct testing. Thisensured that the targets were achievedacross the entire surface area.
The results from the SCCC tests and thedirect tests were evaluated and documentedby the self-monitoring supervisors and thensubsequently they were made available toquality control and the contractor within24 hours.
In order to carry out self-monitoring, thesection was subdivided into test plots. A testplot was established as having a width of15 compaction paths and a length of 100 m.This resulted in 100 test plots for the Southrunway, each with an area of approx.3000 m 2. Consequently a roller track orien-ted test scheme was selected. An extractfrom the graphic test plan is shown in Fi-gure 10.
3.3 Test fields/evaluationCalibration is always necessary for applyingSCCC within the context of the M2 method.The calibration fields have been integratedinto the layout of the South runway and taxi-ways. Preliminary tests showed that thenumber of passes recommended accordingto test specification M2 is only of limitedsuitability for the materials used. The mate-rial showed maximum compaction after2 – 3 passes already. More than 4 passesled to a reduction in the display values. Ameasurement run directly following com-
paction led to no applicable results. For thisreason, the measurement run was carriedout only 24 hours after compaction, likewisethe static plate load tests and the direct den-sity determinations. Then static load platetests and direct density determinations werecarried out within the calibration fields on atleast 9 points. These tests were carried outin a targeted way in areas with low, mediumand high EVIB values. This meant that thetest specification requirement for recordingthe largest possible measured value rangecould be taken into account.
The measured values for the dynamic comp-action test (EVIB) were correlated to the bea-ring capacity (EV2) and the degree of com-paction (DPr). In this way, a functionaldependency between EVIB and EV2 or EVIBand Dpr could be derived from the cali-bration diagrams. A smooth drum rollerBW 213 DH 4 from BOMAG was used for thecompaction work. The settings betweencompaction run and measurement run werenot altered. The calibration fields were pro-duced based on experience with the follow-ing equipment settings on the compactionroller:• Travel speed: 1,5 – 1,7 km/h• Amplitude: 0,9 mm• Frequency: 36 Hz
Using the selected low amplitude, the EVIBvalue is recorded roughly over a depth of0.6 m as an integral value for a surface areameasuring approx. 0.50 m 2. The Evib valuecorresponds to the average soil characte-ristic for this soil volume. The selectedamplitude during SCCC leads to a measuringdepth which corresponds to the testingdepth of the static load plate.
In the calibration fields' result for the anti-frost layer and the crushed stone subbase,maximum compaction was usually reachedafter three passes and the fourth pass wasimplemented as a measurement run (> 24hours after compaction). Identical material
was used for the crushed stone subbase onthe taxiways and on the South runway.According to expectations, both calibrationsthat were carried out show a concurringresult for the bearing capacity calibrat-tion.
• EV2 = 150 MN/m2 ~ EVIB = 107 or110 MN/m2
The anti-frost material was procured fromdifferent suppliers stating the same materialrequirements for both sections. The calibra-tion curves of the two different materialssupplied differed from each other.
• EV2 = 120 MN/m2 ~ EVIB = 80 or103 MN/m2
This makes it clear that independent calibra-tion is required for each material.
Using the result of the calibration tests, thetest plan went on to define what test resultswere needed for a test plot to pass the requi-rements. In this respect, the following targetvalues were defined:
• Weak point variable –smaller than 2.0 m in length and smallerthan one track width
• Target value not met –lower than 20 % at the weak point
• Area evaluation –10 % quantile value 10 % area proportion
This means that if the target EVIB value isfallen short of by less than 20 % over alength of < 2.0 m, the test plot is consideredto have passed still if a total of at least 90 %of the area has reached or exceeded the tar-get EVIB value. A colour illustration was deri-ved from this definition. A distinction wasmade between:
• Target value achieved – blue• Target value fallen short of by max. 20 %
– green• Target value fallen short of by more than
20 % – red 1 1 Übergang = 1 Überfahrt in Vor- oder Rückwärtsbe-wegung

In addition to this, the respective colouredarea was determined as a % in relation tothe overall area of the test plot. Figure 12shows an example of this evaluation. Thesize of a single weak point can be measuredusing the true-to-scale representation of thetracks.
3.4 Daily working methodTo implement SCCC, the data recording unitBOMAG Terrameter (BTM prof) and thedocumentation and display unit BOMAGCompaction Management (BCM 05) wasinstalled in the measuring roller. Once thetest plots were notified as having been com-
pleted by the contractor, the self-monitoringsupervisors (measuring engineers fromFUGRO CONSULT GmbH) established andprepared these test plots in the office usingthe BCM 05 software from BOMAG. Whendoing this, the following values were definedalongside the original data for each testplot:
• Test plot number• Coordinates• Number of tracks and track reference• Track length• Target values for EVIB• Colour arrangement definition• Calibration used
The prepared test plots were installed thenext day on the BCM 05 display in the rollerby the self-monitoring supervisors; this wasfollowed by marking of the test plots andtrack arrangement over the grounds. Duringthe measurement run, the roller driver wasimmediately able to read off areas withinsufficient compaction and to see the restof the entire test plot on the BCM 05 displayright after conclusion of the measurementrun.
The display is shown either as a function ofthe measured EVIB value over the measuredlength (2D representation) or as a colouredarea representation (top view). Both displays
(Figure 13) show the target value and a 20%undercut according to the test plot definitionby colour selection.
If the measurement run was successful, thedata was saved; if compaction was insuffi-cient, self-monitoring determined furthermeasures. The data from the measurementruns were outputted the next day.Subsequent evaluation was carried out bythe technician on the office computer.
Documentation for a test plot comprises acover sheet with the original data, a top viewof the test plot with colour allocation of theachieved target variables including staticevaluation as well as a 2D display for eachmeasured track. This data was sent to thequality controller as a PDF document fortheir information and for inspection.Furthermore, the quality controller received asuggestion for the location of the direct bear-ing capacity and compaction tests on thetest plot. These tests were then partially car-ried out in the presence of the quality con-troller or they were implemented parallel bythe self-monitoring supervisor and qualitycontroller. The balloon method, sand substi-tution method or the Troxler probe as well asthe static load plate were used in this instance(Figure 14). The results of the direct testswere added to the PDF document from theSCCC test. This completed the concludingdocumentation for the test plot after approx.24 hours. The test plot was entered andmarked as complete in the graphic andtabular overall test plan.
Altogether, 95 % of all test plots achievedthe test criteria during the first measurementrun. Subsequent compaction led to all othertest plots meeting the requirements.Calibration of the test fields was supplemen-ted by the test results of the direct bearingcapacity and compaction tests for each testplot. Consequently, with each test plot, anot-her pair of values (EVIB; EV2) or (EVIB; DPr)were made available for correlation.Following conclusion of the constructionmeasure, each correlation was based on
Kalibrierung und Auswertung mit BCM 05
Figure 12 - Extract from the SCCC documentation withcolour selection corresponding to the definition of targetvariables.
Figure 11 – Correlation diagram EVIB v. EV2.
Kalibrierung und Auswertung mit BCM 05
over 100 value pairs. There were no signifi-cant changes to the correlations which werederived from the respective test fields.
4. SummaryOn evaluating these surface covering dy-namic compaction and bearing capacitytests and based on experiences from otherSCCC construction sites, the followingsummary has been drawn:
Surface covering dynamic compaction con-trol offers the possibility, with and withoutcalibration, to record and document informa-tion on the bearing and compaction status ofthe ground – online, cost effectively andcomprehensively. With the various possible
applications, it can be successfully employ-ed on all construction projects on earthworksand highway construction as well as prepa-ring areas for building development.
The SCCC application without calibrationprovides a work-integrated procedure for thetechnical and cost optimisation of compact-ion work and is suitable for all soil types.
When using calibration, SCCC is appliedwithin the context of the M2 method. SCCCas an M2 method is particularly well suitedfor medium-sized to large sites with largelyconsistent material composition and themost uniform subsoil possible. Coarse grainand mixed grain soils with fine grain portionsof 15 % and mineral mixes are usually well
suited. On the other hand, non-uniformresults and lower correlations can beexpected with soil conditions that changelocally or within small areas and/or with finegrain soil conditions.
Proof of compaction and bearing capacity bySCCC using the M2 method invariably re-quires calibration. By using the M2 testmethod (which is a 100 % test), a clearlyhigher test quality is achieved in contrast tothe M3 method which works as a spot checktest of the working procedure. The compact-ion status is displayed to the roller driverduring the compaction process using thedocumentation system. Altogether, this leadsto uniform, quality assured and costoptimised compaction. In addition, the
Figure 13 a - Display of the measured EVIB value on the test plot denoted by colour mar-kings (top view).
Figure 13 b - Display of the measured EVIB value on a measured path of the whole plotas a 2D display.

quality control tests demanded by thecontractor can be carried out in a targetedway using the documentation functions ofthe BCM 05 system. For the client, thismeans higher reliability and for the con-tractor it offers cost optimised compaction.
This does not result in additional work for thetechnical personnel on the single drum roll-ers. The work of the test engineer changessignificantly. It is recommended that theSCCC test is carried out from planning up todata management by an experienced self-
monitoring technician. Overall, this will meanno extra costs for self-monitoring in com-parison to the M3 method.
It is mandatory to use a calibration areawhen applying the M2 method. The numberof compaction passes should be determinedby preliminary tests. The measurement runand direct tests are simultaneous but mustonly be carried out at least 24 hours aftercompaction. Results from direct quality testsshould be used to update and qualify cali-bration.
If test plots are straight, calibration can becarried out geodetically or by manual GPS. Ageoreferenced creation of test plots isrecommended on curves, multi-layered andoffset test areas. This option is available onBOMAG rollers by optional GPS receiversand a GPS software module in the BCM 05system.
Surface covering dynamic compaction con-trol was successfully used at Leipzig/Halleairport for the South runway and for the taxi-ways to test the unbound layer. The selectedtest plot sizes and testing criteria have prov-en to be valid. The engineer's technical self-monitoring and external quality control workincreased in scope and necessitated a grea-ter proximity to the construction site as wellas closer collaboration with the contractorand the client's project management depart-ment.
The sections were subjected to 100%testing density with additional direct, subse-quent testing. All test plots passed; therewere no weak points identified. An evenlycompacted, unbound layer capable of takingthe maximum load was produced. The tar-gets set by the client were fully met. 100%testing density was achieved by applyingSCCC while overall costs remained roughlythe same for self-monitoring, and idle timefor the construction equipment was lower. Atthe same time, the time and effort requiredfor direct testing was reduced to 1/5 of theoriginal plan. Consequently, using SCCC at
Vorteile der flächendeckenden dynamischen Verdichtungskontrolle
Figure 14 a – Bearing capacity test with the static load plate.
Figure 14 b – Compaction test with a Troxler probe.

Vorteile der flächendeckenden dynamischen Verdichtungskontrolle
Leipzig/Halle airport, a higher test qualitywas achieved with lower total costs in com-parison to the classic M3 test method.
The successful outcome was due not only tohigh quality and timely work but also theconstructive collaboration of all participatingcontractors and engineers; all parties work-ed harmoniously sharing responsibility on acontract where deadlines were tight. Themovement of material was huge and a largenumber of other companies were working onthe site. We would like to thank all of thosewho participated in this project. Our specialthanks go to the South project managementdepartment at Leipzig/Halle airport GmbH forthe participation of many regional com-panies in the overall project; for their supportin preparing SCCC and for the consistentand successful application of SCCC on thecontract.
We wish Leipzig/Halle airport every futuresuccess.
Bibliography:
FGSV (1994)Technische Prüfvorschriften für Boden undFels im Straßenbau TP BF – StB Teil E 2,Flächendeckende dynamische Prüfung derVerdichtung [technical test specifications forsoil and rock in road construction TP BF –StB Part E 2, surface covering dynamic tes-ting of compaction]
FGSV (2005) Merkblatt über flächendeckende dynami-sche Verfahren zur Prüfung der Verdichtungim Erdbau, zur Zeit in Bearbeitung/Überar-beitung [code of practice for the surfacecovering dynamic method for testing com-paction in earthworks, currently in pro-gress/being revised]
FGSV (2003) Merkblatt über die Verdichtung desUntergrundes und des Unterbaus imStraßenbau [code of practice for the com-paction of subsoil and subbase in road con-struction]
ZTVE-StB 94/97Zusätzliche Technische Vertragsbedingun-gen und Richtlinien für Erdarbeiten, im
Straßenbau [additional technical specifica-tions and guidelines for earthworks in roadconstruction]
Floss, R., Kröber, W., Wallrath, W., (2001) Dynamische Bodensteifigkeit als Quali-tätskriterium für die Bodenverdichtung,Berichte, Internationales Symposium Technikund Technologie des Verkehrswegebaus,Munich [dynamic soil stiffness as a qualitycriterion for soil compaction, reports,international symposium on technology andtraffic route construction]
Floss, R. (2001)Verdichtungstechnik im Erdbau undVerkehrswegebau, Band 1, BOMAG [com-paction technology in earthworks and trafficroute construction, Volume 1]
BOMAG (2006)Workshop Flächendeckende dynamischeVerdichtungskontrolle [workshop on surfacecovering dynamic compaction control]
VSVI (2006)BV Leipzig, Mr Talkenberg, report on a pro-fessional excursion to Leipzig/Halle airport –new South runway
Figure 15 – Start- und Landebahn Leipzig Süd im Bau.

Zusammenfassung der Projektdaten
Head Office/Hauptsitz:BOMAG, Hellerwald, 56154 Boppard, GERMANY, Tel.: +49 6742 100-0, Fax: +49 6742 3090, e-mail: [email protected] Maschinenhandelsgesellschaft mbH, Porschestraße 9, 1230 Wien, AUSTRIA, Tel.: +43 1 69040-0, Fax: +43 1 69040-20, e-mail: [email protected] (CANADA), INC., 1300 Aerowood Drive, Mississauga, Ontario L4W 1B7, CANADA, Tel.: +1 905 6256611, Fax: +1 905 6259570, e-mail: [email protected] (CHINA) Compaction Machinery Co. Ltd., No. 2808 West Huancheng Road,Shanghai Comprehensive Industrial Zone (Fengxian), Shanghai 201401, CHINA,Tel.: +86 21 33655566, Fax: +86 21 33655508, e-mail: [email protected] FRANCE S.A.S., 2, avenue du Général de Gaulle, 91170 Viry-Châtillon, FRANCE, Tel.: +33 1 69 57 86 00, Fax: +33 1 69 96 26 60, e-mail: [email protected] (GREAT BRITAIN), LTD., Sheldon Way, Larkfield, Aylesford, Kent ME20 6SE, GREAT BRITAIN, Tel.: +44 1622 716611, Fax: +44 1622 718385, e-mail: [email protected] Italia Srl., Z.I. - Via Mella 6, 25015 Desenzano del Garda (Bs) , ITALY, Tel.: +39 030 9127263, Fax: +39 030 9127278, e-mail: [email protected] Japan Co., LTD., Oval Court Ohsaki Mark West Bldg. 8th floor, 2-17-1, Higashi Gotanda, Shinagawa-ku,Tokyo, JAPAN, 141-0022, Tel: +81 3 5449 7560, Fax: +81 3 5449 0160, e-mail: [email protected] GmbH, 300 Beach Road, The Concourse, #38-03, Singapore 199555, SINGAPORE, Tel.: +65 6 294 1277, Fax: +65 6 294 1377, e-mail: [email protected] Americas, Inc., 2000 Kentville Road, Kewanee, Illinois 61443, U.S.A., Tel.: +1 309 8533571, Fax: +1 309 8520350, e-mail: [email protected]
Die abgebildeten Maschinen besitzen teilweise Sonderausstattungen, die gegen Aufpreis lieferbar sind. Änderungen bei Konstruktion, Form und Lieferumfang sowieAbweichungen im Farbton bleiben vorbehalten.
02/0
5 P
RF
108
063
•
•••
••••••
+ www.bomag.com + www.bomag.com + www.bomag.com + www.bomag.com +
06/0
7 Jo
b R
epor
t
BOMAG provides local serviceand support no matter where yournext contract is located.
As world market leader in com-paction equipment, we offer youthe widest range of productsbacked by expert support andadvice aimed at keeping youroperation profitable.
Modern manufacturing plants inGermany, USA and China togetherwith licencees and partners around the world supply BOMAGrollers to global markets.
Regional customer care is centredon six branches in Germany, eightsubsidiaries in Austria, Canada,China, France, Great Britain,Italy, Japan and USA, one salesoffice in Singapore and over 500independent BOMAG dealers.
BOMAG Service. Everywhere andfor every need. Our branchesand dealers are backed byBOMAG’s Central Parts ware-house where about 40,000 partsare held against customer require-ments. You expect top servicefrom BOMAG. We aim to provide it.
Quality! For the paint finish of themachine BOMAG as far as possibleuses a high quality environmentallyfriendly powder coating, whichexcels by its excellent resistanceagainst corrosion, scratching andultraviolet light.
BOMAG. The world’s foremostcompaction company.
The machines illustrated may show optional equipment which can be supplied at additional cost. Specifications may change without notice.
Project: Leipzig/Halle airport in 2 sub-projects1. New-build of South runway –
length 3600 m, width 60 m2. New-build of taxiways
Customer: Flughafen Leipzig/Halle GmbH
Contractor: 1. ARGE Flughafenbau Leipzig Halle:Heilit + Wörner Bau GmbH,Max Bögl Bauunternehmung GmbH & Co. KG,STRABAG Straßen- und Tiefbau AG
2. Bilfinger & Berger Verkehrswegebau GmbH
Self-monitoring Fugro Consult GmbH, Speciality Geomonitoring,(internal quality Markkleebergcontrol):
External quality BAUGEO, Ingenieurbüro für Baugrund und Geotechnik GmbH,control: Leipzig
Compaction work: Earthworks 5.000.000 m3
Earthworks/non-bonded SLB: 1. Anti-frost layer B 1: thickness 0.25 m: 69.000 m3
Anti-frost layer B 2: thickness 0.30 m: 83.000 m3
Taxiways: 2. Anti-frost layer B 1: thickness 0.25 m: 95.000 m3
Anti-frost layer B 2: thickness 0.30 m: 114.000 m3
Compaction 3 x BW 225 / BW 226 smooth drum andequipment: padfoot roller drums
4 x BW 219 smooth drum and padfoot roller drums12 x BW 213 DH-4 and BW 213 DH-4 BVC with
BOMAG Terrameter BTM prof6 x BW 213 DH-4 and BW 213 DH-4 BVC with Terrameter
BTM prof and BMC 05
Information: BOMAG GmbH, Application Technology, H.-J. Kloubert Dip. Eng.Tel.: +49 6742 / 100350 Fax: +49 6742 / 3090