Embed Size (px)
Citation preview

C O R P O R A T I O N
Research Report
Supported by the National Education Association and the American Federation of Teachers
ASHLEY WOO, ELIZABETH D. STEINER
Job-Related Stress Threatens the Teacher SupplyKey Findings from the 2021 State of the U.S. Teacher Survey—Technical Appendixes
For more information on this publication, visit www.rand.org/t/RRA1108-1.
About RANDThe RAND Corporation is a research organization that develops solutions to public policy challenges to help make communities throughout the world safer and more secure, healthier and more prosperous. RAND is nonprofit, nonpartisan, and committed to the public interest. To learn more about RAND, visit www.rand.org.
Research IntegrityOur mission to help improve policy and decisionmaking through research and analysis is enabled through our core values of quality and objectivity and our unwavering commitment to the highest level of integrity and ethical behavior. To help ensure our research and analysis are rigorous, objective, and nonpartisan, we subject our research publications to a robust and exacting quality-assurance process; avoid both the appearance and reality of financial and other conflicts of interest through staff training, project screening, and a policy of mandatory disclosure; and pursue transparency in our research engagements through our commitment to the open publication of our research findings and recommendations, disclosure of the source of funding of published research, and policies to ensure intellectual independence. For more information, visit www.rand.org/about/principles.
RAND’s publications do not necessarily reflect the opinions of its research clients and sponsors.
Published by the RAND Corporation, Santa Monica, Calif.© 2021 RAND Corporation
is a registered trademark.
Cover: Lightfield Studios/Adobe Stock
Limited Print and Electronic Distribution RightsThis document and trademark(s) contained herein are protected by law. This representation of RAND intellectual property is provided for noncommercial use only. Unauthorized posting of this publication online is prohibited. Permission is given to duplicate this document for personal use only, as long as it is unaltered and complete. Permission is required from RAND to reproduce, or reuse in another form, any of its research documents for commercial use. For information on reprint and linking permissions, please visit www.rand.org/pubs/permissions.

iii
About This Report
The American Educator Panels (AEP) are nationally representative samples of teachers, school leaders, and district leaders across the country.
In the main report, Job-Related Stress Threatens the Teacher Supply: Key Findings from the 2021 State of the U.S. Teacher Survey, that accompanies these appendixes, we draw on the American Teacher Panel (ATP) to examine teachers’ reports of their own well-being and working conditions to understand what factors might influence teachers’ intentions to leave their teaching jobs during the coronavirus disease 2019 (COVID-19) pandemic. In these technical appendixes, we provide more detail about the data, samples, and methodology. We also present the results of the survey questions referenced in the main report. The survey was administered to 1,006 ATP members in January and February 2021.
RAND Education and Labor This study was undertaken by RAND Education and Labor, a division of the RAND
Corporation that conducts research on early childhood through postsecondary education programs, workforce development, and programs and policies affecting workers, entrepreneurship, and financial literacy and decisionmaking. This report is based on research supported by the National Education Association and the American Federation of Teachers. The findings and implications we present are those of the authors and do not necessarily reflect positions or policies of the organizations that supported this research.
More information about RAND can be found at www.rand.org. Questions about this report should be directed to [email protected], and questions about RAND Education and Labor should be directed to [email protected].
Acknowledgments We are extremely grateful to the U.S. public school teachers who have agreed to participate
in the American Teacher Panel. Their time and willingness to share their experiences are invaluable for this effort and helped us understand more about how to better support their hard work in schools. We are grateful to Stacey Pelika and her colleagues at the National Education Association and to Marla Ucelli-Kashyap, Rob Weil, Marcus Mrowka, and their colleagues at the American Federation of Teachers for their collaboration and helpful feedback on the survey and the draft report. We thank our RAND colleagues, Rebecca Sepich and Stephanie Lonsinger, for their assistance with document support and Heather Schwartz, Melissa Diliberti, and Julia Kaufman for their insightful feedback on early drafts of the report. We also thank our reviewers, Susan Moore Johnson from the Harvard Graduate School of Education and Katherine Carman

iv
and Alicia Locker from RAND, for helpful feedback that substantively improved this report. We thank David Grant, Christopher Young, Casey Hunter, Alvin Nugroho, and Tina Petrossian for their support of our data-collection effort. Monette Velasco gracefully managed the publications process and Blair Smith provided expert editing. Any flaws that remain are solely the authors’ responsibility.

v
Contents
About This Report .......................................................................................................................... iiiTables ............................................................................................................................................. viAbbreviations ................................................................................................................................. xiAppendix A. Methods ..................................................................................................................... 1
Survey Development, Administration, Analysis, and Weighted Descriptive Statistics ........................... 1Stress, Depressive Symptoms, and Burnout, by Teacher Subgroups ....................................................... 6Qualitative Coding of Open-Ended Responses ...................................................................................... 10Administration and Analysis of the American Life Panel Survey ......................................................... 10Analysis of Data from the University of Southern California’s Understanding America Study ........... 11Limitations .............................................................................................................................................. 12
Appendix B. ATP Survey Questions and Responses .................................................................... 14Teacher and Student Characteristics ....................................................................................................... 14Teacher Well-Being ................................................................................................................................ 19Respondents’ Teaching Experience During COVID-19 ........................................................................ 26
Appendix C. Survey Questions and Responses from the American Life Panel ........................... 47Appendix D. Survey Questions and Responses from the Understanding America Study ............ 49References ..................................................................................................................................... 50

vi
Tables
Table A.1. Weighted Descriptive Statistics for the Survey Sample and Three Teacher Leaver Subgroups: Teacher Characteristics ........................................................................................ 2
Table A.2. Weighted Descriptive Statistics for the Survey Sample and Three Teacher Leaver Subgroups: School and Student Characteristics ..................................................................... 4
Table A.3. Weighted Descriptive Statistics for Well-Being Indicators .......................................... 7Table A.4. Weighted Descriptive Statistics for Survey Sample and Teacher Subgroups on
Well-Being Indicators: Teacher Characteristics ..................................................................... 8Table A.5. Weighted Descriptive Statistics for the Survey Sample and Teacher Subgroups on
Well-Being Indicators: School and Student Characteristics ................................................... 9Table B.1. This School Year (2020–2021), What Grade(s) Do You Teach? ............................... 14Table B.2. Please Indicate the Subject(s) You Teach This School Year (2020–2021). ............... 15Table B.3. Please Indicate Whether You Are a Teacher of Record for Class(es) You Teach
and/or Provide Push-In/Pull-Out Services. ........................................................................... 15Table B.4. Approximately What Percentage of the Students You Teach Are English
Language Learners? .............................................................................................................. 16Table B.5. Approximately What Percentage of the Students You Teach Have an
Individualized Education Program (IEP) and/or 504 Plan? .................................................. 16Table B.6. Are You a Member of a Teachers’ Union or an Education Association? ................... 16Table B.7. Are You a Member of the National Education Association (NEA) or One of Its
State Affiliates? ..................................................................................................................... 16Table B.8. Are You a Member of the American Federation of Teachers (AFT) or One of Its
State Affiliates? ..................................................................................................................... 17Table B.9. Are You a Member of Any Other Teachers’ Unions or Education Associations? ..... 17Table B.10. Including This School Year (2020–2021), but Excluding Your Student
Teaching, How Long Have You Worked as a Teacher? Please Exclude Any Time You Have Taken Off for Family or Medical Leave. ............................................................ 17
Table B.11. During the Current School Year, What Is Your Base Teaching Salary for the Entire School Year? .............................................................................................................. 18
Table B.12. What Is Your Race and Ethnicity? ............................................................................ 18Table B.13. In What Year Were You Born? ................................................................................. 18Table B.14. Since the Beginning of the 2020–2021 School Year, How Often Has Your
Work Been Stressful? ........................................................................................................... 19Table B.15. How Well Are You Coping with the Stress of Your Job Right Now? ..................... 19Table B.16. Which of the Following Are Sources of Stress in Your Job Right Now? ................. 20
vii
Table B.17. Of the Sources of Stress in Your Job You Indicated, Rank the Top Three from One to Three. ........................................................................................................................ 21
Table B.18. Before COVID-19, How Many Hours Did You Sleep on Average During a 24-Hour Period on School Nights While Teaching? ............................................................ 22
Table B.19. During COVID-19, How Many Hours Did You Sleep on Average During a 24-Hour Period on School Nights While Teaching? ............................................................ 22
Table B.20. How Many Children Do You Have Living in Your Household in the Following Age Ranges? Enter the Number of Children for Each Age Range. ...................................... 23
Table B.21. Since the Beginning of the 2020–2021 School Year, Who Is the Main Person Responsible for Your Child(ren)’s Care and/or Learning Support While You Are Teaching? .............................................................................................................................. 23
Table B.22. Since the Beginning of the 2020–2021 School Year, Who Is the Main Person Responsible for Your Child(ren)’s Care and/or Learning Support While You Are Teaching? .............................................................................................................................. 24
Table B.23. Over the Last Two Weeks, How Often Have You Been Bothered by the Following Problems? ............................................................................................................ 24
Table B.24. Please Indicate Your Agreement or Disagreement with the Following Statements About Teaching. ................................................................................................. 25
Table B.25. Please Indicate Your Agreement or Disagreement with Each of the Following Statements About Your School. ............................................................................................ 26
Table B.26. Have You Provided Remote Instruction to Any of Your Students This School Year (2020–2021)? ............................................................................................................... 26
Table B.27. Since This School Year (2020–2021) Started, Has Your School Changed Instructional Models Because of Concerns About COVID-19 Transmission? .................... 26
Table B.28. How Many Times Has Your School Changed the Way You Teach Most of Your Students This School Year (2020–2021)? ................................................................... 27
Table B.29. Which of the Following Most Closely Reflects How You Are Teaching Your Students as of Today? ........................................................................................................... 27
Table B.30. You Indicated That, as of Today, You Are Teaching Your Students Using a Hybrid Model. Please Indicate Whether You Are Using Any of the Following Approaches ........................................................................................................................... 28
Table B.31. What of the Following Most Closely Reflects How You Would Like to Teach Your Students Today? ........................................................................................................... 28
Table B.32. What Is the Likelihood That You Will Leave Your Job by the End of the Current School Year (2020–2021), Compared to the Likelihood That You Would Have Left Your Job Before COVID-19? ....................................................................................... 29
Table B.33. What Is the Likelihood That You Will Leave Your Job by the End of the Current School Year (2020–2021), Compared to the Likelihood That You Would Have Left Your Job Before COVID-19? ...................................................................................... 29

viii
Table B.34. Do You Plan to Remain in Your Current Teaching Job in the 2021–2022 School Year? ..................................................................................................................................... 29
Table B.35. What Are Your Plans After You Leave Your Current Teaching Job in the 2021–2022 School Year? ...................................................................................................... 30
Table B.36. How Concerned Are You That Your School District Will Furlough or Lay Off Teachers Within the Next Year? ........................................................................................... 30
Table B.37. How Concerned Are You That Your School District Will Furlough or Lay Off Other School Staff Within the Next Year? ........................................................................... 30
Table B.38. What Safety Measures Is Your School Taking to Reduce COVID-19 Transmission During In-Person Instruction This School Year (2020–2021)? ..................... 31
Table B.39. Given the Measures Your School Is Taking to Reduce COVID-19 Transmission During In-Person Instruction This School Year (2020–2021), How Safe Do You Feel Teaching In-Person? ........................................................................................ 31
Table B.40. How Important Do You Consider Each of the Following for Making In-Person Teaching Safer? .................................................................................................................... 32
Table B.41. Do You Plan to Receive a COVID-19 Vaccine? ...................................................... 33Table B.42. Prior to COVID-19, Did You Have Any Experience Delivering Instruction to
Students Remotely? .............................................................................................................. 33Table B.43. Do You Have an Up-to-Date Computer or Tablet That Works Sufficiently for
You to Deliver Instruction Remotely?. ................................................................................. 33Table B.44. Do You Use Your Home Internet Connection to Provide Remote Instruction? ....... 33Table B.45. How Frequently Is Your Home Internet Connection the Source of Technical
Problems When You Are Providing Remote Instruction? .................................................... 34Table B.46. Who Covers the Cost of the Home Internet Connection You Use to Provide
Remote Instruction? .............................................................................................................. 34Table B.47. After a Month Into Remote Teaching This School Year (2020–2021), How
Frequently—on Average—Did You Personally Experience Technical Problems Related to the Technology You Used for Remote Instruction? ......................................................... 34
Table B.48. After a Month Into Remote Teaching This School Year (2020–2021), How Frequently—on Average—Did Your Typical Student Experience Technical Problems Related to the Technology They Used for Remote Instruction? ........................................... 35
Table B.49. How Much Do You Agree with the Following Statements? .................................... 35Table B.50. Approximately What Percentage of the Students Who Are Assigned to Your
Classes Have You Not Been Able to Contact at Least Once This Year (2020–2021 school year)? ......................................................................................................................... 36
Table B.51. Approximately What Percentage of the Families of Students Who Are Assigned to Your Classes Have You Not Been Able to Contact at Least Once This Year (2020–2021 school year)? ..................................................................................................... 36

ix
Table B.52. Approximately What Percentage of Your Students Have Been Present on a Typical School Day This Year (2020–2021)? ...................................................................... 36
Table B.53. Approximately What Percentage of Your Students Have Completed a Majority of Your Assignments This Year (2020–2021)? .................................................................... 37
Table B.54. During a Typical Full Week This School Year (2020–2021), Approximately How Many Hours Do You Work as Part of Your Teaching Position at Your School? ....... 37
Table B.55. During a Typical Full Week This School Year (2020–2021), Approximately How Many Hours Do You Spend Teaching at Your School, Excluding Any Work You Do Outside Your Teaching Position? ........................................................................... 37
Table B.56. During a Typical Full Week Before COVID-19, Approximately How Many Hours Did You Work as Part of Your Teaching Position at Your School? ......................... 38
Table B.57. During a Typical Full Week Before COVID-19, Approximately How Many Hours Did You Spend Teaching at Your School, Excluding Any Work You Did Outside Your Teaching Position? ......................................................................................... 38
Table B.58. In a Typical Day of Teaching During the Current School Year (2020–2021), How Many Hours Do You Spend on the Following Activities? .......................................... 38
Table B.59. This School Year, in What Subject Is Your MAIN Teaching Assignment at THIS School, That Is, the Subject Matter in Which You Teach the Most Classes? ............ 39
Table B.60. During This School Year (2020–2021), Have You Earned Additional Compensation from Working in Any Jobs Other Than Your Public-School Teaching Position? ................................................................................................................................ 39
Table B.61. Which of the Following Responses Best Describes the Other Job(s) You Have Held This School Year (2020–2021)? .................................................................................. 40
Table B.62. In Total, How Much Were You Paid for All the Work You Performed Outside Your Public-School Teaching Position so Far This School Year (2020–2021)? ................. 40
Table B.63. During a Typical Full Week This School Year (2020–2021), Approximately How Many Hours Do You Work in Other Jobs Outside Your Public-School Teaching Position? ................................................................................................................................ 40
Table B.64. Cross-Tabulations Between Mode of Instruction and Teacher Distress Indicators ............................................................................................................................... 41
Table B.65. Cross-Tabulations Between Administrator and School Support and Teacher Distress Indicators ................................................................................................................. 42
Table B.66. Cross-Tabulations Between Technical Problems with Remote Teaching and Teacher Distress Indicators ................................................................................................... 42
Table B.67. Cross-Tabulations Between Responsibilities Outside the Classroom and Teacher Distress Indicators ................................................................................................................. 43
Table B.68. Cross-Tabulations Between COVID-19 Safety Practices and Teacher Distress Indicators ............................................................................................................................... 43
Table B.69. Cross-Tabulations Between Actual and Preferred Modes of Instruction .................. 45

x
Table B.70. COVID-19 Safety Measures and Teacher Leaver Groups ........................................ 46Table C.1. Are You Currently . . . ................................................................................................ 47Table C.2. Since the Beginning of the Pandemic, How Often Has Your Work Been
Stressful? ............................................................................................................................... 47Table C.3. What Is the Likelihood That You Will Leave Your Job by Summer 2021,
Compared to the Likelihood You Would Have Left Your Job Before COVID-19? ............ 47Table C.4. Cross-Tabulations Between the Frequency of Work-Related Stress and
Likelihood of Leaving Their Jobs ......................................................................................... 48Table D.1. Over the Last Two Weeks, How Often Have You Been Bothered by the Following
Problems? .............................................................................................................................. 49Table D.2. Incidence of Depressive Symptoms Within the General Public ................................. 49

xi
Abbreviations
AEP American Educator Panels AFT American Federation of Teachers ALP American Life Panel ATP American Teacher Panel BATs Badass Teachers Association CESR Center for Economic and Social Research COVID-19 coronavirus disease 2019 ELA English language arts ELD English language development ELL English language learner ESL English as a second language FRPL free or reduced-price lunch HVAC heating, ventilation, and air conditioning NCES National Center for Education Statistics NTPS National Teacher and Principal Survey PHQ-2 Patient Health Questionnaire-2 SPED special education SWD students with disabilities UAS Understanding America Study

1
Appendix A. Methods
Survey Development, Administration, Analysis, and Weighted Descriptive Statistics The RAND American Educator Panels (AEP) include samples of K–12 public school
teachers, principals, and school districts and charter management organizations. The AEP comprise the American School District Panel, the American School Leader Panel, and the American Teacher Panel (ATP). The ATP was created in 2014 and includes between 25,000 and 30,000 teachers who have agreed to participate in several surveys each school year. RAND recruits ATP members using probabilistic sampling methods. The ATP samples are designed to be of sufficient size to facilitate national analyses and analyses of prevalent subgroups at the national level (e.g., elementary school teachers, high school mathematics teachers, teachers in urban schools). More information about the sampling and recruitment of teachers to the ATP is available in Robbins and Grant, 2020.
From January 19, 2021, to February 15, 2021, RAND researchers administered a survey to a sample of ATP members who work in K–12 public schools to gather information from teachers across the United States about their well-being and working conditions, including their perceived levels of job-related stress, sources of that stress, the state of their mental health, their responsibilities outside the classroom, and their working conditions during the pandemic.
Many of the survey questions were developed specifically for this study, but several were adapted from other RAND surveys and from other sources. For example, many of the items used to measure teaching experiences during the coronavirus disease 2019 (COVID-19) pandemic were adapted from another RAND ATP survey focusing on teachers who have left the profession (Diliberti, Schwartz, and Grant, 2021), while other items were adapted from the AEP fall 2020 COVID-19 surveys (Kaufman et al., 2020). We also borrowed or adapted items, with permission, from several other sources, such as the American Federation of Teachers’ (AFT’s) Educator Quality of Work Life Survey, Education Week, and the National Teacher and Principal Survey (NTPS) (AFT and Badass Teachers Association [BATs], 2017; National Center for Education Statistics [NCES], 2017). We measured symptoms of depression using the Patient Health Questionnaire-2 (PHQ-2) screener (Kroenke, Spitzer, and Williams, 2003) and measured teacher burnout using items drawn from the NTPS and the Seidman-Zager teacher burnout scale (Seidman and Zager, 1987). The question about coping with job-related stress was adapted from Herman and colleagues’ work on teacher stress and coping (Herman, Hickmon-Rosa, and Reinke, 2018). Our data tables in Appendix B indicate which questions and items were borrowed or adapted from other sources. Additionally, the sponsors of this survey, the National Education Association and AFT, provided feedback on early drafts of the survey. We incorporated their

2
feedback and revised the survey where appropriate while maintaining final editorial control of the survey items.
The ATP survey for this study had an approximate administration time of ten minutes. The survey yielded 1,006 complete responses out of 1,819 eligible invitations for teachers, for a 55-percent completion rate. Tables A.1 and A.2 provide weighted descriptive statistics for survey respondents, as well as the three subgroups of teacher leavers (i.e., likely pandemic leavers, likely prepandemic leavers, and unlikely leavers) that we discuss in the accompanying report. The weights ensure that the sample reflects the national population of teachers. More information about the weighting of survey respondents is available in Robbins and Grant, 2020.
Table A.1. Weighted Descriptive Statistics for the Survey Sample and Three Teacher Leaver Subgroups: Teacher Characteristics
Teacher Characteristics
Full Sample (%)
(N = 1,006)
Percentage of Teachers Who Were
Unlikely to Leave Before COVID-19 but Were Likely to Leave
at the Time of the Survey
(likely pandemic leavers) (n = 148)
Percentage of Teachers Who Were
Likely to Leave Before COVID-19
and Who Were Likely to Leave at the Time
of the Survey (likely prepandemic
leavers) (n = 67)
Percentage of Teachers Who
Were Unlikely to Leave Before
COVID-19 and at the Time of the
Survey (unlikely leavers)
(n = 748) Race (n)
Black (69) 7 10 19 5
Latina/o/x (60) 6 9 3 6
White (829)a 83 78 75 86
Other (52)b, c, d 5 4 0 5
Gender (n)
Male (237) 24 18 24 25
Female (767) 76 82 76 75
Age (n)
20–39 (353) 36 37 33 36
40–49 (304)a 30 22 25 33
50+ (343)a 34 41 43 31
Years of teaching experience (n)
3–10 (299)e 31 35 33 29
11–20 (422) 41 39 39 43
21+ (281) 28 26 28 28
Grade level taught (n)f
Elementary (347) 37 37 35 37
Middle (234) 23 27 33 21
High (391) 39 36 29 40

3
Teacher Characteristics
Full Sample (%)
(N = 1,006)
Percentage of Teachers Who Were
Unlikely to Leave Before COVID-19 but Were Likely to Leave
at the Time of the Survey
(likely pandemic leavers) (n = 148)
Percentage of Teachers Who Were
Likely to Leave Before COVID-19
and Who Were Likely to Leave at the Time
of the Survey (likely prepandemic
leavers) (n = 67)
Percentage of Teachers Who
Were Unlikely to Leave Before
COVID-19 and at the Time of the
Survey (unlikely leavers)
(n = 748) Subject taught (n)g
Math (401) 41 38 37 42
ELA (448) 45 45 43 46
Science (317) 33 28 39 33
Social science (343)
35 32 28 37
ESL/ELD/SPED (178)
18 16 17 18
Salary (n)
Less than $50,000 (240)
24 24 22 24
$50,000–$79,000 (569)a, c
57 64 67 54
More than $79,000 (190)a, c
19 12 10 21
Mode of instruction (n)
Fully remote (414) 42 38 42 42
Hybrid (379) 38 45 37 36
Fully in-person (199)
20 17 21 22
Well-being indicators
Frequent job-related stress (778)a, b
78 96 82 74
Not coping well with job-related stress (205)a, c
20 43 35 15
Symptoms of depression (267)a, c
27 49 38 22
Feelings of burnout (538)a, c
54 81 82 45
NOTES: For our analysis and for the weighted descriptive statistics for our three teacher subgroups of interest, we excluded individuals who stated that they did not plan to remain in their current teaching job in the 2021–2022 school year because they were scheduled to retire. For these respondents, we reasoned that their decision to remain in or leave the profession was less dependent on the working conditions that they faced during the pandemic. Because our report focuses on the working conditions and stressors that were driving teachers to consider leaving their jobs, we decided that it was appropriate to exclude them from these analyses of how likely pandemic leavers, likely prepandemic leavers, and unlikely leavers differ. Thirteen respondents in our sample responded that they were scheduled to retire. The full sample column includes all survey respondents, including teachers who were scheduled to retire. Respondents were able to select all racial categories that applied. Therefore, the numbers in that category

4
will sum to more than the full sample. ELA = English language arts. ELD = English language development. ESL = English as a second language. SPED = special education. a Significant difference between likely pandemic leavers and unlikely leavers. b Significant difference between likely pandemic leavers and likely prepandemic leavers. c Significant difference between likely prepandemic leavers and unlikely leavers. d To create this category of “Other” teachers, we included teachers who identified as “Asian or Asian American,” “Native American or Alaska Native,” “Native Hawaiian or Pacific Islander,” “Multiracial,” and “Something else.” We excluded teachers who responded, “I prefer not to answer.” Only 33 respondents in our sample chose this response option. e Our sample did not include any teachers with fewer than three years of experience. Because our survey was administered before the AEP began its recruitment cycle, we were unable to sample teachers who were in their first year of teaching. Of the roughly 25,000 ATP members from which the sample was drawn for our survey, we did not receive any responses from teachers who were in their second year of teaching. f These numbers exclude the 18 teachers who selected “Not reported,” “Other,” or “Secondary” when asked about the grade level they teach. These teachers make up 2 percent of the sample. g We conducted this analysis based on teachers’ responses to the following survey item: “Please indicate the subject(s) you teach this school year (2020–2021)” (see Table B.2 in Appendix B).
Table A.2. Weighted Descriptive Statistics for the Survey Sample and Three Teacher Leaver Subgroups: School and Student Characteristics
School and Student Characteristics
Full Sample (%)
(N = 1,006)
Percentage of Teachers Who
Were Unlikely to Leave Before COVID-19 but Were Likely to
Leave at the Time of the Survey
(likely pandemic leavers) (n = 148)
Percentage of Teachers Who Were
Likely to Leave Before COVID-19 and Who Were
Likely to Leave at the Time of the
Survey (likely prepandemic
leavers) (n = 67)
Percentage of Teachers Who Were
Unlikely to Leave Before COVID-19 and at the Time of
the Survey (unlikely leavers)
(n = 748) School characteristics
Student population (n)
Below-median enrollment of Black students (408)c
42 38 25 44
Above-median enrollment of Black students (551)c
58 62 75 56
Below-median enrollment of Latina/o/x students (466)
48 46 41 49
Above-median enrollment of Latina/o/x students (511)
52 54 59 51
Below-median enrollment of White students (537)b
54 50 65 53
Above-median enrollment of White students (446)b
46 50 35 47
5
School and Student Characteristics
Full Sample (%)
(N = 1,006)
Percentage of Teachers Who
Were Unlikely to Leave Before COVID-19 but Were Likely to
Leave at the Time of the Survey
(likely pandemic leavers) (n = 148)
Percentage of Teachers Who Were
Likely to Leave Before COVID-19 and Who Were
Likely to Leave at the Time of the
Survey (likely prepandemic
leavers) (n = 67)
Percentage of Teachers Who Were
Unlikely to Leave Before COVID-19 and at the Time of
the Survey (unlikely leavers)
(n = 748) Below-median FRPL enrollment (541)
54 56 46 56
Above-median FRPL enrollment (444)
46 44 54 44
Urbanicity (n)
Urban (288)c 29 30 42 27
Suburban (375) 40 36 33 41
Town (111)b, c 11 15 4 10
Rural (211) 21 19 21 21
Student characteristics (n)
Less than 50% SWD (883)
88 86 87 89
More than 50% SWD (121)
12 14 13 11
Less than 50% ELL (850)
85 84 79 86
More than 50% ELL (154)
15 16 21 14
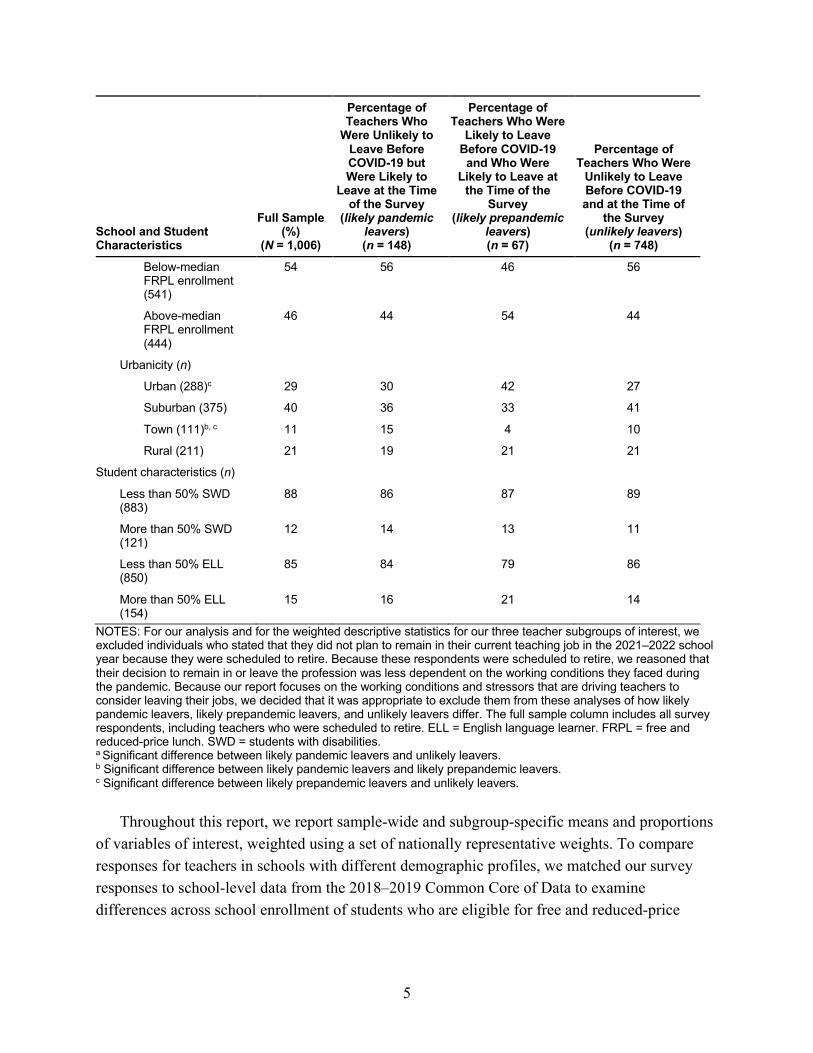
NOTES: For our analysis and for the weighted descriptive statistics for our three teacher subgroups of interest, we excluded individuals who stated that they did not plan to remain in their current teaching job in the 2021–2022 school year because they were scheduled to retire. Because these respondents were scheduled to retire, we reasoned that their decision to remain in or leave the profession was less dependent on the working conditions they faced during the pandemic. Because our report focuses on the working conditions and stressors that are driving teachers to consider leaving their jobs, we decided that it was appropriate to exclude them from these analyses of how likely pandemic leavers, likely prepandemic leavers, and unlikely leavers differ. The full sample column includes all survey respondents, including teachers who were scheduled to retire. ELL = English language learner. FRPL = free and reduced-price lunch. SWD = students with disabilities. a Significant difference between likely pandemic leavers and unlikely leavers. b Significant difference between likely pandemic leavers and likely prepandemic leavers. c Significant difference between likely prepandemic leavers and unlikely leavers.
Throughout this report, we report sample-wide and subgroup-specific means and proportions
of variables of interest, weighted using a set of nationally representative weights. To compare responses for teachers in schools with different demographic profiles, we matched our survey responses to school-level data from the 2018–2019 Common Core of Data to examine differences across school enrollment of students who are eligible for free and reduced-price

6
lunch (FRPL), school enrollment of White and non-White students, and school urbanicity (i.e., city, suburban, town, rural).
To assess whether differences between subgroups were statistically significant at the p < 0.05 level, we conducted pairwise tests, comparing two subgroups at a time (i.e., likely pandemic leavers with likely prepandemic leavers, likely pandemic leavers with unlikely leavers, and likely prepandemic leavers with unlikely leavers). Because of the exploratory nature of this study, we did not apply multiple hypothesis test corrections.
We conducted a series of supplemental regression analyses to assess whether significant differences persisted when including statistical controls for select teacher characteristics and school characteristics. Results across these specifications were substantively similar to trends present within descriptive subgroup comparisons; thus, we present only the simple weighted means and proportions in this report.
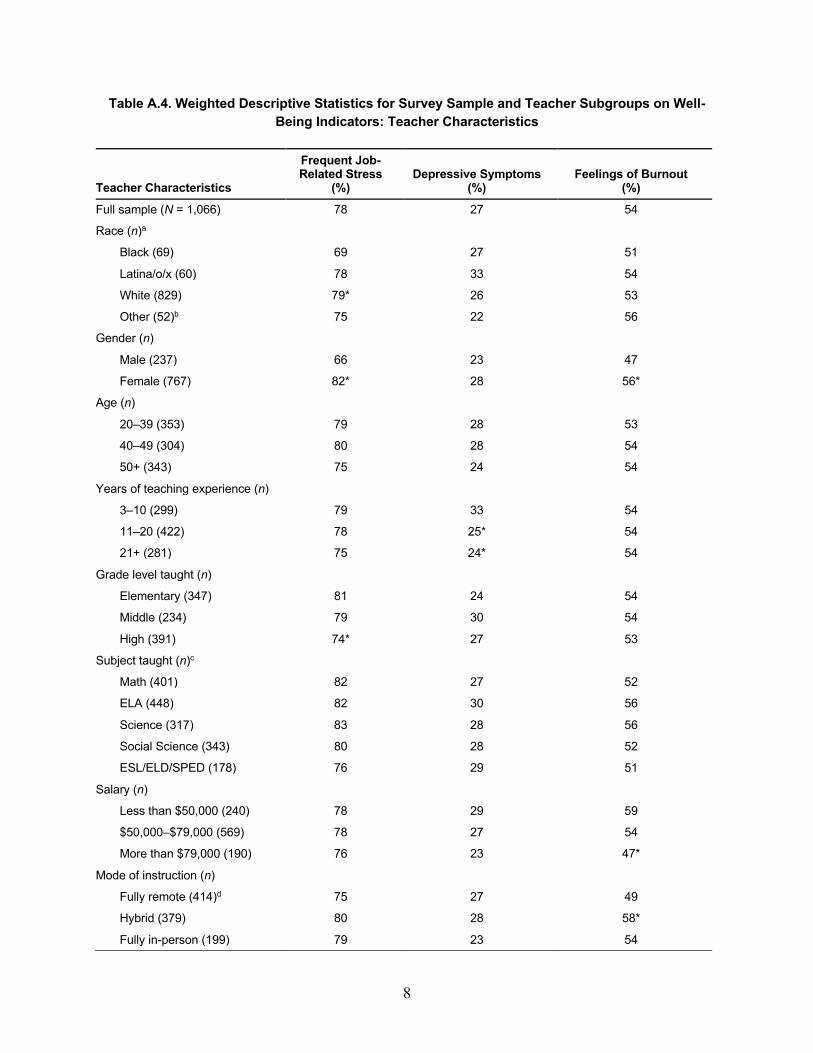
Stress, Depressive Symptoms, and Burnout, by Teacher Subgroups Table A.4 and A.5 show weighted descriptive statistics for the full survey sample and for the
three teacher subgroups regarding the following teacher well-being indicators: reports of frequent job-related stress, symptoms of depression, and feelings of burnout. In this report, we defined frequent job-related stress as responses of “often” or “always” to the question, “Since the beginning of the 2020–2021 school year, how often has your work been stressful?” (see Table B.14 in Appendix B).
We defined symptoms of depression based on responses to the PHQ-2, which asked how often over a two-week period the respondent was bothered by the following problems: little interest or pleasure in doing things; and feeling down, depressed, or hopeless (see Table B.23 in Appendix B). In accordance with the literature on using the PHQ-2, we scored responses of “not at all” as zero, “several days” as one, “more than half of the days” as two, and “nearly every day” as three. We then summed each respondent’s answers; summed responses ranged from zero to six. Following the literature, we defined symptoms of depression as a score of three or higher (Kroenke, Spitzer, and Williams, 2003).
We defined feelings of burnout according to responses to four survey items asking respondents about the extent to which they agreed or disagreed with the following four statements: “The stress and disappointments involved in teaching aren’t really worth it;” “I don’t seem to have as much enthusiasm now as I did when I began teaching;” “I look forward to teaching in the future;” and “I am glad I selected teaching as a career” (see Table B.24 in Appendix B). Responses were given on a four-point scale, from “strongly disagree” to “strongly agree.” For the first two items, we coded teachers’ responses as indicating burnout if they agreed or strongly agreed with the statements. For the second two items, we coded teachers’ responses as indicating burnout if they disagreed or strongly disagreed with the statements. We categorized

7
the respondent as experiencing feelings of burnout if two or more of their responses indicated burnout.
Finally, we defined difficulty coping with job-related stress if, in response to the question, “How well are you coping with the stress of your job right now?” teachers rated how well they were coping as “1 (not well at all)” or “2,” on a five-point scale.
As shown in Table A.3, teachers who experienced a distress indicator, such as frequent job-related stress or symptoms of depression, were significantly more likely to experience another distress indicator. For example, 8 percent of teachers who did not experience frequent job-related stress also experienced symptoms of depression, while 32 percent of teachers who experienced frequent job-related stress experienced symptoms of depression. Tables A.4 and A.5 provide weighted descriptive statistics for survey respondents on the well-being indicators.
Table A.3. Weighted Descriptive Statistics for Well-Being Indicators
Distress Indicator (n)
Frequent Job-Related Stress
(%)
Depressive Symptoms
(%)
Feelings of Burnout
(%)
Difficulty Coping with Job-Related
Stress (%)
Experiencing frequent job-related stress (778)
— 32 60 26
Not experiencing frequent job-related stress (222)
— 8* 32* 1*
Experiencing depressive symptoms (267)
94 — 74 43
Not experiencing depressive symptoms (723)
72* — 46* 12*
Experiencing burnout (538) 87 37 — 30
Not experiencing burnout (457) 67* 15* — 10*
Experiencing difficulty coping with job-related stress (205)
98 56 77 —
Not experiencing difficulty coping with job-related stress (795)
72* 19* 48* —
NOTE: The first row in each category is the reference group. * Denotes that the difference in relation to the reference group is significant at the p < 0.05 level.
8
Table A.4. Weighted Descriptive Statistics for Survey Sample and Teacher Subgroups on Well-Being Indicators: Teacher Characteristics
Teacher Characteristics
Frequent Job-Related Stress
(%) Depressive Symptoms
(%) Feelings of Burnout
(%) Full sample (N = 1,066) 78 27 54
Race (n)a
Black (69) 69 27 51
Latina/o/x (60) 78 33 54
White (829) 79* 26 53
Other (52)b 75 22 56
Gender (n)
Male (237) 66 23 47
Female (767) 82* 28 56*
Age (n)
20–39 (353) 79 28 53
40–49 (304) 80 28 54
50+ (343) 75 24 54
Years of teaching experience (n)
3–10 (299) 79 33 54
11–20 (422) 78 25* 54
21+ (281) 75 24* 54
Grade level taught (n)
Elementary (347) 81 24 54
Middle (234) 79 30 54
High (391) 74* 27 53
Subject taught (n)c
Math (401) 82 27 52
ELA (448) 82 30 56
Science (317) 83 28 56
Social Science (343) 80 28 52
ESL/ELD/SPED (178) 76 29 51
Salary (n)
Less than $50,000 (240) 78 29 59
$50,000–$79,000 (569) 78 27 54
More than $79,000 (190) 76 23 47*
Mode of instruction (n)
Fully remote (414)d 75 27 49
Hybrid (379) 80 28 58*
Fully in-person (199) 79 23 54

9
NOTES: The first row in each demographic category is the reference group. * Denotes that the difference between demographic groups in relation to the reference group is significant at the p < 0.05 level. a When conducting significance testing, the reference group for racial categories was teachers who did not fall into the specified racial category (i.e., all other races). b To create this category of “Other” teachers, we included teachers who identified as “Asian or Asian American,” “Native American or Alaska Native,” “Native Hawaiian or Pacific Islander,” “Multiracial,” and “Something else.” We excluded teachers who responded, “I prefer not to answer.” Only 33 respondents in our sample chose this response option. c We conducted this analysis based on teachers’ responses to the following survey item: “Please indicate the subject(s) you teach this school year (2020–2021)” (see Table B.2 in Appendix B). d We defined teachers as using a fully remote mode of instruction if, in response to the survey question, “Which of the following most closely reflects how you are teaching your students as of today?” they answered that they were teaching using (1) fully remote instruction, where a large majority or all of their students received at least one synchronous class each school day, or (2) fully remote instruction, where a large majority or all of their students received less than one synchronous class each school day (see Table B.29).
Table A.5. Weighted Descriptive Statistics for the Survey Sample and Teacher Subgroups on Well-Being Indicators: School and Student Characteristics
School and Student Characteristics
Frequent Job-Related Stress
(%) Depressive Symptoms
(%) Feelings of Burnout
(%) School characteristics
Student population (n)
Below-median enrollment of Black students (408)
78 29 53
Above-median enrollment of Black students (551)
76 26 55
Below-median enrollment of Latina/o/x students (466)
80 26 53
Above-median enrollment of Latina/o/x students (511)
75* 28 55
Below-median enrollment of White students (537)
75 27 52
Above-median enrollment of White students (446)
81* 27 56
Below-median FRPL enrollment (541)
82 26 54
Above-median FRPL enrollment (444)
72* 27 54
Urbanicity (n)
Urban (288) 76 23 55
Suburban (375) 77 28 53
Town (111) 75 28 53

10
School and Student Characteristics
Frequent Job-Related Stress
(%) Depressive Symptoms
(%) Feelings of Burnout
(%) Rural (211) 83 28 56
Student characteristics (n)
Less than 50% SWD (883) 78 26 54
More than 50% SWD (121) 74 32 54
Less than 50% ELL (850) 78 28 52
More than 50% ELL (154) 78 22 61* NOTES: The first row in each demographic category is the reference group. * Denotes that the difference between demographic groups in relation to the reference group is significant at the p < 0.05 level.
Qualitative Coding of Open-Ended Responses We conducted qualitative coding of select survey items that allowed for an open-ended
response. Specifically, we examined what teachers wrote in the open-ended text boxes when they selected “other” in response to the following questions:
• “Which of the following are sources of stress in your job right now?” • “Since the beginning of the 2020–2021 school year, who is the main person responsible
for your child(ren)’s care and/or learning support while you are teaching?” • “What safety measures is your school taking to reduce COVID-19 transmission during
in-person instruction this school year (2020–2021)?”
We also conducted qualitative coding of one additional survey item. In response to the question, “Do you plan to remain in your current teaching job in the 2021–2022 school year?” teachers were allowed to select the response option “unsure” and further explain their answer in a text box. For the four survey items, we reviewed all responses and, where appropriate, recoded responses into existing categories. Two researchers then performed intercoder reliability checks by reviewing the other’s coding decisions. Where responses did not fit squarely into an existing category, we allowed the response to remain coded as “other.”
Administration and Analysis of the American Life Panel Survey In addition to fielding a survey to participants in the ATP, we fielded a small set of questions
to participants in the RAND American Life Panel (ALP). The ALP, which was established in 2006, is a sample of adults in the United States who have agreed to participate in regular online surveys. The results, when weighted, are nationally representative. Respondents who do not have access to the internet at home are provided with a computer and internet access. Thus, the panel is representative of all adults in the country, not just internet users. The ALP fields surveys on a wide variety of topics, including health, employment, and financial decisionmaking. More

11
information about the sampling, recruitment, and weighting of survey respondents to the ALP is available in Pollard and Baird, 2017.
From March 8, 2021, to March 19, 2021, RAND researchers administered the ALP Omnibus Wave 8 to a sample of 3,375 probability recruited ALP members. The ALP Omnibus includes questions on multiple topics and is typically fielded three times per year. In this administration of the ALP Omnibus, 2,080 survey completions were collected, with a completion rate of 61 percent. Survey participants were given an incentive of $3 to complete the survey. The ALP Omnibus Wave 8 survey questions for this study included two main components:
1. We fielded a screener to determine the survey respondent’s job status. Job status was divided into the following three categories: a. the respondent was working at a job or business b. the respondent was not working now but had worked in the past six months c. the respondent was not working at the time of the survey and had not worked for pay
in the past six months. 2. We screened out any respondents who had not worked for pay in the past six months and
asked two questions relating to the frequency of stress relating to work and the likelihood of respondents leaving their jobs by summer 2021, compared with the likelihood of leaving their jobs before the pandemic.
The two items relating to respondents’ work stress and the likelihood of leaving their jobs were identical to items fielded in our survey to the ATP, except for minor changes in wording for both items. For example, we asked ALP members how often their work had been stressful since the beginning of the pandemic in March 2020, while we asked ATP members how often their work had been stressful since the beginning of the 2020–2021 school year. Similarly, we asked ALP members about the likelihood of leaving their jobs by summer 2021, while we asked ATP members about the likelihood of leaving their jobs by the end of the current school year.
We asked ALP members the two questions relating to work stress and the likelihood of members leaving their jobs to provide context for teachers’ reports. To allow for a better comparison between teachers’ reports and reports of the general public, we further focused our analysis of ALP survey results on the responses of members who were working at a job or business at the time of survey administration. We present these results in Appendix C.
Analysis of Data from the University of Southern California’s Understanding America Study To provide further context about teachers’ reports of their mental health status, we
investigated data sources that measured the state of the general public’s mental health status. The Understanding America Study (UAS), which is maintained by the Center for Economic and Social Research (CESR) at the University of Southern California, fielded the same PHQ-2 items

12
to their UAS panel, which is composed of U.S. adults aged 18 and older.1 Similar to the ALP and ATP, UAS sample weights are “meant to make each survey data set representative of the U.S. population with respect to a pre-defined set of socio-demographic variables” (University of Southern California Dornsife Center for Economic and Social Research, undated-b, p. 2). The UAS website provides more information about the sampling, recruitment, and weighting of survey respondents to the UAS panel (University of Southern California Dornsife Center for Economic and Social Research, undated-a).
For our analysis, we focused on UAS 280–Wave 3, which was administered from January 20, 2021, to February 16, 2021, during approximately the same time as the administration of our ATP survey. Of the 8,136 UAS panel members who were eligible for this survey, 6,231 panel members responded, with a participation rate of 77 percent. We obtained deidentified individual-level survey data according to the protocols outlined by the UAS team, which included signing a data use agreement and completing a brief proposal form describing our research.
Our analysis focused on the following two specific items that comprise the PHQ-2:
• “Over the past 14 days, how often have you been bothered by any of the following problems?”
- feeling down, depressed, or hopeless - little interest or pleasure in doing things.
The wording of this item is nearly identical to the PHQ-2 item on our survey,2 and the
response categories were also identical, allowing for an appropriate comparison between teachers and the general population of adults. We used UAS participants’ responses to these two items to calculate a score ranging from zero to six by summing each respondent’s answers, as described above. We defined depressive symptoms in the same way we did with teachers: as a score of three or higher. These results are presented in Appendix D.
Limitations
This report presents findings on pandemic-era working conditions and stressors that can be used to support teacher well-being. However, we note a few limitations. First, our sample lacked any novice teachers who were in their first or second year of teaching because of the timing of our survey administration, the timing of recruitment of new teachers for the ATP, and the fact
1 The project described in this report relies on data from survey(s) administered by the UAS, which is maintained by CESR at the University of Southern California. The content of this report is solely the responsibility of the authors and does not necessarily present the official views of University of Southern California or UAS. 2 The item, as worded in our survey, asks how often participants have been bothered by the following problems (i.e., feeling down, depressed, or hopeless; and having little interest or pleasure in doing things) “over the last two weeks,” while the UAS item asks participants how often they have been bothered by the following problems “over the past 14 days.”

13
that no second-year teachers who were invited to complete the survey actually participated. As a result, we did not capture the experiences of novice teachers in our analysis. Second, the survey data rely on the self-reports of teachers who voluntarily participated. We have no independent means of verifying the accuracy of their responses. These survey responses reflect teachers’ opinions and perceptions at a certain point in time. Some responses—such as the stated likelihood of leaving their current job—might change over time. Third, although we tested the robustness of the descriptive patterns we observed by controlling for teacher and school characteristics, we cannot account for unobserved school or classroom differences. Therefore, our findings should be interpreted as associational and not causal. Finally, our brief survey was designed to broadly address a variety of relevant working conditions and job-related stressors during the COVID-19 pandemic. We were not able to delve into detail on some topics, such as administrator support and salary, that have been shown in other research to contribute to teacher satisfaction prior to the pandemic.

14
Appendix B. ATP Survey Questions and Responses
In Tables B.1–B.63, we provide the full survey questions and responses from the ATP survey.
Teacher and Student Characteristics
Table B.1. This School Year (2020–2021), What Grade(s) Do You Teach? (n = 1,006)
Response Category Weighted Percentage
Kindergarten 12
Grade 1 14
Grade 2 13
Grade 3 13
Grade 4 13
Grade 5 14
Grade 6 15
Grade 7 17
Grade 8 17
Grade 9 25
Grade 10 29
Grade 11 31
Grade 12 30
Ungraded (including special education students ages 18–22) 1
Other 1
NOTES: All percentages are rounded to the nearest integer. Percentages will not sum to 100 because respondents were instructed to “select all that apply.”

15
Table B.2. Please Indicate the Subject(s) You Teach This School Year (2020–2021). (n = 993)
Response Category Weighted Percentage
Mathematics (including general mathematics, algebra, geometry, calculus)
41
English language arts (including English, language arts, reading, literature, writing, speech)
45
Natural science (including general science, biology, chemistry, physics) 33
Social science (including social studies, geography, history, government/civics)
35
Art and/or music 11
Health education 7
World languages 3
Computer science 3
Career or technical education 5
Special education 12
English as a second language (ESL) or English language development (ELD)
7
Physical education 5
Other 7
NOTES: All percentages are rounded to the nearest integer. Percentages will not sum to 100 because respondents were instructed to “select all that apply.”
Table B.3. Please Indicate Whether You Are a Teacher of Record for Class(es) You Teach and/or Provide Push-In/Pull-Out Services. (n = 1,005)
Response Category Weighted Percentage
I am the teacher of record for class(es) I teach (i.e., I have primary responsibility for the learning of the students in the classes I teach)
86
I provide push-in or pull-out services for individual students who need special supports, intervention, remediation, or enrichment (but am not the teacher of record)
7
I teach some classes as the teacher of record, and some where I provide push-in or pull-out services
5
None of the above 2
NOTES: All percentages are rounded to the nearest integer. Percentages may not sum to 100 percent because of rounding.

16
Table B.4. Approximately What Percentage of the Students You Teach Are English Language Learners? (n = 1,004)
Response Category Weighted Percentage
0–25% 75
26–50% 10
51–75% 4
76–100% 12
NOTES: All percentages are rounded to the nearest integer. Percentages may not sum to 100 percent because of rounding.
Table B.5. Approximately What Percentage of the Students You Teach Have an Individualized Education Program (IEP) and/or 504 Plan? (n = 1,004)
Response Category Weighted Percentage
0–25% 71
26–50% 17
51–75% 2
76–100% 10
NOTES: All percentages are rounded to the nearest integer. Percentages may not sum to 100 percent because of rounding.
Table B.6. Are You a Member of a Teachers’ Union or an Education Association? (n = 1,004)
Response Category Weighted Percentage
No 25
Yes 75
NOTES: All percentages are rounded to the nearest integer. Percentages may not sum to 100 percent because of rounding. This question was borrowed or adapted from NCES, 2017.
Table B.7. Are You a Member of the National Education Association (NEA) or One of Its State Affiliates? (n = 1,004)
Response Category Weighted Percentage
No 47
Yes 53
NOTES: All percentages are rounded to the nearest integer. Percentages may not sum to 100 percent because of rounding.

17
Table B.8. Are You a Member of the American Federation of Teachers (AFT) or One of Its State Affiliates? (n = 1,004)
Response Category Weighted Percentage
No 80
Yes 20
NOTES: All percentages are rounded to the nearest integer. Percentages may not sum to 100 percent because of rounding.
Table B.9. Are You a Member of Any Other Teachers’ Unions or Education Associations? (n = 1,003)
Response Category Weighted Percentage
No 73
Yes 27
NOTES: All percentages are rounded to the nearest integer. Percentages may not sum to 100 percent because of rounding.
Table B.10. Including This School Year (2020–2021), but Excluding Your Student Teaching, How Long Have You Worked as a Teacher? Please Exclude Any Time You Have Taken Off for Family or
Medical Leave. Please Round to the Nearest Whole Number. (n = 1,002)
Category
Weighted Percentage
Three to Ten Years 11–20 Years More Than 21 Years
Total number of years teaching 31 41 28
One to Ten Years 11–20 Years More Than 21 Years
Total number of years teaching in current school
60 30 10
NOTES: All percentages are rounded to the nearest integer. Percentages may not sum to 100 percent because of rounding.

18
Table B.11. During the Current School Year, What Is Your Base Teaching Salary for the Entire School Year? (n = 999)
Response Category Weighted Percentage
$29,999 or less —
$30–$39,999 4
$40–$49,999 20
$50–$59,999 26
$60–$69,999 19
$70–$79,999 11
$80–$89,999 7
$90–$99,999 7
$100,000 or more 5
NOTES: All percentages are rounded to the nearest integer. Percentages may not sum to 100 percent because of rounding. This question was borrowed or adapted from NCES, 2017. Dashes (—) denote that an estimate was suppressed because of an unweighted sample size that was smaller than five.
Table B.12. What Is Your Race and Ethnicity? (n = 1,000)
Response Category Weighted Percentage
Asian or Asian American 3
Black or African American 7
White 83
Latino/a/x, Hispanic, or Chicano/a/x 6
Native American or Alaska Native 1
Native Hawaiian or Pacific Islander —
Multiracial 1
Something else —
I prefer not to answer 3
NOTES: All percentages are rounded to the nearest integer. Percentages will not sum to 100 because respondents were instructed to “select all that apply.” Dashes (—) denote that an estimate was suppressed because of an unweighted sample size that was smaller than five.
Table B.13. In What Year Were You Born? (n = 1,000)
Response Category Weighted Percentage
Between 2001 and 1982 36
Between 1982 and 1972 30
Before 1971 34
NOTES: All percentages are rounded to the nearest integer. Percentages may not sum to 100 percent because of rounding.

19
Teacher Well-Being
Table B.14. Since the Beginning of the 2020–2021 School Year, How Often Has Your Work Been Stressful? (n = 1,000)
Frequency of Work Stress Weighted Percentage
Never —
Hardly ever 2
Sometimes 20
Often 50
Always 27
NOTES: All percentages are rounded to the nearest integer. Percentages may not sum to 100 percent because of rounding. Dashes (—) denote that an estimate was suppressed because of an unweighted sample size that was smaller than five. This question was borrowed or adapted from AFT and BATs, 2017.
Table B.15. How Well Are You Coping with the Stress of Your Job Right Now? (n = 1,000)
How Well Teachers Are Coping Weighted Percentage
1 (Not well at all) 4
2 16
3 46
4 27
5 (Very well) 7
NOTES: All percentages are rounded to the nearest integer. Percentages may not sum to 100 percent because of rounding. This question was borrowed or adapted from Herman, Hickmon-Rosa, and Reinke, 2018.
20
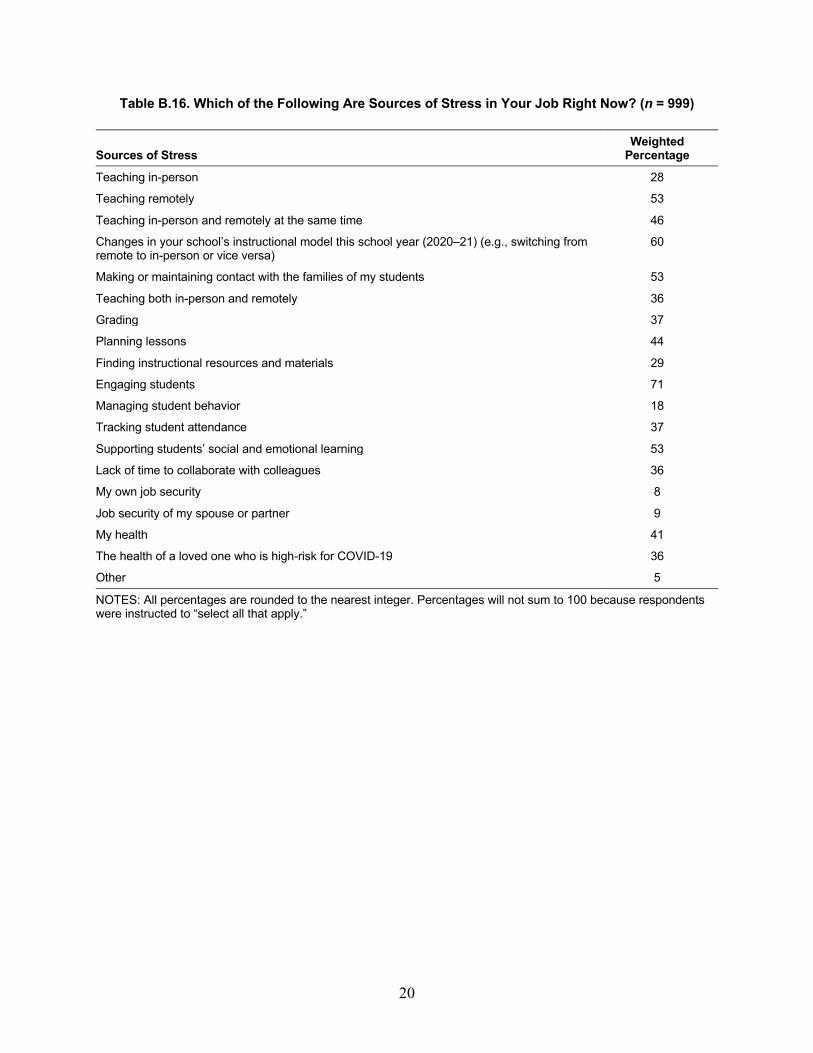
Table B.16. Which of the Following Are Sources of Stress in Your Job Right Now? (n = 999)
Sources of Stress Weighted
Percentage
Teaching in-person 28
Teaching remotely 53
Teaching in-person and remotely at the same time 46
Changes in your school’s instructional model this school year (2020–21) (e.g., switching from remote to in-person or vice versa)
60
Making or maintaining contact with the families of my students 53
Teaching both in-person and remotely 36
Grading 37
Planning lessons 44
Finding instructional resources and materials 29
Engaging students 71
Managing student behavior 18
Tracking student attendance 37
Supporting students’ social and emotional learning 53
Lack of time to collaborate with colleagues 36
My own job security 8
Job security of my spouse or partner 9
My health 41
The health of a loved one who is high-risk for COVID-19 36
Other 5
NOTES: All percentages are rounded to the nearest integer. Percentages will not sum to 100 because respondents were instructed to “select all that apply.”
21
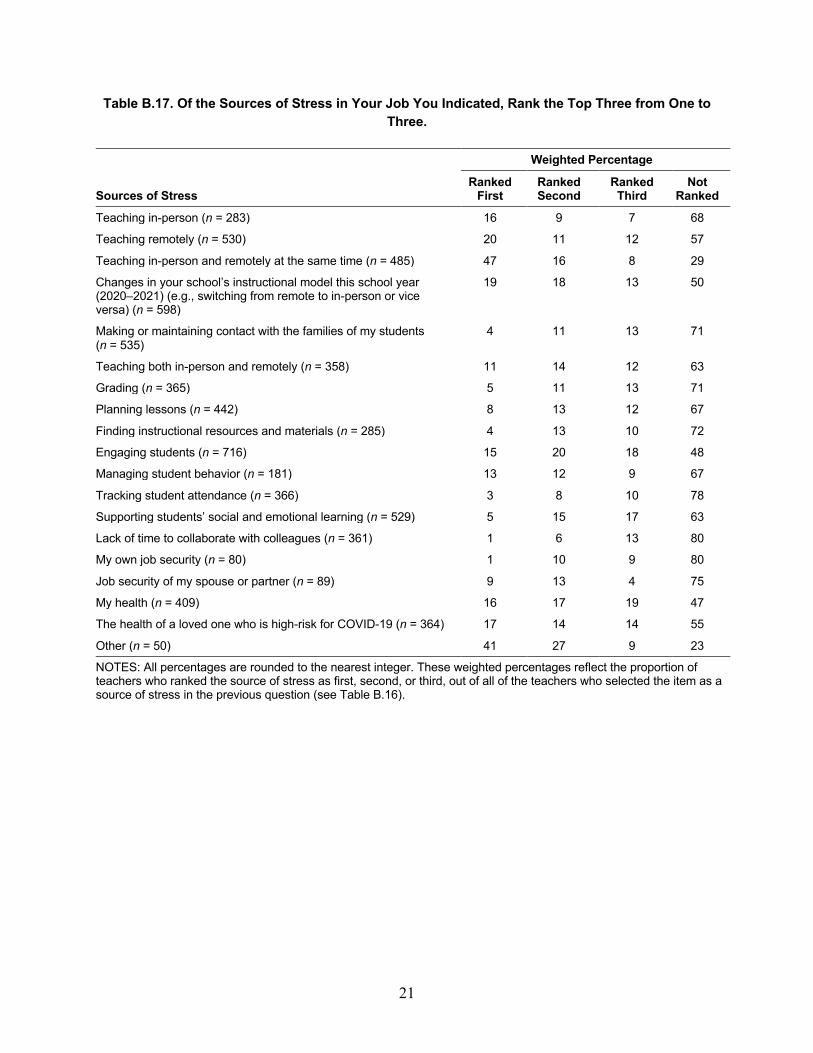
Table B.17. Of the Sources of Stress in Your Job You Indicated, Rank the Top Three from One to Three.
Weighted Percentage
Sources of Stress Ranked
First Ranked Second
Ranked Third
Not Ranked
Teaching in-person (n = 283) 16 9 7 68
Teaching remotely (n = 530) 20 11 12 57
Teaching in-person and remotely at the same time (n = 485) 47 16 8 29
Changes in your school’s instructional model this school year (2020–2021) (e.g., switching from remote to in-person or vice versa) (n = 598)
19 18 13 50
Making or maintaining contact with the families of my students (n = 535)
4 11 13 71
Teaching both in-person and remotely (n = 358) 11 14 12 63
Grading (n = 365) 5 11 13 71
Planning lessons (n = 442) 8 13 12 67
Finding instructional resources and materials (n = 285) 4 13 10 72
Engaging students (n = 716) 15 20 18 48
Managing student behavior (n = 181) 13 12 9 67
Tracking student attendance (n = 366) 3 8 10 78
Supporting students’ social and emotional learning (n = 529) 5 15 17 63
Lack of time to collaborate with colleagues (n = 361) 1 6 13 80
My own job security (n = 80) 1 10 9 80
Job security of my spouse or partner (n = 89) 9 13 4 75
My health (n = 409) 16 17 19 47
The health of a loved one who is high-risk for COVID-19 (n = 364) 17 14 14 55
Other (n = 50) 41 27 9 23
NOTES: All percentages are rounded to the nearest integer. These weighted percentages reflect the proportion of teachers who ranked the source of stress as first, second, or third, out of all of the teachers who selected the item as a source of stress in the previous question (see Table B.16).

22
Table B.18. Before COVID-19, How Many Hours Did You Sleep on Average During a 24-Hour Period on School Nights While Teaching? (n = 997)
Number of Hours Slept Before the COVID-19 Pandemic Weighted Percentage
Less than five hours 1
Five hours 2
Six hours 15
Seven hours 42
Eight hours 35
More than eight hours 5
NOTES: All percentages are rounded to the nearest integer. Teachers’ self-reported hours of sleep are rounded to the nearest integer. Percentages may not sum to 100 percent because of rounding. This question was borrowed or adapted from Diliberti, Schwartz, and Grant, 2021, and AFT and BATs, 2017.
Table B.19. During COVID-19, How Many Hours Did You Sleep on Average During a 24-Hour Period on School Nights While Teaching? (n = 997)
Number of Hours Slept During the COVID-19 Pandemic Weighted Percentage
Less than five hours 6
Five hours 18
Six hours 33
Seven hours 26
Eight hours 13
More than eight hours 3
NOTES: All percentages are rounded to the nearest integer. Teachers’ self-reported hours of sleep are rounded to the nearest integer. Percentages may not sum to 100 percent because of rounding. This question was borrowed or adapted from Diliberti, Schwartz, and Grant, 2021, and AFT and BATs, 2017.

23
Table B.20. How Many Children Do You Have Living in Your Household in the Following Age Ranges? Enter the Number of Children for Each Age Range. (n = 996)
Number of Children in Each Age Range
Weighted Percentage
One Child Two Children More Than Two
Children
Younger than one year (i.e., they have not yet had their first birthday)
5 0 0
One to three years 11 1 0
Four to five years 10 1 —
Six to eight years 13 2 —
Nine to 11 years 12 2 —
12–14 years 11 1 —
15–18 years 15 4 —
Older than 18 years 11 4 1
NOTES: Thirty-six percent of respondents responded “N/A—I do not have children currently in my household.” All percentages are rounded to the nearest integer. Respondents were instructed to enter the number of children living in their household for each age range. Dashes (—) denote that an estimate was suppressed because of an unweighted sample size that was smaller than five. N/A = not applicable.
Table B.21. Since the Beginning of the 2020–2021 School Year, Who Is the Main Person Responsible for Your Child(ren)’s Care and/or Learning Support While You Are Teaching?
(n = 635)
Main Person Responsible for Child Care Weighted Percentage
Me 32
My spouse or partner 17
Another member of my household who is not my spouse or partner or another child (e.g., an au pair or relative who lives with me)
1
Another relative who is not a member of my household 7
A nonrelative who is not a member of my household (e.g., friend, neighbor, sitter, nanny) 3
N/A—My child(ren) do not need support or care for a majority of the time I’m teaching 22
N/A—My child(ren) are attending school, a learning pod, or daycare in-person for a majority of the time I am teaching
16
Other 2
NOTES: All percentages are rounded to the nearest integer. Percentages may not sum to 100 percent because of rounding. This question was asked only of teachers who reported that they had children in their household in the previous question (Table B.20). This question was borrowed or adapted from a RAND COVID-19 employment survey. Survey reports and documentation are forthcoming.
24
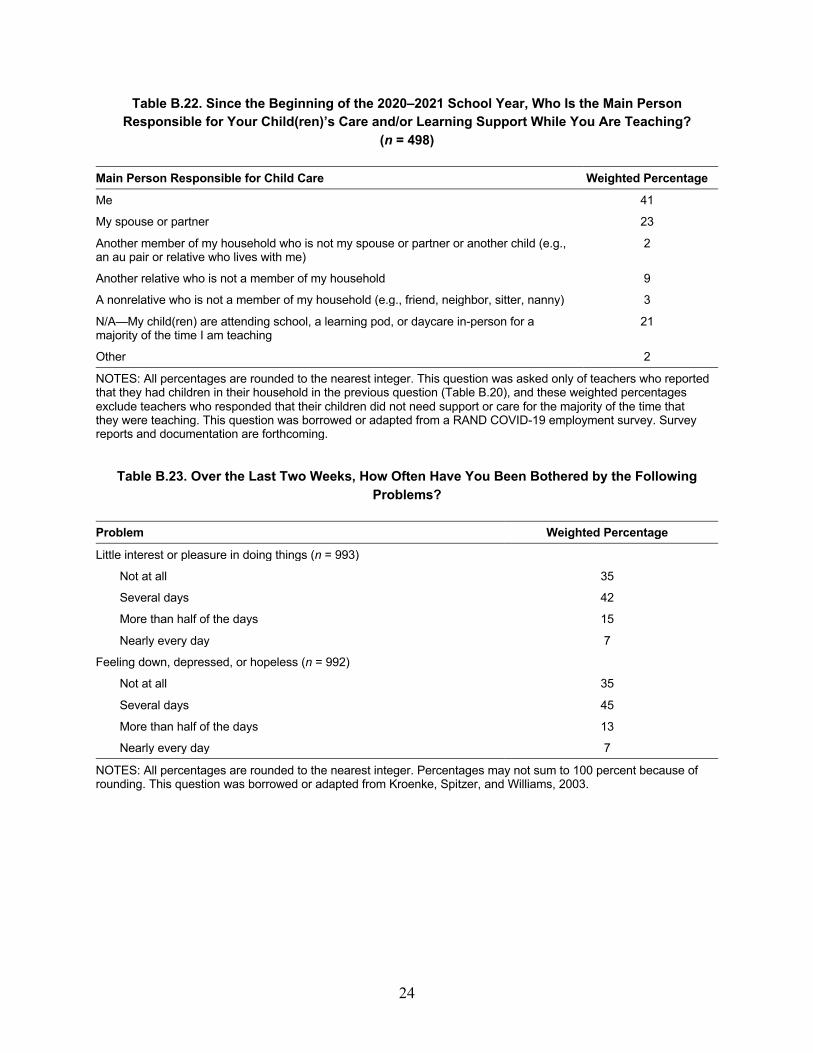
Table B.22. Since the Beginning of the 2020–2021 School Year, Who Is the Main Person Responsible for Your Child(ren)’s Care and/or Learning Support While You Are Teaching?
(n = 498)
Main Person Responsible for Child Care Weighted Percentage
Me 41
My spouse or partner 23
Another member of my household who is not my spouse or partner or another child (e.g., an au pair or relative who lives with me)
2
Another relative who is not a member of my household 9
A nonrelative who is not a member of my household (e.g., friend, neighbor, sitter, nanny) 3
N/A—My child(ren) are attending school, a learning pod, or daycare in-person for a majority of the time I am teaching
21
Other 2
NOTES: All percentages are rounded to the nearest integer. This question was asked only of teachers who reported that they had children in their household in the previous question (Table B.20), and these weighted percentages exclude teachers who responded that their children did not need support or care for the majority of the time that they were teaching. This question was borrowed or adapted from a RAND COVID-19 employment survey. Survey reports and documentation are forthcoming.
Table B.23. Over the Last Two Weeks, How Often Have You Been Bothered by the Following Problems?
Problem Weighted Percentage
Little interest or pleasure in doing things (n = 993)
Not at all 35
Several days 42
More than half of the days 15
Nearly every day 7
Feeling down, depressed, or hopeless (n = 992)
Not at all 35
Several days 45
More than half of the days 13
Nearly every day 7
NOTES: All percentages are rounded to the nearest integer. Percentages may not sum to 100 percent because of rounding. This question was borrowed or adapted from Kroenke, Spitzer, and Williams, 2003.

25
Table B.24. Please Indicate Your Agreement or Disagreement with the Following Statements About Teaching. (n = 995)
Statement Weighted Percentage
The stress and disappointments involved in teaching aren’t really worth it.
Strongly disagree 21
Somewhat disagree 30
Somewhat agree 40
Strongly agree 10
I don’t seem to have as much enthusiasm now as I did when I began teaching.
Strongly disagree 11
Somewhat disagree 18
Somewhat agree 43
Strongly agree 28
I look forward to teaching in the future.
Strongly disagree 10
Somewhat disagree 24
Somewhat agree 45
Strongly agree 22
I am glad I selected teaching as a career.
Strongly disagree 6
Somewhat disagree 18
Somewhat agree 40
Strongly agree 35
NOTES: All percentages are rounded to the nearest integer. Percentages may not sum to 100 percent because of rounding. This question was borrowed or adapted from NCES, 2017, and Seidman and Zager, 1987.

26
Table B.25. Please Indicate Your Agreement or Disagreement with Each of the Following Statements About Your School. (n = 995)
Statement Weighted Percentage
If I had concerns about my school, I would feel comfortable raising them with administrators at the school.
Strongly disagree 12
Disagree 22
Agree 42
Strongly agree 24
Administrators at my school are highly supportive of teachers.
Strongly disagree 7
Disagree 18
Agree 47
Strongly agree 28
NOTES: All percentages are rounded to the nearest integer. Percentages may not sum to 100 percent because of rounding. This question was borrowed or adapted from the University of Chicago Consortium on School Research, 2017.
Respondents’ Teaching Experience During COVID-19
Table B.26. Have You Provided Remote Instruction to Any of Your Students This School Year (2020–2021)? (n = 995)
Remote Teaching Weighted Percentage
No 4
Yes 96
NOTES: All percentages are rounded to the nearest integer. Percentages may not sum to 100 percent because of rounding.
Table B.27. Since This School Year (2020–2021) Started, Has Your School Changed Instructional Models (e.g., from remote instruction to in-person or vice versa) Because of Concerns About
COVID-19 Transmission? (n = 994)
School Changed Instructional Model Weighted Percentage
No 22
Yes 78
NOTES: All percentages are rounded to the nearest integer. Percentages may not sum to 100 percent because of rounding. This question was borrowed or adapted from Kaufman et al., 2020.

27
Table B.28. How Many Times Has Your School Changed the Way You Teach Most of Your Students This School Year (2020–2021) (e.g., switched from hybrid instruction to fully remote
instruction)? (n = 773)
Number of Times School Changed Instructional Model Weighted Percentage
One 28
Two 25
Three 25
Four 12
Five 2
More than five 7
NOTES: All percentages are rounded to the nearest integer. Percentages may not sum to 100 percent because of rounding. This question was asked only of respondents who reported that their schools changed instructional models because of concerns about COVID-19 transmission in the previous question (Table B.27).
Table B.29. Which of the Following Most Closely Reflects How You Are Teaching Your Students as of Today? (n = 992)
Current Instructional Model Weighted
Percentage
Fully remote instruction, where a large majority or all of your students received at least one synchronous class each school day
37
Fully remote instruction, where a large majority or all of your students received less than one synchronous class each school day (i.e., instruction might be distributed via paper workbooks or asynchronous videos)
5
Hybrid model, where a majority or all of your students receive some in-person instruction and some remote instruction
38
Fully in-person instruction each school day for the majority, if not all, of your students 20
NOTES: All percentages are rounded to the nearest integer. Percentages may not sum to 100 percent because of rounding. This question was borrowed or adapted from Kaufman et al., 2020.

28
Table B.30. You Indicated That, as of Today, You Are Teaching Your Students Using a Hybrid Model. Please Indicate Whether You Are Using Any of the Following Approaches. (n = 378)
Type of Hybrid Model Weighted
Percentage
In-person instruction for students with specialized needs (e.g., English-language learners, homeless students, students with learning disabilities, students without internet access or a device at home)
34
In-person instruction for core subjects only (i.e., math, English, science, social studies) 14
In-person instruction for elementary students only; remote instruction for middle and high school students
5
Split schedule, with some students attending in-person instruction in the morning and others attending in the afternoon
5
Split schedule, with students attending in-person instruction on alternate days during the school week
51
Split schedule, with students attending in-person instruction on alternate weeks 1
Schedule where I have to teach students in-person and remotely at the same time 58
Other 11
NOTES: All percentages are rounded to the nearest integer. This question was presented only to respondents who stated that they were teaching their students using a hybrid model in the previous survey item (see Table B.29). Percentages will not sum to 100 because respondents were instructed to “select all that apply.” This question was borrowed or adapted from Kaufman et al., 2020.
Table B.31. What of the Following Most Closely Reflects How You Would Like to Teach Your Students Today? (n = 991)
Preferred Instructional Model Weighted
Percentage
Fully remote instruction, where a large majority or all of your students received at least one synchronous class each school day
35
Fully remote instruction, where a large majority or all of your students received less than one synchronous class each school day (i.e., instruction might be distributed via paper workbooks or asynchronous videos)
5
Hybrid model, where a majority or all of your students receive some in-person instruction and some remote instruction
16
Fully in-person instruction each school day for the majority, if not all, of your students 43
NOTES: All percentages are rounded to the nearest integer. Percentages may not sum to 100 percent because of rounding. This question was borrowed or adapted from Kaufman et al., 2020.

29
Table B.32. What Is the Likelihood That You Will Leave Your Job by the End of the Current School Year (2020–2021), Compared to the Likelihood That You Would Have Left Your Job Before
COVID-19? (full sample; n = 991)
Likelihood of Leaving Job Weighted Percentage
Likely to leave before COVID-19, but unlikely now 1
Unlikely to leave before, but likely now 15
Likely to leave both before and now 8
Unlikely to leave both before and now 76
NOTES: All percentages are rounded to the nearest integer. Percentages may not sum to 100 percent because of rounding. This question was borrowed or adapted from Kaufman et al., 2020.
Table B.33. What Is the Likelihood That You Will Leave Your Job by the End of the Current School Year (2020–2021), Compared to the Likelihood That You Would Have Left Your Job Before
COVID-19? (excluding teachers who are scheduled to retire; n = 978)
Likelihood of Leaving Job Weighted Percentage
Likely to leave before COVID-19, but unlikely now 1
Unlikely to leave before, but likely now 15
Likely to leave both before and now 7
Unlikely to leave both before and now 77
NOTES: All percentages are rounded to the nearest integer. Percentages may not sum to 100 percent because of rounding. These weighted percentages exclude teachers who stated that they were not planning to remain in their current teaching job in the 2021–2022 school year because they were scheduled to retire.
Table B.34. Do You Plan to Remain in Your Current Teaching Job in the 2021–2022 School Year? (n = 991)
Plans to Remain in Current Teaching Job Weighted Percentage
No 6
Yes 81
Unsure 13
NOTES: All percentages are rounded to the nearest integer. Percentages may not sum to 100 percent because of rounding. This question was borrowed or adapted from Diliberti, Schwartz, and Grant, 2021.

30
Table B.35. What Are Your Plans After You Leave Your Current Teaching Job in the 2021–2022 School Year? (n = 60)
Plans After Leaving Current Teaching Job Weighted Percentage
I am taking early retirement 12
I am scheduled to retire 22
I am taking a new teaching job at a different school 20
I am taking a nonteaching job in the education field —
I am taking a job outside the education field 12
Caring for children or other family members —
I don’t know 11
Other 12
NOTES: All percentages are rounded to the nearest integer. Percentages may not sum to 100 percent because of rounding. This question was asked only of respondents who stated that they were not planning to remain in their current teaching job in the 2021–2022 school year in the previous question (Table B.34). Dashes (—) denote that an estimate was suppressed because of an unweighted sample size that was smaller than five.
Table B.36. How Concerned Are You That Your School District Will Furlough or Lay Off Teachers Within the Next Year? (n = 991)
Level of Concern Weighted Percentage
Not at all concerned 44
A little concerned 38
Moderately concerned 11
Very concerned 7
NOTES: All percentages are rounded to the nearest integer. Percentages may not sum to 100 percent because of rounding.
Table B.37. How Concerned Are You That Your School District Will Furlough or Lay Off Other School Staff (e.g., paraprofessionals, librarians, bus drivers, school nurses) Within the Next Year?
(n = 991)
Level of Concern Weighted Percentage
Not at all concerned 28
A little concerned 44
Moderately concerned 17
Very concerned 11
NOTES: All percentages are rounded to the nearest integer. Percentages may not sum to 100 percent because of rounding.
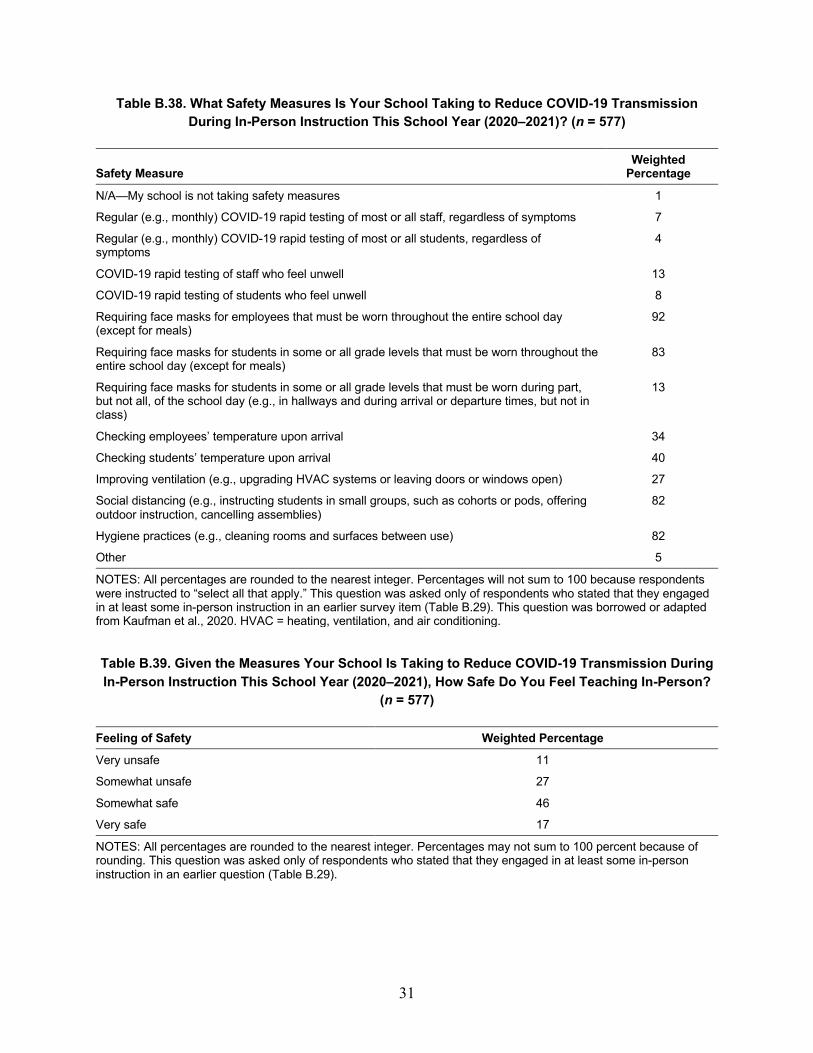
31
Table B.38. What Safety Measures Is Your School Taking to Reduce COVID-19 Transmission During In-Person Instruction This School Year (2020–2021)? (n = 577)
Safety Measure Weighted
Percentage
N/A—My school is not taking safety measures 1
Regular (e.g., monthly) COVID-19 rapid testing of most or all staff, regardless of symptoms 7
Regular (e.g., monthly) COVID-19 rapid testing of most or all students, regardless of symptoms
4
COVID-19 rapid testing of staff who feel unwell 13
COVID-19 rapid testing of students who feel unwell 8
Requiring face masks for employees that must be worn throughout the entire school day (except for meals)
92
Requiring face masks for students in some or all grade levels that must be worn throughout the entire school day (except for meals)
83
Requiring face masks for students in some or all grade levels that must be worn during part, but not all, of the school day (e.g., in hallways and during arrival or departure times, but not in class)
13
Checking employees’ temperature upon arrival 34
Checking students’ temperature upon arrival 40
Improving ventilation (e.g., upgrading HVAC systems or leaving doors or windows open) 27
Social distancing (e.g., instructing students in small groups, such as cohorts or pods, offering outdoor instruction, cancelling assemblies)
82
Hygiene practices (e.g., cleaning rooms and surfaces between use) 82
Other 5
NOTES: All percentages are rounded to the nearest integer. Percentages will not sum to 100 because respondents were instructed to “select all that apply.” This question was asked only of respondents who stated that they engaged in at least some in-person instruction in an earlier survey item (Table B.29). This question was borrowed or adapted from Kaufman et al., 2020. HVAC = heating, ventilation, and air conditioning.
Table B.39. Given the Measures Your School Is Taking to Reduce COVID-19 Transmission During In-Person Instruction This School Year (2020–2021), How Safe Do You Feel Teaching In-Person?
(n = 577)
Feeling of Safety Weighted Percentage
Very unsafe 11
Somewhat unsafe 27
Somewhat safe 46
Very safe 17
NOTES: All percentages are rounded to the nearest integer. Percentages may not sum to 100 percent because of rounding. This question was asked only of respondents who stated that they engaged in at least some in-person instruction in an earlier question (Table B.29).

32
Table B.40. How Important Do You Consider Each of the Following for Making In-Person Teaching Safer?
Statement Weighted Percentage
My school implemented regular COVID-19 rapid testing of students (n = 991)
Not at all important 14
A little important 20
Moderately important 25
Very important 41
My school implemented regular COVID-19 rapid testing of staff (n = 989)
Not at all important 13
A little important 17
Moderately important 25
Very important 45
Most or all students received a COVID-19 vaccine (n = 990)
Not at all important 14
A little important 15
Moderately important 21
Very important 50
Most or all staff received a COVID-19 vaccine (n = 990)
Not at all important 11
A little important 9
Moderately important 14
Very important 66
I received a COVID-19 vaccine (n = 988)
Not at all important 13
A little important 7
Moderately important 11
Very important 68
NOTES: All percentages are rounded to the nearest integer. Percentages may not sum to 100 percent because of rounding.
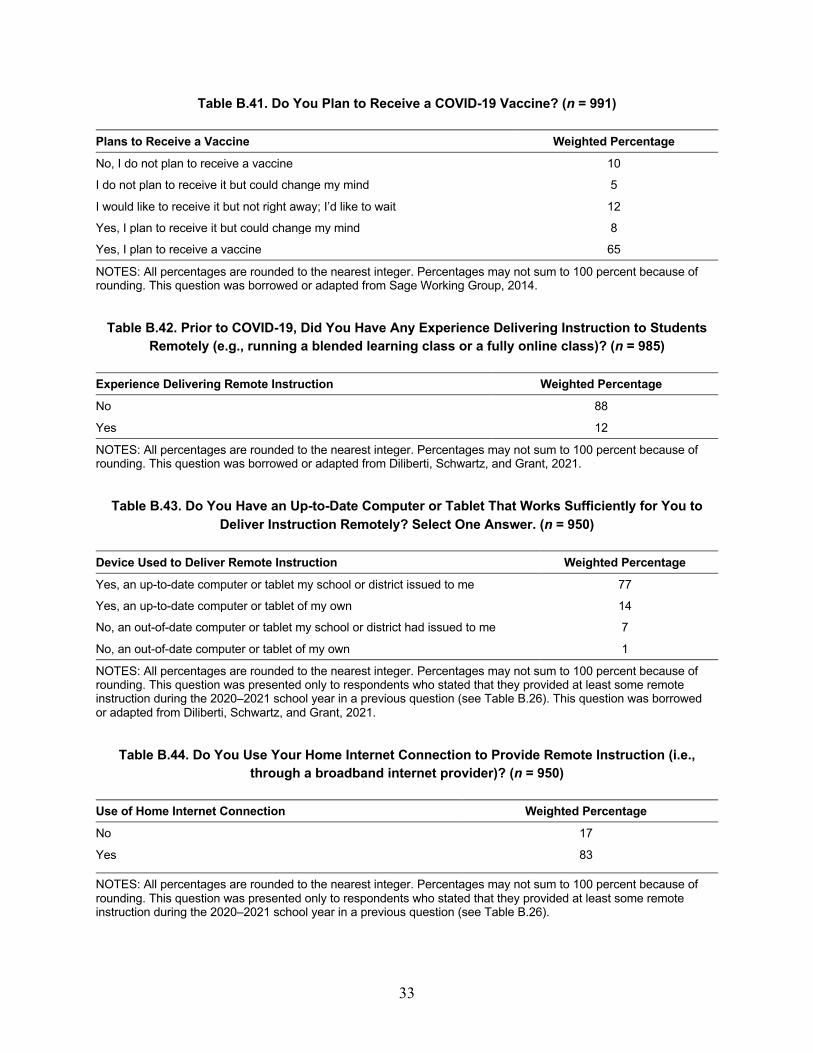
33
Table B.41. Do You Plan to Receive a COVID-19 Vaccine? (n = 991)
Plans to Receive a Vaccine Weighted Percentage
No, I do not plan to receive a vaccine 10
I do not plan to receive it but could change my mind 5
I would like to receive it but not right away; I’d like to wait 12
Yes, I plan to receive it but could change my mind 8
Yes, I plan to receive a vaccine 65
NOTES: All percentages are rounded to the nearest integer. Percentages may not sum to 100 percent because of rounding. This question was borrowed or adapted from Sage Working Group, 2014.
Table B.42. Prior to COVID-19, Did You Have Any Experience Delivering Instruction to Students Remotely (e.g., running a blended learning class or a fully online class)? (n = 985)
Experience Delivering Remote Instruction Weighted Percentage
No 88
Yes 12
NOTES: All percentages are rounded to the nearest integer. Percentages may not sum to 100 percent because of rounding. This question was borrowed or adapted from Diliberti, Schwartz, and Grant, 2021.
Table B.43. Do You Have an Up-to-Date Computer or Tablet That Works Sufficiently for You to Deliver Instruction Remotely? Select One Answer. (n = 950)
Device Used to Deliver Remote Instruction Weighted Percentage
Yes, an up-to-date computer or tablet my school or district issued to me 77
Yes, an up-to-date computer or tablet of my own 14
No, an out-of-date computer or tablet my school or district had issued to me 7
No, an out-of-date computer or tablet of my own 1
NOTES: All percentages are rounded to the nearest integer. Percentages may not sum to 100 percent because of rounding. This question was presented only to respondents who stated that they provided at least some remote instruction during the 2020–2021 school year in a previous question (see Table B.26). This question was borrowed or adapted from Diliberti, Schwartz, and Grant, 2021.
Table B.44. Do You Use Your Home Internet Connection to Provide Remote Instruction (i.e., through a broadband internet provider)? (n = 950)
Use of Home Internet Connection Weighted Percentage
No 17
Yes 83
NOTES: All percentages are rounded to the nearest integer. Percentages may not sum to 100 percent because of rounding. This question was presented only to respondents who stated that they provided at least some remote instruction during the 2020–2021 school year in a previous question (see Table B.26).

34
Table B.45. How Frequently Is Your Home Internet Connection the Source of Technical Problems When You Are Providing Remote Instruction? (n = 782)
Frequency of Technical Problems with Home Internet Connection Weighted Percentage
Multiple times per day 6
About once per day 8
Two to four times per week 10
About once per week 15
Less than once per week 36
Never 26
NOTES: All percentages are rounded to the nearest integer. Percentages may not sum to 100 percent because of rounding. This question was presented only to respondents who stated that they used their home internet connection to provide remote instruction in the previous question (see Table B.44).
Table B.46. Who Covers the Cost of the Home Internet Connection You Use to Provide Remote Instruction? (n = 782)
Responsibility for the Cost of Home Internet Connection Weighted Percentage
Me 98
My school or district 1
Other 1
NOTES: All percentages are rounded to the nearest integer. Percentages may not sum to 100 percent because of rounding. This question was presented only to respondents who stated that they used their home internet connection to provide remote instruction in a previous question (see Table B.44).
Table B.47. After a Month Into Remote Teaching This School Year (2020–2021), How Frequently—on Average—Did You Personally Experience Technical Problems Related to the Technology You
Used for Remote Instruction? (n = 950)
Frequency of Technical Problems Weighted Percentage
Daily 11
Several days per week 20
One day per week 21
Less than one day per week 35
N/A—I did not personally experience technical problems 13
NOTES: All percentages are rounded to the nearest integer. Percentages may not sum to 100 percent because of rounding. This question was presented only to respondents who stated that they provided at least some remote instruction during the 2020–2021 school year in a previous question (see Table B.26). This question was borrowed or adapted from Diliberti, Schwartz, and Grant, 2021.

35
Table B.48. After a Month Into Remote Teaching This School Year (2020–2021), How Frequently—on Average—Did Your Typical Student Experience Technical Problems Related to the Technology
They Used for Remote Instruction? (n = 949)
Frequency of Technical Problems Weighted Percentage
Daily 27
Several days per week 36
One day per week 20
Less than one day per week 13
N/A—I did not personally experience technical problems 1
N/A—My students did not use technology for remote instruction 1
NOTES: All percentages are rounded to the nearest integer. Percentages may not sum to 100 percent because of rounding. This question was presented only to respondents who stated that they provided at least some remote instruction during the 2020–2021 school year in a previous question (see Table B.26). This question was borrowed or adapted from Diliberti, Schwartz, and Grant, 2021.
Table B.49. How Much Do You Agree with the Following Statements? Select One Answer per Item.
Statement Weighted Percentage
My school or district has provided me with adequate training in how to deliver instruction remotely. (n = 949)
Strongly disagree 19
Somewhat disagree 27
Somewhat agree 45
Strongly agree 9
I am able to deliver remote instruction that meets my students’ learning needs. (n = 949)
Strongly disagree 7
Somewhat disagree 21
Somewhat agree 54
Strongly agree 18
If the equipment I need to teach remotely isn’t working, I can get it repaired or replaced quickly. (n = 948)
Strongly disagree 15
Somewhat disagree 24
Somewhat agree 41
Strongly agree 20
NOTES: All percentages are rounded to the nearest integer. Percentages may not sum to 100 percent because of rounding. This question was presented only to respondents who stated that they provided at least some remote instruction during the 2020–2021 school year in a previous question (see Table B.26). This question was borrowed or adapted from Diliberti, Schwartz, and Grant, 2021.

36
Table B.50. Approximately What Percentage of the Students Who Are Assigned to Your Classes Have You Not Been Able to Contact at Least Once This Year (2020–2021 school year)? (n = 990)
Percentage of Students Teacher Has Not Been Able to Contact Weighted Percentage
0 45
1–25 46
26–50 5
51–75 1
76–100 3
NOTES: All percentages are rounded to the nearest integer. Percentages may not sum to 100 percent because of rounding. This question was borrowed or adapted from Kaufman et al., 2020.
Table B.51. Approximately What Percentage of the Families of Students Who Are Assigned to Your Classes Have You Not Been Able to Contact at Least Once This Year (2020–2021 school
year)? (n = 989)
Percentage of Families of Students the Teacher Has Not Been Able to Contact Weighted Percentage
0 37
1–25 54
26–50 6
51–75 2
76–100 2
NOTES: All percentages are rounded to the nearest integer. Percentages may not sum to 100 percent because of rounding. This question was borrowed or adapted from Kaufman et al., 2020.
Table B.52. Approximately What Percentage of Your Students Have Been Present (remote or in-person) on a Typical School Day This Year (2020–2021)? (n = 989)
Percentage of Students Present on a Typical School Day Weighted Percentage
0 —
1–25 4
26–50 6
51–75 16
76–100 74
NOTES: All percentages are rounded to the nearest integer. Percentages may not sum to 100 percent because of rounding. Dashes (—) denote that an estimate was suppressed because of an unweighted sample size that was smaller than five.

37
Table B.53. Approximately What Percentage of Your Students Have Completed a Majority of Your Assignments This Year (2020–2021)? (n = 989)
Percentage of Students Completing a Majority of Assignments Weighted Percentage
0 —
1–25 5
26–50 15
51–75 32
76–100 48
NOTES: All percentages are rounded to the nearest integer. Percentages may not sum to 100 percent because of rounding. This question was borrowed or adapted from Kaufman et al., 2020. Dashes (—) denote that an estimate was suppressed because of an unweighted sample size that was smaller than five.
Table B.54. During a Typical Full Week This School Year (2020–2021), Approximately How Many Hours Do You Work as Part of Your Teaching Position at Your School, in Total, Excluding any
Work You Do Outside Your Teaching Position? (n = 988)
Hours Spent Working During COVID-19 Weighted Percentage
Fewer than 40 hours 25
40–49 hours 35
50–59 hours 24
60 hours or more 16
NOTES: All percentages are rounded to the nearest integer. Teachers’ self-reported hours of work were rounded to the nearest integer. Percentages may not sum to 100 percent because of rounding. This question was borrowed or adapted from Kaufman et al., 2020.
Table B.55. During a Typical Full Week This School Year (2020–2021), Approximately How Many Hours Do You Spend Teaching (i.e., providing instruction to students, excluding planning,
professional development, or assessing student work) at Your School, Excluding any Work You Do Outside Your Teaching Position? (n = 986)
Hours Spent Teaching During COVID-19 Weighted Percentage
Fewer than ten hours 20
Ten to 19 hours 12
20–29 hours 23
30–39 hours 28
40 hours or more 16
NOTES: All percentages are rounded to the nearest integer. Teachers’ self-reported hours of teaching were rounded to the nearest integer. Percentages may not sum to 100 percent because of rounding.

38
Table B.56. During a Typical Full Week Before COVID-19, Approximately How Many Hours Did You Work as Part of Your Teaching Position at Your School, in Total, Excluding Any Work You Did
Outside Your Teaching Position? (n = 983)
Hours Spent Working Before COVID-19 Weighted Percentage
Fewer than 40 hours 27
40–49 hours 53
50–59 hours 16
60 hours or more 5
NOTES: All percentages are rounded to the nearest integer. Teachers’ self-reported hours of work are rounded to the nearest integer. Percentages may not sum to 100 percent because of rounding. This question was borrowed or adapted from Kaufman et al., 2020.
Table B.57. During a Typical Full Week Before COVID-19, Approximately How Many Hours Did You Spend Teaching (i.e., providing instruction to students, excluding planning, professional
development, or assessing student work) at Your School, Excluding Any Work You Did Outside Your Teaching Position? (n = 983)
Hours Spent Teaching Before COVID-19 Weighted Percentage
Fewer than ten hours 20
Ten to 19 hours 12
20–29 hours 23
30–39 hours 28
40 hours or more 16
NOTES: All percentages are rounded to the nearest integer. Teachers’ self-reported hours of teaching are rounded to the nearest integer. Percentages may not sum to 100 percent because of rounding.
Table B.58. In a Typical Day of Teaching During the Current School Year (2020–2021), How Many Hours Do You Spend on the Following Activities?
Hours Spent on Activities Weighted Average (hours)
Checking and providing feedback on student work (n = 975) 2.6
Planning lessons (n = 982) 2.5
Searching for instructional materials or activities (n = 979) 1.7
Modifying district- or school-provided curriculum materials for your instruction (n = 980)
1.4
Providing extra assistance (i.e., outside class time) to students (n = 979) 1.8
NOTES: Teachers were instructed to self-report the number of hours that they spent on each of the activities.

39
Table B.59. This School Year, in What Subject Is Your MAIN Teaching Assignment at THIS School, That Is, the Subject Matter in Which You Teach the Most Classes? (n = 994)
Main Teaching Assignment Weighted Percentage
Early childhood or general elementary 19
Special education 10
Arts or music 7
English and language arts 18
ESL or bilingual education 2
Foreign languages 2
Health education 2
Mathematics 13
Natural sciences 9
Social sciences 9
Career or technical education 4
Other 6
NOTES: All percentages are rounded to the nearest integer. Percentages may not sum to 100 percent because of rounding. ESL = English as a second language.
Table B.60. During This School Year (2020–2021), Have You Earned Additional Compensation from Working in Any Jobs Other Than Your Public-School Teaching Position? (n = 983)
Response Weighted Percentage
No 78
Yes 22
NOTES: All percentages are rounded to the nearest integer. Percentages may not sum to 100 percent because of rounding.

40
Table B.61. Which of the Following Responses Best Describes the Other Job(s) You Have Held This School Year (2020–2021)? (n = 217)
Other Jobs Held Weighted Percentage
Private tutoring (including learning pods) 20
Teaching position in another school or district 10
Nonteaching job within my school or district 18
Nonteaching job related to education in another school, district, or education organization
7
Nonteaching job that is not related to education (e.g., bartending, cashiering, consulting)
41
Other 21
NOTES: All percentages are rounded to the nearest integer. This question was presented only to respondents who stated that they earned additional compensation from working in any jobs other than their public-school teaching position in the previous question (see Table B.60). Percentages will not sum to 100 because respondents were instructed to “select all that apply.”
Table B.62. In Total, How Much Were You Paid for All the Work You Performed Outside Your Public-School Teaching Position so Far This School Year (2020–2021)? (n = 217)
Amount Paid for Other Job Weighted Percentage
Less than $2,500 41
$2,500–$4,999 24
$5,000–$9,999 21
$10,000–$19,999 7
$20,000–$29,999 5
$30,000 or more 2
NOTES: All percentages are rounded to the nearest integer. Percentages may not sum to 100 percent because of rounding. This question was presented only to respondents who stated that they earned additional compensation from working in any jobs other than their public-school teaching position in an earlier question (see Table B.60).
Table B.63. During a Typical Full Week This School Year (2020–2021), Approximately How Many Hours Do You Work in Other Jobs Outside Your Public-School Teaching Position? (n = 217)
Hours Worked in Other Jobs Weighted Percentage
One to five hours 52
Six to ten hours 24
11–15 hours 10
More than 15 hours 14
NOTES: All percentages are rounded to the nearest integer. Percentages may not sum to 100 percent because of rounding. This question was presented only to respondents who stated that they earned additional compensation from working in any jobs other than their public-school teaching position in an earlier question (see Table B.60).

41
The following tables (B.64 through B.68) represent cross-tabulations between the four teacher distress indicators and various working conditions hypothesized to be stressors. These results are also represented in Figure 4 in the main report, Job-Related Stress Threatens the Teacher Supply: Key Findings from the 2021 State of the U.S. Teacher Survey.
Table B.64. Cross-Tabulations Between Mode of Instruction and Teacher Distress Indicators
Weighted Percentage
Mode of Instruction Frequent Job-Related Stress
Symptoms of Depression
Difficulty Coping with Job-Related Stress
Feelings of Burnout
Lack of match between actual and preferred mode of instruction (n = 536)
80 30 23 57
Match between actual and preferred mode of instruction (n = 455)
75* 23* 18 50*
Number of changes in instructional model (one or two times) (n = 410)
76 23 18 48
Number of changes in instructional model (three or more times) (n = 363)
83* 31* 25* 62*
Provided instruction through a fully remote model (n = 414)
75 27 19 49
Provided instruction through a hybrid model (n = 379)
80 28 22 58*
Provided instruction through an in-person model (n = 199)
79 23 22 54
NOTES: All percentages are rounded to the nearest integer. The first row in each working condition category is the reference group. * Denotes that the difference between groups of teachers in relation to the reference group is significant at the p < 0.05 level.

42
Table B.65. Cross-Tabulations Between Administrator and School Support and Teacher Distress Indicators
Weighted Percentage
Administrator and School Support
Frequent Job-Related Stress
Symptoms of Depression
Difficulty Coping with Job-Related
Stress Feelings of
Burnout
Disagreed with the statement, “administrators at my school are highly supportive of teachers.” (n = 254)
88 35 30 68
Agreed with the statement, “administrators at my school are highly supportive of teachers.” (n = 741)
74* 24* 17* 49*
Disagreed with the statement, “my school or district has provided me with adequate training in how to deliver instruction remotely.” (n = 438)
84 34 27 58
Agreed with the statement, “my school or district has provided me with adequate training in how to deliver instruction remotely.” (n = 511)
72* 21* 15* 50*
Disagreed with the statement, “If the equipment I need to teach remotely isn’t working, I can get it repaired or replaced quickly.” (n = 374)
85 32 28 63
Agreed with the statement, “If the equipment I need to teach remotely isn’t working, I can get it repaired or replaced quickly.” (n = 574)
73* 24* 16* 48*
NOTES: All percentages are rounded to the nearest integer. The first row in each working condition category is the reference group. * Denotes that the difference between groups of teachers in relation to the reference group is significant at the p < 0.05 level.
Table B.66. Cross-Tabulations Between Technical Problems with Remote Teaching and Teacher Distress Indicators
Weighted Percentage
Technical Problems with Remote Teaching
Frequent Job-Related Stress
Symptoms of Depression
Difficulty Coping with Job-Related
Stress Feelings of
Burnout
Experienced technical problems when remote teaching (at least daily) (n = 106)
86 33 31 61
Experienced technical problems when remote teaching (at least once per week) (n = 385)
83 31 22 58
Experienced technical problems when remote teaching (less than once per week) (n = 459)
71* 22* 17* 48*
Typical student experienced technology problems when remote teaching (at least daily) (n = 258)
82 35 26 62
Typical student experienced technology problems when remote teaching (at least once per week) (n = 537)
77 25* 19* 52*

43
Weighted Percentage
Technical Problems with Remote Teaching
Frequent Job-Related Stress
Symptoms of Depression
Difficulty Coping with Job-Related
Stress Feelings of
Burnout Typical student experienced technical problems when remote teaching (less than once per week) (n = 140)
74 21* 17* 48*
NOTES: All percentages are rounded to the nearest integer. The first row in each working condition category is the reference group. * Denotes that the difference between groups of teachers in relation to the reference group is significant at the p < 0.05 level. Additionally, for frequent job-related stress, symptoms of depression, difficulty coping with job-related stress, and feelings of burnout, there were significant differences between teachers who experienced technical problems at least once per week and teachers who experienced technical problems less than once per week.
Table B.67. Cross-Tabulations Between Responsibilities Outside the Classroom and Teacher Distress Indicators
Responsibilities Outside the Classroom
Weighted Percentage
Frequent Job-Related Stress
Symptoms of Depression
Difficulty Coping with Job-Related
Stress Feelings of
Burnout
Others were responsible for the care and learning support of the respondents’ children while teaching (n = 293)a
77 25 20 49
Responsible for the care and learning support of their own children while teaching (n = 205)
80 30 28 55
Did not earn additional compensation from working at another job other than public school teaching position (n = 766)
79 26 20 53
Earned additional compensation from working at another job other than public school teaching position (n = 217)
74 29 24 55
NOTES: All percentages are rounded to the nearest integer. The first row in each working condition category is the reference group. * Denotes that the difference between groups of teachers in relation to the reference group is significant at the p < 0.05 level. a We excluded individuals whose children do not need support or care for a majority of the time they are teaching from this analysis.
Table B.68. Cross-Tabulations Between COVID-19 Safety Practices and Teacher Distress Indicators
COVID-19 Safety Practices
Weighted Percentage
Frequent Job-Related Stress
Symptoms of Depression
Difficulty Coping with Job-Related Stress
Feelings of Burnout
School is not engaging in COVID-19 rapid testing of students (n = 509)
79 27 22 57
School is engaging in COVID-19 rapid testing of students (n = 68)
83 25 21 54

44
COVID-19 Safety Practices
Weighted Percentage
Frequent Job-Related Stress
Symptoms of Depression
Difficulty Coping with Job-Related Stress
Feelings of Burnout
School is not engaging in COVID-19 rapid testing of staff (n = 467)
80 27 21 58
School is engaging in COVID-19 rapid testing of staff (n = 110)
76 26 24 52
School does not require face masks for employees (n = 49)
71 30 13 52
School requires face masks for employees (n = 528)
80 26 23 57
School does not require face masks for students (n = 60)
80 31 16 61
School requires face masks for students (n = 517)
80 26 22 56
School does not require temperature checks for students or staff (n = 307)
82 28 22 61
School requires temperature checks for students or staff (n = 270)
77 25 21 52*
School has not improved ventilation (n = 422)
81 29 23 58
School has improved ventilation (n = 155)
76 19* 18 54
School does not require social distancing (n = 105)
84 35 31 72
School requires social distancing (n = 472)
78 25* 20* 53*
School does not use hygiene practices (n = 106)
82 30 34 73
School uses hygiene practices (n = 471)
79 26 19* 53*
NOTES: All percentages are rounded to the nearest integer. To determine the use of these safety practices in teachers’ schools, we used teachers’ response to the question, “What safety measures is your school taking to reduce COVID-19 transmission during in-person instruction this school year (2020–2021)?” (see Table B.38). For ease of interpretability, we combined teachers’ reports of similar safety measures. We defined teachers’ schools as engaging in COVID-19 rapid testing of students if teachers selected “Regular (e.g., monthly) COVID-19 rapid testing of most or all students, regardless of symptoms” or “COVID-19 rapid testing of students who feel unwell.” We defined teachers’ schools as engaging in COVID-19 rapid testing of staff if teachers selected “Regular (e.g., monthly) COVID-19 rapid testing of most or all staff, regardless of symptoms” or “COVID-19 rapid testing of staff who feel unwell.” We defined teachers’ schools as requiring face masks for students if teachers selected “requiring face masks for students in some or all grade levels that must be worn throughout the entire school day (except for meals)” or “requiring face masks for students in some or all grade levels that must be worn during part, but not all, of the school day (e.g., in hallways and during arrival/departure times, but not in class). We defined teachers’ schools as requiring temperature checks for students or staff if teachers selected “checking employees’ temperature upon arrival” or “checking students’ temperatures upon arrival.” The first row in each working condition category is the reference group. * Denotes that the difference between groups of teachers in relation to the reference group is significant at the p < 0.05 level.

45
Table B.69 shows cross-tabulations between teachers’ actual and preferred modes of instruction. Table B.70 shows COVID-19 safety measures reported by survey respondents and the three groups of teacher leavers.
Table B.69. Cross-Tabulations Between Actual and Preferred Modes of Instruction
Weighted Percentage
Actual Mode of Instruction
Prefers Fully Remote Instruction (at least one synchronous
class)
Prefers Fully Remote Instruction (less than
one synchronous class)
Prefers Hybrid Model
Prefers Fully In-Person Instruction
Fully remote instruction, where a large majority or all of your students received at least one synchronous class each school day (n = 367)
57 5 11 27
Fully remote instruction, where a large majority or all of your students received less than one synchronous class each school day (n = 47)
29 21 11 39
Hybrid model, where a majority or all of your students receive some in-person instruction and some remote instruction (n = 379)
28 5 23 44
Fully in-person instruction each school day for the majority, if not all, of your students (n = 199)
11 3 12 74
NOTES: All percentages are rounded to the nearest integer. Percentages may not sum to 100 percent because of rounding.

46
Table B.70. COVID-19 Safety Measures and Teacher Leaver Groups
Weighted Percentage
COVID-19 Safety Measure Full Sample (N = 1,006)
Percentage of Teachers Who
Were Unlikely to Leave Before COVID-19 but Were Likely to Leave at the Time of the
Survey (likely pandemic
leavers) (n = 148)
Percentage of Teachers Who Were Likely to Leave Before COVID-19 and
Who Were Likely to Leave at the
Time of the Survey (likely
prepandemic leavers) (n = 67)
Percentage of Teachers Who Were Unlikely
to Leave Before COVID-19 and at the Time of the
Survey (unlikely leavers) (n = 748)
N/A—My school is not taking safety measures 1 2 0 1
Regular (e.g., monthly) COVID-19 rapid testing of most or all staff, regardless of symptoms
7 5 5 7
Regular (e.g., monthly) COVID-19 rapid testing of most or all students, regardless of symptoms
4 3 0 4
COVID-19 rapid testing of staff who feel unwell 13 13 10 14
COVID-19 rapid testing of students who feel unwell
8 9 5 9
Requiring face masks for employees that must be worn throughout the entire school day (except for meals)
92 92 93 91
Requiring face masks for students in some or all grade levels that must be worn throughout the entire school day (except for meals)
83 77 82 85
Requiring face masks for students in some or all grade levels that must be worn during part, but not all, of the school day (e.g., in hallways and during arrival/departure times, but not in class)
13 8 14 13
Checking employees’ temperature upon arrival 34 28 29 36
Checking students’ temperature upon arrivala 40 31 41 42
Improving ventilation (e.g., upgrading HVAC systems or leaving doors/windows open)c
27 27 15 28
Social distancing (e.g., instructing students in small groups, such as cohorts or pods; offering outdoor instruction; cancelling assemblies)a, c
82 66 68 87
Hygiene practices (e.g., cleaning rooms and surfaces between use)a, c
82 68 62 86
Other 5 5 8 4
NOTES: All percentages are rounded to the nearest integer. a Significant difference between likely pandemic leavers and unlikely leavers. b Significant difference between likely pandemic leavers and likely prepandemic leavers. c Significant difference between likely prepandemic leavers and unlikely leavers.

47
Appendix C. Survey Questions and Responses from the American Life Panel
In Tables C.1–C.4, we provide responses from the ALP survey.
Table C.1. Are You Currently . . . (n = 2,078)
Response Category Weighted Percentage
Working at a job or business 61
Not working now, but worked in the past six months 5
Not working now and have not worked for pay in the past six months
33
NOTE: All percentages are rounded to the nearest integer. Percentages may not sum to 100 percent because of rounding.
Table C.2. Since the Beginning of the Pandemic (March 2020), How Often Has Your Work Been Stressful? (n = 1,075)
Frequency of Work Stress Weighted Percentage
Never 5
Hardly ever 17
Sometimes 38
Often 29
Always 11
NOTE: All percentages are rounded to the nearest integer. Percentages may not sum to 100 percent because of rounding. These percentages include only individuals who responded that they are currently working at a job or business in the previous question (see Table C.1).
Table C.3. What Is the Likelihood That You Will Leave Your Job by Summer 2021, Compared to the Likelihood You Would Have Left Your Job Before COVID-19? (n = 1,075)
Likelihood of Leaving Job Weighted Percentage
Likely to leave before COVID-19, but unlikely now 4
Unlikely to leave before, but likely now 10
Likely to leave both before and now 7
Unlikely to leave both before and now 79
NOTE: All percentages are rounded to the nearest integer. Percentages may not sum to 100 percent because of rounding. These percentages include only individuals who responded that they are currently working at a job or business in a previous question (see Table C.1).

48
Table C.4. Cross-Tabulations Between the Frequency of Work-Related Stress and Likelihood of Leaving Their Jobs
Weighted Percentage
Percentage of Respondents Who Were Unlikely to Leave Before COVID-19, But Were
Likely to Leave at the Time of the Survey
(likely pandemic leavers) (n = 76)
Percentage of Respondents Who Were Likely to Leave Before COVID-19 and Who Were Likely to Leave at the
Time of the Survey (likely prepandemic leavers)
(n = 103)
Percentage of Respondents Who Were Unlikely to Leave Before
COVID-19 and at the Time of the Survey
(unlikely leavers) (n = 866)
Never 7 1 5
Hardly ever 3 15 20
Sometimes 26 34 40
Often 44 38 27
Always 20 12 8 NOTE: All percentages are rounded to the nearest integer. Percentages may not sum to 100 percent because of rounding. These percentages include only individuals who responded that they are currently working at a job or business in a previous question (see Table C.1).

49
Appendix D. Survey Questions and Responses from the Understanding America Study
In Tables D.1 and D.2, we provide responses from the UAS.
Table D.1. Over the Last Two Weeks, How Often Have You Been Bothered by the Following Problems?
Problem Weighted Percentage
Little interest or pleasure in doing things (n = 6,109)
Not at all 72
Several days 19
More than half the days 4
Nearly every day 5
Feeling down, depressed, or hopeless (n = 6,108)
Not at all 72
Several days 18
More than half the days 4
Nearly every day 5
NOTE: All percentages are rounded to the nearest integer. Percentages may not sum to 100 percent because of rounding.
Table D.2. Incidence of Depressive Symptoms Within the General Public (n = 6,108)
PHQ-2 Score Weighted Percentage
PHQ-2 score of 0–2 90
PHQ-2 score of 3–6 10
NOTE: All percentages are rounded to the nearest integer. Percentages may not sum to 100 percent because of rounding.

50
References
AFT and BATs—See American Federation of Teachers and Badass Teachers Association.
American Federation of Teachers and Badass Teachers Association, 2017 Educator Quality of Work Life Survey, Washington, D.C., 2017.
Diliberti, Melissa Kay, Heather L. Schwartz, and David Grant, Stress Topped the Reasons Why Public School Teachers Quit, Even Before COVID-19, Santa Monica, Calif.: RAND Corporation, RR-A1121-2, 2021. As of April 23, 2021: https://www.rand.org/pubs/research_reports/RRA1121-2.html
Herman, Keith C., Jal’et Hickmon-Rosa, and Wendy M. Reinke, “Empirically Derived Profiles of Teacher Stress, Burnout, Self-Efficacy, and Coping and Associated Student Outcomes,” Journal of Positive Behavior Interventions, Vol. 20, No. 2, 2018, pp. 90–100.
Kaufman, Julia H., Melissa Kay Diliberti, Gerald P. Hunter, David Grant, Laura S. Hamilton, Heather L. Schwartz, Claude Messan Setodji, Joshua Snoke, and Christopher J. Young, COVID-19 and the State of K–12 Schools: Results and Technical Documentation from the Fall 2020 American Educator Panels COVID-19 Surveys, Santa Monica, Calif.: RAND Corporation, RR-A168-5, 2020. As of April 23, 2021: https://www.rand.org/pubs/research_reports/RRA168-5.html
Kroenke, Kurt, Robert L. Spitzer, and Janet B. W. Williams, “The Patient Health Questionnaire-2: Validity of a Two-Item Depression Screener,” Medical Care, Vol. 41, No. 11, November 2003, pp. 1284–1292.
National Center for Education Statistics, Teacher Questionnaire: National Teacher and Principal Survey, 2017–18 School Year, Washington, D.C.: U.S. Department of Education, NTPS-4A, July 19, 2017.
NCES—See National Center for Education Statistics.
Pollard, Michael S., and Matthew D. Baird, The RAND American Life Panel: Technical Description, Santa Monica, Calif.: RAND Corporation, RR-1651, 2017. As of April 23, 2021: https://www.rand.org/pubs/research_reports/RR1651.html
Robbins, Michael W., and David Grant, RAND American Educator Panels Technical Description, Santa Monica, Calif.: RAND Corporation, RR-3104-BMGF, 2020. As of April 23, 2021: https://www.rand.org/pubs/research_reports/RR3104.html

51
Sage Working Group, Report of the Sage Working Group on Vaccine Hesitancy, November 12, 2014.
Seidman, Steven A., and Joanne Zager, “The Teacher Burnout Scale,” Educational Research Quarterly, Vol. 11, No. 1, 1987, pp. 26–33.
University of Southern California Dornsife Center for Economic and Social Research, homepage, undated-a. As of May 24, 2021: https://uasdata.usc.edu/index.php
University of Southern California Dornsife Center for Economic and Social Research, Understanding America Study: Weighting Procedure, V1, Los Angeles, Calif., undated-b.
University of Chicago Consortium on School Research, 2017 CPS 5Essentials Teacher Survey, Chicago, Ill., 2017.