Embed Size (px)
Citation preview
TSpace Research Repository tspace.library.utoronto.ca
Job-related resources and the pressures of working life
Scott Schieman
Version Post-Print/Accepted Manuscript
Citation (published version)
Schieman, Scott. 2013. “Job-Related Resources and the Pressures of Working Life.” Social Science Research 42:271-282.
Copyright / License
This work is licensed under a Creative Commons Attribution-NonCommercial-NoDerivatives 4.0 International License.
Publisher’s Statement The final published version is available at Elsevier via https://dx.doi.org/10.1016/j.ssresearch.2012.10.003.
How to cite TSpace items
Always cite the published version, so the author(s) will receive recognition through services that track citation counts, e.g. Scopus. If you need to cite the page number of the TSpace version (original manuscript or accepted manuscript) because you cannot access the published version, then cite the TSpace version in addition to the published version using the permanent URI (handle) found on the record page.
1
Job-Related Resources and the Pressures of Working Life
Introduction
Are job-related resources associated with more or less job pressure? One view is that
people with better pay and greater job control or more resources should enjoy an easier life—one
filled with more personal and social rewards. In accordance with the Stress Process Model, many
scholars in the sociological study of stress have articulated the ways that status inequality
contributes to disparities in well-being (McLeod & Nonnemaker, 1999; Mirowsky & Ross, 2003;
Pearlin, 1999). A lower level of exposure to stressors among individuals with higher status is
offered as one explanation for these patterns. At the same time, however, there is increasing
attention to the ‘downsides’ of higher status that go against the grain of these more favorable
predictions, especially in the workplace context. An emerging theoretical perspective—the stress
of higher status—has been advanced in an effort to elaborate on these processes and their
implications for personal and role functioning (Schieman, Kurashina, & Van Gundy, 2006;
Schieman & Glavin 2008, 2011; Schieman, Milkie, and Glavin, 2009). One of its main
predictions is that individuals in higher status positions in the workplace—as experienced in the
nature of activities, expectations, and responsibilities—are exposed to more job demands. While
this seems plausible, little is known about the interrelationships among specific features of job
resources and demands (e.g., job pressure) that are central for stress of higher status processes.
In an effort to further develop and test components of the stress of higher status thesis, I
draw upon ideas from the Job Demands-Control model (Karasek, 1979) and its more recent
iteration—the Job Demands-Resources (JD-R) model (Demerouti, Bakker, Nachreiner, &
Schaufeli, 2001). Both models are heuristic frameworks for describing the effects of job
conditions on personal, social, and organizational outcomes. In the JD-R model, scholars have
2
identified the centrality of two characteristics of work across all types of occupations: demands
and resources (Bakker & Demerouti, 2007; Schaufeli & Bakker, 2004). Demands are “structural
or psychological claims associated with role requirements, expectations, and norms to which
individuals must respond or adapt by exerting physical or mental effort” (Voydanoff, 2005:491).
In research on work and stress, job pressure represents a quintessential demand (Diestel &
Schmidt, 2009; Kristensen et al., 2004; Tausig & Fenwick, 2011). By contrast, job resources are
physical, psychosocial, or organizational aspects of work that should help workers manage job
pressure (Demerouti & Bakker, 2011). This view of “resources” in the JD-R model originates, in
part, from the JD-C model’s concept of job control—that is, the “working individual’s potential
control over his tasks and his conduct during the working day” (Karasek, 1979:289). Job
resources involve the nature of, and rewards from, the work itself (e.g., autonomy, schedule
control, authority, and challenge)—although, as I will elaborate on in detail below, the
conceptual connections between job control and resources may be much more evident among
some work characteristics compared to others.
In this study, I position the earlier conceptualization of “job control” alongside the more
recent characterization of “job resources” and investigate the following puzzle: What if some
forms of job resources are associated with greater exposure to job pressure? These observations
would elaborate upon the core ideas and predictions of the JD-R model and encourage greater
conceptual reflection about the job conditions that have typically been referred to as “resources.”
To address these questions, I analyze data from a nationally representative survey that includes
workers from a broad spectrum of job sectors, occupations, social statuses, and job conditions:
the 2011 Canadian Work, Stress, and Health study (CAN-WSH).
3
1.1. The Conceptualization and Importance of Job Pressure
As part of Karasek’s (1979) classic JD-C model, early conceptualizations of job demands
focused on requirements for fast-paced performance, the intensity of effort, and time constraints
(Karasek, 1985; Karasek & Theorell, 1990), including items like “my job requires working very
fast,” “my job requires working very hard,” and “I have enough time to get the job done” (the
latter being reverse-coded). These indicators directly implicate the stress associated with the
divergence between the quantity of work and the time allotted for it. While debates about the
conceptualization and measurement of job demands persist, a basic theme involves the amount of
work to be done and the subjective sense of the associated pressure (Diestel & Schmidt, 2009).
Some research has expanded the concept of “quantitative demands at work” with a more specific
focus on time pressure (Duxbury, Lyons, & Higgins, 2008; Kristensen et al., 2004; Tausig &
Fenwick, 2011). In such high-pressure contexts, workers report feeling an imbalance between the
amount of work required and the time that they have to complete it.
The conceptualization of job pressure fits the JD-R model’s characterization of demands
as features of the work role that generate strain—especially if they “exceed the employee’s
adaptive capability” (Bakker et al., 2007). As operationalized in the present study, workers who
report high levels of job pressure experience being overwhelmed by the amount of work they
have to do; they have to work on too many tasks at the same time; the demands of their job
exceed the time they have to do the work. Research consistently demonstrates that job pressure
increases time and energy commitments and is associated with exhaustion, burnout, and distress
(Demerouti et al., 2001; Hakanen, Schaufeli, & Ahola, 2008; Kristensen et al., 2004; Schieman
& Glavin, 2011).1 In the 1997 NSCW, for example, Voydanoff (2005) observes that job pressure
1 Bakker and colleagues (2007:275) assert: “Although job demands are not necessarily negative, they may turn into
job stressors when meeting those demands requires high effort from which the employee does not adequately

4
is associated with more work-to-family conflict—a key stressor that is associated with greater
distress (Bellavia & Frone, 2005; Glavin, Schieman, & Reid, 2011). Similarly, in analyses of the
2002 NSCW, Schieman and Glavin (2011) link job pressure with elevated levels of distress.
Given the well-established empirical connection between job pressure and negative
outcomes, my study focuses specific attention on the job conditions that influence levels of
pressure—especially its distribution across occupational groups and income levels, as well as its
association with job resources. Different types of jobs—with their varying requirements and
expectations, probably generate different amounts of pressure. In this context, I therefore seek to
answer a key question that remains unaddressed in the literature: Are the so-called “resource”
attributes of these jobs associated with more or less exposure to job pressure?
1.2. The Link between Job Resources and Job Pressure
In the JD-R model, job demands are clearly identified as potentially problematic for
workers, especially in the “health impairment process” (Demerouti & Bakker, 2011). However,
the JD-R model also proposes that job resources should help workers manage the demands of
work (Bakker & Geurts, 2004; Demerouti et al., 2001). A fundamental tenet predicts both a
negative direct association and an interaction effect between job resources and demands. For
example, Bakker & Demerouti (2007) assert: “Job resources reduce job demands and the
recover…” In my view, this claim is problematic because it suggests that job pressure is not an actual ‘stressor’
unless a worker is required to exert effort and then fails to ‘recover.’ Moreover, Bakker and colleagues’ definition
embeds the outcome variable (“failure to recover”) with the predictor variable (“demands”). I argue that being
overwhelmed by work, having too many tasks, or facing demands that exceed time allowances are unambiguously
representative of a stressor. On balance, job pressures like these do require “high effort” and are typically negative.
Whether or not (a) the worker “recovers” from the high degree of effort or (b) subsequently experiences negative
outcomes like greater psychological distress or poor health outcomes are two separate empirical questions.
5
associated physiological and psychological costs ” (p. 312).2 Testing the first part of this basic
proposition, I propose the resource hypothesis: If job resources actually “reduce’ job demands,
then my analyses should demonstrate that each resource is associated with less job pressure. By
contrast, an alternative hypothesis—the stress of higher status—predicts a starkly different
scenario: Job resources may be associated with higher levels of job pressure. Which view is more
accurate—and does the answer depend on the particular job resource being considered?
The resource hypothesis is rooted in the concept of job control (Karasek, 1979). A core
assumption of the JD-C model and the more contemporary JD-R model is that high job demands
are problematic, especially in conjunction with low job control or resources (van der Doef &
Maes, 1999). However, few researchers have adequately articulated another possibility: Some
job-related resources might be associated with more demands. The lack of theoretical and
empirical attention given to this prospect, in my view, is partly due to the ways that the
developers of the JD-C model positioned demands and control vis-à-vis each other. For instance,
Karasek and colleagues (1998) explicitly articulated the association between job control and job
demands in starkly statistical terms—focusing on “collinearity” as a central problem in the
analyses of multiplicative or interaction effects:
“The correlation between psychological demands and decision latitude is an
important issue for testing the demand/control model. A positive correlation can
indicate collinearity difficulties and be a source of weak tests of association
because the high-strain combination (high demands, low control) would be an
infrequent occurrence under such conditions. Because decision latitude is
substantially more statistically reliable of the two scales (particularly between
occupations), their common variance with a dependent variable is likely to be
attributed to decision latitude in hierarchical linear regression models” (p. 347).
2 A reviewer suggested that the proposition that “resources reduce demands” might not actually be a hypothesis but “part of the
basic definition of the JD-R model.” While I acknowledge that possibility, the original statement (as quoted) makes a direct claim
of a negative association between resources and demands—and the word “reduces” implies a causal direction. In any case,
irrespective of whether or not the authors’ original intention was to advance a specific hypothesis, my objective involves a closer
investigation of this statement in an effort to articulate a more nuanced set of interrelationships among resources and demands.
6
This description is problematic in two fundamental ways. First, it overemphasizes the
importance of a multiplicative model for job demands and control/resources—a claim that has
subsequently guided decades of research in (often unsuccessful) efforts to confirm the existence
of interaction effects (Beehr, Glaser, Canali, & Wallwey, 2001; de Lange et al., 2003; Häusser et
al., 2010; Tausig & Fenwick, 2011). Second, and perhaps more importantly, it understates and
potentially mischaracterizes the underlying dynamics in the association between job control or
resources and demands. As an alternative perspective, I argue for viewing the interrelationships
among job resources and demands not merely as “statistical relationships” or allusions to
problems of “common variance,” “collinearity difficulties,” or “thin cells,” but rather as
representative of theoretically meaningful and substantively consequential processes in the
experiences of workers. The ways that researchers articulate these interrelationships have
implications for theories behind the models and the parameters of the concepts themselves. For
example, if some forms of job resources are associated with more pressure then researchers
should seek to explain these processes in substantive (and not only statistical) terms and in ways
other than the commonly hypothesized (potential) interaction effects. I have identified the core
tenets of the stress of higher status theory explicitly to elaborate on and articulate this idea.
Part of the impetus behind my interest in these theoretical refinements emerges from the
characterization of “job control” itself. In the original JD-C model, this conceptualization was
based primarily upon decision latitude, which is comprised of two components: “skill discretion”
and “decision authority” (Karasek & Theorell, 1990). According to Karasek and associates
(1998), skill discretion involves “the level of skill and creativity required on the job and the
flexibility permitted the worker in deciding what skills to employ,” while decision authority
entails the “organizationally mediated possibilities for workers to make decisions about their
7
work” (p. 323). To some extent, these themes persist in the JD-R model’s conceptualization of
resources.3 In the present analyses, I expand the conceptual frame of job resources by assessing a
broader class of conditions that includes control over one’s own work (job autonomy), control
over the timing of work (schedule control), control over others’ work (job authority), and control
as reflected in challenging or creative activities that involve skill utilization (challenging work).
While job autonomy and schedule control align more distinctly within the customary
definition of “resources,” I argue that each of these four conditions is related to the original
characterization of job control in the JD-C model or job resources in the JD-R model. Of all
these characteristics, job authority has one of the most unambiguous connections to greater
responsibility and rewards. People with job authority—also referred to as “span of
responsibility” or “organizational control”—have power to set other workers’ pay, the ability to
hire and fire people, and supervisory control over others’ activities (Carayon & Zijlstra, 1999;
Elliott & Smith, 2004; Mueller & Parcel, 1986). Some scholars have explicitly described job
authority as a “highly coveted workplace resource” (see Smith, 2002). This is partly due to its
link with other favorable conditions such as autonomy, schedule control, greater pay, and
chances for advancement (Kalleberg, 2011; Reskin & Ross, 1992; Tausig & Fenwick, 2011).
There is evidence, however, that the higher demands associated with authority might offset its
rewards (Bakker, van Veldhoven, & Xanthopoulou, 2010; Mirowsky & Ross, 2003; Schieman &
Reid, 2009). For example, net of earnings and challenging work, people with authority tend to
work longer hours, have more job pressure, and encounter more conflict (Brett & Stroh 2003;
Maume & Bellas, 2001; Schieman & Reid, 2008).
The fourth job-related resource that I evaluate in the present study—challenging work—
involves the extent that workers are required to keep learning new things, engage in creative
3 This is not to suggest, however, that all forms of job resources are equivalent to different forms of job control.
8
activities, use their skills and abilities, and handle a variety of tasks on the job. This concept
blends a set of interrelated themes that researchers have referred to with numerous different
terms, including “complexity,” “variety,” “non-routine work,” “creative work,” “skill
discretion” “learning possibilities,” and “opportunities for professional development” (Bakker &
Geurts, 2004; Bakker et al., 2010; Bakker, Demerouti, Taris, Schaufeli, and Schreurs 2003; Dean
& Snell, 1991; Hackman & Oldham, 1975; Karasek, 1979, 1985; Kohn & Schooler, 1973;
Mirowsky & Ross 2003; Schieman & Young 2010b). There are sound conceptual and empirical
reasons for characterizing challenging work as a job-related resource alongside autonomy,
schedule control, and authority.4 First, the concept has its origins in the JD-C model’s “decision
latitude,” which, as I described above, partly involves the degree of skill and creativity required
on the job (Karasek & Theorell, 1990; Karasek et al., 1998). According to Voydanoff (2007),
work conditions that foster skill enhancement and utilization, problem solving, learning, and
creativity are broadly representative of resources. And, like job authority, while there are
undoubtedly many ‘upsides’ to challenging work (Mirowsky and Ross 2003), research links
challenging work to various potential ‘downsides’ like longer hours, greater demands, and work
intensification (Bakker et al., 2010; Maume & Purcell, 2007). Given these complex patterns, it is
worth evaluating if challenging work is associated with job pressure in ways predicted by the
resource hypothesis or if its effects are consistent with the stress of higher status hypothesis.
Finally, in addition to these four job-related resources, I also assess the relevance of
personal earnings in these processes. While studies in the JD-C/JD-R literature tend to ignore
income or simply include it as a control variable in analyses, I more explicitly test income’s
relevance alongside these other job resources (Kristensen, Borg, & Hannertz, 2002). From the
4 Challenging work is conceptually distinct from these other resources, although they are undoubtedly related
empirically (Kalleberg 2011; Mirowsky & Ross, 2007; Schieman & Young, 2010b).
9
resource hypothesis perspective, higher levels of income should reduce exposure to levels of job
pressure. By contrast, however, the stress of higher status view draws upon recent evidence of
the positive interrelationships among income, work hours, and job pressure to predict that
income should be associated with elevated levels of job pressure (Greenhaus, Peng, & Allen,
2012; Mennino et al., 2005; Tausig & Fenwick, 2011).5 However, an important part of this story
involves assessing income’s association with job pressure net of the other job-related resources.
1.3. Assessing the Influence of Education as an Important Antecedent
While my primary focus centers on the relationship between job resources and pressure,
the potential influence of education is also critical from a sociological interest in the dimensions
of stratification and inequality. In the present study, I assess the relevance of levels of education
as a key antecedent to the processes described above. Education itself has direct links to the
ideas behind the resource and the stress of higher status hypotheses (Schieman & Glavin, 2011).
For example, research shows that the well-educated tend to have greater access to higher status
occupations and, by extension, forms of job control (Mirowsky & Ross, 2003; Ross & Wright,
1998; Schieman et al., 2006). At the same time, research documents greater pressure and longer
work hours among the well-educated, which may be due to their greater representation in higher
status occupations and higher income (Bakker et al., 2010; Hakanen, J., Bakker, & Jokisaari,
2011; Jacobs and Gerson 2004; Schieman & Plickert, 2008; Tausig and Fenwick 2001).
With these ideas and prior empirical observations about education as a backdrop, I assess
education-based differences in job pressure. On the one hand, from the perspective of the
5 While it is plausible that compensating differentials are offered to workers to induce them to take jobs with greater pressure (a
case for an alternative directionality where more job pressure predicts higher income), the essential pattern that I am seeking to
underscore here is that higher earnings and higher pressure tend to co-vary in ways that reflect the workload costs related to
various forms of job-related control or resources.
10
resource hypothesis, education itself might function as a resource and therefore be associated
with less exposure to job pressure. Conversely, the stress of higher status hypothesis predicts
greater exposure to job pressure among those individuals with the highest levels of education. In
addition, the analyses presented here provide a unique opportunity to test for mediating linkages
in which education-based differences in job pressure might be partly or fully attributable to
education’s association with occupation, income, and job resources. Evidence for mediating
linkages would be present if any of these conditions account for education’s association with
levels of job pressure in ways consistent with the resource or stress of higher status hypotheses.
Materials and Methods
2.1 Sample
The 2011 Canadian Work Stress and Health Study (CAN-WSH) is a nationally
representative sample of the Canadian labor force. Interviews were conducted by telephone
between January and July 2011. The company R.A. Malatest and Associates was hired to collect
the data. To be eligible to participate in the study, individuals had to be: (1) residing in Canada;
(2) 18 years of age or older; (3) currently working at a paid job or operated an income-producing
business; (4) employed in the civilian labour force; and 5) living in a non-institutional residence.
In households with more than one eligible person, we used the “next birthday” method to
randomly select a study participant. Calls were made to a regionally stratified unclustered
random probability sample generated by random-digit-dial methods. Interviews were conducted
in English or French and averaged approximately 30 – 35 minutes. Study participants received a
$20 gift card for completing the interview. The final full sample was 6,005. The response rate
11
was approximately 40 percent.6 All of the measures below and the subsequent analyses focus on
study participants’ main job.
2.2. Measures
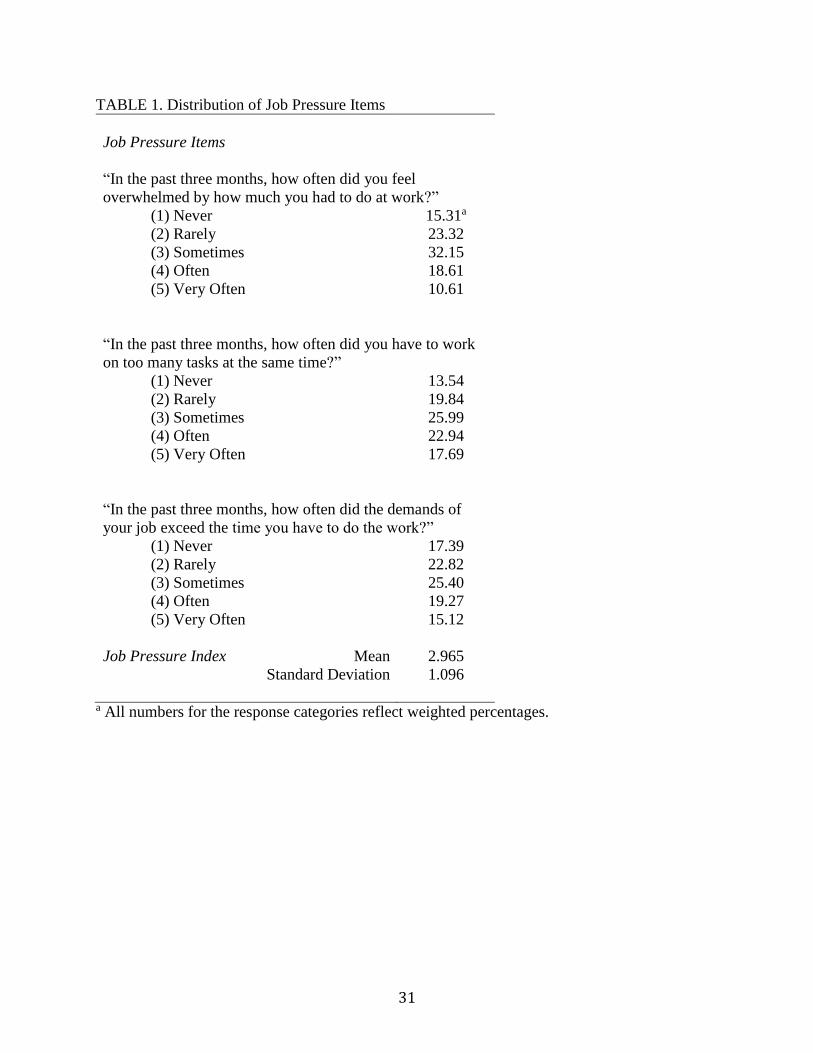
Job pressure. I use items that are similar to those used in other previously published
research on similar themes like “pressure,” “workload,” or “quantitative demands” (Carayon, &
Zijlstra, 1999; Harmä, 2006; Karasek, 1985; Kristensen et al., 2004; Van den Broek,
Vansteenkiste, De Witte, & Lens, 2008). Three items ask about the frequency that participants
experienced the following in the past three months: “How often did you feel overwhelmed by
how much you had to do at work?” “How often did you have to work on too many tasks at the
same time?” “How often did the demands of your job exceeded the time you have to do the
work?” Response choices are coded: “never” (1), “rarely” (2), “sometimes” (3), “often” (4), and
“very often” (5). I averaged the items so that higher scores indicate more job pressure ( = .85).
Table 1 reports the distribution of each of these items and summary statistics for the job
pressure indices. Roughly one-third of Canadian workers report that they “often” or “very often”
feel overwhelmed by work or that the demands of their job exceed the time to do the work; 4 out
of 10 workers report having to work on too many tasks at the same time “often” or “very often.”7
6 Some readers might have concerns about the response rate. Although a potential problem associated with lower
response rates is nonresponse bias in estimates (Babbie 2007), recent research has challenged the link between
response rates and nonresponse bias (see Grove 2006; Curtin, Presser, and Singer 2000; Merkle and Edelman 2002).
Nevertheless, I address the possibility that results were unduly influenced by nonresponse bias. In order to do this, I
compared results from unweighted and weighted analyses in which I weighted the sample based on a key set of
demographic statuses (e.g. gender, age, marital status, education). I found few differences between the weighted and
unweighted results. Winship and Radbill (1994) argue that controlling for characteristics on which individuals may
be under- or over-sampled adjusts for biases due to these characteristics; all of my analyses include a set of controls
to adjust for this potentiality. In addition, sample descriptive statistics for my variables are indistinguishable to the
weighted descriptive statistics, and similar to those in other national surveys. This sample seems fairly representative
of the intended population, and nonresponse bias should not a major problem for the estimates being reported. 7 A factor analysis shows that the job pressure items load in ways that distinguish them from each of the other job
resources described below.
12
[INSERT TABLE 1 ABOUT HERE]
Education. Level of education is coded as less than high school (1), high school or GED
(2), some college, no degree earned (3), 2-year/Associates degree (4), 4-year university degree
(5), and graduate or professional degree (6). “High school” is the reference group in all analyses.
Occupation. To assess occupation, participants are asked: “What kind of work do you
do? That is, what is your occupation?” This question refers to their main place of employment;
that is, the one at which participants spend most of their time. Additional questions were asked
about their main duties in order to more accurately code responses. Using the open-ended
information provided, occupations are coded into thirty-three categories using the 2006 Canadian
National Occupation Classification. Codes were collapsed into seven groups in accordance with
the U.S. Bureau of the Census three-digit occupation (SOC) and industry (SIC) classifications.
These groups are as follows: “executives,” “professionals,” “technical,” “service,” “sales,”
“administrative” and “production.” “Professional” serves as the reference group in all analyses.
Personal income. I coded total personal earnings in the previous year (from all sources)
into the following categories: “$25,000 or less,” “$25,001 to $50,000,” “$50,001 to $75,000,”
“$75,001 to $100,000,” “$100,001 or more.” The modal category of $25,001 to $50,000 serves
as the reference group in all analyses.
Job autonomy. Three items are used to measure job autonomy. Study participants are
asked the extent that they agree or disagree with the following statements: “I have the freedom to
decide what I do on my job,” “It is basically my own responsibility to decide how my job gets
done,” and “I have a lot of say about what happens on my job.” These items are similar to those
in previous studies (e.g., Bakker, Demerouti, & Verbeke, 2004; Karasek, 1985). Response
13
choices are coded “strongly disagree” (1), “somewhat disagree” (2), “somewhat agree” (3), and
“strongly agree” (4). I averaged responses; higher scores reflect more job autonomy ( = .78).
Schedule control. Two items are used to measure schedule control: The first item asks:
“Who usually decides when you start and finish work each day?” “Someone else” is coded 1,
“you are able to decide within limits” is coded 2, and “you are entirely free to decide” is coded 3.
A second item asks: “How much control do you have in scheduling your work hours?” Original
response choices are coded “none” (1), “very little” (2), “some” (3), “a lot” (4), and “complete
control” (5). In order to combine the two items, I recoded the latter’s response choices into three
categories: 1 = “none or very little control,” 2 = “some or a lot,” and 3 = “complete control.” I
summed these items such that higher scores indicate more schedule control ( = .75).
Challenging work. Five items measure challenging work: “My job requires that I keep
learning new things,” “My job requires that I be creative,” “My job lets me use my skills and
abilities,” “The work I do on my job is meaningful to me,” and “I get to do a lot of different
things on my job.” These items blend interrelated themes that scholars refer to as “creative
work,” “non-routine work,” “skill utilization,” “learning possibilities,” or “opportunities for
professional development” (Bakker & Geurts, 2004; Bakker et al., 2010; Bakker, Demerouti,
Taris, Schaufeli, and Schreurs 2003; Hackman & Oldham, 1975; Karasek, 1985; Mirowsky &
Ross, 2003; Schieman & Young, 2010). Response choices are coded “strongly disagree” (1),
“somewhat disagree” (2), “somewhat agree” (3), and “strongly agree” (4). I averaged the
responses; higher scores reflect more challenging work ( = .78).
Job authority. I use responses to three items to assess levels of job authority: “Do you
supervise or manage anyone as part of your job?” “Do you influence or set the rate of pay
received by others?” and “Do you have the authority to hire or fire others?” I coded “no”
14
responses as (0) and “yes” responses as (1). To create the index I summed these responses so that
higher scores indicate more job authority. These items are similar or identical to others in
recently published research (Elliott & Smith, 2004; Schieman & Reid, 2008, 2009). 8
Control measures. All regression models in analyses include sex, age, marital status,
children at home, and region of residence. In the second model along with occupation, I include
a control for job sector by comparing workers in private for-profit versus government, non-
profit, or self-employed/business owners. As described below, in the final model I also adjust for
work hours by comparing study participants who work “40 – 50 hours per week” (the modal
category) with people who work “fewer than 30 hours per week,” “between 30 and 39,” and
“more than 50 hours per week,” and “work hours vary too much weekly to categorize easily.”
2.3. Plan of Analyses
I use ordinary least squares (OLS) regression techniques to test the hypotheses outlined
above. First, model 1 in Table 2 regresses job pressure on education (including the control
variables). As described above, education is hypothesized to be an important social status
antecedent that might influence (and be influenced by) the other focal variables in the models.
Subsequent models add (2) occupation; (3) income; and (4) the specific set of job resources:
autonomy, schedule control, challenging work, and authority. Given the ways that work hours
may be associated with job resources and demands (Bendak, 2003; Hughes & Parkes, 2007;
Maume & Purcell, 2007; Steinmetz & Schmidt, 2010; van der Hulst & Geurts, 2001; van der
Hulst, Veldhoven, & Beckers, 2006), it is important to statistically account for its potential
influence on any observed patterns. I therefore adjust for work hours separately in the final
8 The correlations among the job-related resources are as follows: autonomy and schedule control (.51), authority (.34), challenging work (.47); schedule control and authority (.36) and challenging work (.25); authority and challenging work (.25).
15
model—rather than in the initial model with the other basic control variables—in order to
identify its potential relevance for each of the established patterns of association that connect
education, occupation, income, and job resources to levels of job pressure. The progressive
adjustments that I apply in these models follow from the procedures described by Mirowsky
(1999); each is designed to test the resource and the stress of higher status hypotheses. These
steps assess the extent of change in the size of coefficients across models. Progressive
adjustments can explain previously observed associations or reveal suppressed effects in which
coefficients change direction or become stronger. As a backdrop for these interrelationships, the
Appendix provides a set of descriptive reference points for the ways that education-, occupation-,
or income-based differences in job pressure might be due to their associations with job resources.
Results
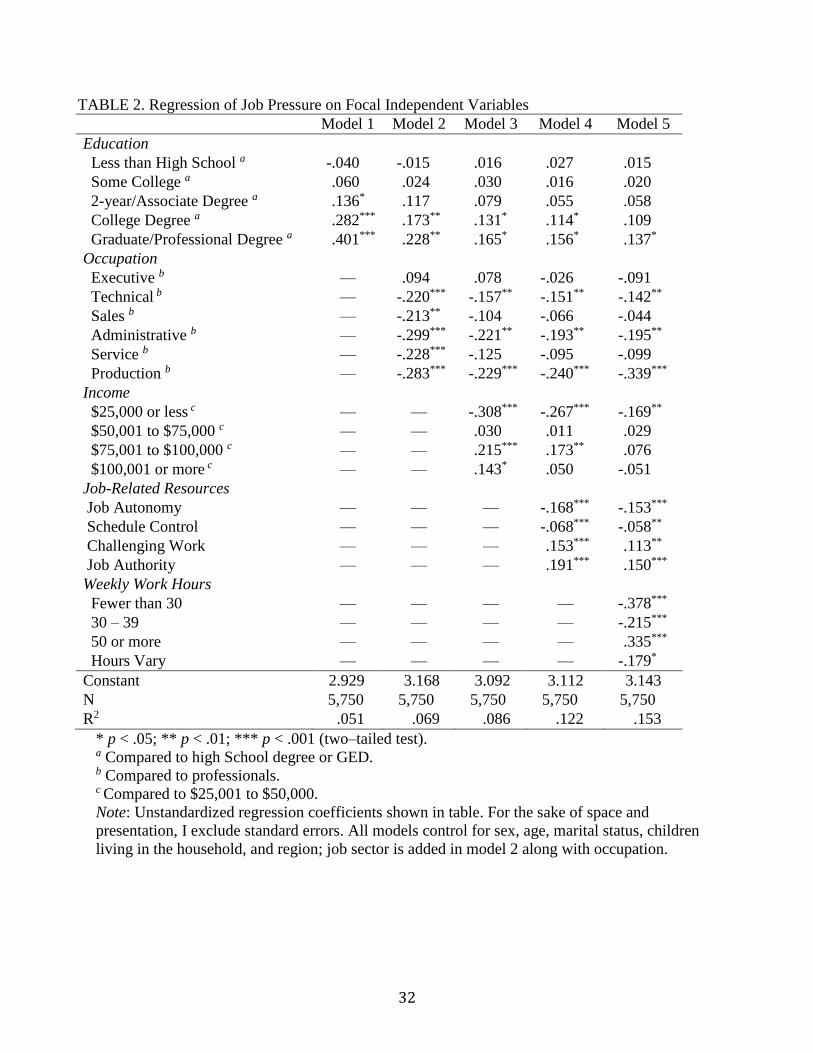
Model 1 in Table 2 shows that the well-educated tend to experience more job pressure
than their less-educated peers. Compared to workers with a high school degree, those with a 2-
year/Associate degree, a 4-year university degree, or a graduate degree report higher levels of job
pressure—and these education-based differences are quite linear. The inclusion of occupation in
model 2, however, influences the size of these initial education estimates. Compared to people in
professional occupations, each of the following occupation groups reports lower levels of job
pressure: technical, sales, administrative, service, and production. Moreover, the well-educated
tend to cluster in higher status occupations (e.g., executive or professional), which, in turn,
contributes to their greater exposure to job pressure.9 Comparing models 1 and 2, the difference
between high school versus university or graduate degree decreases by 39 and 43 percent,
9 The following are percentages within each education group with occupations that are classified as either executive
or professional: post-graduate, 80 percent; a 4-year university degree, 40 percent; a 2-year/Associate’s degree, 25
percent; some college, 23 percent; high school, 14 percent; and less than high school, 9 percent.
16
respectively, but those education contrasts remain statistically significant; however, the
difference between those with high school versus a 2-year/Associate degree is no longer
significant. Together, models 1 and 2 demonstrate that education-based differences in occupation
account for a substantial portion of education-based differences in exposure to job pressure.
[INSERT TABLE 2 ABOUT HERE]
Model 3 reveals non-linear differences in levels of job pressure across income groups.
Compared to workers in the reference category ($25,001 to $50,000), workers earning $25,000
or less report a lower average level of job pressure. In fact, the steepest increase in average levels
of job pressure occurs between these two lowest earning groups. By contrast, compared to the
reference group, workers in the two highest income groups report higher levels of pressure—
with peak levels among those earning between $75,001 and $100,000. Comparing models 2 and
3, the inclusion of income further contributes to education differences in job pressure, but these
differences still remain significant (but they are reduced to the p < .05 level). In addition, the
occupation-based differences are diminished; that is, adjusting for their higher earnings helps to
explain why professionals’ report more job pressure relative to the other occupation groups.10
Net of income, contrasts between professionals and both the sales and service categories are no
longer statistically significant. Taken together, model 1 – 3 in Table 2 reveal sizeable overlap
among the three core indicators of socioeconomic status in their associations with job pressure—
and these patterns also demonstrate that the well-educated tend to experience more job pressure
because of their higher status occupations (e.g., executive or professional) and higher earnings.
Turning to the effects of job resources, model 4 indicates that each of four resources is
associated with levels of pressure—but in considerably different ways. On the one hand, job
10 Thirty-one percent of professionals earn more than $75,000 per year. By contrast, only 10 percent of all of the
other occupation groups (excluding executives) earn more than $75,000 per year.
17
autonomy and schedule control function more like “resources” in their negative associations with
pressure. By contrast, challenging work and job authority are associated positively with levels of
job pressure—patterns that contradict their characterization as “resources” and are instead more
consistent with the stress of higher status. In addition, workers with a 4-year/university degree or
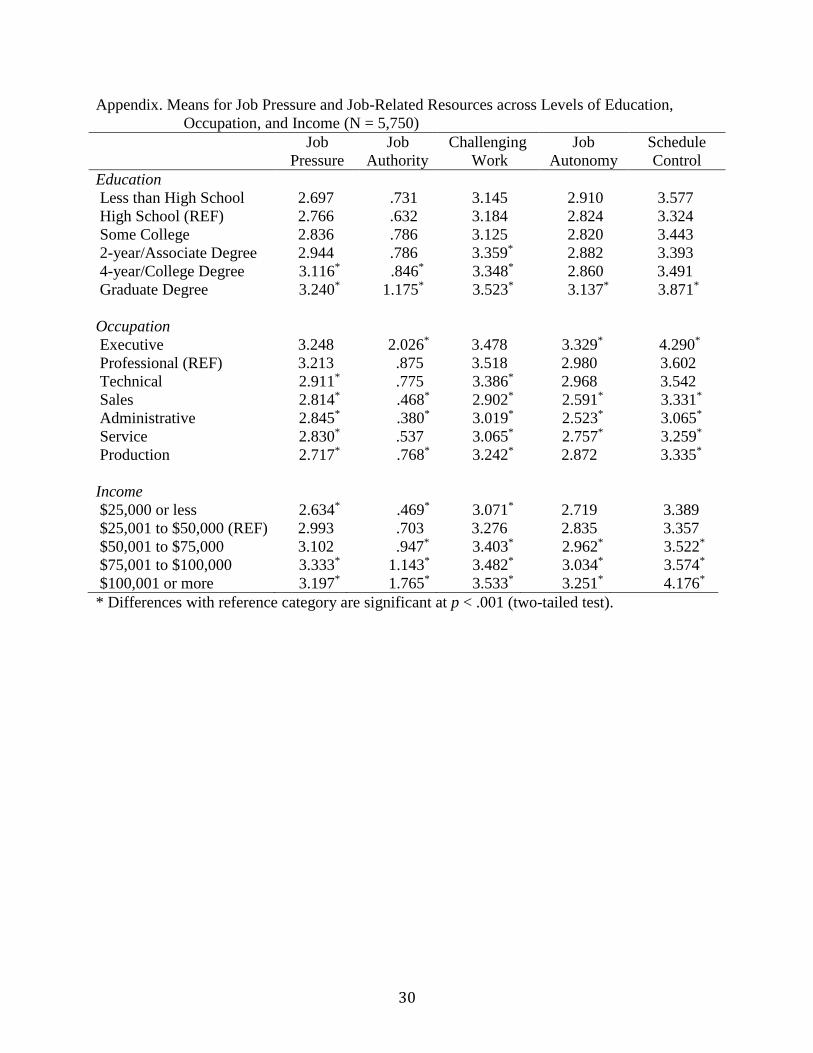
higher tend to report more job authority and challenging work (see Appendix), which, in turn,
further accounts for their higher levels of pressure—but statistically significant education
differences remain. Moreover, the highest earners tend to occupy jobs with more authority and
challenging work (see Appendix), which reduces the coefficient for the highest earners from .143
to .050 to statistical non-significance. The other two income contrasts from model 3 are both
diminished somewhat but remain statistically significant. In addition, it is worth underscoring the
fact that challenging work and authority are associated with greater job pressure net of income;
in fact, separate analyses (not shown) reveal that most of the influence of challenging work and
authority occurs independently of earnings. Likewise, job autonomy and schedule control have
negative associations with job pressure independent of their link to higher income. Collectively,
my findings demonstrate that the influence of these four job-related “resources” is quite different
and largely independent from their association with the rewards of higher earnings.
In model 5, I adjust for work hours in order to assess its potential confounding influence
on the patterns observed in the previous models. Work hours are associated with more job
pressure, with the highest level of pressure observed among individuals who work the longest
hours. Overall, the coefficients for job autonomy, schedule control, challenging work, and
authority remain relatively stable net of work hours. However, the income-based differences in
job pressure are diminished. The difference between the two lowest earning groups is reduced
from -.267 to -.169 but remains significant at the p < .01 level; this reduction is due to the fact

18
that the lowest earners are less likely to work long hours than those in the income bracket above
them (see Appendix). Likewise, the higher level of job pressure among those earning between
$75,001 and $100,000 is due to their greater likelihood of working longer hours; this is evident
in the reduction of the associated coefficient from .172 (model 4) to .077 (model 5).11
Discussion
Using data from a 2011 nationally representative sample of Canadian workers, this study
tested the resource hypothesis versus the stress of higher status hypothesis. As I described above,
the scholars involved in the development of the JD-R model explicitly asserted: “job resources
reduce job demands” (Bakker & Demerouti 2007, p. 312). Based on that declaration, I proposed
the resource hypothesis, which predicted that if job resources actually do reduce job demands
then my analyses should have demonstrated that each resource is associated with less job
pressure. My findings indicate partial support for the resource hypothesis: Job autonomy and
schedule control are associated with less exposure to job pressure. By contrast, however, I also
found some evidence to support the stress of higher status hypothesis: Job authority and
challenging work are associated with elevated levels of job pressure. Taken together, these
observations underscore the importance of further advancing the conceptual and empirical
distinctions among job autonomy, schedule control, job authority, and challenging work.
The discovery of these divergent patterns is a main contribution of the present study. And
yet, I acknowledge that some critics might doubt the validity of my initial characterization of job
authority and challenging work as “resources”—and perhaps even whether or not such a
11 For the sake of space and clarity of presentation of focal patterns, I exclude from the tables the results for the
control variables. Several patterns are observed: (1) women report more job pressure than men; (2) the youngest and
oldest have less pressure than workers in their middle years; (3) the married have more pressure than the never
married; and (4) Ontario residents report more pressure than residents in Quebec and the Atlantic region.

19
characterization legitimately follows from the conceptual specifications set forth in the JD-R
model. As a response, it is constructive to reiterate the definition of resources as explicitly
outlined by the proponents of the JD-R model: “Job resources refer to the physical,
psychological, social, or organizational aspects of the work context that are either/or: (1)
Functional in achieving work goals; (2) Reduce job demands and their associated physiological
and psychological costs; (3) Stimulate personal growth, learning, and development” (see Bakker
& Demerouti, 2007, p. 312). The core elements of challenging work—jobs that require learning
new things, engaging in creative activities, using skills and abilities, and task variety—epitomize
this very definition of a highly desirable job-related resource (Bakker & Geurts, 2004; Carayon
& Zijlstra, 1999; Ganster, 1988; Mirowsky & Ross, 2003; Voydanoff, 2007). Likewise, scholars
have characterized job authority as “a highly coveted resource” (Smith, 2002, p. 511)—an apt
description given job authority’s clear connection with other favorable conditions like autonomy,
schedule control, greater pay, and advancement opportunities (Kalleberg, 2011; Tausig &
Fenwick, 2011). In sum, challenging work and control over other people are job-related
resources that are also associated with greater exposure to job demands—but we should not
mistakenly use this empirical connection as a basis for redefining these resources as demands.
An additional direction of conceptual reflection connects with the ways that scholars have
articulated differences between “challenge stressors” and “hindrance stressors” (Cavanaugh,
Boswell, Roehling, & Boudreau, 2000; Crawford, LePine, & Rich, 2010; LePine, Podsakoff, &
LePine, 2005; Podsakoff, LePine, & LePine, 2007; Webster, Beehr, & Love, 2011). This
“challenge-hindrance” literature implies that the JD-R model’s conceptualization of job demands
is “too homogenous” and, in response, seeks to identify qualitative distinctions within the
broader category of job demands (Podsakoff et al., 2007). Specifically, this literature suggests
20
that demands that “hinder optimal functioning” should be labeled “job hindrances,” while
demands that “require some energy, but are nonetheless stimulating” should be labeled “job
challenges” (see Van den Broeck et al., 2010, p. 736). In my view, the question of whether or not
the JD-R model’s demands category is “too homogenous” is not the central concern. Rather, I
argue that the ways these concepts have been articulated and tested is inaccurate. One of my
fundamental concerns involves the ways that the “challenge stressor” and “hindrance stressor”
conceptualizations blend the independent and dependent variables. If a job characteristic is
associated with poor health or problems in functioning then it is labeled a “hindrance stressor.”
By contrast, if a job characteristic is stimulating then it is labeled a “challenge stressor.” These
labels blur the lines between the job attribute and the consequences that flow from it. A related
problem entails references in this literature to “stimulating demands” as “resources.”
The conceptual fuzziness of demands and resources in the challenge-hindrance model is
problematic on many levels. The model obscures key distinctions between demands and
resources—and, instead, characterizes them as all different kinds of demands. In the present
study, I argue that job authority and challenging work are “resources”—and that job pressure is a
“demand.” By contrast, as I understand it, the “challenge-hindrance” framework claims that all
three—job authority, challenging work, and job pressure—should be labeled “challenge
demands” (or “challenge stressors”). A more reasonable approach is to simply measure job
characteristics, label them just as they are (i.e., “autonomy”), and then evaluate the ways that
they are empirically associated with various outcomes. The additional layer of conceptual labels
of these job characteristics in the “challenge-hindrance” literature is not justified or useful.
Switching focus, I would like to address one final point about my observations. Although
education is not among the core set of research questions that deal directly with job resources
21
and their links to pressure, my findings underscore the importance of education as a key
antecedent in these processes. The patterns also provide additional support for the stress of
higher status hypothesis: The well-educated tend to report higher levels of job pressure, and this
is mostly attributable to the tendency for the well-educated to have higher occupational status,
earnings, authority, and challenging work. My observations reveal the ways that a core aspect of
status and stratification—one linked with favorable personal, social, and economic outcomes—is
also related to more pressure. These findings contribute to a literature that has mostly ignored the
role of education (for exceptions see Hakanen et al., 2011; Schieman & Glavin, 2011).
Several limitations of this study deserve brief mention. First, the analyses are based on
cross-sectional data—so conclusions about causal ordering are not definitive. However, the
theoretical framework maps directly onto models that articulate sets of interrelationships among
resources and demands. While I have sought to link the analyses to those predictions, I
acknowledge that other models are possible. The central point to emphasize in these findings is
that while the direction of causality is open to debate, the basic patterns of association are
evident and can offer meaningful insights about conventional thinking in the JD-R model. A
second limitation is that, like many of the prior studies cited here, I too rely on the perceptions
and descriptions that study participants provide—not objective accounts. In defense of this
strategy, however, my interest is in the ways that participants experience conditions like the
pressures associated with the amount of work and the time to complete it. It is a subjective
experience—but that is not inconsistent with many of the other job attributes in the JD-R model.
Collectively, most of the job resources and demands involve subjective assessments, but there is
little reason to doubt that responses should generally correspond with the objective conditions in
the workplace. But even if they do not perfectly align with objective conditions, the subjective
22
experience of workers matter too (in fact, they may ultimately be more important for a variety of
outcomes).
Despite these limitations, some of the main observations in this study underscore the
importance of explicitly testing all of the components of the JD-R model and, when necessary
and appropriate, attempting to refine its conceptualizations and revise its core predictions. The
emerging perspective—the stress of higher status—provides some possible paths in that pursuit.
This view does not suggest that workers in lower status occupations have no stress or are
unaffected by unfavorable work contexts and conditions. Indeed, some features of lower status
jobs may be related to rather negative dynamics and consequences. All workers—across all
statuses—are subject to stress exposures. Ultimately, the sum of all stressors in the workplace
may reveal that those with lower status occupations end up the most disadvantaged. And yet, that
possibility does not discount the relevance of the stress of higher status and what it implies for
conventional views of job-related resources, demands, and ultimately, the nature of “work stress”
at all levels and across occupational and organizational contexts.
23
References
Aiken, L. & West, S. (1991). Multiple regression: Testing and interpreting interactions.
Thousand Oaks, CA: Sage.
Babbie, E. (2007). The practice of social research (11th ed). Belmont, CA: Wadsworth.
Bakker, A. B., & Geurts, S. A. E. (2004). Toward a dual-process model of work-home
interference. Work and Occupations, 31, 345–66.
Bakker, A. B., & Demerouti, E. (2007). The job-demands-resources model: state of the art.
Journal of Managerial Psychology, 22, 309–328.
Bakker, A.B., Demerouti, E., & Euwema, M.C. (2005). Job resources buffer the impact of job
demands on burnout. Journal of Occupational Health Psychology, 10, 170-80.
Bakker, A. B., Demerouti, E., & Verbeke, W. (2004). Using the job demands—resources model
to predict burnout and performance. Human Resource Management, 43, 83–104.
Bakker, A. B., Schaufeli, W. B., Leiter, M. P., & Taris, T. W. (2008). Work engagement: an
emerging concept in occupational health psychology. Work and Stress, 22, 187-200.
Bakker, A. B., Hakanen, J. J., Demerouti, E., & Xanthopoulou, D. (2009). Job resources boost
work engagement, particularly when job demands are high. Journal of Educational
Psychology, 99, 274–284.
Bakker, A. B., van Veldoven, M., & Xanthopoulou, D. (2010). Beyond the demand-control
model: Thriving on high job demands and resources. Journal of Personnel Psychology,
9, 3–16.
Bakker, A. B., Shaufeli, W. B., Leiter, M. P., & Taris, T. W. (2008). Work engagement: An
emerging concept in occupational health psychology. Work & Stress, 22, 187-200.
Beehr, T. A., Glaser, K. M., Canali, K. G., & Wallwey, D. (2001). Back to basics: Re-
examination of demand-control theory of occupational stress. Work & Stress, 15, 115-
130.
Bendak, S. (2003). 12-h workdays: current knowledge and future directions. Work & Stress,
17(4), 321-336.
Blair-Loy, M. (2009). Work without end? Scheduling flexibility and work-to-family conflict
among stockbrokers. Work and Occupations, 36, 279–317.
Brett, J. M. & Stroh, L. K. (2003). Working 61 plus hours a week: Why do managers do it?
Journal of Applied Psychology, 88, 67-87.
24
Carayon, P., & Zijlstra, F. (1999). Relationship between job control, work pressure and strain:
Studies in the USA and in The Netherlands. Work & Stress, 13, 32-48.
Cavanaugh, M. A., Boswell, W. R., Roehling, M. V., &b Boudreau, J. W. (2000). An empirical
examination of self-reported work stress among U.S. managers. Journal of Applied
Psychology, 85, 65-74.
Crawford, E. R., LePine, J. A., & Rich, B. L. (2010). Linking job demands and resources to
employee engagement and burnout: a theoretical extension and meta-analytic test.
Journal of Applied Psychology, 95, 834-848.
Curtin, R., Presser, S., & Singer, E. (2000). The effects of response rate changes on the Index of
Consumer Sentiment. Public Opinion Quarterly, 64, 413–28.
Demerouti, E., & Bakker, A.B. (2011). The Job Demands– Resources model: Challenges for
future research. SA Journal of Industrial Psychology, 37.
Demerouti, E., Bakker, A. B., Nachreiner, F., & Schaufeli, W. B. (2001). The job demands:
resources model of burnout. Journal of Applied Psychology, 86, 499–512.
de Lange, A. H., Taris, T. W., Kompier, M. A., Houtman, I. L., & Bongers, P. M. (2003). The
very best of the millennium: Longitudinal research and the demand-control-(support)
model. Journal of Occupational Health Psychology, 8, 282-305.
Diestel, S. & Schmidt, K. H. (2009): Mediator and moderator effects of demands on self-control
in the relationship between work load and indicators of job strain. Work & Stress, 23, 60-
79.
Duxbury, L., Lyons, S., & Higgins, C. (2008). Too much to do, and not enough time: an
examination of role overload. In K. Korabik, D. S. Lero, & D. L. Whitehead (Eds.),
Handbook of work-family integration: research, theory, and best practices. (pp. 125-
140). Academic Press/Elsevier.
Elliott, J. R., & Smith, R. A. (2004). Race, gender, and workplace power. American Sociological
Review, 69, 365-386.
Ganster, D. C. (1988). Improving measures of worker control in occupational stress research. In:
Hurrell, J. J. Jr., Murphy, L. R., Sauter, S. L., editors. Occupational stress: issues and
developments in research. Philadelphia (PA): Taylor and Francis.
Glavin, P., Schieman, S., & Reid, S. (2011). Boundary-spanning work demands and their
consequences for guilt and psychological distress. Journal of Health and Social Behavior
52(1):43-57.
Greenhaus, J. H., Peng, A. C., & Allen, T. D. (2012). Relations of work identity, family identity,
25
situational demands, and sex with employee work hours. Journal of Vocational Behavior,
80, 27-37. (doi:10.1016/j.jvb.2011.05.003)
Groves, R. M. (2006). Nonresponse rates and nonresponse bias in household surveys. Public
Opinion Quarterly, 70, 646–75.
Härmä, M. (2006). Workhours in relation to work stress, recovery and health. Scandinavian
Journal of Work, Environment, and Health, 32, 502–514.
Hackman, J. R., & Lawler, E. E. (1971). Employee reactions to job characteristics. Journal of
Applied Psychology, 55, 259–286.
Hackman, J. R., & Oldham, G. R. (1975). Development of the job diagnostic survey. Journal of
Applied Psychology, 2, 159–170.
Hakanen, J., Schaufeli, W. B., & Ahola, K. (2008). The job demands-resources model: A three-
year cross-lagged study of burnout, depression, commitment, and work engagement.
Work & Stress, 22, 224-241.
Hakanen, J., Bakker, A. B., & Jokisaari, M. (2011). “A 35-year follow-up study on burnout
among Finnish employees.” Journal of Occupational Health Psychology, 16, 3, 345-360.
Häusser, J. A., Mojzisch, A., Niesel, M., & Schulz-Hardt, S. (2010). Ten years on: A review of
recent research on the job demand-control (-support) model and psychological well-
being. Work & Stress, 24, 1-35.
Hughes, E. L, & Parkes, Katherine R. (2007). Work hours and well-being: The roles of work-
time control and work-family interference. Work & Stress, 21(3), 264-278.
Hu, Q., Schaufeli, W. B., Taris, T. W. (2011). The Job Demands–Resources model: An analysis
of additive and joint effects of demands and resources. Journal of Vocational Behavior,
79,181–190.
Jacobs, J. A., & Gerson, K. (2004). The time divide: Work, family, and gender inequality.
Cambridge, MA: Harvard University Press.
Kalleberg, A. L. (2011). Good jobs, bad jobs: The rise of polarized and precarious employment
systems in the United States, 1970s to 2000s. Russell Sage Foundation: New York.
Karasek, R. A. (1979). Job demands, job decision latitude, and mental strain: implications
for job redesign. Administrative Science Quarterly, 24, 285-308.
Karasek, R. A. (1985). Job Content Questionnaire and User’s Guide. Lowell: Department of
Work Environment, University of Massachusetts Lowell.
Karasek, R., Brisson, C., Kawakami, N., Houtman, I., Bongers, P., & Amick, B. (1998). The job
26
content questionnaire (JQC): an instrument for internationally comparative assessments
of psychosocial job characteristics. Journal of Occupational Health Psychology, 3, 322-
55.
Karasek, R., & Theorell, T. (1990). Healthy work: stress, productivity, and the reconstruction of
working life. New York, NY: Basic Books.
Kristensen, T. S., Bjorner, J. B., Christensen, K. B., & Borg, V. (2004). The distinction between
work pace and working hours in the measurement of quantitative demands at work. Work
and Stress, 18, 305-322.
Kristensen, T. S., Borg, V., & Hannertz, H. (2002). Socioeconomic status and psychosocial work
environment. Results from a national Danish study. Scandinavian Journal of Public
Health, 30, 41-48.
LePine, J. A., Podsakoff, N. P. & LePine, M. A. (2005). A meta-analytic test of the challenge-
stressor-hindrance stressor framework: an explanation for inconsistent relationships
among stressors and performance. Academy of Management Journal, 48, 764-775.
Maume, D. J. & Bellas, M. L. (2001). The overworked American or the time bind? Assessing
competing explanations for time spent in paid labor. American Behavioral Scientist, 44,
1137-1156.
Maume, D. J., & Purcell, D. (2007). The ‘over-paced' American: recent trends in the
intensification of work. Research in the Sociology of Work, 17, 251-283.
Mauno, S., Kinnunen, U., & Ruokolainen, M. (2007). Job demands and resources as antecedents
of work engagement: A longitudinal study. Journal of Vocational Behavior, 70, 149–171.
McLeod, J. D., & Nonnemaker, J. M. (1999). Social stratification and inequality. In C. S.
Aneshensel & J. C. Phelan (Eds.), Handbook of the sociology of mental health (pp. 321-
344). New York: Kluwer Academic.
Mennino, S. F., Rubin, B. A., & Brayfield, A. (2005). Home-to-job and job-to-home spillover:
the impact of company policies and workplace culture. Sociological Quarterly, 46, 107-
35.
Merkle, D., & Edelman, M. (2002). Nonresponse in exit polls: a comprehensive analysis. In
Survey Nonresponse, ed. R. M. Groves, D. A. Dillman, J. L. Eltinge, & R. J. A. Little, pp.
243–58. New York: Wiley.
Mirowsky, J. (1999). Analyzing associations between mental health and social circumstances. In
C. S. Aneshensel & J. C. Phelan (Eds.), Handbook of the sociology of mental health (pp.
105-126). New York: Kluwer Academic.
Mirowsky, J., & Ross, C. E. (2003). The social causes of psychological distress (2nd ed.). New

27
York: Aldine Transaction.
Mirowsky, J., & Ross, C. E. (2007). Creative work and health. Journal of Health and Social
Behavior, 48, 385–403.
Mueller, Charles W. and Toby L. Parcel. 1986. “Ascription, Dimensions of Authority, an
Earnings: The Case of Supervisors.” Research in Social Stratification and Mobility,
volume 5:199-222.
Padsakoff, N. P., LePine, J. A., & LePine, M. A. (2007). Differential Challenge Stressor-
Hindrance Stressor Relationships with job attitudes, turnover intentions, turnover, and
withdrawal behavior: a meta-analysis. Journal of Applied Psychology, 92, 438-454.
Pearlin, L I. (1999). The stress process revisited: reflections on concepts and their
interrelationships. In C. S. Aneshensel and J. C. Phelan (Eds.) The handbook of the
sociology of mental health (pp. 395-415). New York: Kluwer.
Podsakoff, P. M., MacKenzie, S. B., Lee, J. L., & Podsakoff, N. P. (2003). Common method
biases in behavioral research: A critical view of the literature and recommended
remedies. Journal of Applied Psychology, 88, 879–903.
Reskin, B. F., & Ross, C. E. (1992). Jobs, authority, and earnings among managers. Work and
Occupations, 19, 342-365.
Ross, C. E., & Wright, M. P. (1998). Women’s work, men’s work, and the sense of control.
Work and Occupations, 25, 333-355.
Saks, A. M. (2006). Antecedents and consequences of employee engagement. Journal of
Managerial Psychology, 21, 600–619.
Schaufeli, W. B., & Bakker, A. B. (2004). Job demands, job resources, and their relationship
with burnout and engagement: a multi-sample study. Journal of Organizational Behavior
25:293–315.
Schieman, S., Kurashina, Y., & Van Gundy, K. (2006). The nature of work and the stress of
higher status. Journal of Health and Social Behavior, 47, 242-257.
Schieman, S., & Glavin, P. (2011). Education and work-family conflict: explanations,
contingencies and mental health consequences. Social Forces, 89, 1341-1362.
Schieman, S., & Plickert, G. (2008). How knowledge is power: explaining the association
between education and the sense of control. Social Forces, 87, 153-84.
Schieman, S., & Reid, S. (2008). Job authority and interpersonal conflict in the workplace. Work
and Occupations, 35, 296-326.
Schieman, S., & Reid, S. (2009). Job authority and health: unraveling the competing suppression
28
and explanatory influences. Social Science and Medicine, 69, 1616-24.
Schieman, S., & Young, M. (2010). The demands of creative work: implications for stress in the
work-family interface. Social Science Research, 39, 246-59.
Smith, R. A. (2002). Race, gender, and authority in the workplace: Theory and research. Annual
Review of Sociology, 28, 509-542.
Smith, R. A., & Elliott, J. R. (2002). Does ethnic concentration influence employees’ access to
authority? An examination of contemporary urban labor markets. Social Forces, 81, 255-
279.
Steinmetz, H., & Schmidt, P. (2010). Subjective health and its relationship with working time
variables and job stressors: Sequence or general factor model? Work & Stress, 24(2),
159-
178.
Tausig, M., & Fenwick, R. (2001). Unbinding time: alternate work schedules and work-life
balance. Journal of Family and Economic Issues, 22, 101–19.
Tausig, M., & Fenwick, R. (2011). Work and mental health in social context. Springer: New
York.
van den Broeck, A., Vansteenkiste, M., De Witte, H., & Lens, W. (2008). Explaining the
relationships between job characteristics, burnout, and engagement: The role of basic
psychological need satisfaction. Work & Stress, 22, 277-294.
van der Hulst, M., Geurts, S. (2001). Associations between overtime and psychological health in
high and low reward jobs. Work & Stress, 15, 227-240.
van der Doef, M., & Maes, S. (1999). The job demand-control (-support) model and
psychological well-being: A review of 20 years of empirical research. Work & Stress, 13,
87-114.
van der Hulst, M., Veldhoven, M., Beckers, D. (2006). Overtime and need for recovery to job
demands and job control. Journal of Occupational Health, 48, 11–19.
Voydanoff, P. (2005). Consequences of boundary-spanning demands and resources for work-to-
family conflict and perceived stress. Journal of Occupational Health Psychology, 10,
491-503.
Webster, J. R., Beehr, T. A., & Love, K. (2011). Extending the challenge-hindrance model of
occupational stress: the role of appraisal. Journal of Vocational Behavior, 79, 505-516.
Winship, C., & Mare, R. D. (1992). Models for sample selection bias. Annual Review of
Sociology 18:327-50.
29
Xanthopoulou, D., Bakker, A. B., Demerouti, E., Schaufeli, W. B. (2009). Reciprocal
relationships between job resources, personal resources, and work engagement. Journal
of Vocational Behavior, 74, 235–244
30
Appendix. Means for Job Pressure and Job-Related Resources across Levels of Education,
Occupation, and Income (N = 5,750)
Job
Pressure
Job
Authority
Challenging
Work
Job
Autonomy
Schedule
Control
Education
Less than High School 2.697 .731 3.145 2.910 3.577
High School (REF) 2.766 .632 3.184 2.824 3.324
Some College 2.836 .786 3.125 2.820 3.443
2-year/Associate Degree 2.944 .786 3.359* 2.882 3.393
4-year/College Degree 3.116* .846* 3.348* 2.860 3.491
Graduate Degree 3.240* 1.175* 3.523* 3.137* 3.871*
Occupation
Executive 3.248 2.026* 3.478 3.329* 4.290*
Professional (REF) 3.213 .875 3.518 2.980 3.602
Technical 2.911* .775 3.386* 2.968 3.542
Sales 2.814* .468* 2.902* 2.591* 3.331*
Administrative 2.845* .380* 3.019* 2.523* 3.065*
Service 2.830* .537 3.065* 2.757* 3.259*
Production 2.717* .768* 3.242* 2.872 3.335*
Income
$25,000 or less 2.634* .469* 3.071* 2.719 3.389
$25,001 to $50,000 (REF) 2.993 .703 3.276 2.835 3.357
$50,001 to $75,000 3.102 .947* 3.403* 2.962* 3.522*
$75,001 to $100,000 3.333* 1.143* 3.482* 3.034* 3.574*
$100,001 or more 3.197* 1.765* 3.533* 3.251* 4.176*
* Differences with reference category are significant at p < .001 (two-tailed test).
31
TABLE 1. Distribution of Job Pressure Items
Job Pressure Items
“In the past three months, how often did you feel
overwhelmed by how much you had to do at work?”
(1) Never 15.31a
(2) Rarely 23.32
(3) Sometimes 32.15
(4) Often 18.61
(5) Very Often 10.61
“In the past three months, how often did you have to work
on too many tasks at the same time?”
(1) Never 13.54
(2) Rarely 19.84
(3) Sometimes 25.99
(4) Often 22.94
(5) Very Often 17.69
“In the past three months, how often did the demands of
your job exceed the time you have to do the work?”
(1) Never 17.39
(2) Rarely 22.82
(3) Sometimes 25.40
(4) Often 19.27
(5) Very Often 15.12
Job Pressure Index Mean
Standard Deviation
2.965
1.096
a All numbers for the response categories reflect weighted percentages.
32
TABLE 2. Regression of Job Pressure on Focal Independent Variables
Model 1 Model 2 Model 3 Model 4 Model 5
Education
Less than High School a -.040 -.015 .016 .027 .015
Some College a .060 .024 .030 .016 .020
2-year/Associate Degree a .136* .117 .079 .055 .058
College Degree a .282*** .173** .131* .114* .109
Graduate/Professional Degree a .401*** .228** .165* .156* .137*
Occupation
Executive b — .094 .078 -.026 -.091
Technical b — -.220*** -.157** -.151** -.142**
Sales b — -.213** -.104 -.066 -.044
Administrative b — -.299*** -.221** -.193** -.195**
Service b — -.228*** -.125 -.095 -.099
Production b — -.283*** -.229*** -.240*** -.339***
Income
$25,000 or less c — — -.308*** -.267*** -.169**
$50,001 to $75,000 c — — .030 .011 .029
$75,001 to $100,000 c — — .215*** .173** .076
$100,001 or more c — — .143* .050 -.051
Job-Related Resources
Job Autonomy — — — -.168*** -.153***
Schedule Control — — — -.068*** -.058**
Challenging Work — — — .153*** .113**
Job Authority — — — .191*** .150***
Weekly Work Hours
Fewer than 30 — — — — -.378***
30 – 39 — — — — -.215***
50 or more — — — — .335***
Hours Vary — — — — -.179*
Constant 2.929 3.168 3.092 3.112 3.143
N 5,750 5,750 5,750 5,750 5,750
R2 .051 .069 .086 .122 .153
* p < .05; ** p < .01; *** p < .001 (two–tailed test). a Compared to high School degree or GED. b Compared to professionals. c Compared to $25,001 to $50,000.
Note: Unstandardized regression coefficients shown in table. For the sake of space and
presentation, I exclude standard errors. All models control for sex, age, marital status, children
living in the household, and region; job sector is added in model 2 along with occupation.