Embed Size (px)
Citation preview
NOVEMBER 2017FREE TO NACE MEMBERS
$52.00 NONMEMBER PRICE
JOB OUTLOOK 2018
NATIONAL ASSOCIATION OF COLLEGES AND EMPLOYERS62 Highland Avenue, Bethlehem, PA 18017 | www.naceweb.org | 610,868.1421
ABOUT THE SURVEY ................................................................................................. 2
U.S. COLLEGE HIRING TO INCREASE BY 4 PERCENT ............................................. 3Job market ratings shifting from “good” to “very good”Little change in reassessing hiring plansFall vs. spring recruitingHiring by industryHiring by region
WHO IS IN DEMAND? ............................................................................................... 13 Demand by degree levelTop majors in demandHiring of international students continues decline
HOW EMPLOYERS VIEW CANDIDATES .................................................................. 28Resume attributesHow employers decide between two equally qualified candidatesCareer readiness
COMPENSATION AND SIGNING BONUSES ........................................................... 34Starting salariesSigning bonuses
WHAT’S AHEAD FOR THE CLASS OF 2018 ............................................................ 39
APPENDIX ................................................................................................................. 40Participating organizations
JOB OUTLOOK 2018 | 1
TABLE OF CONTENTS
©2017 National Association of Colleges and Employers. All rights reserved.
The Job Outlook survey is a forecast of hiring intentions of employers as they relate to new college graduates. Each year, the National Association of Colleges and Employers (NACE) surveys its employer members about their hiring plans and other employment-related issues in order to project the market for new college graduates for the current class and to assess a variety of conditions that may influence that market.
From August 9, 2017, through October 2, 2017, data were collected for the Job Outlook 2018 survey. A total of 201 surveys were returned—a 20.5 percent response rate.
Of those responding, 14.4 percent of respondents were from the West, 25.9 percent were from the Northeast, 23.9 percent were from the Southeast, and 35.8 percent were from the Midwest. For a breakdown of respondents by industry and size, and a partial list of organizations that supplied data for this report, see the Appendix.
Please note: Totals throughout the report may not equal 100 percent due to rounding.
NACE expects to provide a formal update of job market information once more in the 2017-18 academic year: The Job Outlook 2018 Spring Update (data collected in February – March) will give NACE members a final update on hiring for 2017-18 graduates. Results will be available in early April.
Research
Director of Research, Public Policy, and Legislative Affairs: Edwin W. Koc
Research Manager: Andrea J. Koncz
Research Associate: Louisa Eismann
Research Assistant: Anna Longenberger
JOB OUTLOOK 2018 | 2
ABOUT THE SURVEY
U.S. COLLEGE HIRING TO INCREASE 4 PERCENT
JOB OUTLOOK 2018 | 3
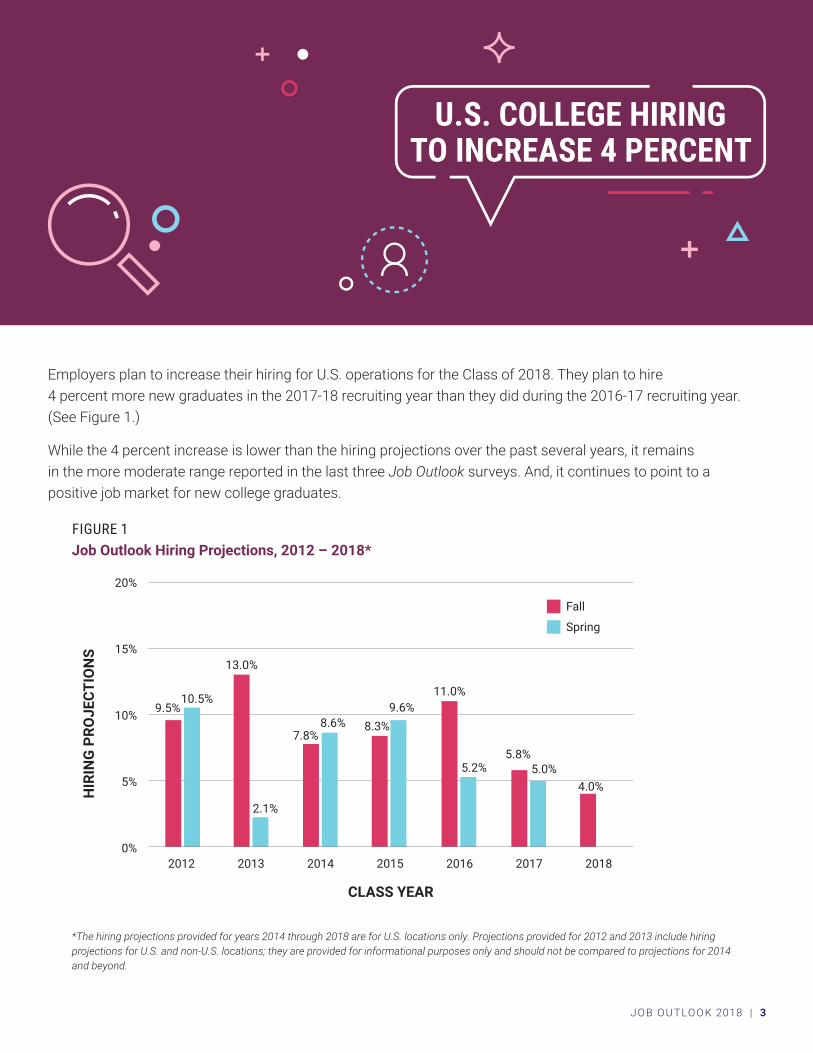
Employers plan to increase their hiring for U.S. operations for the Class of 2018. They plan to hire 4 percent more new graduates in the 2017-18 recruiting year than they did during the 2016-17 recruiting year. (See Figure 1.)
While the 4 percent increase is lower than the hiring projections over the past several years, it remains in the more moderate range reported in the last three Job Outlook surveys. And, it continues to point to a positive job market for new college graduates.
FIGURE 1Job Outlook Hiring Projections, 2012 – 2018*
*The hiring projections provided for years 2014 through 2018 are for U.S. locations only. Projections provided for 2012 and 2013 include hiring projections for U.S. and non-U.S. locations; they are provided for informational purposes only and should not be compared to projections for 2014 and beyond.
2012 2013
CLASS YEAR
HIR
ING
PRO
JECT
ION
S
2014 2015 2016 2017 2018
20%
15%
10%
5%
0%
4.0%5.0%
5.8%5.2%
11.0%9.6%
8.3%8.6%7.8%
13.0%
Fall
Spring
2.1%
10.5%9.5%
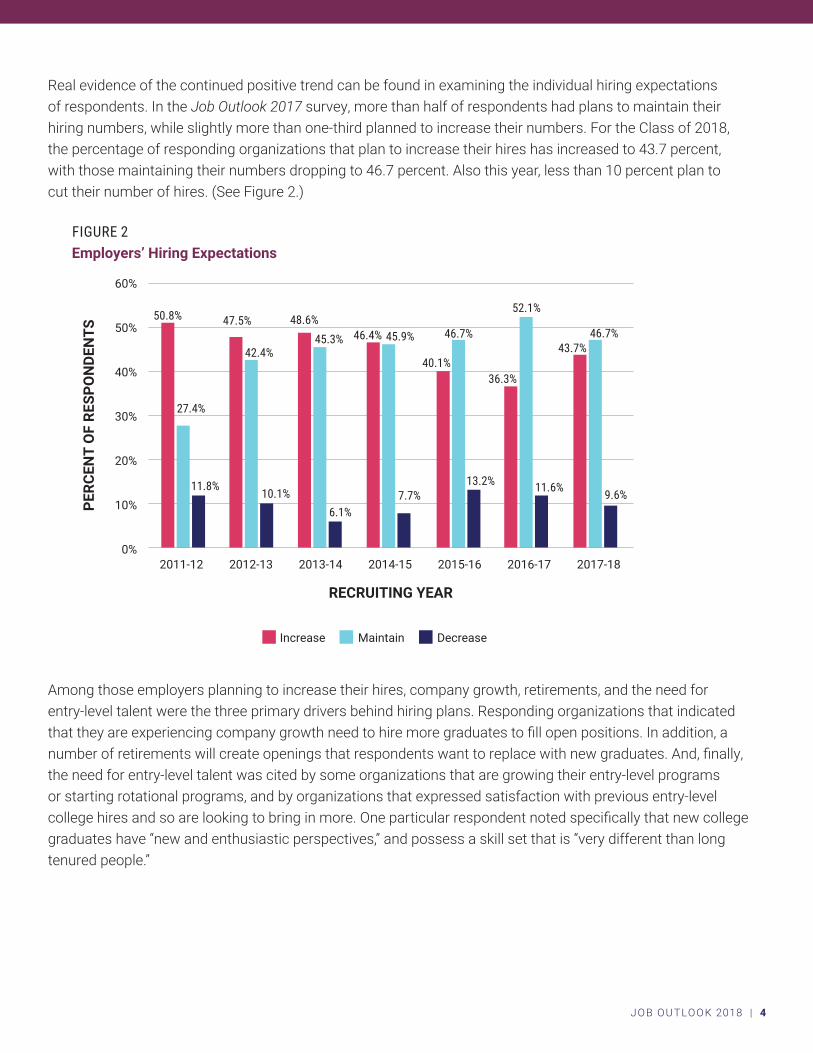
FIGURE 2Employers’ Hiring Expectations
2011-12 2012-13
RECRUITING YEAR
PERC
ENT
OF
RESP
ON
DEN
TS
2013-14 2014-15 2015-16 2016-17 2017-18
60%
50%
40%
30%
20%
10%
0%
9.6%
46.7%43.7%
11.6%
52.1%
13.2%
40.1%
46.7%
36.3%
45.9%46.4%45.3%
6.1%7.7%
48.6%
42.4%
10.1%
47.5%
27.4%
11.8%
50.8%
Increase Maintain Decrease
JOB OUTLOOK 2018 | 4
Real evidence of the continued positive trend can be found in examining the individual hiring expectations of respondents. In the Job Outlook 2017 survey, more than half of respondents had plans to maintain their hiring numbers, while slightly more than one-third planned to increase their numbers. For the Class of 2018, the percentage of responding organizations that plan to increase their hires has increased to 43.7 percent, with those maintaining their numbers dropping to 46.7 percent. Also this year, less than 10 percent plan to cut their number of hires. (See Figure 2.)
Among those employers planning to increase their hires, company growth, retirements, and the need for entry-level talent were the three primary drivers behind hiring plans. Responding organizations that indicated that they are experiencing company growth need to hire more graduates to fill open positions. In addition, a number of retirements will create openings that respondents want to replace with new graduates. And, finally, the need for entry-level talent was cited by some organizations that are growing their entry-level programs or starting rotational programs, and by organizations that expressed satisfaction with previous entry-level college hires and so are looking to bring in more. One particular respondent noted specifically that new college graduates have “new and enthusiastic perspectives,” and possess a skill set that is “very different than long tenured people.”
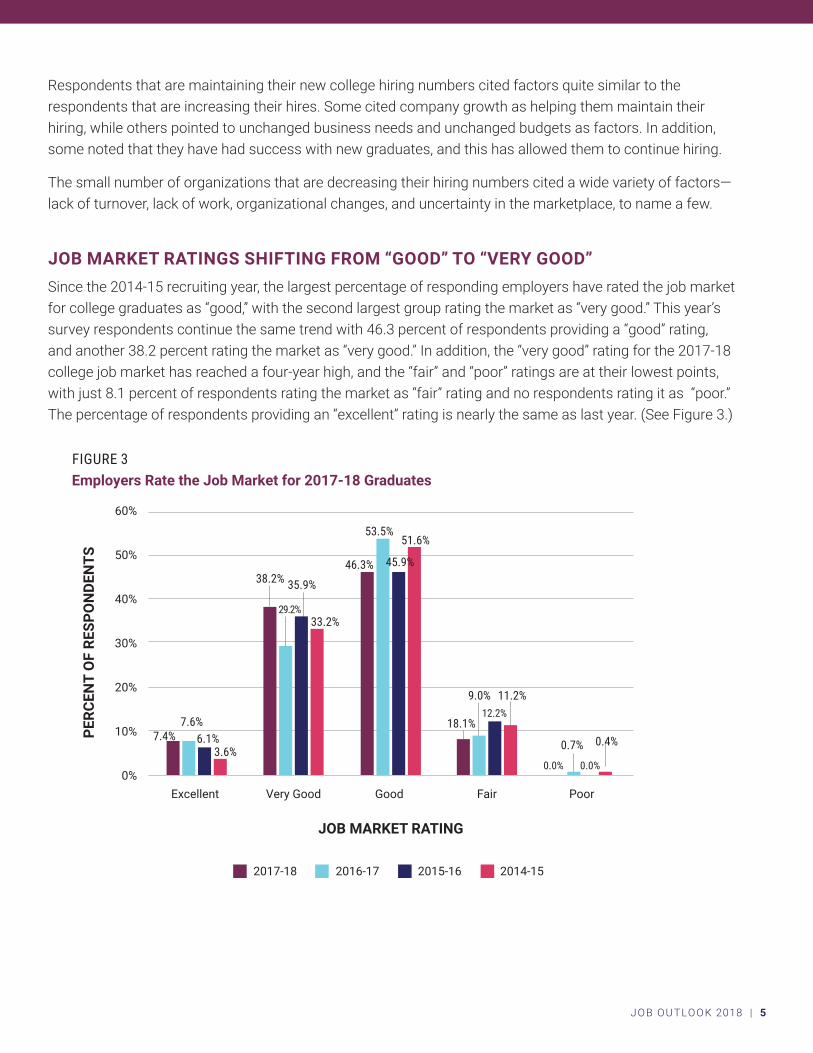
FIGURE 3Employers Rate the Job Market for 2017-18 Graduates
2017-18 2016-17 2015-16 2014-15
JOB MARKET RATING
Excellent
PERC
ENT
OF
RESP
ON
DEN
TS
Very Good Good Fair Poor
60%
50%
40%
30%
20%
10%
0%
7.4%7.6%
3.6%6.1%
38.2% 35.9%
46.3%
53.5%51.6%
45.9%
29.2%33.2%
12.2%11.2%
0.0% 0.0%
0.7% 0.4%
9.0%
18.1%
JOB OUTLOOK 2018 | 5
Respondents that are maintaining their new college hiring numbers cited factors quite similar to the respondents that are increasing their hires. Some cited company growth as helping them maintain their hiring, while others pointed to unchanged business needs and unchanged budgets as factors. In addition, some noted that they have had success with new graduates, and this has allowed them to continue hiring.
The small number of organizations that are decreasing their hiring numbers cited a wide variety of factors— lack of turnover, lack of work, organizational changes, and uncertainty in the marketplace, to name a few.
JOB MARKET RATINGS SHIFTING FROM “GOOD” TO “VERY GOOD” Since the 2014-15 recruiting year, the largest percentage of responding employers have rated the job market for college graduates as “good,” with the second largest group rating the market as “very good.” This year’s survey respondents continue the same trend with 46.3 percent of respondents providing a “good” rating, and another 38.2 percent rating the market as “very good.” In addition, the “very good” rating for the 2017-18 college job market has reached a four-year high, and the “fair” and “poor” ratings are at their lowest points, with just 8.1 percent of respondents rating the market as “fair” rating and no respondents rating it as “poor.” The percentage of respondents providing an “excellent” rating is nearly the same as last year. (See Figure 3.)
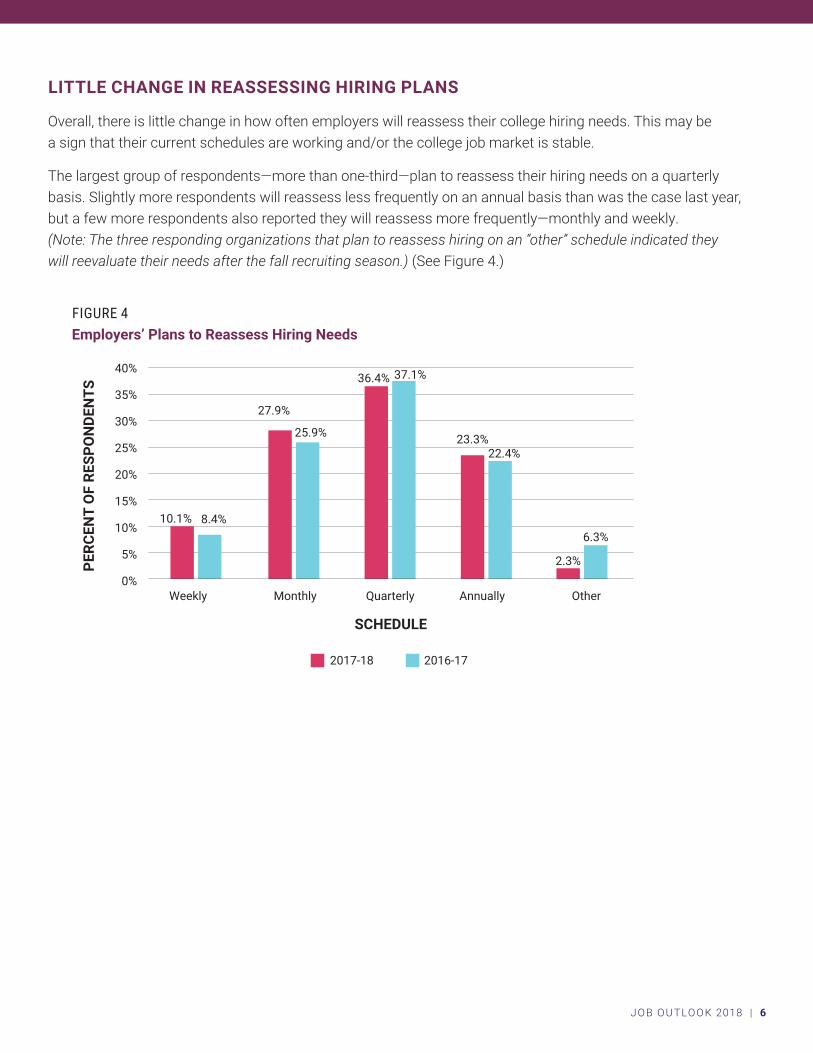
FIGURE 4Employers’ Plans to Reassess Hiring Needs
Weekly Monthly
SCHEDULE
PERC
ENT
OF
RESP
ON
DEN
TS
Quarterly Annually Other
40%
35%
30%
25%
20%
15%
10%
5%
0%
2017-18 2016-17
8.4%
25.9%
37.1%
22.4%
6.3%10.1%
27.9%
36.4%
23.3%
2.3%
JOB OUTLOOK 2018 | 6
LITTLE CHANGE IN REASSESSING HIRING PLANS
Overall, there is little change in how often employers will reassess their college hiring needs. This may be a sign that their current schedules are working and/or the college job market is stable.
The largest group of respondents—more than one-third—plan to reassess their hiring needs on a quarterly basis. Slightly more respondents will reassess less frequently on an annual basis than was the case last year, but a few more respondents also reported they will reassess more frequently—monthly and weekly. (Note: The three responding organizations that plan to reassess hiring on an “other” schedule indicated they will reevaluate their needs after the fall recruiting season.) (See Figure 4.)
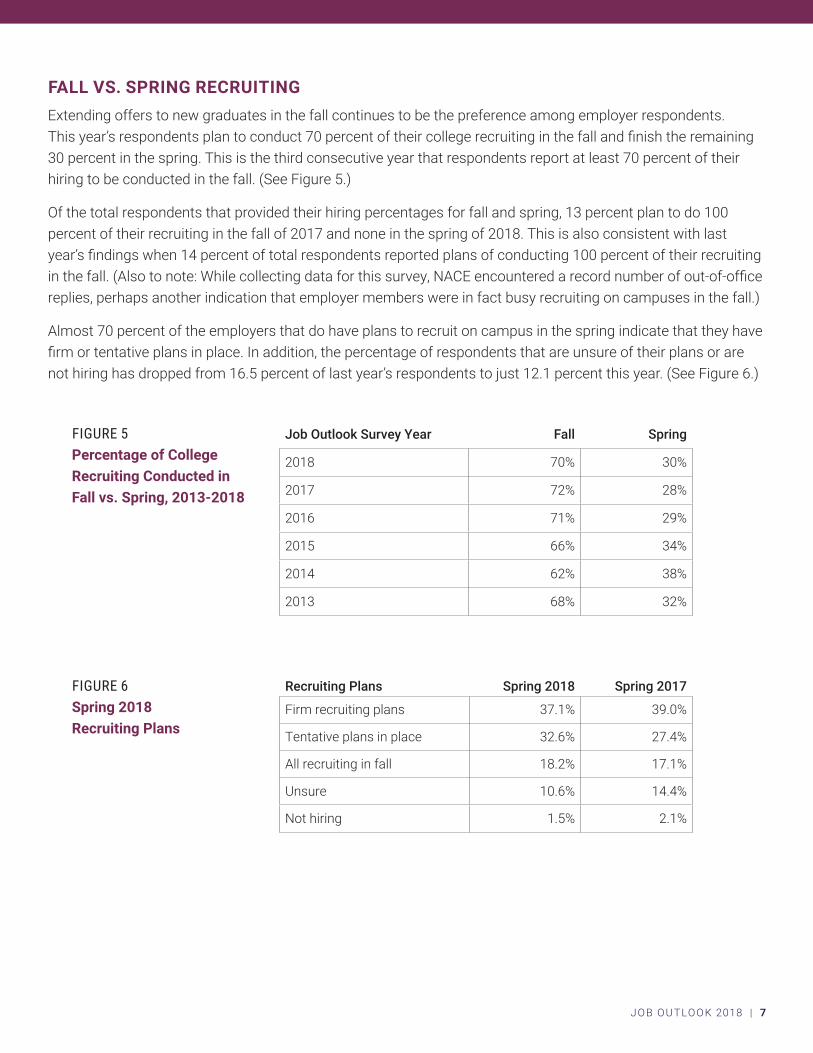
FALL VS. SPRING RECRUITINGExtending offers to new graduates in the fall continues to be the preference among employer respondents. This year’s respondents plan to conduct 70 percent of their college recruiting in the fall and finish the remaining 30 percent in the spring. This is the third consecutive year that respondents report at least 70 percent of their hiring to be conducted in the fall. (See Figure 5.)
Of the total respondents that provided their hiring percentages for fall and spring, 13 percent plan to do 100 percent of their recruiting in the fall of 2017 and none in the spring of 2018. This is also consistent with last year’s findings when 14 percent of total respondents reported plans of conducting 100 percent of their recruiting in the fall. (Also to note: While collecting data for this survey, NACE encountered a record number of out-of-office replies, perhaps another indication that employer members were in fact busy recruiting on campuses in the fall.)
Almost 70 percent of the employers that do have plans to recruit on campus in the spring indicate that they have firm or tentative plans in place. In addition, the percentage of respondents that are unsure of their plans or are not hiring has dropped from 16.5 percent of last year’s respondents to just 12.1 percent this year. (See Figure 6.)
JOB OUTLOOK 2018 | 7
FIGURE 5Percentage of College Recruiting Conducted in Fall vs. Spring, 2013-2018
Job Outlook Survey Year Fall Spring
2018 70% 30%
2017 72% 28%
2016 71% 29%
2015 66% 34%
2014 62% 38%
2013 68% 32%
FIGURE 6Spring 2018 Recruiting Plans
Recruiting Plans Spring 2018 Spring 2017
Firm recruiting plans 37.1% 39.0%
Tentative plans in place 32.6% 27.4%
All recruiting in fall 18.2% 17.1%
Unsure 10.6% 14.4%
Not hiring 1.5% 2.1%
JOB OUTLOOK 2018 | 8
HIRING BY INDUSTRY
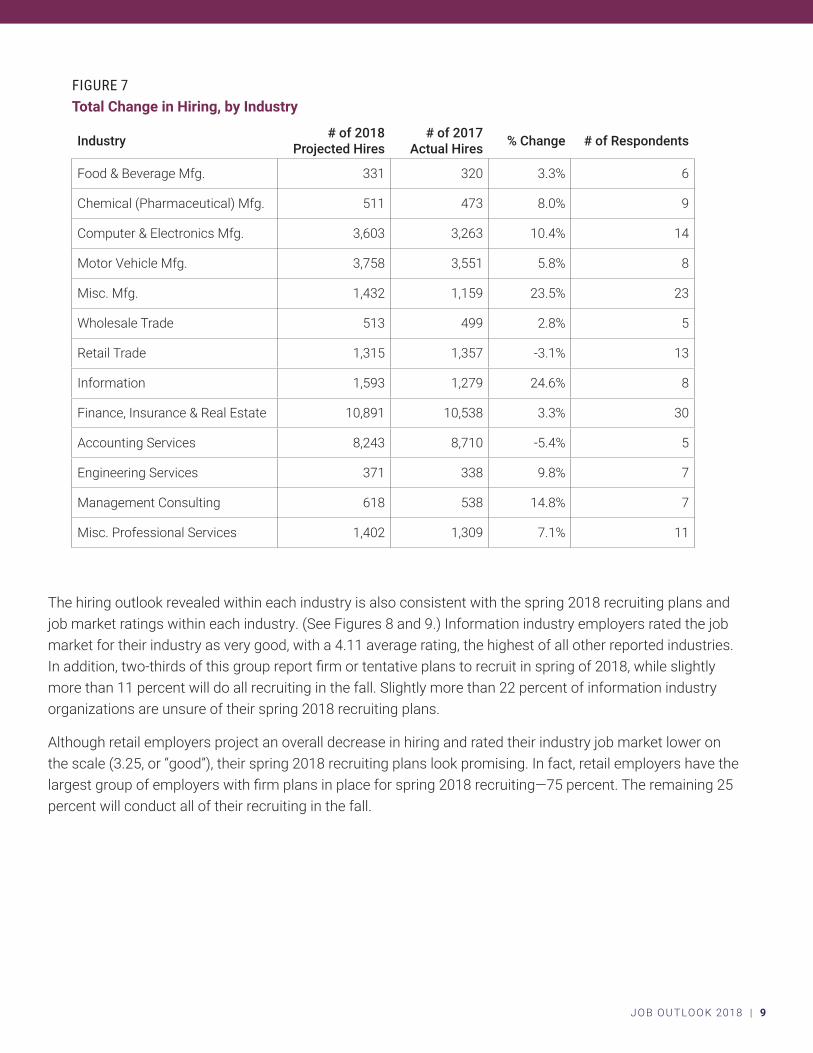
Thirteen industries are represented in this iteration of Job Outlook.* Among those, just two expect to hire fewer graduates in 2017-18. The remaining 11 reported increases in their hiring numbers over last year; those increases range from just under 3 percent to nearly 25 percent. These findings show improvement over last year when four of the total 11 industries reported overall decreases to their hiring numbers. (See Figure 7.)
Employers in the information industry are planning the largest overall increase of 24.6 percent. In fact, five of the reporting organizations in this industry are planning increases of at least 25 percent. Just two organizations in this industry report plans to decrease hiring.
Overall, miscellaneous manufacturers are also planning a large percentage increase, but that increase is skewed. Of the total respondents in this industry, five are maintaining their hires, 12 are increasing their hires, and the remaining six are decreasing their hires. Two of the responding organizations that are increasing their hires are also reporting large increases: One is doubling its college hires, and the other is tripling its number of college hires. Together, these two organizations are driving the large overall increase.
Of the two industries that are decreasing their hires, both are reporting minor decreases in the amounts: Among retail organizations, the decrease is 3.1 percent, while accounting services firms project a 5.4 percent decrease. Within the retail industry, only three of the 13 responding organizations are decreasing their hires, three are maintaining hires, and the remaining seven are increasing their hiring numbers. Consequently, as a whole, the outlook is by no means bleak for retail. Within the accounting services industry, the decrease is driven by the small number of responding organizations: Three of the five responding organizations are cutting hiring, while two are maintaining hiring.
*�Industry-specific�information�is�provided�only�for�those�in�which�five�or�more�organizations�provided�individual�hiring�data.
JOB OUTLOOK 2018 | 9
FIGURE 7Total Change in Hiring, by Industry
Industry # of 2018 Projected Hires
# of 2017 Actual Hires % Change # of Respondents
Food & Beverage Mfg. 331 320 3.3% 6
Chemical (Pharmaceutical) Mfg. 511 473 8.0% 9
Computer & Electronics Mfg. 3,603 3,263 10.4% 14
Motor Vehicle Mfg. 3,758 3,551 5.8% 8
Misc. Mfg. 1,432 1,159 23.5% 23
Wholesale Trade 513 499 2.8% 5
Retail Trade 1,315 1,357 -3.1% 13
Information 1,593 1,279 24.6% 8
Finance, Insurance & Real Estate 10,891 10,538 3.3% 30
Accounting Services 8,243 8,710 -5.4% 5
Engineering Services 371 338 9.8% 7
Management Consulting 618 538 14.8% 7
Misc. Professional Services 1,402 1,309 7.1% 11
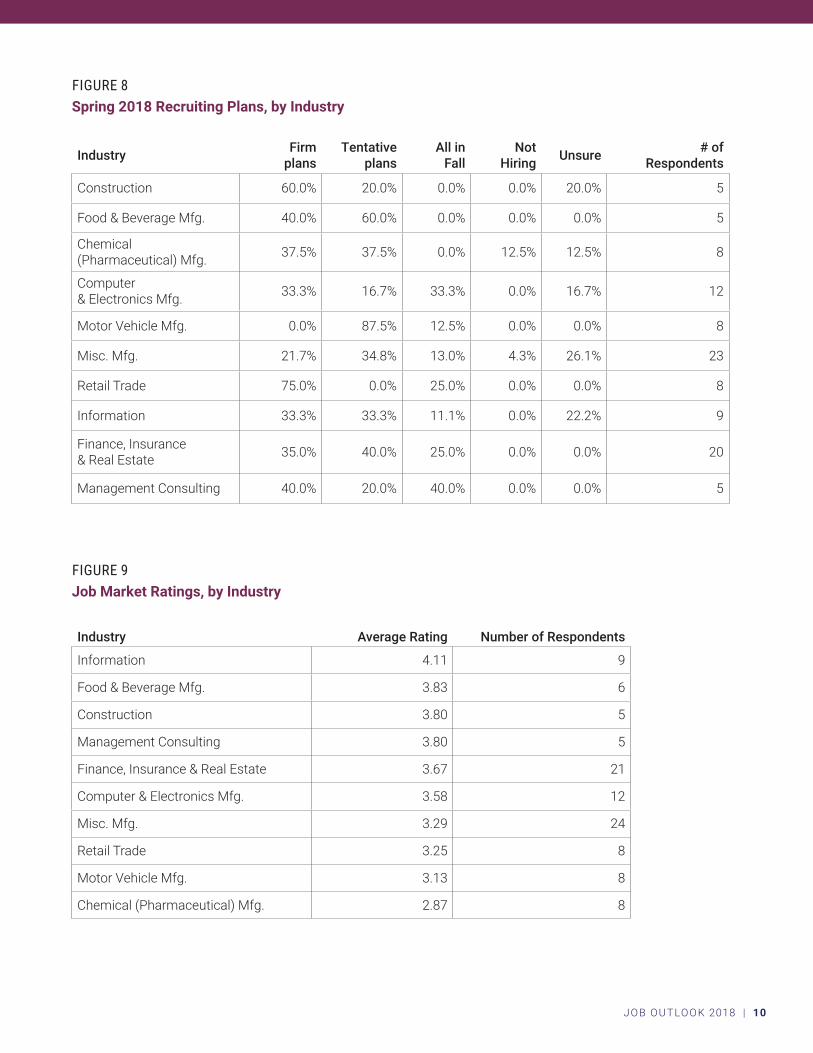
The hiring outlook revealed within each industry is also consistent with the spring 2018 recruiting plans and job market ratings within each industry. (See Figures 8 and 9.) Information industry employers rated the job market for their industry as very good, with a 4.11 average rating, the highest of all other reported industries. In addition, two-thirds of this group report firm or tentative plans to recruit in spring of 2018, while slightly more than 11 percent will do all recruiting in the fall. Slightly more than 22 percent of information industry organizations are unsure of their spring 2018 recruiting plans.
Although retail employers project an overall decrease in hiring and rated their industry job market lower on the scale (3.25, or “good”), their spring 2018 recruiting plans look promising. In fact, retail employers have the largest group of employers with firm plans in place for spring 2018 recruiting—75 percent. The remaining 25 percent will conduct all of their recruiting in the fall.
JOB OUTLOOK 2018 | 10
FIGURE 8Spring 2018 Recruiting Plans, by Industry
Industry Firm plans
Tentative plans
All in Fall
Not Hiring Unsure # of
Respondents
Construction 60.0% 20.0% 0.0% 0.0% 20.0% 5
Food & Beverage Mfg. 40.0% 60.0% 0.0% 0.0% 0.0% 5
Chemical (Pharmaceutical) Mfg. 37.5% 37.5% 0.0% 12.5% 12.5% 8
Computer & Electronics Mfg. 33.3% 16.7% 33.3% 0.0% 16.7% 12
Motor Vehicle Mfg. 0.0% 87.5% 12.5% 0.0% 0.0% 8
Misc. Mfg. 21.7% 34.8% 13.0% 4.3% 26.1% 23
Retail Trade 75.0% 0.0% 25.0% 0.0% 0.0% 8
Information 33.3% 33.3% 11.1% 0.0% 22.2% 9
Finance, Insurance & Real Estate 35.0% 40.0% 25.0% 0.0% 0.0% 20
Management Consulting 40.0% 20.0% 40.0% 0.0% 0.0% 5
FIGURE 9Job Market Ratings, by Industry
Industry Average Rating Number of Respondents
Information 4.11 9
Food & Beverage Mfg. 3.83 6
Construction 3.80 5
Management Consulting 3.80 5
Finance, Insurance & Real Estate 3.67 21
Computer & Electronics Mfg. 3.58 12
Misc. Mfg. 3.29 24
Retail Trade 3.25 8
Motor Vehicle Mfg. 3.13 8
Chemical (Pharmaceutical) Mfg. 2.87 8
JOB OUTLOOK 2018 | 11
HIRING BY REGION
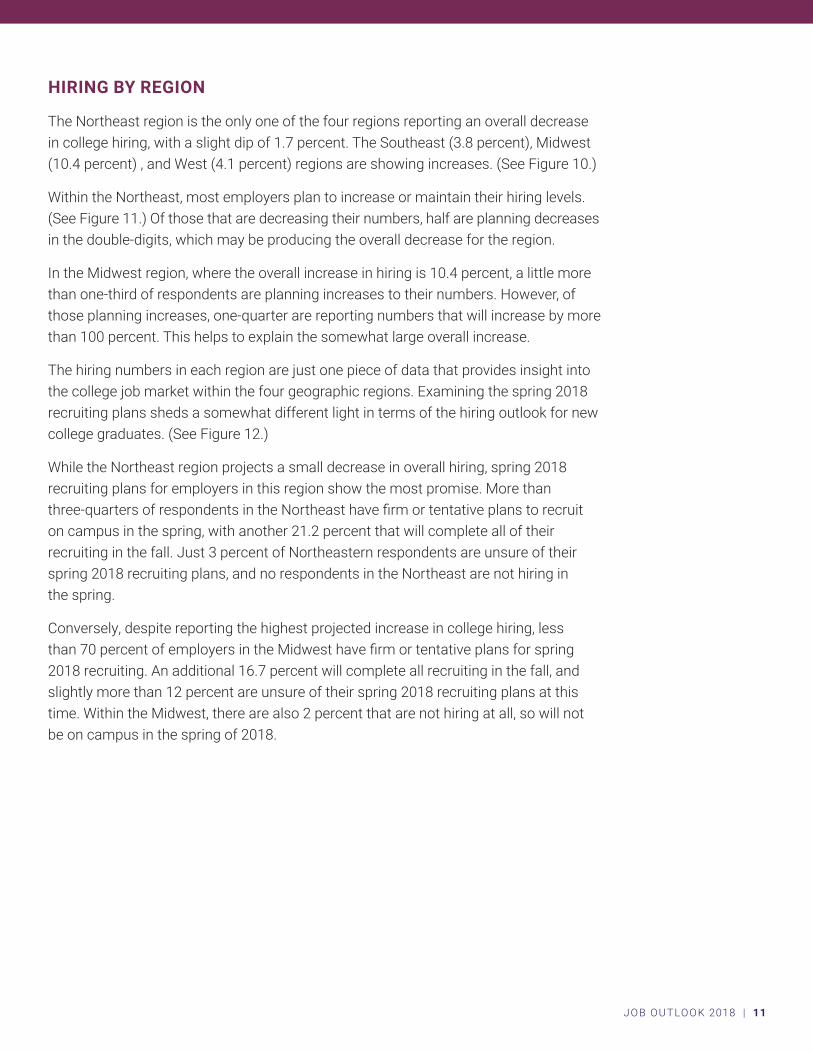
The Northeast region is the only one of the four regions reporting an overall decrease in college hiring, with a slight dip of 1.7 percent. The Southeast (3.8 percent), Midwest (10.4 percent) , and West (4.1 percent) regions are showing increases. (See Figure 10.)
Within the Northeast, most employers plan to increase or maintain their hiring levels. (See Figure 11.) Of those that are decreasing their numbers, half are planning decreases in the double-digits, which may be producing the overall decrease for the region.
In the Midwest region, where the overall increase in hiring is 10.4 percent, a little more than one-third of respondents are planning increases to their numbers. However, of those planning increases, one-quarter are reporting numbers that will increase by more than 100 percent. This helps to explain the somewhat large overall increase.
The hiring numbers in each region are just one piece of data that provides insight into the college job market within the four geographic regions. Examining the spring 2018 recruiting plans sheds a somewhat different light in terms of the hiring outlook for new college graduates. (See Figure 12.)
While the Northeast region projects a small decrease in overall hiring, spring 2018 recruiting plans for employers in this region show the most promise. More than three-quarters of respondents in the Northeast have firm or tentative plans to recruit on campus in the spring, with another 21.2 percent that will complete all of their recruiting in the fall. Just 3 percent of Northeastern respondents are unsure of their spring 2018 recruiting plans, and no respondents in the Northeast are not hiring in the spring.
Conversely, despite reporting the highest projected increase in college hiring, less than 70 percent of employers in the Midwest have firm or tentative plans for spring 2018 recruiting. An additional 16.7 percent will complete all recruiting in the fall, and slightly more than 12 percent are unsure of their spring 2018 recruiting plans at this time. Within the Midwest, there are also 2 percent that are not hiring at all, so will not be on campus in the spring of 2018.
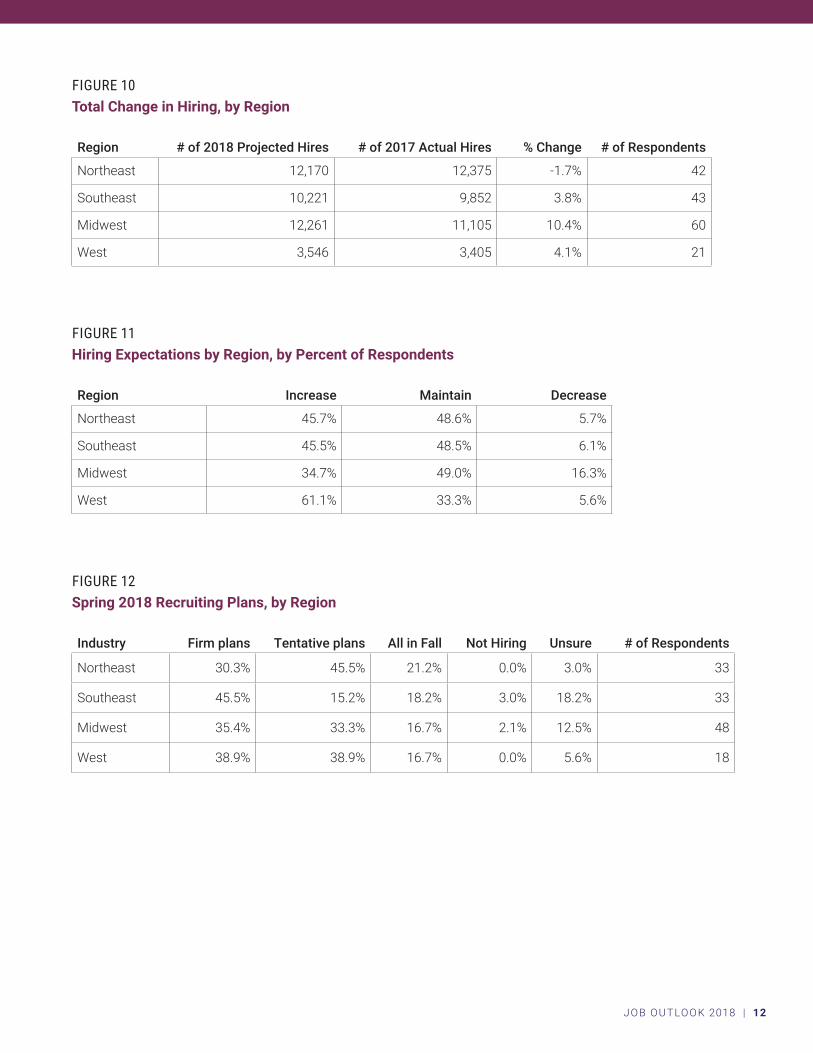
FIGURE 11Hiring Expectations by Region, by Percent of Respondents
Region Increase Maintain Decrease
Northeast 45.7% 48.6% 5.7%
Southeast 45.5% 48.5% 6.1%
Midwest 34.7% 49.0% 16.3%
West 61.1% 33.3% 5.6%
JOB OUTLOOK 2018 | 12
FIGURE 12Spring 2018 Recruiting Plans, by Region
Industry Firm plans Tentative plans All in Fall Not Hiring Unsure # of Respondents
Northeast 30.3% 45.5% 21.2% 0.0% 3.0% 33
Southeast 45.5% 15.2% 18.2% 3.0% 18.2% 33
Midwest 35.4% 33.3% 16.7% 2.1% 12.5% 48
West 38.9% 38.9% 16.7% 0.0% 5.6% 18
FIGURE 10Total Change in Hiring, by Region
Region # of 2018 Projected Hires # of 2017 Actual Hires % Change # of Respondents
Northeast 12,170 12,375 -1.7% 42
Southeast 10,221 9,852 3.8% 43
Midwest 12,261 11,105 10.4% 60
West 3,546 3,405 4.1% 21
WHO IS IN DEMAND?
JOB OUTLOOK 2018 | 13
DEMAND BY DEGREE LEVEL
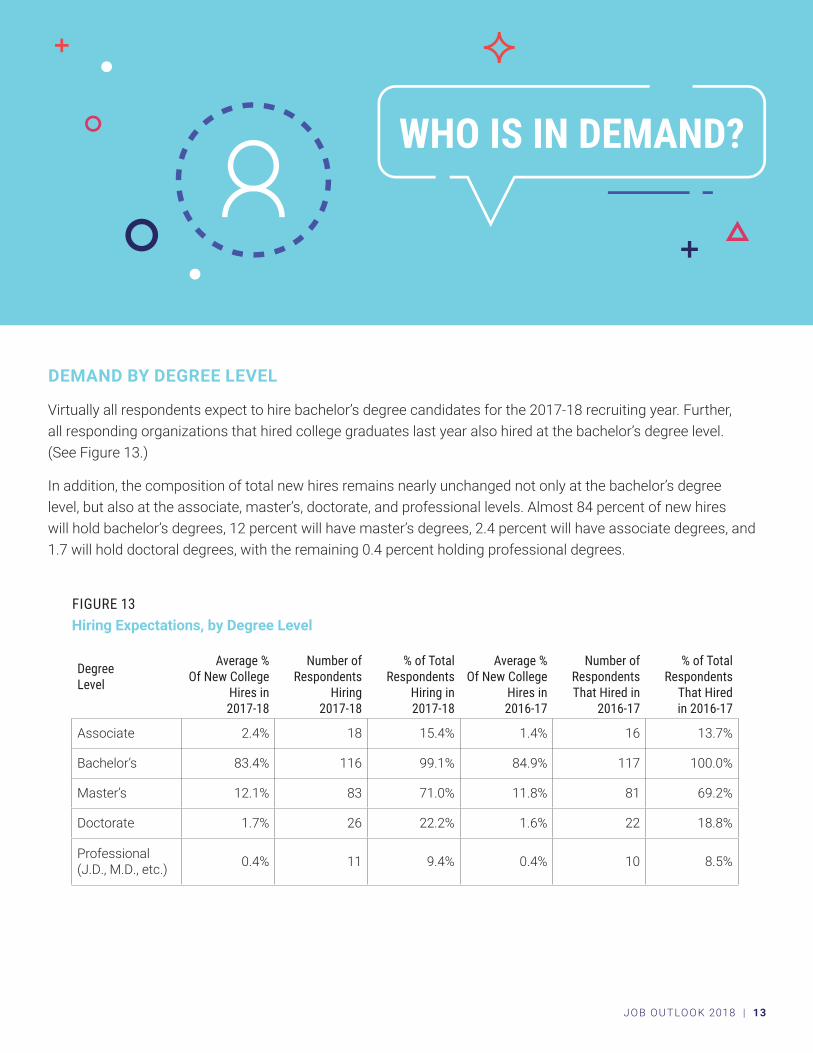
Virtually all respondents expect to hire bachelor’s degree candidates for the 2017-18 recruiting year. Further, all responding organizations that hired college graduates last year also hired at the bachelor’s degree level. (See Figure 13.)
In addition, the composition of total new hires remains nearly unchanged not only at the bachelor’s degree level, but also at the associate, master’s, doctorate, and professional levels. Almost 84 percent of new hires will hold bachelor’s degrees, 12 percent will have master’s degrees, 2.4 percent will have associate degrees, and 1.7 will hold doctoral degrees, with the remaining 0.4 percent holding professional degrees.
FIGURE 13Hiring Expectations, by Degree Level
Degree Level
Average %Of New College
Hires in 2017-18
Number ofRespondents
Hiring2017-18
% of Total Respondents
Hiring in 2017-18
Average %Of New College
Hires in 2016-17
Number ofRespondents That Hired in
2016-17
% of Total Respondents
That Hired in 2016-17
Associate 2.4% 18 15.4% 1.4% 16 13.7%
Bachelor’s 83.4% 116 99.1% 84.9% 117 100.0%
Master’s 12.1% 83 71.0% 11.8% 81 69.2%
Doctorate 1.7% 26 22.2% 1.6% 22 18.8%
Professional (J.D., M.D., etc.) 0.4% 11 9.4% 0.4% 10 8.5%
JOB OUTLOOK 2018 | 14
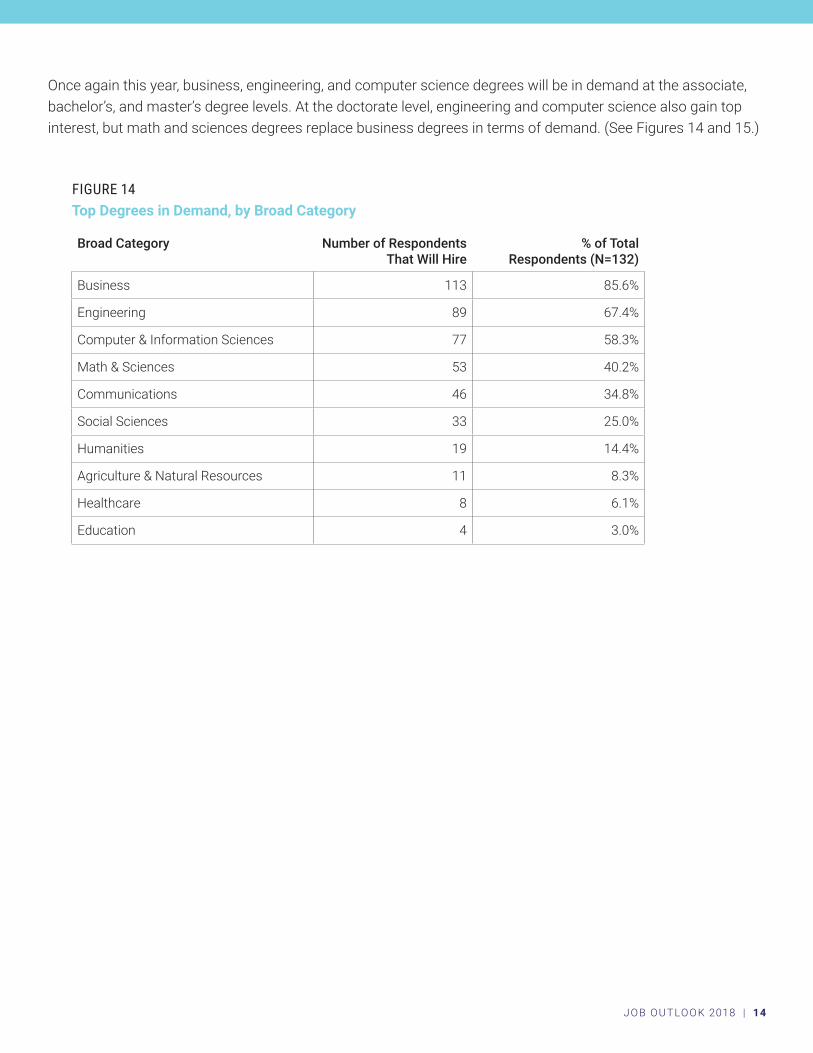
Once again this year, business, engineering, and computer science degrees will be in demand at the associate, bachelor’s, and master’s degree levels. At the doctorate level, engineering and computer science also gain top interest, but math and sciences degrees replace business degrees in terms of demand. (See Figures 14 and 15.)
FIGURE 14Top Degrees in Demand, by Broad Category
Broad Category Number of Respondents That Will Hire
% of Total Respondents (N=132)
Business 113 85.6%
Engineering 89 67.4%
Computer & Information Sciences 77 58.3%
Math & Sciences 53 40.2%
Communications 46 34.8%
Social Sciences 33 25.0%
Humanities 19 14.4%
Agriculture & Natural Resources 11 8.3%
Healthcare 8 6.1%
Education 4 3.0%
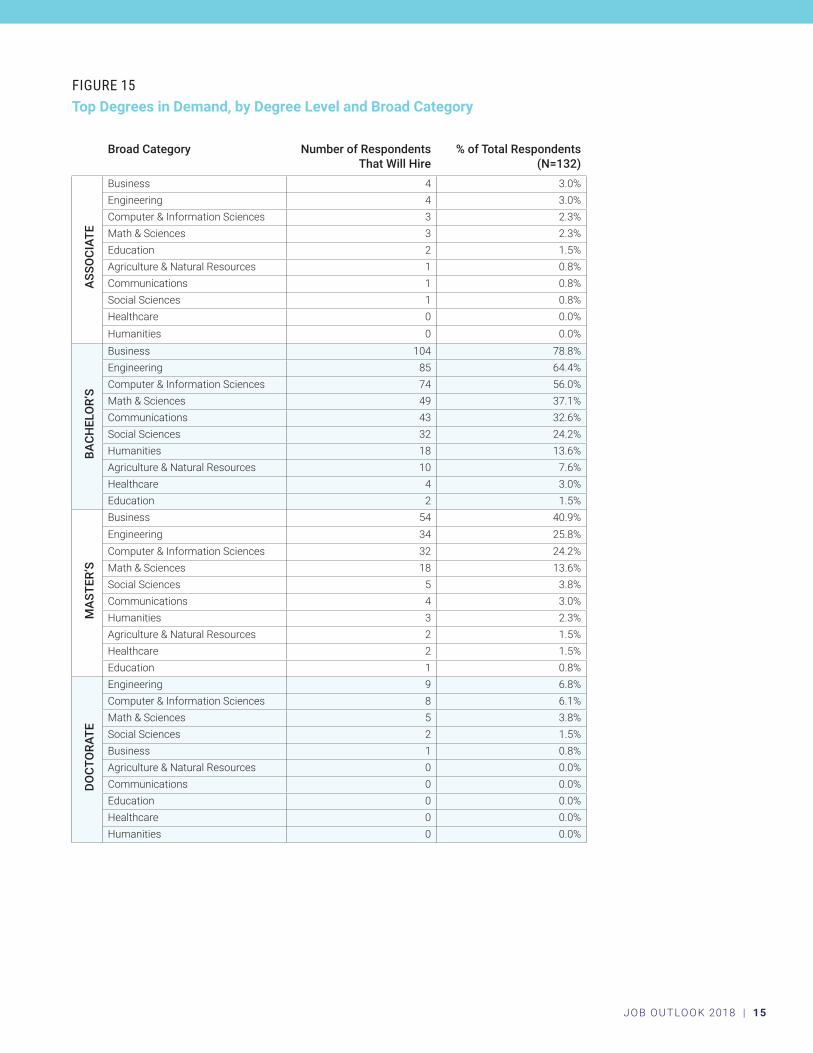
FIGURE 15Top Degrees in Demand, by Degree Level and Broad Category
Broad Category Number of Respondents That Will Hire
% of Total Respondents (N=132)
ASS
OCI
ATE
Business 4 3.0%Engineering 4 3.0%Computer & Information Sciences 3 2.3%Math & Sciences 3 2.3%Education 2 1.5%Agriculture & Natural Resources 1 0.8%Communications 1 0.8%Social Sciences 1 0.8%Healthcare 0 0.0%Humanities 0 0.0%
BACH
ELO
R’S
Business 104 78.8%Engineering 85 64.4%Computer & Information Sciences 74 56.0%Math & Sciences 49 37.1%Communications 43 32.6%Social Sciences 32 24.2%Humanities 18 13.6%Agriculture & Natural Resources 10 7.6%Healthcare 4 3.0%Education 2 1.5%
MA
STER
’S
Business 54 40.9%Engineering 34 25.8%Computer & Information Sciences 32 24.2%Math & Sciences 18 13.6%Social Sciences 5 3.8%Communications 4 3.0%Humanities 3 2.3%Agriculture & Natural Resources 2 1.5%Healthcare 2 1.5%Education 1 0.8%
DOCT
ORA
TE
Engineering 9 6.8%Computer & Information Sciences 8 6.1%Math & Sciences 5 3.8%Social Sciences 2 1.5%Business 1 0.8%Agriculture & Natural Resources 0 0.0%Communications 0 0.0%Education 0 0.0%Healthcare 0 0.0%Humanities 0 0.0%
JOB OUTLOOK 2018 | 15
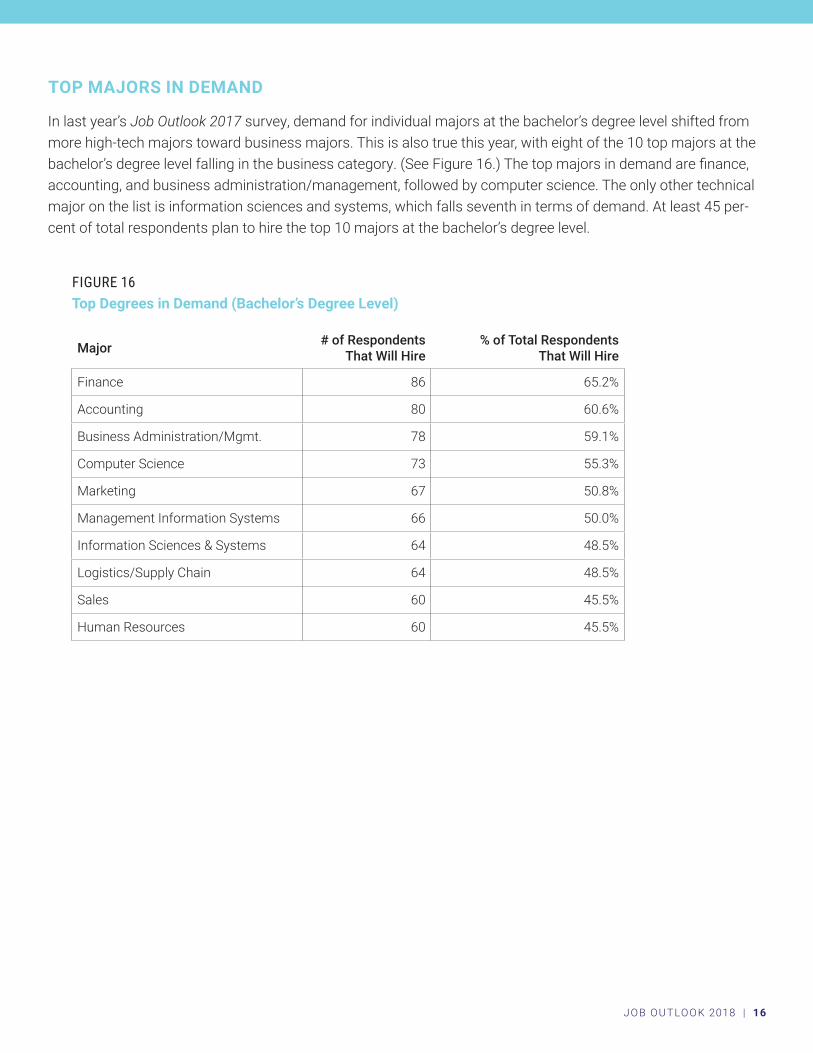
FIGURE 16Top Degrees in Demand (Bachelor’s Degree Level)
Major # of Respondents That Will Hire
% of Total Respondents That Will Hire
Finance 86 65.2%
Accounting 80 60.6%
Business Administration/Mgmt. 78 59.1%
Computer Science 73 55.3%
Marketing 67 50.8%
Management Information Systems 66 50.0%
Information Sciences & Systems 64 48.5%
Logistics/Supply Chain 64 48.5%
Sales 60 45.5%
Human Resources 60 45.5%
JOB OUTLOOK 2018 | 16
TOP MAJORS IN DEMAND
In last year’s Job Outlook 2017 survey, demand for individual majors at the bachelor’s degree level shifted from more high-tech majors toward business majors. This is also true this year, with eight of the 10 top majors at the bachelor’s degree level falling in the business category. (See Figure 16.) The top majors in demand are finance, accounting, and business administration/management, followed by computer science. The only other technical major on the list is information sciences and systems, which falls seventh in terms of demand. At least 45 per-cent of total respondents plan to hire the top 10 majors at the bachelor’s degree level.
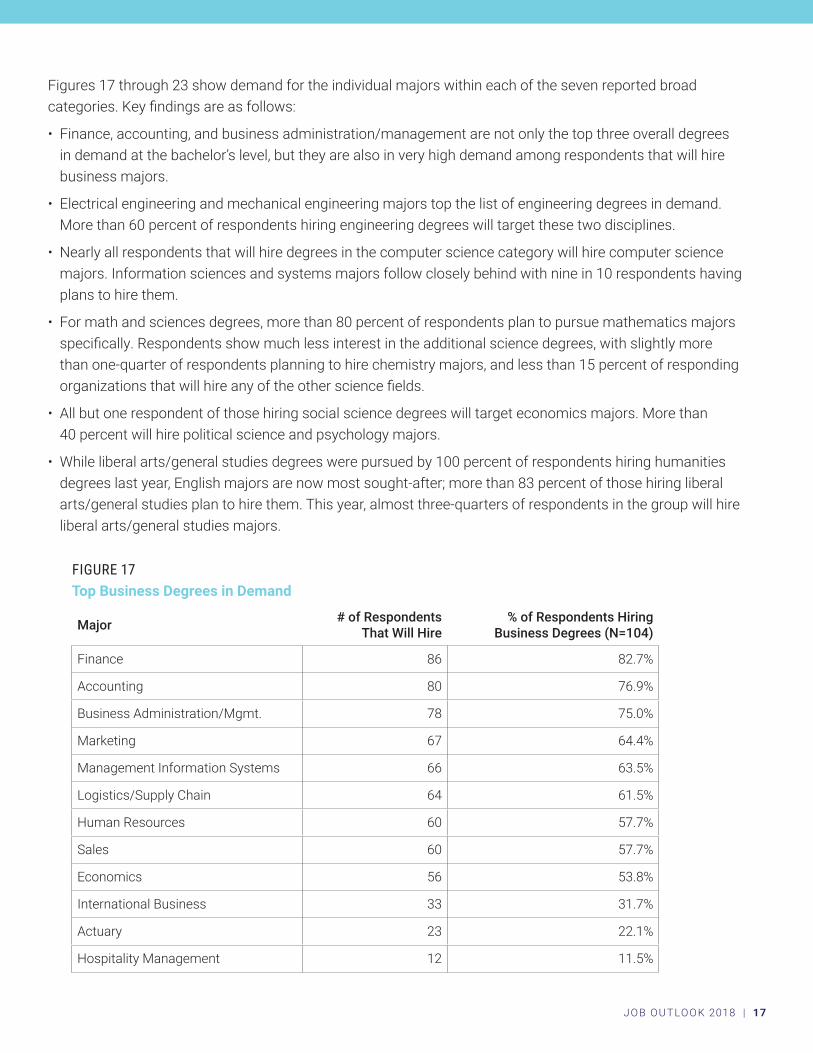
FIGURE 17Top Business Degrees in Demand
Major # of Respondents That Will Hire
% of Respondents Hiring Business Degrees (N=104)
Finance 86 82.7%
Accounting 80 76.9%
Business Administration/Mgmt. 78 75.0%
Marketing 67 64.4%
Management Information Systems 66 63.5%
Logistics/Supply Chain 64 61.5%
Human Resources 60 57.7%
Sales 60 57.7%
Economics 56 53.8%
International Business 33 31.7%
Actuary 23 22.1%
Hospitality Management 12 11.5%
JOB OUTLOOK 2018 | 17
Figures 17 through 23 show demand for the individual majors within each of the seven reported broad categories. Key findings are as follows:
• Finance, accounting, and business administration/management are not only the top three overall degrees in demand at the bachelor’s level, but they are also in very high demand among respondents that will hire business majors.
• Electrical engineering and mechanical engineering majors top the list of engineering degrees in demand. More than 60 percent of respondents hiring engineering degrees will target these two disciplines.
• Nearly all respondents that will hire degrees in the computer science category will hire computer science majors. Information sciences and systems majors follow closely behind with nine in 10 respondents having plans to hire them.
• For math and sciences degrees, more than 80 percent of respondents plan to pursue mathematics majors specifically. Respondents show much less interest in the additional science degrees, with slightly more than one-quarter of respondents planning to hire chemistry majors, and less than 15 percent of responding organizations that will hire any of the other science fields.
• All but one respondent of those hiring social science degrees will target economics majors. More than 40 percent will hire political science and psychology majors.
• While liberal arts/general studies degrees were pursued by 100 percent of respondents hiring humanities degrees last year, English majors are now most sought-after; more than 83 percent of those hiring liberal arts/general studies plan to hire them. This year, almost three-quarters of respondents in the group will hire liberal arts/general studies majors.
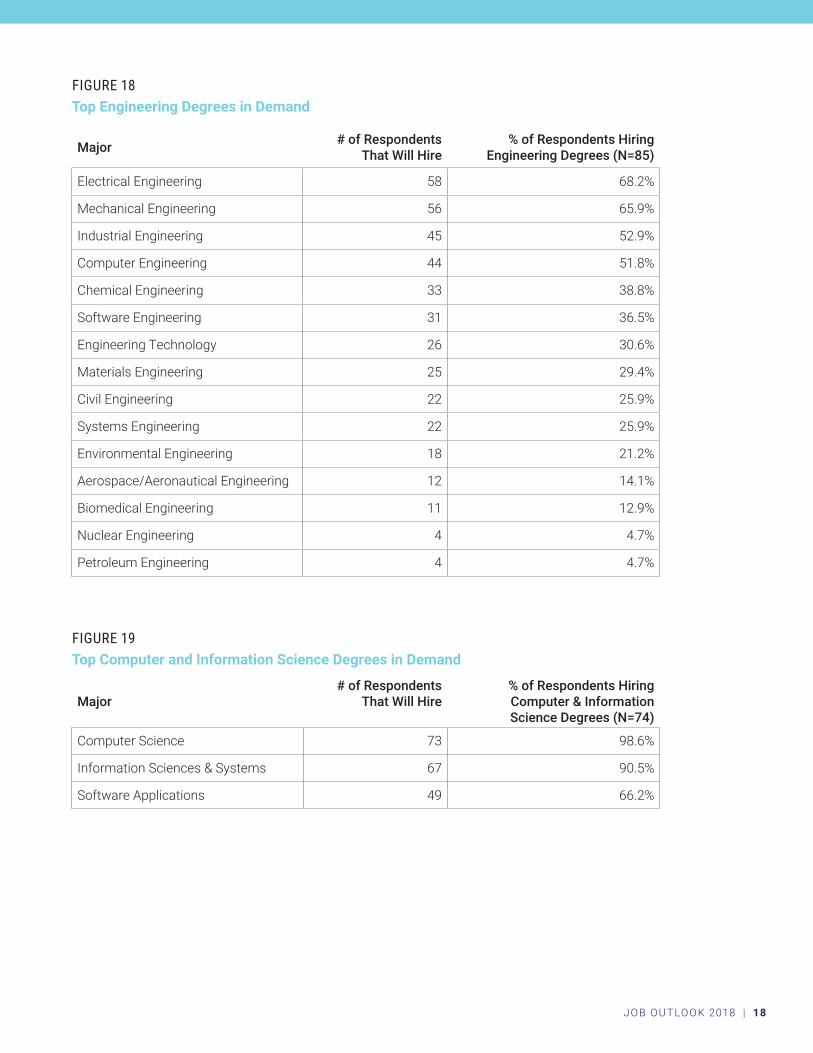
FIGURE 18Top Engineering Degrees in Demand
Major # of Respondents That Will Hire
% of Respondents Hiring Engineering Degrees (N=85)
Electrical Engineering 58 68.2%
Mechanical Engineering 56 65.9%
Industrial Engineering 45 52.9%
Computer Engineering 44 51.8%
Chemical Engineering 33 38.8%
Software Engineering 31 36.5%
Engineering Technology 26 30.6%
Materials Engineering 25 29.4%
Civil Engineering 22 25.9%
Systems Engineering 22 25.9%
Environmental Engineering 18 21.2%
Aerospace/Aeronautical Engineering 12 14.1%
Biomedical Engineering 11 12.9%
Nuclear Engineering 4 4.7%
Petroleum Engineering 4 4.7%
JOB OUTLOOK 2018 | 18
FIGURE 19Top Computer and Information Science Degrees in Demand
Major# of Respondents
That Will Hire % of Respondents Hiring Computer & Information Science Degrees (N=74)
Computer Science 73 98.6%
Information Sciences & Systems 67 90.5%
Software Applications 49 66.2%
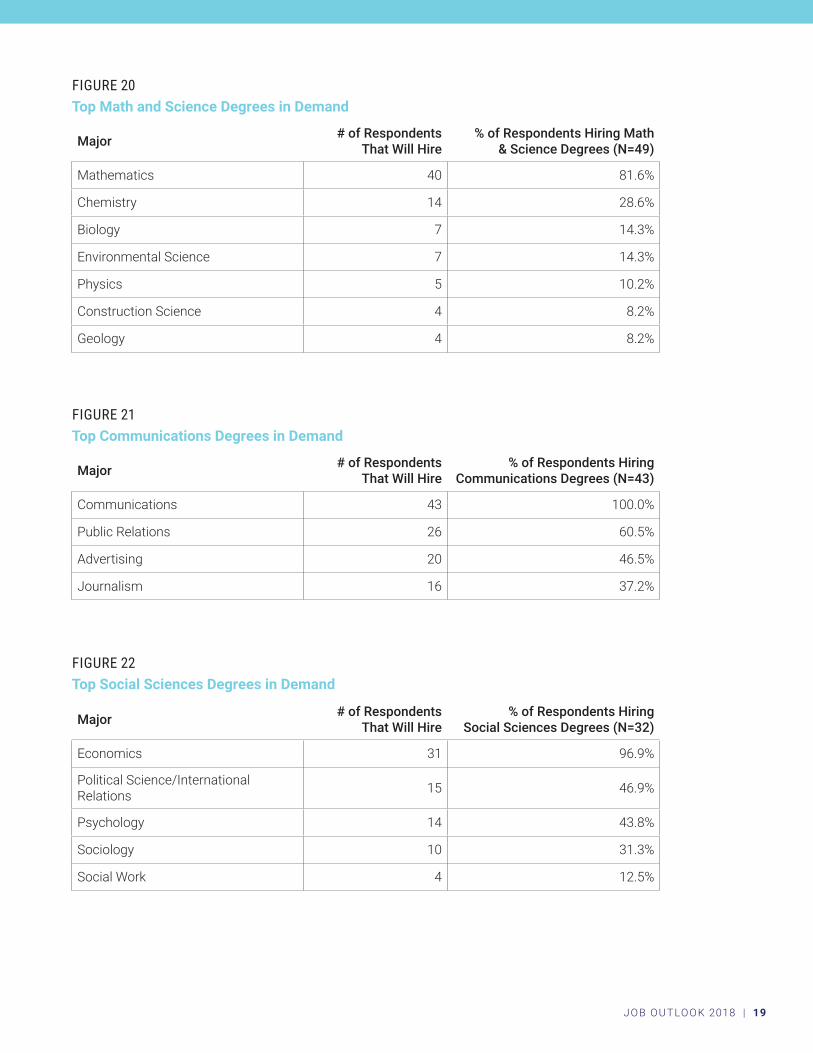
FIGURE 20Top Math and Science Degrees in Demand
Major # of Respondents That Will Hire
% of Respondents Hiring Math & Science Degrees (N=49)
Mathematics 40 81.6%
Chemistry 14 28.6%
Biology 7 14.3%
Environmental Science 7 14.3%
Physics 5 10.2%
Construction Science 4 8.2%
Geology 4 8.2%
JOB OUTLOOK 2018 | 19
FIGURE 21Top Communications Degrees in Demand
Major # of Respondents That Will Hire
% of Respondents Hiring Communications Degrees (N=43)
Communications 43 100.0%
Public Relations 26 60.5%
Advertising 20 46.5%
Journalism 16 37.2%
FIGURE 22Top Social Sciences Degrees in Demand
Major # of Respondents That Will Hire
% of Respondents Hiring Social Sciences Degrees (N=32)
Economics 31 96.9%
Political Science/International Relations 15 46.9%
Psychology 14 43.8%
Sociology 10 31.3%
Social Work 4 12.5%
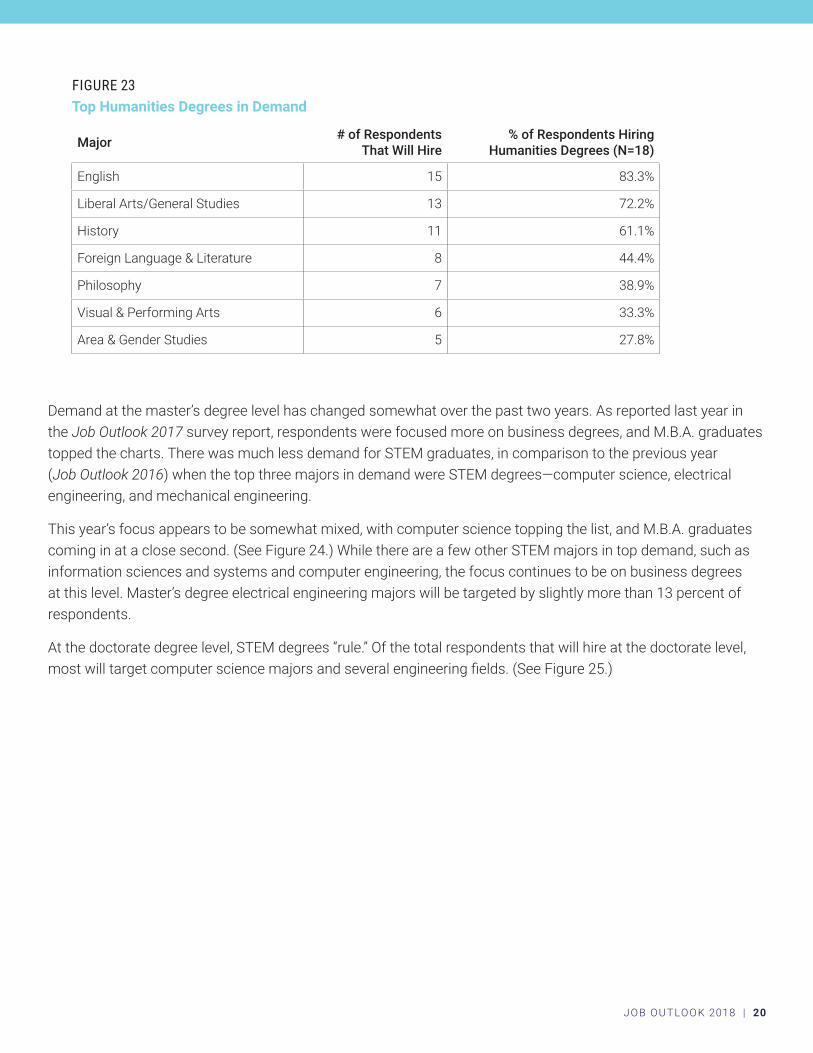
FIGURE 23Top Humanities Degrees in Demand
Major # of Respondents That Will Hire
% of Respondents Hiring Humanities Degrees (N=18)
English 15 83.3%
Liberal Arts/General Studies 13 72.2%
History 11 61.1%
Foreign Language & Literature 8 44.4%
Philosophy 7 38.9%
Visual & Performing Arts 6 33.3%
Area & Gender Studies 5 27.8%
JOB OUTLOOK 2018 | 20
Demand at the master’s degree level has changed somewhat over the past two years. As reported last year in the Job Outlook 2017 survey report, respondents were focused more on business degrees, and M.B.A. graduates topped the charts. There was much less demand for STEM graduates, in comparison to the previous year (Job Outlook 2016) when the top three majors in demand were STEM degrees—computer science, electrical engineering, and mechanical engineering.
This year’s focus appears to be somewhat mixed, with computer science topping the list, and M.B.A. graduates coming in at a close second. (See Figure 24.) While there are a few other STEM majors in top demand, such as information sciences and systems and computer engineering, the focus continues to be on business degrees at this level. Master’s degree electrical engineering majors will be targeted by slightly more than 13 percent of respondents.
At the doctorate degree level, STEM degrees “rule.” Of the total respondents that will hire at the doctorate level, most will target computer science majors and several engineering fields. (See Figure 25.)
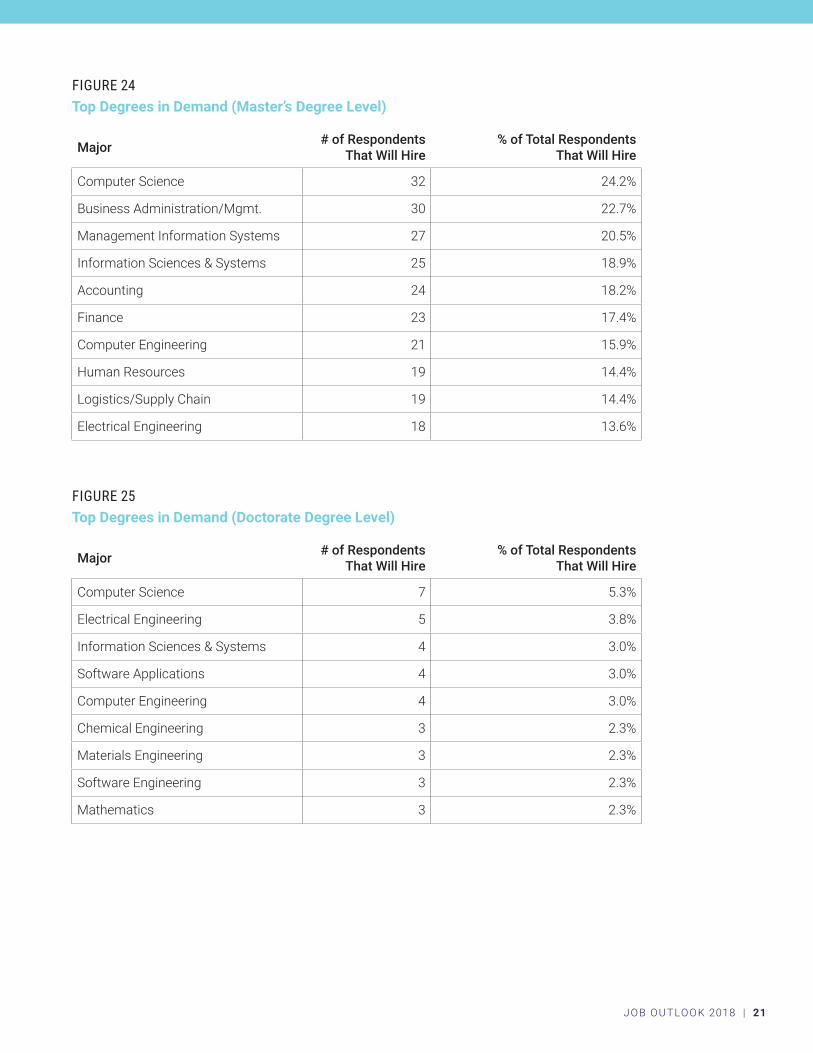
FIGURE 24Top Degrees in Demand (Master’s Degree Level)
Major # of Respondents That Will Hire
% of Total Respondents That Will Hire
Computer Science 32 24.2%
Business Administration/Mgmt. 30 22.7%
Management Information Systems 27 20.5%
Information Sciences & Systems 25 18.9%
Accounting 24 18.2%
Finance 23 17.4%
Computer Engineering 21 15.9%
Human Resources 19 14.4%
Logistics/Supply Chain 19 14.4%
Electrical Engineering 18 13.6%
JOB OUTLOOK 2018 | 21
FIGURE 25Top Degrees in Demand (Doctorate Degree Level)
Major # of Respondents That Will Hire
% of Total Respondents That Will Hire
Computer Science 7 5.3%
Electrical Engineering 5 3.8%
Information Sciences & Systems 4 3.0%
Software Applications 4 3.0%
Computer Engineering 4 3.0%
Chemical Engineering 3 2.3%
Materials Engineering 3 2.3%
Software Engineering 3 2.3%
Mathematics 3 2.3%
JOB OUTLOOK 2018 | 22
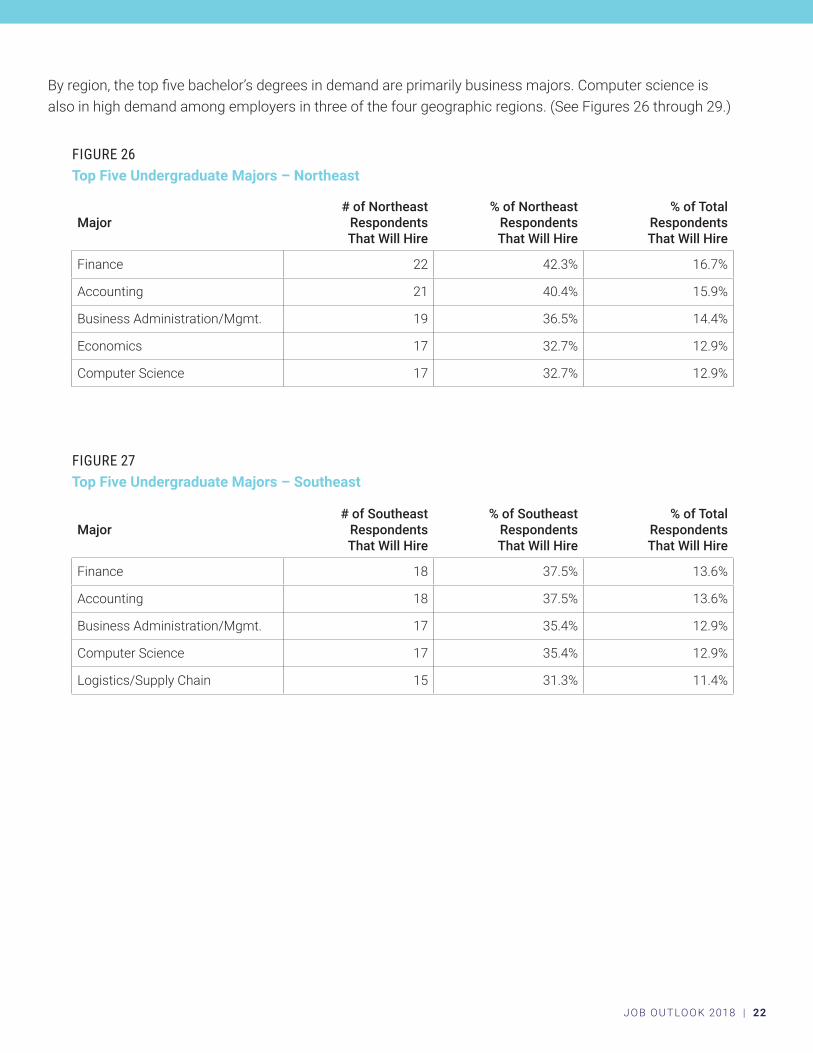
By region, the top five bachelor’s degrees in demand are primarily business majors. Computer science is also in high demand among employers in three of the four geographic regions. (See Figures 26 through 29.)
FIGURE 26Top Five Undergraduate Majors – Northeast
Major# of Northeast
Respondents That Will Hire
% of Northeast Respondents That Will Hire
% of Total Respondents That Will Hire
Finance 22 42.3% 16.7%
Accounting 21 40.4% 15.9%
Business Administration/Mgmt. 19 36.5% 14.4%
Economics 17 32.7% 12.9%
Computer Science 17 32.7% 12.9%
FIGURE 27Top Five Undergraduate Majors – Southeast
Major# of Southeast
Respondents That Will Hire
% of Southeast Respondents That Will Hire
% of Total Respondents That Will Hire
Finance 18 37.5% 13.6%
Accounting 18 37.5% 13.6%
Business Administration/Mgmt. 17 35.4% 12.9%
Computer Science 17 35.4% 12.9%
Logistics/Supply Chain 15 31.3% 11.4%
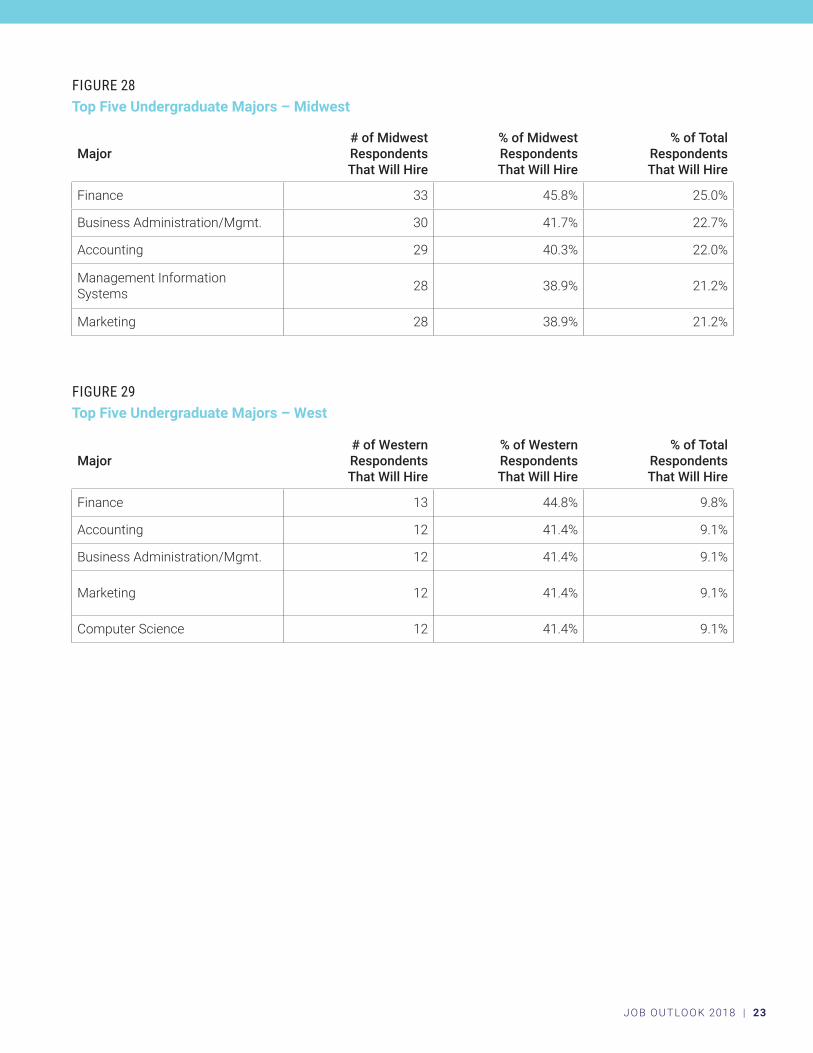
FIGURE 28Top Five Undergraduate Majors – Midwest
Major# of Midwest Respondents That Will Hire
% of Midwest Respondents That Will Hire
% of Total Respondents That Will Hire
Finance 33 45.8% 25.0%
Business Administration/Mgmt. 30 41.7% 22.7%
Accounting 29 40.3% 22.0%
Management Information Systems 28 38.9% 21.2%
Marketing 28 38.9% 21.2%
JOB OUTLOOK 2018 | 23
FIGURE 29Top Five Undergraduate Majors – West
Major# of Western Respondents That Will Hire
% of Western Respondents That Will Hire
% of Total Respondents That Will Hire
Finance 13 44.8% 9.8%
Accounting 12 41.4% 9.1%
Business Administration/Mgmt. 12 41.4% 9.1%
Marketing 12 41.4% 9.1%
Computer Science 12 41.4% 9.1%
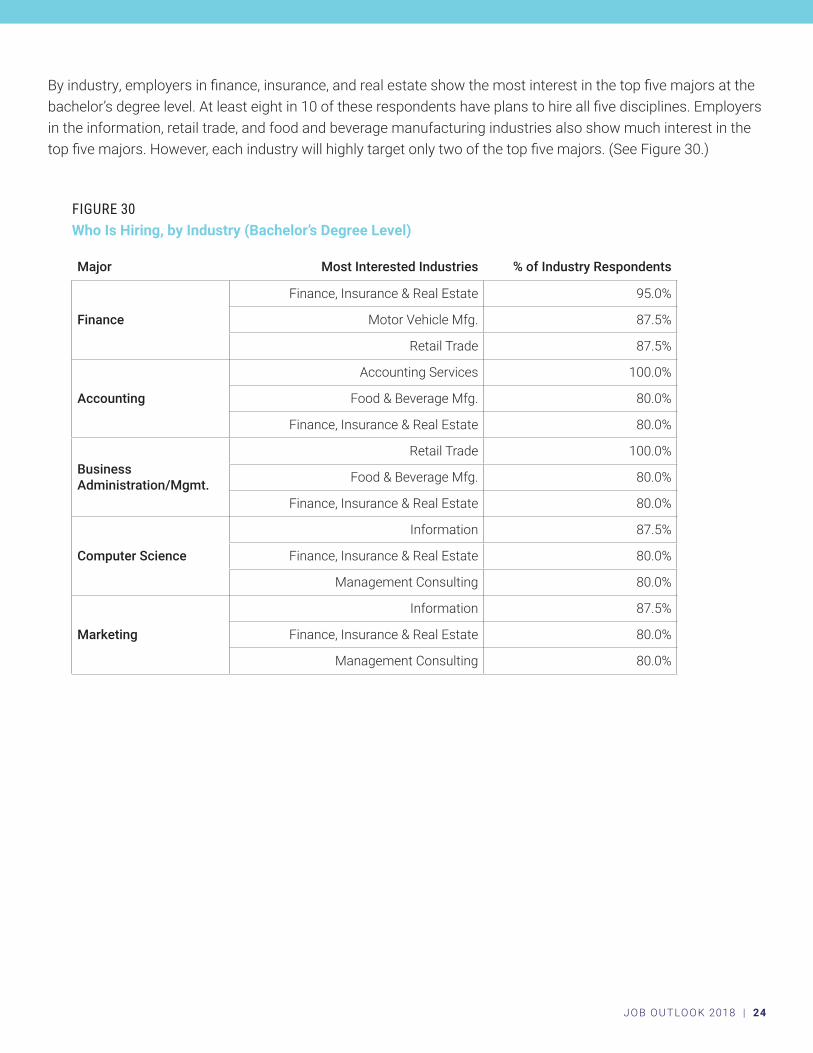
FIGURE 30Who Is Hiring, by Industry (Bachelor’s Degree Level)
Major Most Interested Industries % of Industry Respondents
Finance
Finance, Insurance & Real Estate 95.0%
Motor Vehicle Mfg. 87.5%
Retail Trade 87.5%
Accounting
Accounting Services 100.0%
Food & Beverage Mfg. 80.0%
Finance, Insurance & Real Estate 80.0%
Business Administration/Mgmt.
Retail Trade 100.0%
Food & Beverage Mfg. 80.0%
Finance, Insurance & Real Estate 80.0%
Computer Science
Information 87.5%
Finance, Insurance & Real Estate 80.0%
Management Consulting 80.0%
Marketing
Information 87.5%
Finance, Insurance & Real Estate 80.0%
Management Consulting 80.0%
JOB OUTLOOK 2018 | 24
By industry, employers in finance, insurance, and real estate show the most interest in the top five majors at the bachelor’s degree level. At least eight in 10 of these respondents have plans to hire all five disciplines. Employers in the information, retail trade, and food and beverage manufacturing industries also show much interest in the top five majors. However, each industry will highly target only two of the top five majors. (See Figure 30.)
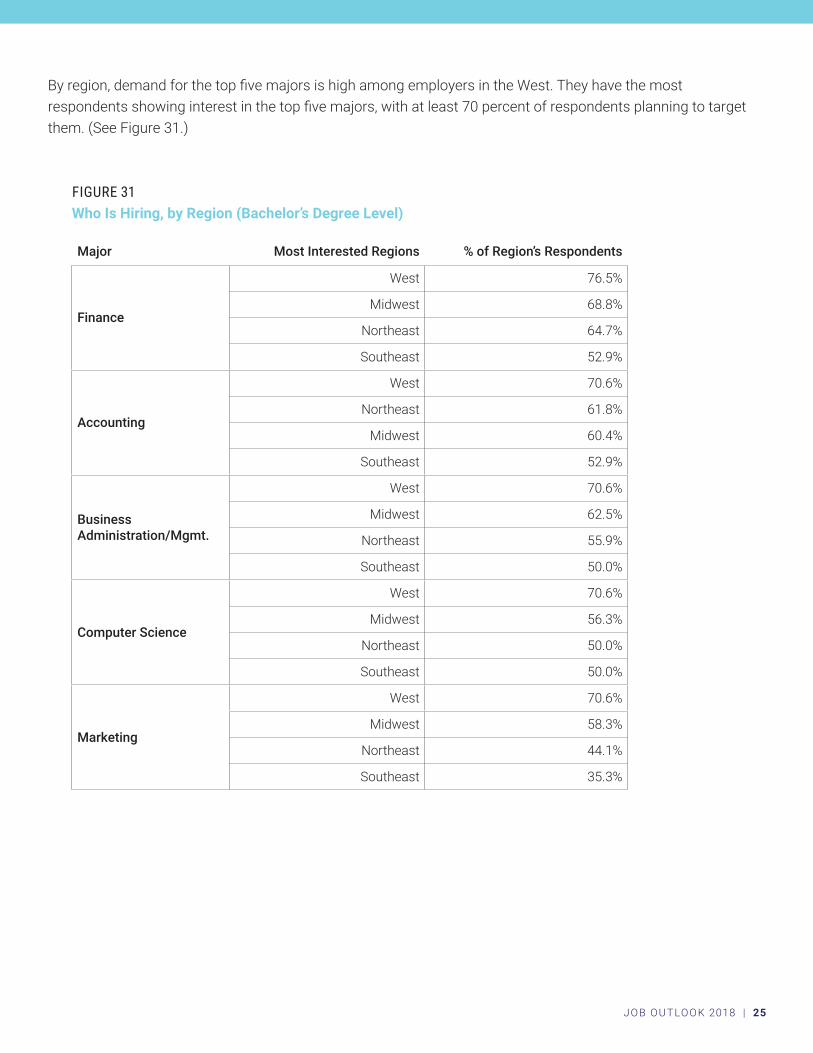
FIGURE 31Who Is Hiring, by Region (Bachelor’s Degree Level)
Major Most Interested Regions % of Region’s Respondents
Finance
West 76.5%
Midwest 68.8%
Northeast 64.7%
Southeast 52.9%
Accounting
West 70.6%
Northeast 61.8%
Midwest 60.4%
Southeast 52.9%
Business Administration/Mgmt.
West 70.6%
Midwest 62.5%
Northeast 55.9%
Southeast 50.0%
Computer Science
West 70.6%
Midwest 56.3%
Northeast 50.0%
Southeast 50.0%
Marketing
West 70.6%
Midwest 58.3%
Northeast 44.1%
Southeast 35.3%
JOB OUTLOOK 2018 | 25
By region, demand for the top five majors is high among employers in the West. They have the most respondents showing interest in the top five majors, with at least 70 percent of respondents planning to target them. (See Figure 31.)
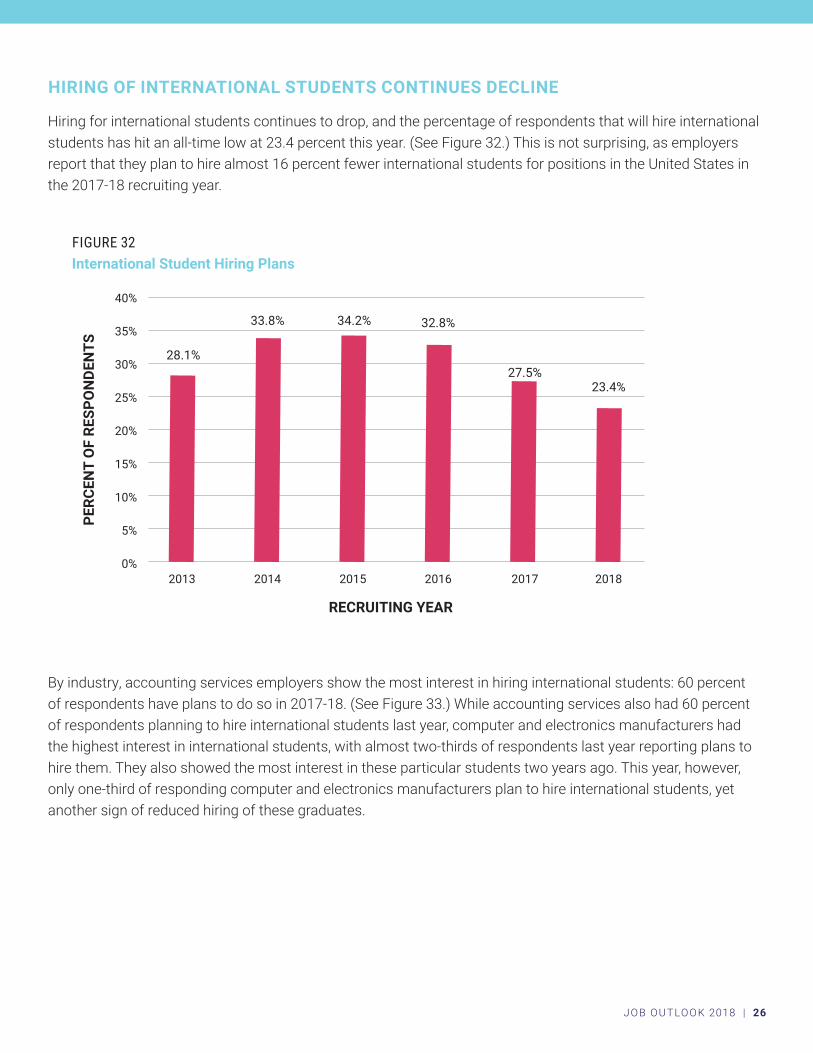
FIGURE 32International Student Hiring Plans
2013
RECRUITING YEAR
PERC
ENT
OF
RESP
ON
DEN
TS
2014 2015 2016 2017 2018
40%
35%
30%
25%
20%
15%
10%
5%
0%
28.1%
33.8% 34.2% 32.8%
27.5%23.4%
JOB OUTLOOK 2018 | 26
HIRING OF INTERNATIONAL STUDENTS CONTINUES DECLINE
Hiring for international students continues to drop, and the percentage of respondents that will hire international students has hit an all-time low at 23.4 percent this year. (See Figure 32.) This is not surprising, as employers report that they plan to hire almost 16 percent fewer international students for positions in the United States in the 2017-18 recruiting year.
By industry, accounting services employers show the most interest in hiring international students: 60 percent of respondents have plans to do so in 2017-18. (See Figure 33.) While accounting services also had 60 percent of respondents planning to hire international students last year, computer and electronics manufacturers had the highest interest in international students, with almost two-thirds of respondents last year reporting plans to hire them. They also showed the most interest in these particular students two years ago. This year, however, only one-third of responding computer and electronics manufacturers plan to hire international students, yet another sign of reduced hiring of these graduates.
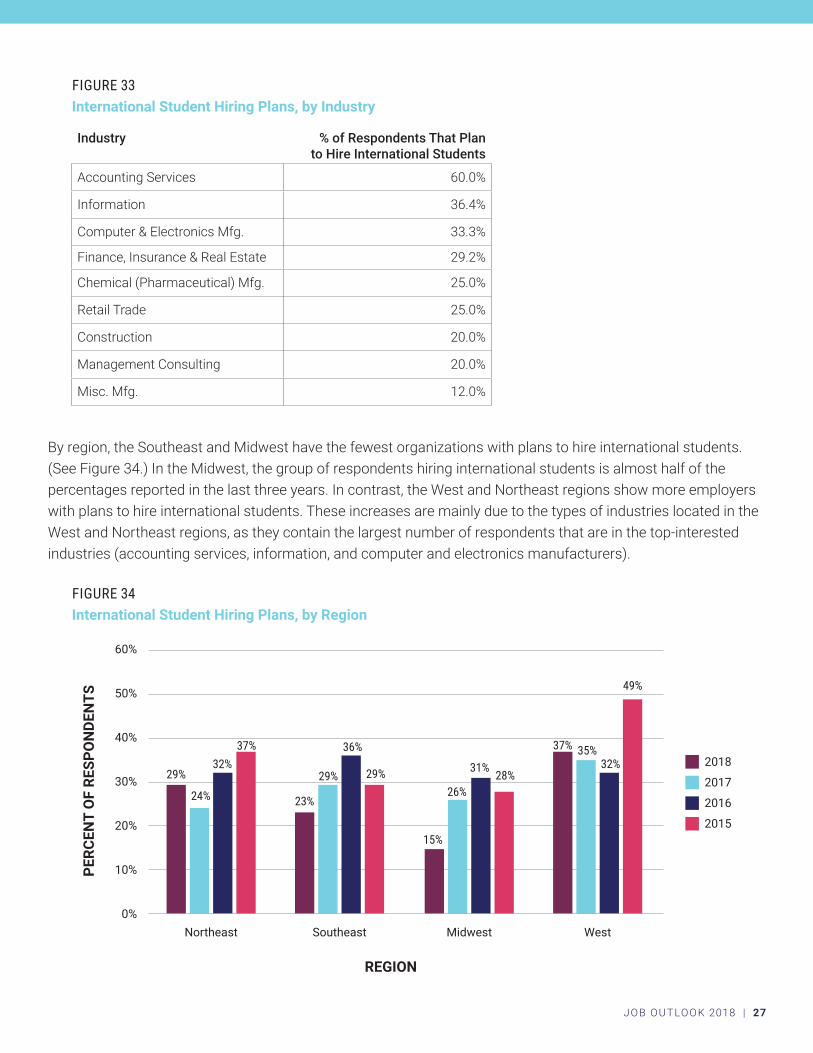
FIGURE 33International Student Hiring Plans, by Industry
Industry % of Respondents That Plan to Hire International Students
Accounting Services 60.0%
Information 36.4%
Computer & Electronics Mfg. 33.3%
Finance, Insurance & Real Estate 29.2%
Chemical (Pharmaceutical) Mfg. 25.0%
Retail Trade 25.0%
Construction 20.0%
Management Consulting 20.0%
Misc. Mfg. 12.0%
JOB OUTLOOK 2018 | 27
By region, the Southeast and Midwest have the fewest organizations with plans to hire international students. (See Figure 34.) In the Midwest, the group of respondents hiring international students is almost half of the percentages reported in the last three years. In contrast, the West and Northeast regions show more employers with plans to hire international students. These increases are mainly due to the types of industries located in the West and Northeast regions, as they contain the largest number of respondents that are in the top-interested industries (accounting services, information, and computer and electronics manufacturers).
FIGURE 34International Student Hiring Plans, by Region
2018
2017
2016
2015
REGION
Northeast Southeast Midwest West
PERC
ENT
OF
RESP
ON
DEN
TS
60%
50%
40%
30%
20%
10%
0%
29%
23%24%29%
37%
29%32%
36%
26%
15%
31% 28%
37% 35%32%
49%
HOW EMPLOYERS VIEW CANDIDATES
JOB OUTLOOK 2018 | 28
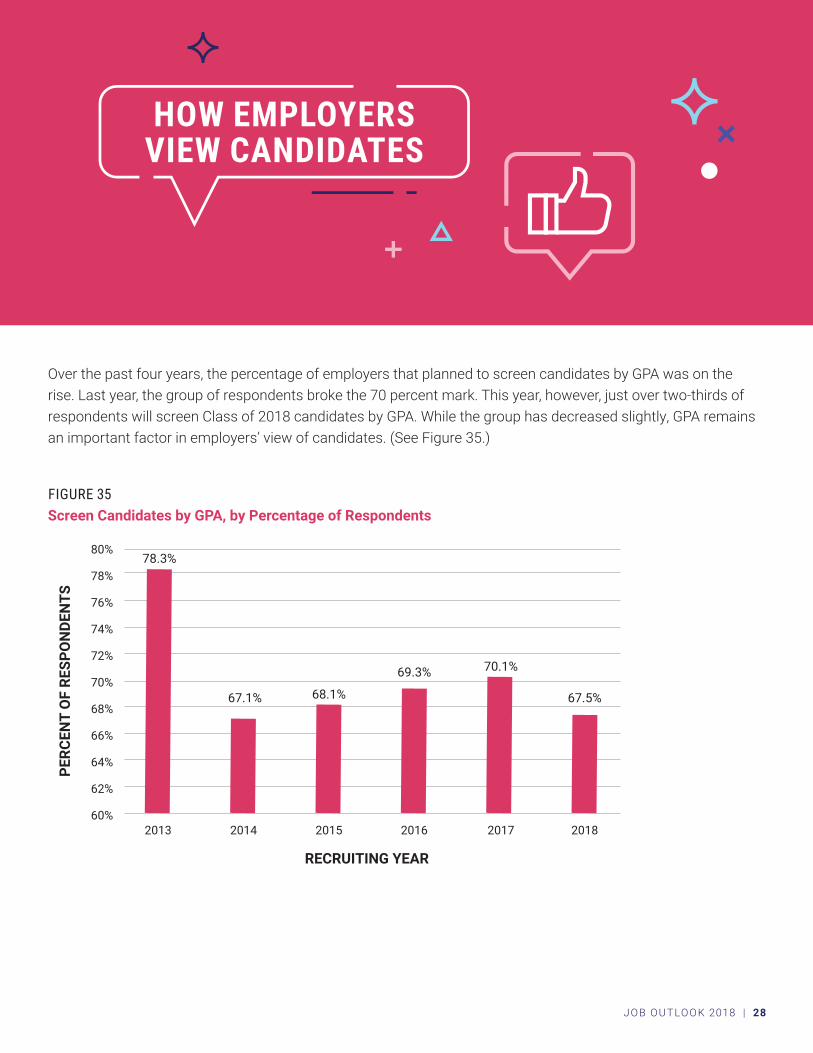
Over the past four years, the percentage of employers that planned to screen candidates by GPA was on the rise. Last year, the group of respondents broke the 70 percent mark. This year, however, just over two-thirds of respondents will screen Class of 2018 candidates by GPA. While the group has decreased slightly, GPA remains an important factor in employers’ view of candidates. (See Figure 35.)
FIGURE 35Screen Candidates by GPA, by Percentage of Respondents
2013
RECRUITING YEAR
PERC
ENT
OF
RESP
ON
DEN
TS
2014 2015 2016 2017 2018
80%
78%
76%
74%
72%
70%
68%
66%
64%
62%
60%
78.3%
67.1% 68.1%
69.3% 70.1%
67.5%
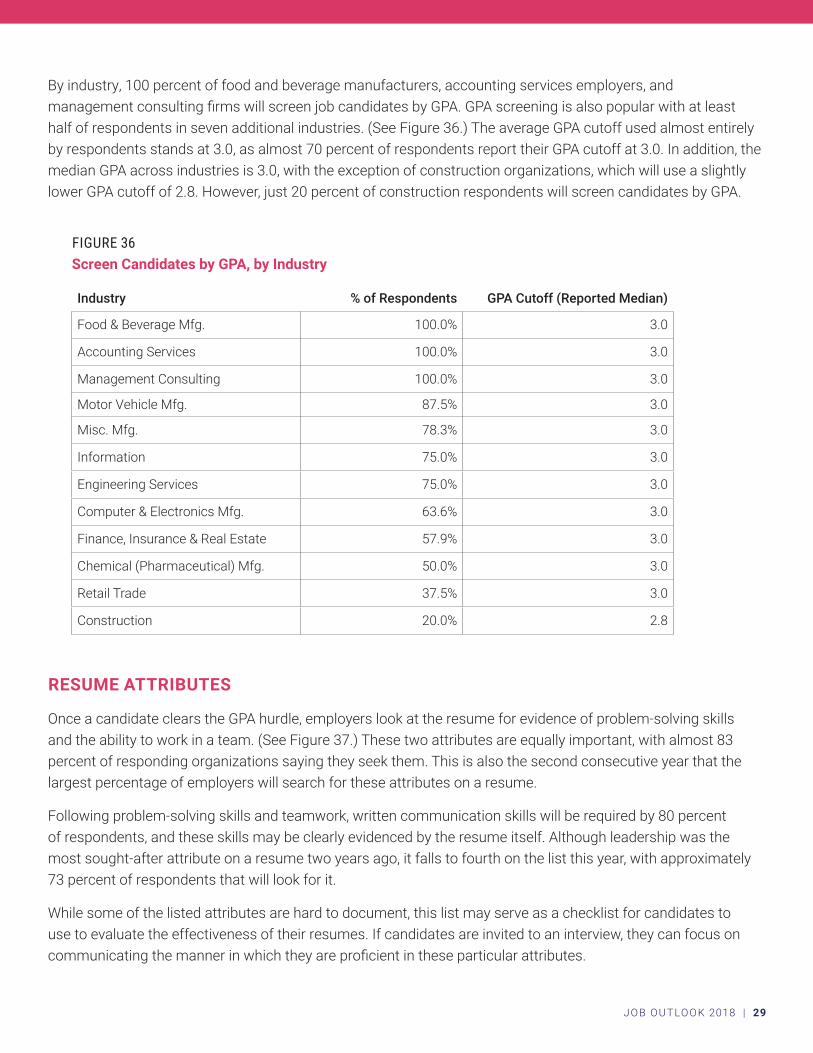
FIGURE 36Screen Candidates by GPA, by Industry
Industry % of Respondents GPA Cutoff (Reported Median)
Food & Beverage Mfg. 100.0% 3.0
Accounting Services 100.0% 3.0
Management Consulting 100.0% 3.0
Motor Vehicle Mfg. 87.5% 3.0
Misc. Mfg. 78.3% 3.0
Information 75.0% 3.0
Engineering Services 75.0% 3.0
Computer & Electronics Mfg. 63.6% 3.0
Finance, Insurance & Real Estate 57.9% 3.0
Chemical (Pharmaceutical) Mfg. 50.0% 3.0
Retail Trade 37.5% 3.0
Construction 20.0% 2.8
JOB OUTLOOK 2018 | 29
By industry, 100 percent of food and beverage manufacturers, accounting services employers, and management consulting firms will screen job candidates by GPA. GPA screening is also popular with at least half of respondents in seven additional industries. (See Figure 36.) The average GPA cutoff used almost entirely by respondents stands at 3.0, as almost 70 percent of respondents report their GPA cutoff at 3.0. In addition, the median GPA across industries is 3.0, with the exception of construction organizations, which will use a slightly lower GPA cutoff of 2.8. However, just 20 percent of construction respondents will screen candidates by GPA.
RESUME ATTRIBUTES
Once a candidate clears the GPA hurdle, employers look at the resume for evidence of problem-solving skills and the ability to work in a team. (See Figure 37.) These two attributes are equally important, with almost 83 percent of responding organizations saying they seek them. This is also the second consecutive year that the largest percentage of employers will search for these attributes on a resume.
Following problem-solving skills and teamwork, written communication skills will be required by 80 percent of respondents, and these skills may be clearly evidenced by the resume itself. Although leadership was the most sought-after attribute on a resume two years ago, it falls to fourth on the list this year, with approximately 73 percent of respondents that will look for it.
While some of the listed attributes are hard to document, this list may serve as a checklist for candidates to use to evaluate the effectiveness of their resumes. If candidates are invited to an interview, they can focus on communicating the manner in which they are proficient in these particular attributes.
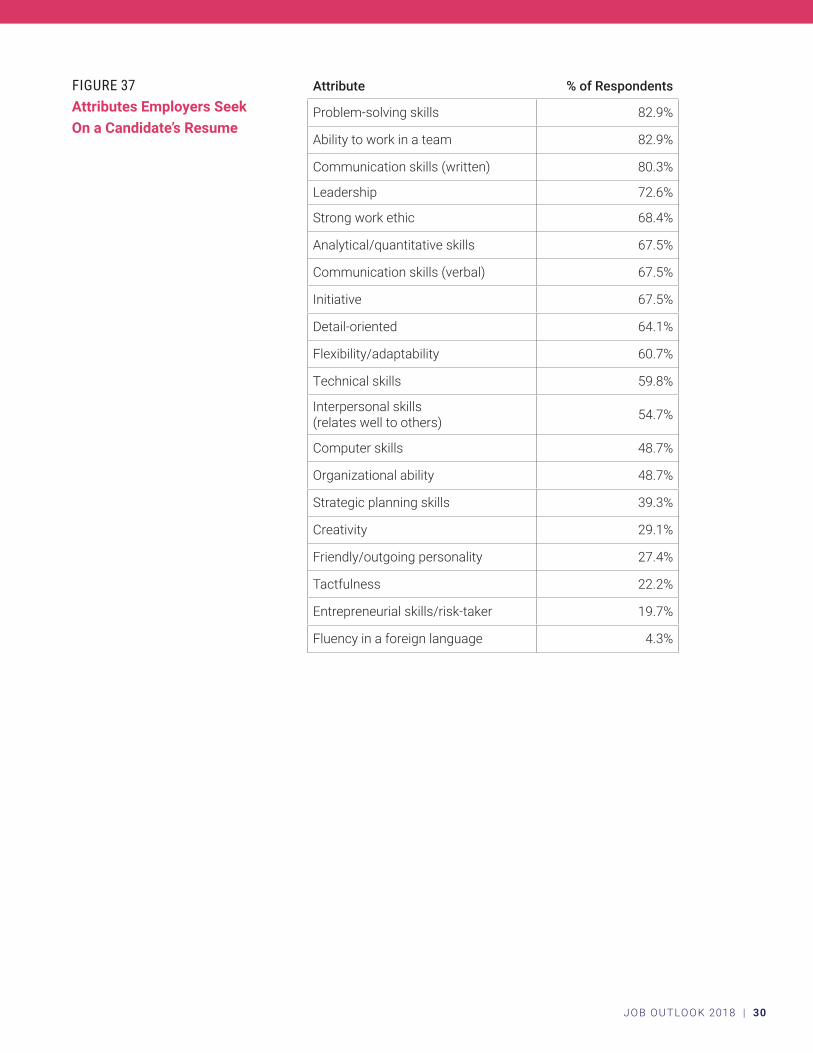
FIGURE 37Attributes Employers Seek On a Candidate’s Resume
Attribute % of Respondents
Problem-solving skills 82.9%
Ability to work in a team 82.9%
Communication skills (written) 80.3%
Leadership 72.6%
Strong work ethic 68.4%
Analytical/quantitative skills 67.5%
Communication skills (verbal) 67.5%
Initiative 67.5%
Detail-oriented 64.1%
Flexibility/adaptability 60.7%
Technical skills 59.8%
Interpersonal skills (relates well to others) 54.7%
Computer skills 48.7%
Organizational ability 48.7%
Strategic planning skills 39.3%
Creativity 29.1%
Friendly/outgoing personality 27.4%
Tactfulness 22.2%
Entrepreneurial skills/risk-taker 19.7%
Fluency in a foreign language 4.3%
JOB OUTLOOK 2018 | 30
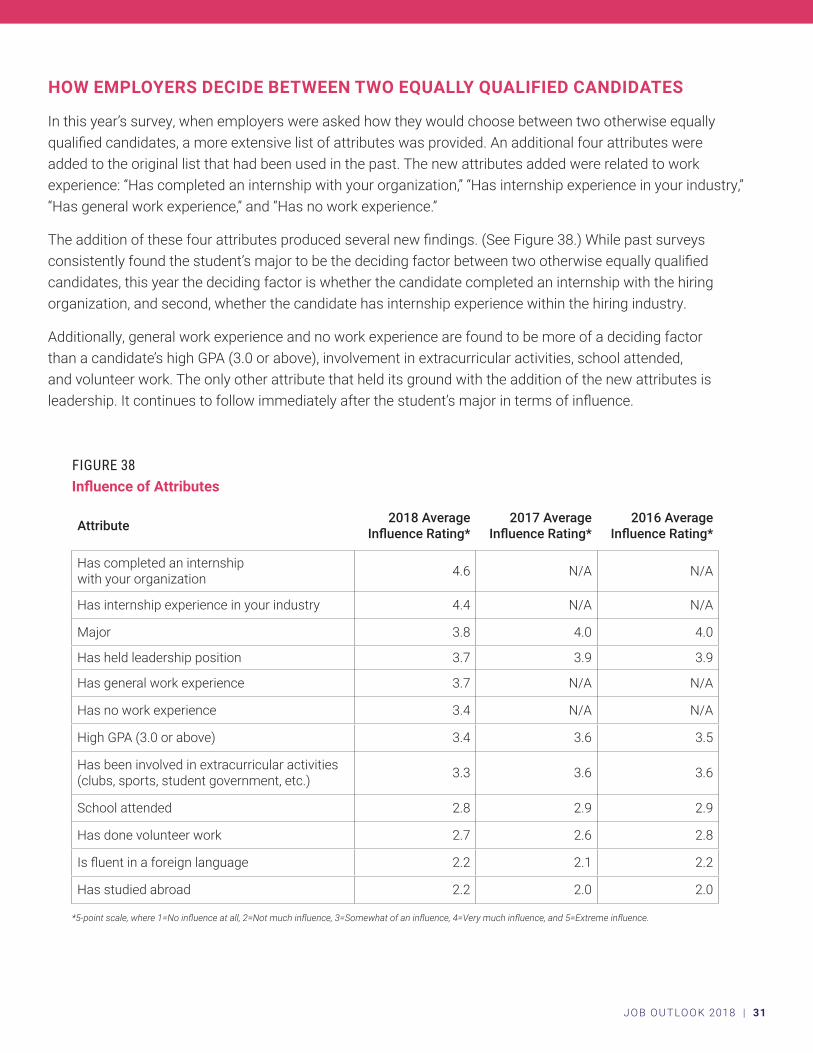
FIGURE 38Influence of Attributes
Attribute 2018 Average Influence Rating*
2017 Average Influence Rating*
2016 Average Influence Rating*
Has completed an internship with your organization 4.6 N/A N/A
Has internship experience in your industry 4.4 N/A N/A
Major 3.8 4.0 4.0
Has held leadership position 3.7 3.9 3.9
Has general work experience 3.7 N/A N/A
Has no work experience 3.4 N/A N/A
High GPA (3.0 or above) 3.4 3.6 3.5
Has been involved in extracurricular activities (clubs, sports, student government, etc.) 3.3 3.6 3.6
School attended 2.8 2.9 2.9
Has done volunteer work 2.7 2.6 2.8
Is fluent in a foreign language 2.2 2.1 2.2
Has studied abroad 2.2 2.0 2.0
*�5-point�scale,�where�1=No�influence�at�all,�2=Not�much�influence,�3=Somewhat�of�an�influence,�4=Very�much�influence,�and�5=Extreme�influence.
JOB OUTLOOK 2018 | 31
HOW EMPLOYERS DECIDE BETWEEN TWO EQUALLY QUALIFIED CANDIDATES
In this year’s survey, when employers were asked how they would choose between two otherwise equally qualified candidates, a more extensive list of attributes was provided. An additional four attributes were added to the original list that had been used in the past. The new attributes added were related to work experience: “Has completed an internship with your organization,” “Has internship experience in your industry,” “Has general work experience,” and “Has no work experience.”
The addition of these four attributes produced several new findings. (See Figure 38.) While past surveys consistently found the student’s major to be the deciding factor between two otherwise equally qualified candidates, this year the deciding factor is whether the candidate completed an internship with the hiring organization, and second, whether the candidate has internship experience within the hiring industry.
Additionally, general work experience and no work experience are found to be more of a deciding factor than a candidate’s high GPA (3.0 or above), involvement in extracurricular activities, school attended, and volunteer work. The only other attribute that held its ground with the addition of the new attributes is leadership. It continues to follow immediately after the student’s major in terms of influence.
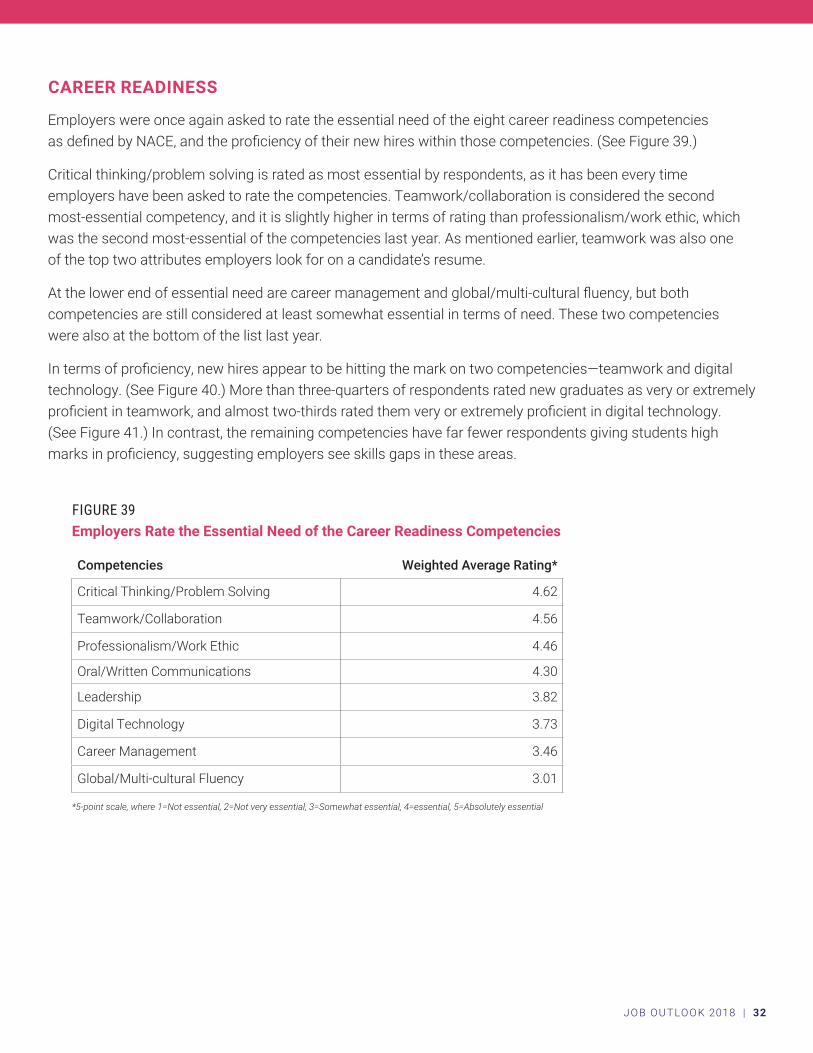
FIGURE 39Employers Rate the Essential Need of the Career Readiness Competencies
Competencies Weighted Average Rating*
Critical Thinking/Problem Solving 4.62
Teamwork/Collaboration 4.56
Professionalism/Work Ethic 4.46
Oral/Written Communications 4.30
Leadership 3.82
Digital Technology 3.73
Career Management 3.46
Global/Multi-cultural Fluency 3.01
*5-point scale, where 1=Not essential, 2=Not very essential, 3=Somewhat essential, 4=essential, 5=Absolutely essential
JOB OUTLOOK 2018 | 32
CAREER READINESS
Employers were once again asked to rate the essential need of the eight career readiness competencies as defined by NACE, and the proficiency of their new hires within those competencies. (See Figure 39.)
Critical thinking/problem solving is rated as most essential by respondents, as it has been every time employers have been asked to rate the competencies. Teamwork/collaboration is considered the second most-essential competency, and it is slightly higher in terms of rating than professionalism/work ethic, which was the second most-essential of the competencies last year. As mentioned earlier, teamwork was also one of the top two attributes employers look for on a candidate’s resume.
At the lower end of essential need are career management and global/multi-cultural fluency, but both competencies are still considered at least somewhat essential in terms of need. These two competencies were also at the bottom of the list last year.
In terms of proficiency, new hires appear to be hitting the mark on two competencies—teamwork and digital technology. (See Figure 40.) More than three-quarters of respondents rated new graduates as very or extremely proficient in teamwork, and almost two-thirds rated them very or extremely proficient in digital technology. (See Figure 41.) In contrast, the remaining competencies have far fewer respondents giving students high marks in proficiency, suggesting employers see skills gaps in these areas.
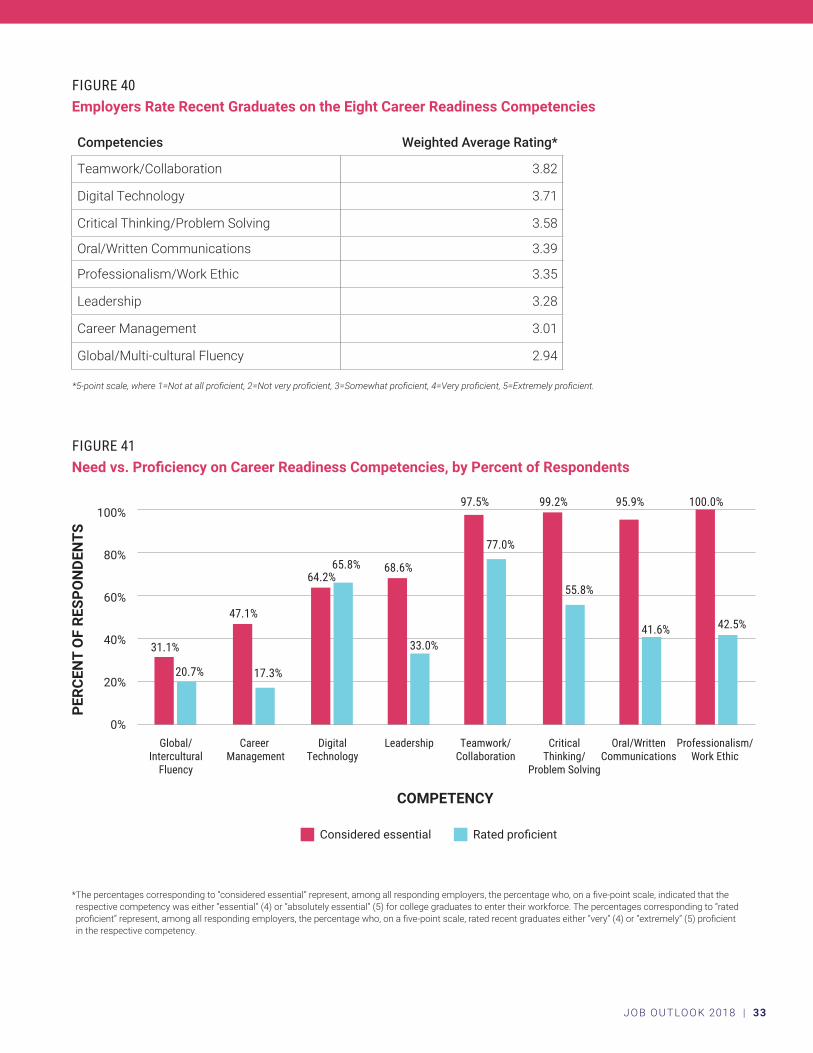
FIGURE 40Employers Rate Recent Graduates on the Eight Career Readiness Competencies
Competencies Weighted Average Rating*
Teamwork/Collaboration 3.82
Digital Technology 3.71
Critical Thinking/Problem Solving 3.58
Oral/Written Communications 3.39
Professionalism/Work Ethic 3.35
Leadership 3.28
Career Management 3.01
Global/Multi-cultural Fluency 2.94
*5-point�scale,�where�1=Not�at�all�proficient,�2=Not�very�proficient,�3=Somewhat�proficient,�4=Very�proficient,�5=Extremely�proficient.
JOB OUTLOOK 2018 | 33
FIGURE 41Need vs. Proficiency on Career Readiness Competencies, by Percent of Respondents
* The percentages corresponding to “considered essential” represent, among all responding employers, the percentage who, on a five-point scale, indicated that the respective competency was either “essential” (4) or “absolutely essential” (5) for college graduates to enter their workforce. The percentages corresponding to “rated proficient” represent, among all responding employers, the percentage who, on a five-point scale, rated recent graduates either “very” (4) or “extremely” (5) proficient in the respective competency.
Considered essential Rated proficient
COMPETENCY
Global/ Intercultural
Fluency
Career Management
Digital Technology
Leadership Teamwork/ Collaboration
Critical Thinking/
Problem Solving
Oral/Written Communications
Professionalism/ Work Ethic
PERC
ENT
OF
RESP
ON
DEN
TS
100%
80%
60%
40%
20%
0%
31.1%
47.1%
64.2%68.6%
97.5% 99.2% 95.9% 100.0%
20.7% 17.3%
65.8%
33.0%
77.0%
55.8%
41.6% 42.5%
COMPENSATION & SIGNING BONUSES
JOB OUTLOOK 2018 | 34
STARTING SALARIES
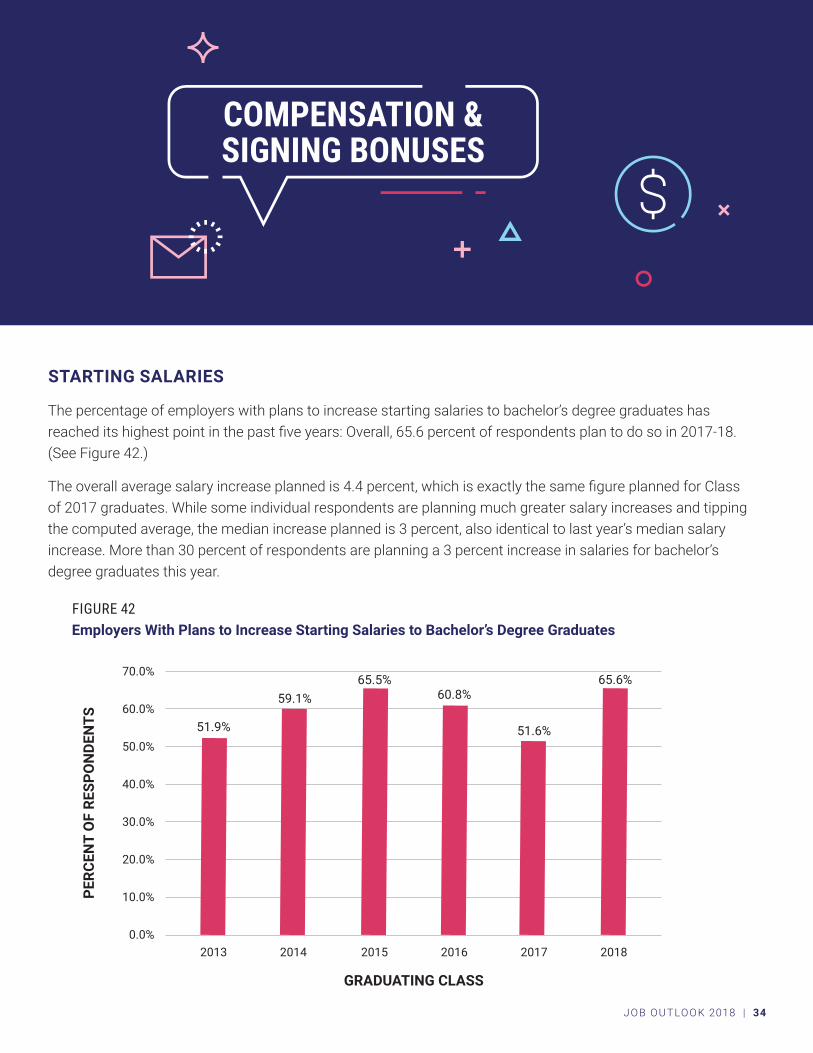
The percentage of employers with plans to increase starting salaries to bachelor’s degree graduates has reached its highest point in the past five years: Overall, 65.6 percent of respondents plan to do so in 2017-18. (See Figure 42.)
The overall average salary increase planned is 4.4 percent, which is exactly the same figure planned for Class of 2017 graduates. While some individual respondents are planning much greater salary increases and tipping the computed average, the median increase planned is 3 percent, also identical to last year’s median salary increase. More than 30 percent of respondents are planning a 3 percent increase in salaries for bachelor’s degree graduates this year.
FIGURE 42Employers With Plans to Increase Starting Salaries to Bachelor’s Degree Graduates
GRADUATING CLASS
PERC
ENT
OF
RESP
ON
DEN
TS
70.0%
60.0%
50.0%
40.0%
30.0%
20.0%
10.0%
0.0%2013
51.9%
2014
59.1%
2015
65.5%
2016
60.8%
2017
51.6%
2018
65.6%
JOB OUTLOOK 2018 | 35
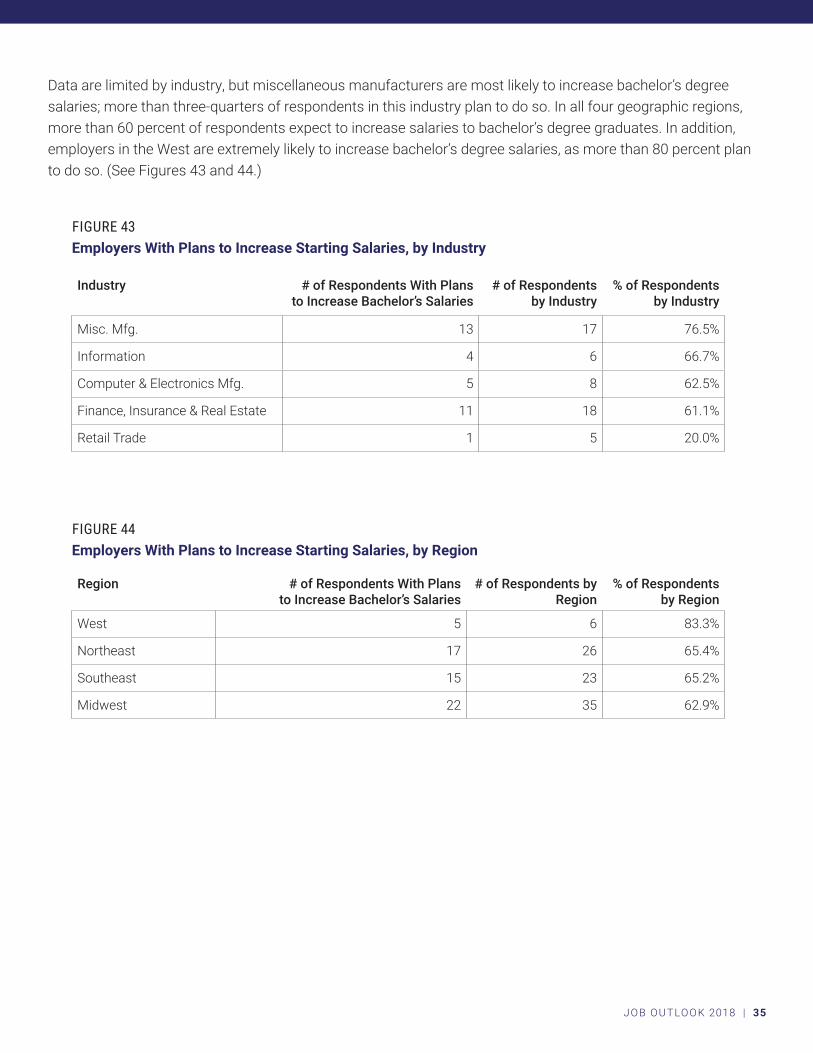
Data are limited by industry, but miscellaneous manufacturers are most likely to increase bachelor’s degree salaries; more than three-quarters of respondents in this industry plan to do so. In all four geographic regions, more than 60 percent of respondents expect to increase salaries to bachelor’s degree graduates. In addition, employers in the West are extremely likely to increase bachelor’s degree salaries, as more than 80 percent plan to do so. (See Figures 43 and 44.)
FIGURE 43Employers With Plans to Increase Starting Salaries, by Industry
Industry # of Respondents With Plans to Increase Bachelor’s Salaries
# of Respondents by Industry
% of Respondents by Industry
Misc. Mfg. 13 17 76.5%
Information 4 6 66.7%
Computer & Electronics Mfg. 5 8 62.5%
Finance, Insurance & Real Estate 11 18 61.1%
Retail Trade 1 5 20.0%
FIGURE 44Employers With Plans to Increase Starting Salaries, by Region
Region # of Respondents With Plans to Increase Bachelor’s Salaries
# of Respondents by Region
% of Respondents by Region
West 5 6 83.3%
Northeast 17 26 65.4%
Southeast 15 23 65.2%
Midwest 22 35 62.9%
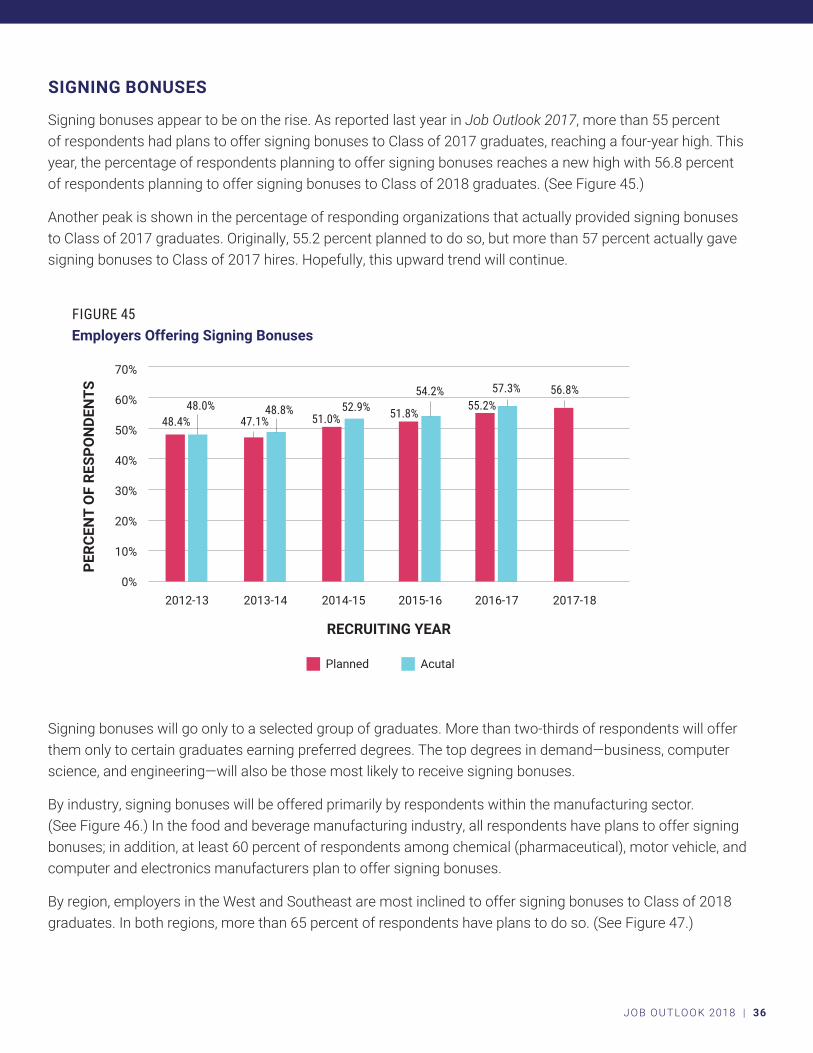
FIGURE 45Employers Offering Signing Bonuses
Planned Acutal
RECRUITING YEAR
2012-13 2013-14 2014-15 2015-16 2016-17 2017-18
PERC
ENT
OF
RESP
ON
DEN
TS
70%
60%
50%
40%
30%
20%
10%
0%
48.4% 47.1% 51.0% 51.8% 55.2%56.8%
48.0% 48.8% 52.9%54.2% 57.3%
JOB OUTLOOK 2018 | 36
SIGNING BONUSES
Signing bonuses appear to be on the rise. As reported last year in Job Outlook 2017, more than 55 percent of respondents had plans to offer signing bonuses to Class of 2017 graduates, reaching a four-year high. This year, the percentage of respondents planning to offer signing bonuses reaches a new high with 56.8 percent of respondents planning to offer signing bonuses to Class of 2018 graduates. (See Figure 45.)
Another peak is shown in the percentage of responding organizations that actually provided signing bonuses to Class of 2017 graduates. Originally, 55.2 percent planned to do so, but more than 57 percent actually gave signing bonuses to Class of 2017 hires. Hopefully, this upward trend will continue.
Signing bonuses will go only to a selected group of graduates. More than two-thirds of respondents will offer them only to certain graduates earning preferred degrees. The top degrees in demand—business, computer science, and engineering—will also be those most likely to receive signing bonuses.
By industry, signing bonuses will be offered primarily by respondents within the manufacturing sector. (See Figure 46.) In the food and beverage manufacturing industry, all respondents have plans to offer signing bonuses; in addition, at least 60 percent of respondents among chemical (pharmaceutical), motor vehicle, and computer and electronics manufacturers plan to offer signing bonuses.
By region, employers in the West and Southeast are most inclined to offer signing bonuses to Class of 2018 graduates. In both regions, more than 65 percent of respondents have plans to do so. (See Figure 47.)
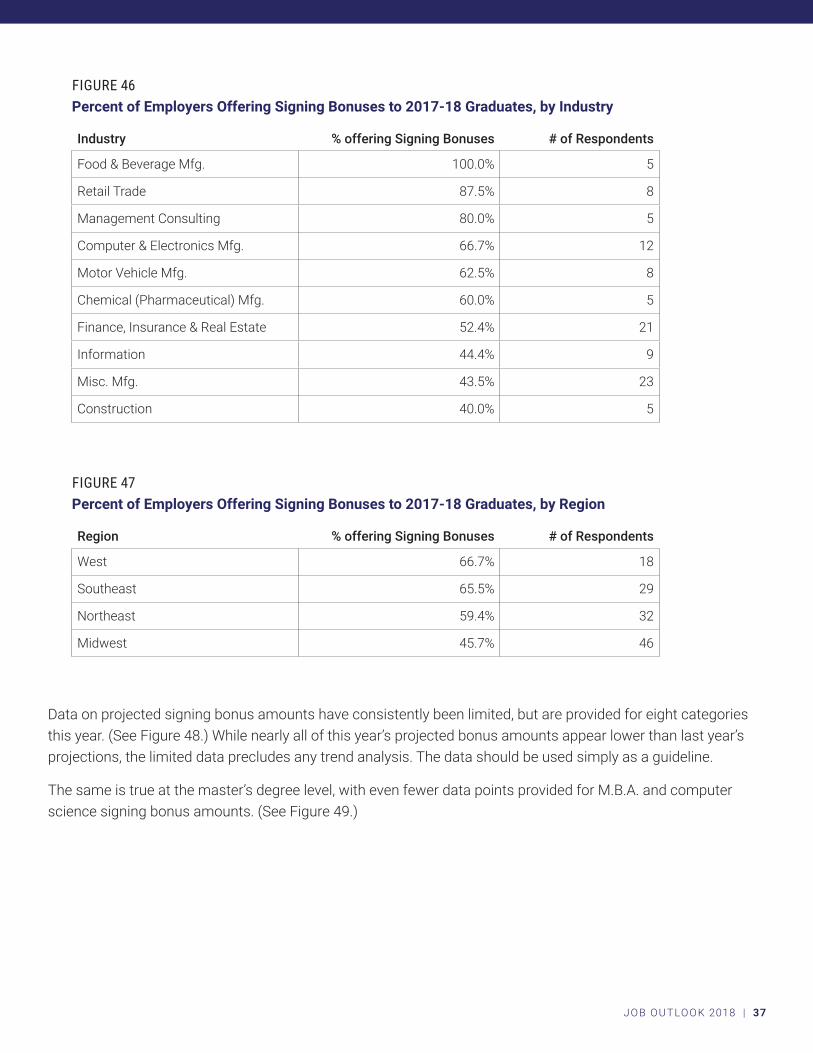
FIGURE 46Percent of Employers Offering Signing Bonuses to 2017-18 Graduates, by Industry
Industry % offering Signing Bonuses # of Respondents
Food & Beverage Mfg. 100.0% 5
Retail Trade 87.5% 8
Management Consulting 80.0% 5
Computer & Electronics Mfg. 66.7% 12
Motor Vehicle Mfg. 62.5% 8
Chemical (Pharmaceutical) Mfg. 60.0% 5
Finance, Insurance & Real Estate 52.4% 21
Information 44.4% 9
Misc. Mfg. 43.5% 23
Construction 40.0% 5
JOB OUTLOOK 2018 | 37
FIGURE 47Percent of Employers Offering Signing Bonuses to 2017-18 Graduates, by Region
Region % offering Signing Bonuses # of Respondents
West 66.7% 18
Southeast 65.5% 29
Northeast 59.4% 32
Midwest 45.7% 46
Data on projected signing bonus amounts have consistently been limited, but are provided for eight categories this year. (See Figure 48.) While nearly all of this year’s projected bonus amounts appear lower than last year’s projections, the limited data precludes any trend analysis. The data should be used simply as a guideline.
The same is true at the master’s degree level, with even fewer data points provided for M.B.A. and computer science signing bonus amounts. (See Figure 49.)
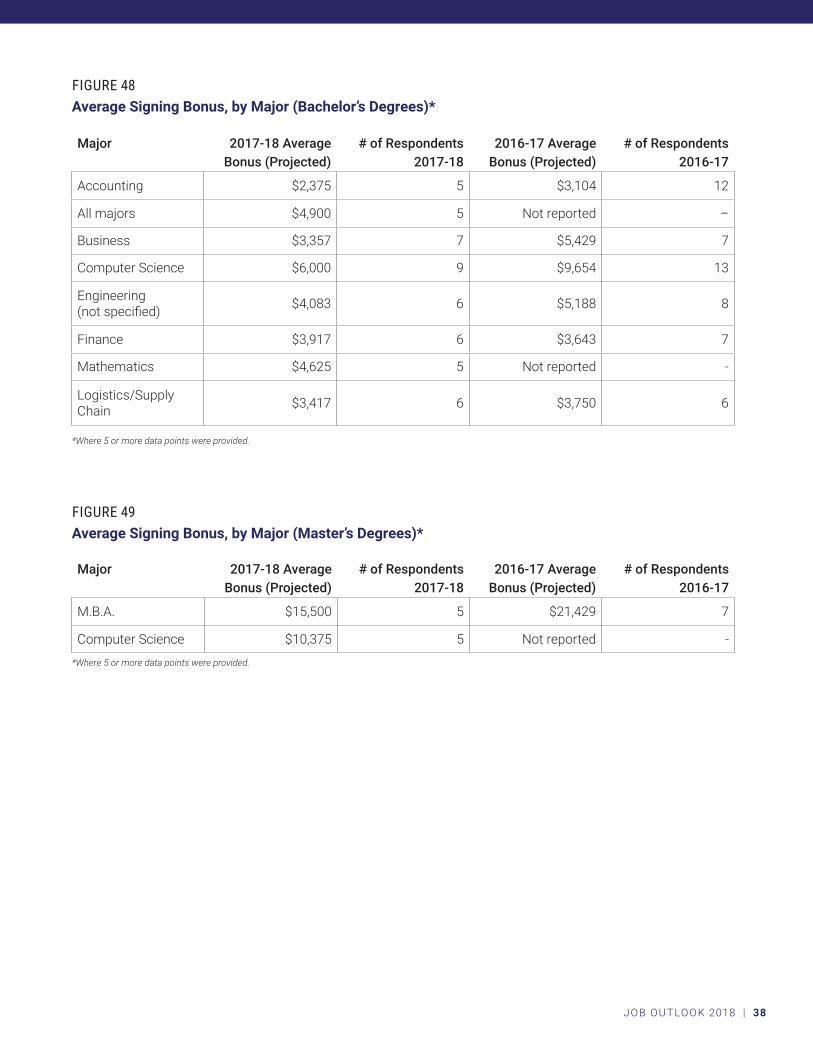
FIGURE 48Average Signing Bonus, by Major (Bachelor’s Degrees)*
Major 2017-18 Average Bonus (Projected)
# of Respondents 2017-18
2016-17 Average Bonus (Projected)
# of Respondents 2016-17
Accounting $2,375 5 $3,104 12
All majors $4,900 5 Not reported –
Business $3,357 7 $5,429 7
Computer Science $6,000 9 $9,654 13
Engineering (not specified) $4,083 6 $5,188 8
Finance $3,917 6 $3,643 7
Mathematics $4,625 5 Not reported -
Logistics/Supply Chain $3,417 6 $3,750 6
*Where 5 or more data points were provided.
*Where 5 or more data points were provided.
JOB OUTLOOK 2018 | 38
FIGURE 49Average Signing Bonus, by Major (Master’s Degrees)*
Major 2017-18 Average Bonus (Projected)
# of Respondents 2017-18
2016-17 Average Bonus (Projected)
# of Respondents 2016-17
M.B.A. $15,500 5 $21,429 7
Computer Science $10,375 5 Not reported -
WHAT’S AHEAD FOR THE CLASS OF 2018
Hiring updates for the Class of 2018 will be provided in the NACE Job Outlook 2018 Spring Update report. Data will be collected in February and March 2018, with results available in April 2018.
Salary projections for the Class of 2018 will be available in January 2018 in the Winter 2018 Salary Survey. Salary data collected through this Job Outlook 2018 survey, which remains open through the end of November, will be the basis for the report.
JOB OUTLOOK 2018 | 39
APPENDIX
JOB OUTLOOK 2018 | 40
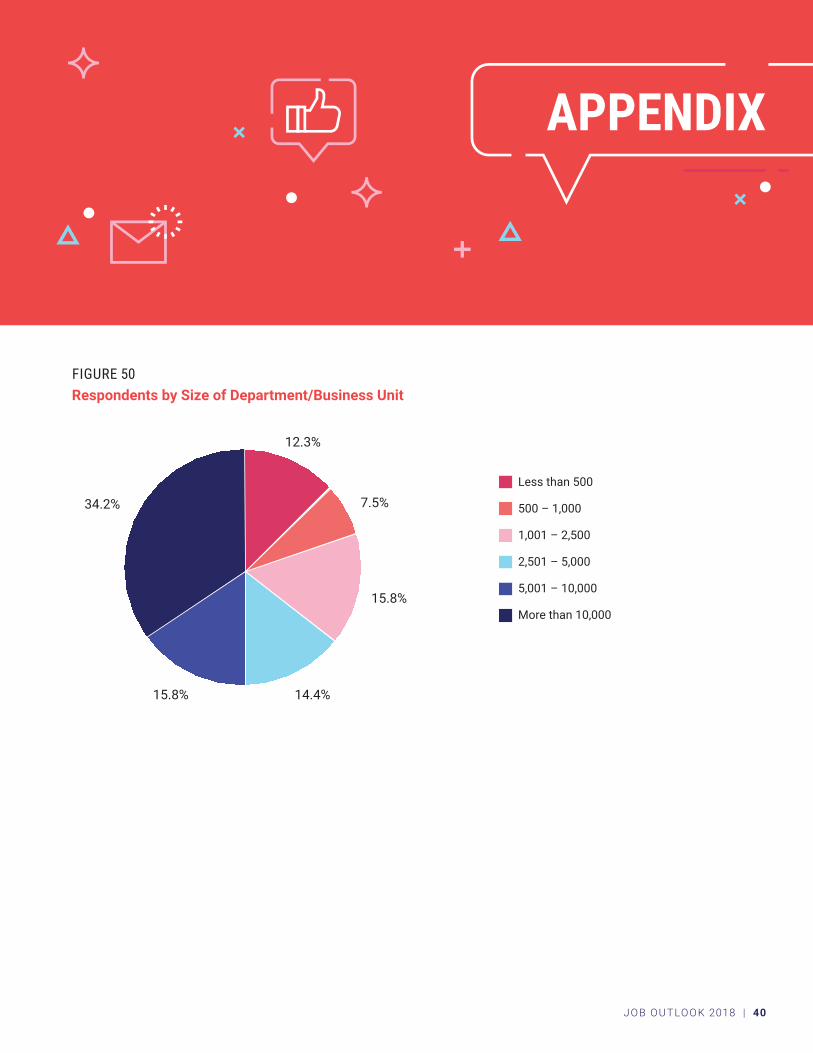
FIGURE 50Respondents by Size of Department/Business Unit
Less than 500
500 – 1,000
1,001 – 2,500
2,501 – 5,000
5,001 – 10,000
More than 10,000
34.2%
15.8% 14.4%
15.8%
7.5%
12.3%
JOB OUTLOOK 2018 | 41
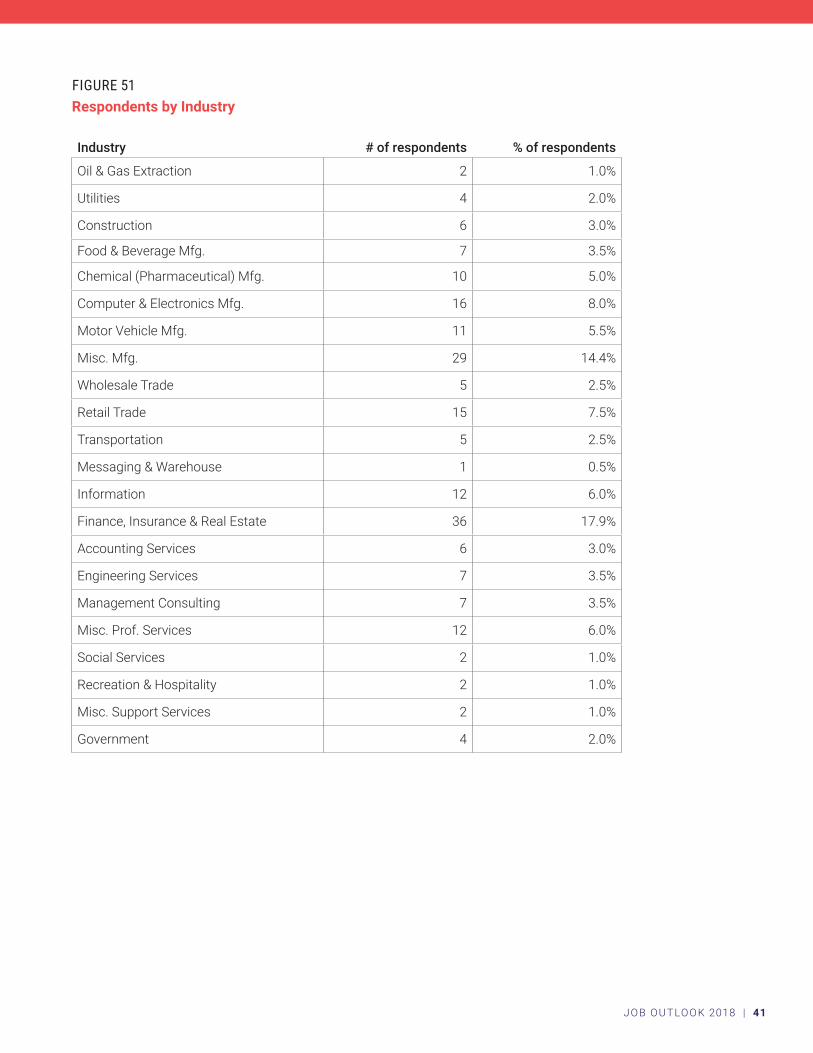
FIGURE 51Respondents by Industry
Industry # of respondents % of respondents
Oil & Gas Extraction 2 1.0%
Utilities 4 2.0%
Construction 6 3.0%
Food & Beverage Mfg. 7 3.5%
Chemical (Pharmaceutical) Mfg. 10 5.0%
Computer & Electronics Mfg. 16 8.0%
Motor Vehicle Mfg. 11 5.5%
Misc. Mfg. 29 14.4%
Wholesale Trade 5 2.5%
Retail Trade 15 7.5%
Transportation 5 2.5%
Messaging & Warehouse 1 0.5%
Information 12 6.0%
Finance, Insurance & Real Estate 36 17.9%
Accounting Services 6 3.0%
Engineering Services 7 3.5%
Management Consulting 7 3.5%
Misc. Prof. Services 12 6.0%
Social Services 2 1.0%
Recreation & Hospitality 2 1.0%
Misc. Support Services 2 1.0%
Government 4 2.0%
JOB OUTLOOK 2018 | 42
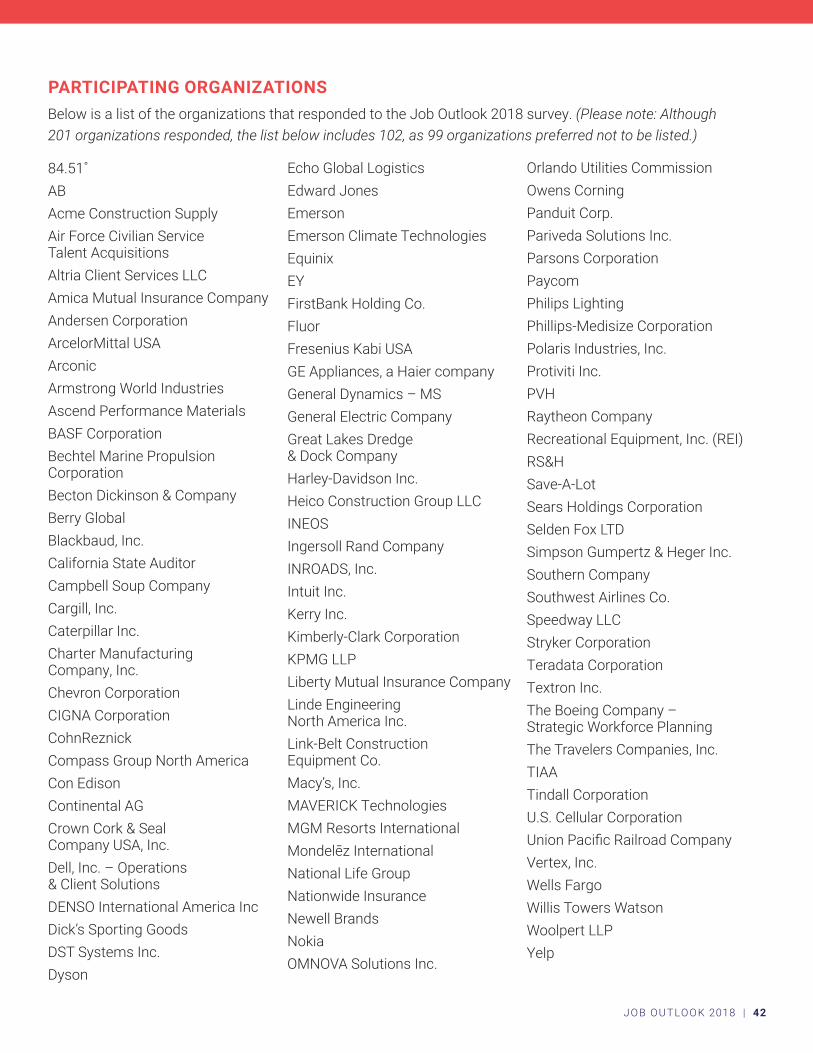
PARTICIPATING ORGANIZATIONSBelow is a list of the organizations that responded to the Job Outlook 2018 survey. (Please note: Although 201 organizations responded, the list below includes 102, as 99 organizations preferred not to be listed.)
84.51˚ABAcme Construction SupplyAir Force Civilian Service Talent AcquisitionsAltria Client Services LLCAmica Mutual Insurance CompanyAndersen CorporationArcelorMittal USAArconicArmstrong World IndustriesAscend Performance MaterialsBASF CorporationBechtel Marine Propulsion CorporationBecton Dickinson & CompanyBerry GlobalBlackbaud, Inc.California State AuditorCampbell Soup CompanyCargill, Inc.Caterpillar Inc.Charter Manufacturing Company, Inc.Chevron CorporationCIGNA CorporationCohnReznickCompass Group North AmericaCon EdisonContinental AGCrown Cork & Seal Company USA, Inc.Dell, Inc. – Operations & Client SolutionsDENSO International America IncDick’s Sporting GoodsDST Systems Inc.Dyson
Echo Global LogisticsEdward JonesEmersonEmerson Climate TechnologiesEquinixEYFirstBank Holding Co.FluorFresenius Kabi USAGE Appliances, a Haier companyGeneral Dynamics – MSGeneral Electric CompanyGreat Lakes Dredge & Dock CompanyHarley-Davidson Inc.Heico Construction Group LLCINEOSIngersoll Rand CompanyINROADS, Inc.Intuit Inc.Kerry Inc.Kimberly-Clark CorporationKPMG LLPLiberty Mutual Insurance CompanyLinde Engineering North America Inc.Link-Belt Construction Equipment Co.Macy’s, Inc.MAVERICK TechnologiesMGM Resorts InternationalMondelēz InternationalNational Life GroupNationwide InsuranceNewell BrandsNokiaOMNOVA Solutions Inc.
Orlando Utilities CommissionOwens CorningPanduit Corp.Pariveda Solutions Inc.Parsons CorporationPaycomPhilips LightingPhillips-Medisize CorporationPolaris Industries, Inc.Protiviti Inc.PVHRaytheon CompanyRecreational Equipment, Inc. (REI)RS&HSave-A-LotSears Holdings CorporationSelden Fox LTDSimpson Gumpertz & Heger Inc.Southern CompanySouthwest Airlines Co.Speedway LLCStryker CorporationTeradata CorporationTextron Inc.The Boeing Company – Strategic Workforce PlanningThe Travelers Companies, Inc.TIAATindall CorporationU.S. Cellular CorporationUnion Pacific Railroad CompanyVertex, Inc.Wells FargoWillis Towers WatsonWoolpert LLPYelp