Embed Size (px)
Citation preview

HSBC FundsSemi-Annual ReportApril 30, 2019
MONEY MARKET FUNDS Class A Class C Class D Class E Class IIntermediary
Class
Intermediary Service Class Class Y
HSBC U.S. Government Money Market Fund
FTRXX HUMXX HGDXX HGEXX HGIXX HGGXX HGFXX RGYXX
HSBC U.S. Treasury Money Market Fund
HWAXX HUCXX HTDXX HTEXX HBIXX HTGXX HTFXX HTYXX
JOB TITLE HSBC Money Market SAR REVISION 6 SERIAL <12345678> DATE Saturday, June 22, 2019 JOB NUMBER 358989-1 TYPE PAGE NO. i OPERATOR ABIGAELS

JOB TITLE HSBC Money Market SAR REVISION 6 SERIAL <12345678> DATE Saturday, June 22, 2019 JOB NUMBER 358989-1 TYPE PAGE NO. ii OPERATOR ABIGAELS

Table of Contents
HSBC Family of FundsSemi-Annual Report - April 30, 2019
Glossary of Terms ................................................................................................................................................................................................... 2Commentary From the Investment Manager......................................................................................................................................................... 3Portfolio Reviews .................................................................................................................................................................................................... 4Portfolio Composition ............................................................................................................................................................................................. 6
Schedules of Portfolio Investments
HSBC U.S. Government Money Market Fund .................................................................................................................................................... 7 HSBC U.S. Treasury Money Market Fund ........................................................................................................................................................... 10Statements of Assets and Liabilities ...................................................................................................................................................................... 11Statements of Operations ...................................................................................................................................................................................... 12Statements of Changes in Net Assets ................................................................................................................................................................... 13Financial Highlights ................................................................................................................................................................................................. 14Notes to Financial Statements ............................................................................................................................................................................... 18Investment Adviser Contract Approval ................................................................................................................................................................... 28Table of Shareholder Expenses .............................................................................................................................................................................. 31Other Information ................................................................................................................................................................................................... 33
JOB TITLE HSBC Money Market SAR REVISION 6 SERIAL <12345678> DATE Saturday, June 22, 2019 JOB NUMBER 358989-1 TYPE PAGE NO. 1 OPERATOR ABIGAELS

Glossary of Terms
Beta is a measure of the volatility, or systematic risk, of a security or a portfolio in comparison to the market as a whole. Beta is used in the capital asset pricing model, which calculates the expected return of an asset based on its beta and expected market returns.
Bloomberg Barclays Global Aggregate Index is an index that is the measure of the global investment-grade debt from 24 local currency markets, which include treasury, government-related, corporate, and securitized fixed-rate bonds from both developed and emerging markets issuers.
Bloomberg Barclays U.S. Aggregate Bond Index is a broad-based benchmark that measures the investment-grade, U.S. dollar-denominated, fixed-rate taxable bond market. This includes Treasuries, government-related and corporate securities, mortgage-backed securities, asset-backed securities and collateralized mortgage-backed securities.
Gross Domestic Product (“GDP”) is the value of goods and services produced in a given country in a given year.
J.P. Morgan Emerging Markets Bond Index Global is an index that tracks returns for USD-denominated debt instruments issued by emerging market sovereign and quasi-sovereign entities, Brady bonds, loans, Eurobonds, and local market instruments.
London Interbank Offered Rate (“LIBOR”) is a daily reference rate based on the interest rates at which banks borrow unsecured funds from other banks in the London wholesale money market.
MSCI Europe Australasia and Far East (“MSCI EAFE”) Index is an equity index which captures the large- and mid-cap representation across 21 developed markets countries, excluding the U.S. and Canada.
MSCI Emerging Markets Index is a float-adjusted market capitalization index that is designed to measure equity market performance in global emerging markets.
MSCI Frontier Markets Index is an equity index that captures large- and mid-cap representation across 29 frontiers markets countries.
Purchasing Managers’ Index (“PMI”) is an indicator of the economic health of the manufacturing sector. The PMI is based on five major indicators: new orders, inventory levels, production, supplier deliveries, and the employment environment.
Russell 2000® Index is an index that is a subset of the Russell 3000® Index representing approximately 10% of the total market capitalization of that index. It includes approximately 2000 of the smallest securities based on a combination of their market cap and current index membership.
Standard & Poor’s 500 (“S&P 500”) Index is an index that is widely regarded as a gauge of the U.S. equities market. This index includes 500 leading companies in leading industries of the U.S. economy. The S&P 500 Index focuses on the large-cap segment of the market, with approximately 80% coverage of U.S. equities.
Securities indices are unmanaged and assume reinvestment of all distributions and interest payments and do not take in account brokerage fees or expenses. Securities in the Funds do not match those in the indices and performance of the Funds will differ. Investors cannot invest directly in an index.
2 HSBC FAMILY OF FUNDS
JOB TITLE HSBC Money Market SAR REVISION 6 SERIAL <12345678> DATE Saturday, June 22, 2019 JOB NUMBER 358989-1 TYPE PAGE NO. 2 OPERATOR ABIGAELS

Commentary From the Investment Manager (Unaudited)
HSBC Global Asset Management (USA) Inc.
Global Economic Review
Global economic volatility characterized the six-month period between November 1, 2018 and April 30, 2019. Economic growth in the U.S. offset declines in other major developed economies, as global manufacturing weakened overall during the period despite a temporary rebound in March. Global equities showed growth toward the end of the period and a more dovish monetary policy outlook produced a significant recovery in risk assets in the first quarter of 2019.
Global equity markets posted sharp declines in the final months of 2018, driven by manufacturing concerns in the eurozone and fears of a recession in the U.S. Despite strong global growth and continued economic growth in the U.S., slowdowns in the eurozone, Japan and many emerging markets heightened investor concerns. A flattening U.S. yield curve late in 2018 added to these concerns despite strong macroeconomic and corporate fundamentals in the U.S.
Investor confidence returned in early 2019, in part due to easing monetary policy in the U.S. and China. China led the schedule in early January with its decision to loosen its monetary policy in early 2019. Meanwhile, the U.S. Federal Reserve (the Fed) pivoted to a dovish stance in January after raising rates in December, signaling an end to rate hikes for the near future. Renewed investor appetite for risk found additional support from the U.S. economy’s positive fundamentals, helping to drive robust gains in U.S. equity markets for the remainder of the period. Most major market indices in developed and emerging markets produced positive returns over the six-month period under review.
In March 2019, the U.S. yield curve became inverted, triggering recession concerns. This inversion was limited to a narrow section of the yield curve and was to a lesser degree than inversions seen prior to the last three recessions. To some analysts, this suggested the possibility of a cyclical slowdown rather than a full-blown recession.
U.S. gross domestic product (GDP)1 grew at a rate of 2.2% in the fourth quarter of 2018. A preliminary estimate puts GDP growth at 3.2% for the first quarter of 2019. The U.S. labor market remained tight throughout the period as the unemployment rate dropped to 3.6% in April, its lowest point since 2000. Wage growth fell moderately from December through March before recovering slightly in April.
The eurozone entered the period in the third month of a slowdown which extended throughout the period. Concerns about the health of the German manufacturing sector rose on the back of weak factory orders and Purchasing Managers’ Index1 data. However, by the end of the period, German manufacturing showed signs of resilience. The attenuated negotiations over the United Kingdom’s exit from the eurozone (commonly referred to as Brexit) continue to weigh on UK economic performance, as “no-deal,” “deal” or “no Brexit” options all remain on the table. This has generated a great deal of uncertainty for businesses and investors alike. The extent of the impact of Brexit in the UK and in global markets as well as any associated adverse consequences remain unclear. Despite the eurozone’s economic underperformance during the period, labor markets remained strong.
Between December and February, Japan’s cyclical indicators all fell to their lowest levels since early 2016, before bouncing back slightly in March. Soft global trade has weighed on the country’s economy due to its exposure to China. The metrics used by the Bank of Japan to assess underlying inflation trends have weakened since the beginning of 2018, but inflation has remained low due to demographics and behavioral biases among consumers and businesses.
China’s economy faced softness due to macroeconomic headwinds through the first part of the period, as manufacturing export and domestic orders deteriorated and industrial profits fell. A rebound in the manufacturing sector drove a broad-based recovery in March, but the gap between new domestic and export orders remains wide. Changing prospects of a trade deal between the U.S. and China have also caused sentiment to fluctuate within the Chinese manufacturing sector.
Overall, emerging market returns have been relatively strong since early December 2018, with manufacturing sectors in some markets, particularly Asia, showing a rise in new orders. Semiconductor exports out of Korea and Taiwan showed signs of stabilization in March after deteriorating significantly from the fourth quarter of 2018 through February 2019.
Market review
Global equity markets generally did relatively well for the period, with MSCI Emerging Markets Index1 returning 13.90% during the period. The MSCI EAFE Index1 of developed market international stocks produced a 7.73% return. U.S. stocks generally outperformed international markets during the period.
U.S. equities experienced volatility during the period under review, but ultimately ended the period higher. Declines at the beginning of the period accelerated following the Fed’s rate hike in December, before rebounding in the final days of 2018 and recovering steadily through the end of the period. The S&P 500 Index1 of large company stocks returned 9.76% during the six-month period, outpacing the Russell 2000® Index1 of small and mid-sized company stocks, which rose 6.06% during the period.
Global fixed income markets generally did well on the back of looser monetary policy from the two largest economies in the world. The Bloomberg Barclays Global Aggregate Index1, which tracks investment-grade debt in 24 local currency markets, returned 4.28% for the period. Emerging markets debt, in particular, benefited from falling Treasury yields. The J.P. Morgan Emerging Markets Bond Index Global1 returned 7.86%.
U.S. fixed income investments generally outperformed their global counterparts amid the Fed’s more dovish tone, but not emerging markets. The Bloomberg Barclays U.S. Aggregate Bond Index1 total return, which tracks the broad investment-grade fixed-income market, posted a 5.49% return in the period. 1 For additional information, please refer to the Glossary of Terms.
HSBC FAMILY OF FUNDS 3
JOB TITLE HSBC Money Market SAR REVISION 6 SERIAL <12345678> DATE Saturday, June 22, 2019 JOB NUMBER 358989-1 TYPE PAGE NO. 3 OPERATOR ABIGAELS

Portfolio Reviews (Unaudited)
HSBC U.S. Government Money Market Fund(Class A Shares, Class C Shares, Class D Shares, Class E Shares, Class I Shares, Intermediary Class, Intermediary Service Class and Class Y Shares)by John ChiodiSenior Portfolio Manager
Investment Concerns
You could lose money by investing in the Fund. Although the Fund seeks to preserve the value of your investment at $1.00 per share, it cannot guarantee it will do so. An investment in the Fund is not a deposit of HSBC Bank USA, N.A. and is not insured or guaranteed by the Federal Deposit Insurance Corporation or any other government agency. The Fund’s sponsor has no legal obligation to provide financial support to the Fund, and you should not expect that the sponsor will provide financial support to the Fund at any time.For a complete description of these and other risks associated with investment in a mutual fund, please refer to the Fund’s prospectus.Portfolio Performance
Yields on U.S. government money market securities rose during the period ended April 30, 2019. The U.S. Federal Reserve (Fed) raised short-term interest rates once during the period, in December 2018. As the rate environment changed and the yield curve inverted, the Fund was positioned to take advantage of higher-yielding areas of the fixed income markets without exceeding weighted-average life limits in duration. Early in the period, the Fund’s absolute performance continued to benefit
from repurchase agreements (repos) as it took advantage of shorter-duration securities in anticipation of the December rate hike. The Fund also benefitted from its heavily weighted position in floating-rate securities for the first three months of the period. Since the Fed halted its rate hikes in December, the Fund has maintained its repo positions and continues to take advantage of the remaining yield steepness in LIBOR7.†
The reporting period was marked by a negative market response to the Fed’s December rate hike. Equity markets declined and yield spreads compressed. By January, the Treasury bill yield curve inverted and it became apparent that markets no longer anticipated rate hikes from the Fed, which subsequently announced a hold on rate increases. Despite market and political pressures to cut rates, the Fed has not yet shown any indication that it would do so.The inverted yield curve made longer-term fixed-rate securities less attractive, and the halt in rate hikes suppressed yields on floating-rate securities. This dynamic resulted in overnight repo yields outstripping the federal funds rate by 5-10 basis points (0.05%-0.10%) per day over the last months of the period. † Portfolio composition is subject to change.
Moody’s and Standard & Poor’s have assigned an “Aaa-mf” and
“AAAm” rating to the HSBC U.S. Government Money Market Fund.1
Fund PerformanceAverage Annual Total Return (%) Yield (%)2
Expense Ratio (%)3
As of April 30, 2019 Inception
DateSix
Months*1
Year5
Year10
YearSince
Inception7-Day
Average Gross NetClass A 5/3/90 0.89 1.55 0.44 0.23 2.45 1.86 0.66 0.66Class C4 11/20/06 — — — — 1.39 — 1.26 1.26Class D 4/1/99 0.96 1.70 0.51 0.26 1.56 2.01 0.51 0.51Class E5 7/12/16 — — — — 0.34 — 0.26 0.25Class I6 12/24/03 1.14 2.07 0.73 0.39 1.07 2.37 0.16 0.14Intermediary Class 7/12/16 1.12 2.03 — — 1.21 2.33 0.31 0.18Intermediary Service Class 7/12/16 1.11 2.01 — — 1.19 2.31 0.36 0.20Class Y 7/1/96 1.09 1.96 0.65 0.34 2.12 2.26 0.26 0.26
Past performance does not guarantee future results. The performance data quoted represents past performance and current returns may be lower or higher. Total return figures include change in share price, reinvestment of dividends and capital gains and do not reflect taxes that a shareholder would pay on Fund distributions or on the redemption of Fund shares. Investment return and principal value will fluctuate so that an investor’s shares, when redeemed may be worth more or less than the original cost. To obtain performance information current to the most recent month end, please call 1-800-782-8183.The performance above reflects any fee waivers that have been in effect during the applicable periods, as well as any expense reimbursements that have periodically been made. Absent such waivers and reimbursements, returns would have been lower. Currently, contractual fee waivers and/or expense reimbursements are in effect for the Fund through March 1, 2020 for the Class E Shares, Intermediary Class Shares and Intermediary Service Class Shares.* Aggregate1 The “Aaa-mf ” and “AAAm” money market fund rating is historical and reflects Moody’s and Standard & Poor’s opinion as to the quality of the Fund’s investments, liquidity
management, and operations and trading support. Periodic reviews are conducted to ensure a secure operations environment. Moody’s and Standard & Poor’s ratings represent an opinion only, not a recommendation to buy or sell. Obligations rated A-1+, A-1 or P-1 are rated in the highest short-term rating category by Standard & Poor’s (A-1+ or A-1) or Moody’s Investor Service (P-1). The obligor’s capacity to meet its financial commitments on these obligations is regarded to be “extremely strong” (A-1+), “strong” (A-1) or “superior” (P-1).
2 The seven-day yield quotation more closely reflects the current earnings of the money market fund than the total return quotation. The seven-day yield reflects voluntary fee waivers/expense reimbursements. Without the voluntary fee waivers/expense reimbursements, the yields would have been 1.83%, 1.98%, 2.33%, 2.18%, 2.13% and 2.23% for Class A Shares, Class D Shares, Class I Shares, Intermediary Class, Intermediary Service Class and Class Y Shares, respectively.
3 Reflects the expense ratio as reported in the prospectus dated February 28, 2019. HSBC Global Asset Management (USA) Inc., the Adviser, has entered into a contractual expense limitation agreement with the Fund under which it will limit total expenses of the Fund (excluding interest, taxes, brokerage commissions, extraordinary expenses and estimated indirect expenses attributable to the Fund’s investments in investment companies) to an annual rate of 0.25%, 0.14%, 0.18%, and 0.20% for Class E Shares, Class I Shares, Intermediary Class Shares, and Intermediary Service Class Shares, respectively. The expense limitation shall be in effect until March 1, 2020. Additional information pertaining to the April 30, 2019 expense ratios can be found in the financial highlights.
4 Reflects the applicable contingent deferred sales charge, maximum of 1.00%, for returns presented. Class C Shares were operational during a portion of the periods presented. Amounts reflect performance for the period of time the Class had operations, which was 346, 362 and 351 days during the years ended October 31, 2006, 2009 and 2010, respectively. The Class was not operational during the entire six-months ended April 30, 2019 and entire fiscal years ended October 31, 2007, 2008, 2011, 2012, 2013, 2014, 2015, 2016, 2017 and 2018. No returns are presented for the one-year, five-year and 10-year periods with non-continuous operations.
5 Class E Shares were operational during a portion of the periods presented. Amounts reflect performance for the period of time the Class had operations, which was 112 and 283 days during the years ended October 31, 2016 and 2017, respectively. The Class was not operational during the entire six-months ended April 30, 2019 and entire fiscal year ended October 31, 2018. No return is presented for the one-year period with non-continuous operations.
6 Class I Shares were operational during a portion of the periods presented. Amounts reflect performance for the period of time the Class had operations, which was 10, 89, 136 and 357 days during the years ended October 31, 2004, 2005, 2006 and 2007, respectively. The Class was operational during the entire six-months ended April 30, 2019 and entire fiscal years ended October 31, 2008 through 2018.
7 For additional information, please refer to the Glossary of Terms.
4 HSBC FAMILY OF FUNDS
JOB TITLE HSBC Money Market SAR REVISION 6 SERIAL <12345678> DATE Saturday, June 22, 2019 JOB NUMBER 358989-1 TYPE PAGE NO. 4 OPERATOR ABIGAELS
Portfolio Reviews (Unaudited)
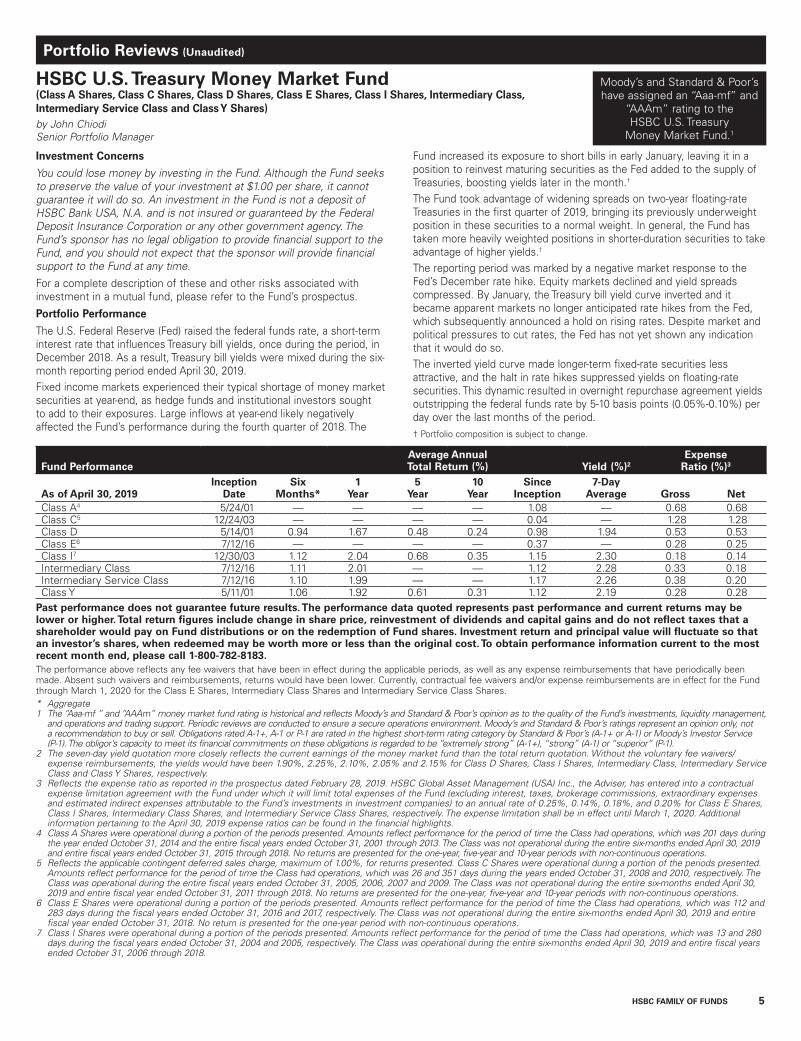
HSBC U.S. Treasury Money Market Fund(Class A Shares, Class C Shares, Class D Shares, Class E Shares, Class I Shares, Intermediary Class, Intermediary Service Class and Class Y Shares) by John ChiodiSenior Portfolio Manager
Investment Concerns
You could lose money by investing in the Fund. Although the Fund seeks to preserve the value of your investment at $1.00 per share, it cannot guarantee it will do so. An investment in the Fund is not a deposit of HSBC Bank USA, N.A. and is not insured or guaranteed by the Federal Deposit Insurance Corporation or any other government agency. The Fund’s sponsor has no legal obligation to provide financial support to the Fund, and you should not expect that the sponsor will provide financial support to the Fund at any time.For a complete description of these and other risks associated with investment in a mutual fund, please refer to the Fund’s prospectus.
Portfolio Performance
The U.S. Federal Reserve (Fed) raised the federal funds rate, a short-term interest rate that influences Treasury bill yields, once during the period, in December 2018. As a result, Treasury bill yields were mixed during the six-month reporting period ended April 30, 2019.Fixed income markets experienced their typical shortage of money market securities at year-end, as hedge funds and institutional investors sought to add to their exposures. Large inflows at year-end likely negatively affected the Fund’s performance during the fourth quarter of 2018. The
Fund increased its exposure to short bills in early January, leaving it in a position to reinvest maturing securities as the Fed added to the supply of Treasuries, boosting yields later in the month.† The Fund took advantage of widening spreads on two-year floating-rate Treasuries in the first quarter of 2019, bringing its previously underweight position in these securities to a normal weight. In general, the Fund has taken more heavily weighted positions in shorter-duration securities to take advantage of higher yields.†
The reporting period was marked by a negative market response to the Fed’s December rate hike. Equity markets declined and yield spreads compressed. By January, the Treasury bill yield curve inverted and it became apparent markets no longer anticipated rate hikes from the Fed, which subsequently announced a hold on rising rates. Despite market and political pressures to cut rates, the Fed has not yet shown any indication that it would do so.The inverted yield curve made longer-term fixed-rate securities less attractive, and the halt in rate hikes suppressed yields on floating-rate securities. This dynamic resulted in overnight repurchase agreement yields outstripping the federal funds rate by 5-10 basis points (0.05%-0.10%) per day over the last months of the period.† Portfolio composition is subject to change.
Fund PerformanceAverage Annual Total Return (%) Yield (%)2
Expense Ratio (%)3
As of April 30, 2019 Inception
DateSix
Months*1
Year5
Year10
YearSince
Inception7-Day
Average Gross NetClass A4 5/24/01 — — — — 1.08 — 0.68 0.68Class C5 12/24/03 — — — — 0.04 — 1.28 1.28Class D 5/14/01 0.94 1.67 0.48 0.24 0.98 1.94 0.53 0.53Class E6 7/12/16 — — — — 0.37 — 0.28 0.25Class I7 12/30/03 1.12 2.04 0.68 0.35 1.15 2.30 0.18 0.14Intermediary Class 7/12/16 1.11 2.01 — — 1.12 2.28 0.33 0.18Intermediary Service Class 7/12/16 1.10 1.99 — — 1.17 2.26 0.38 0.20Class Y 5/11/01 1.06 1.92 0.61 0.31 1.12 2.19 0.28 0.28
Past performance does not guarantee future results. The performance data quoted represents past performance and current returns may be lower or higher. Total return figures include change in share price, reinvestment of dividends and capital gains and do not reflect taxes that a shareholder would pay on Fund distributions or on the redemption of Fund shares. Investment return and principal value will fluctuate so that an investor’s shares, when redeemed may be worth more or less than the original cost. To obtain performance information current to the most recent month end, please call 1-800-782-8183. The performance above reflects any fee waivers that have been in effect during the applicable periods, as well as any expense reimbursements that have periodically been made. Absent such waivers and reimbursements, returns would have been lower. Currently, contractual fee waivers and/or expense reimbursements are in effect for the Fund through March 1, 2020 for the Class E Shares, Intermediary Class Shares and Intermediary Service Class Shares.* Aggregate1 The “Aaa-mf ” and “AAAm” money market fund rating is historical and reflects Moody’s and Standard & Poor’s opinion as to the quality of the Fund’s investments, liquidity management,
and operations and trading support. Periodic reviews are conducted to ensure a secure operations environment. Moody’s and Standard & Poor’s ratings represent an opinion only, not a recommendation to buy or sell. Obligations rated A-1+, A-1 or P-1 are rated in the highest short-term rating category by Standard & Poor’s (A-1+ or A-1) or Moody’s Investor Service (P-1). The obligor’s capacity to meet its financial commitments on these obligations is regarded to be “extremely strong” (A-1+), “strong” (A-1) or “superior” (P-1).
2 The seven-day yield quotation more closely reflects the current earnings of the money market fund than the total return quotation. Without the voluntary fee waivers/expense reimbursements, the yields would have been 1.90%, 2.25%, 2.10%, 2.05% and 2.15% for Class D Shares, Class I Shares, Intermediary Class, Intermediary Service Class and Class Y Shares, respectively.
3 Reflects the expense ratio as reported in the prospectus dated February 28, 2019. HSBC Global Asset Management (USA) Inc., the Adviser, has entered into a contractual expense limitation agreement with the Fund under which it will limit total expenses of the Fund (excluding interest, taxes, brokerage commissions, extraordinary expenses and estimated indirect expenses attributable to the Fund’s investments in investment companies) to an annual rate of 0.25%, 0.14%, 0.18%, and 0.20% for Class E Shares, Class I Shares, Intermediary Class Shares, and Intermediary Service Class Shares, respectively. The expense limitation shall be in effect until March 1, 2020. Additional information pertaining to the April 30, 2019 expense ratios can be found in the financial highlights.
4 Class A Shares were operational during a portion of the periods presented. Amounts reflect performance for the period of time the Class had operations, which was 201 days during the year ended October 31, 2014 and the entire fiscal years ended October 31, 2001 through 2013. The Class was not operational during the entire six-months ended April 30, 2019 and entire fiscal years ended October 31, 2015 through 2018. No returns are presented for the one-year, five-year and 10-year periods with non-continuous operations.
5 Reflects the applicable contingent deferred sales charge, maximum of 1.00%, for returns presented. Class C Shares were operational during a portion of the periods presented. Amounts reflect performance for the period of time the Class had operations, which was 26 and 351 days during the years ended October 31, 2008 and 2010, respectively. The Class was operational during the entire fiscal years ended October 31, 2005, 2006, 2007 and 2009. The Class was not operational during the entire six-months ended April 30, 2019 and entire fiscal year ended October 31, 2011 through 2018. No returns are presented for the one-year, five-year and 10-year periods with non-continuous operations.
6 Class E Shares were operational during a portion of the periods presented. Amounts reflect performance for the period of time the Class had operations, which was 112 and 283 days during the fiscal years ended October 31, 2016 and 2017, respectively. The Class was not operational during the entire six-months ended April 30, 2019 and entire fiscal year ended October 31, 2018. No return is presented for the one-year period with non-continuous operations.
7 Class I Shares were operational during a portion of the periods presented. Amounts reflect performance for the period of time the Class had operations, which was 13 and 280 days during the fiscal years ended October 31, 2004 and 2005, respectively. The Class was operational during the entire six-months ended April 30, 2019 and entire fiscal years ended October 31, 2006 through 2018.
Moody’s and Standard & Poor’s have assigned an “Aaa-mf” and
“AAAm” rating to the HSBC U.S. Treasury
Money Market Fund.1
HSBC FAMILY OF FUNDS 5
JOB TITLE HSBC Money Market SAR REVISION 6 SERIAL <12345678> DATE Saturday, June 22, 2019 JOB NUMBER 358989-1 TYPE PAGE NO. 5 OPERATOR ABIGAELS
Po r t f o l i o R e v i e w s
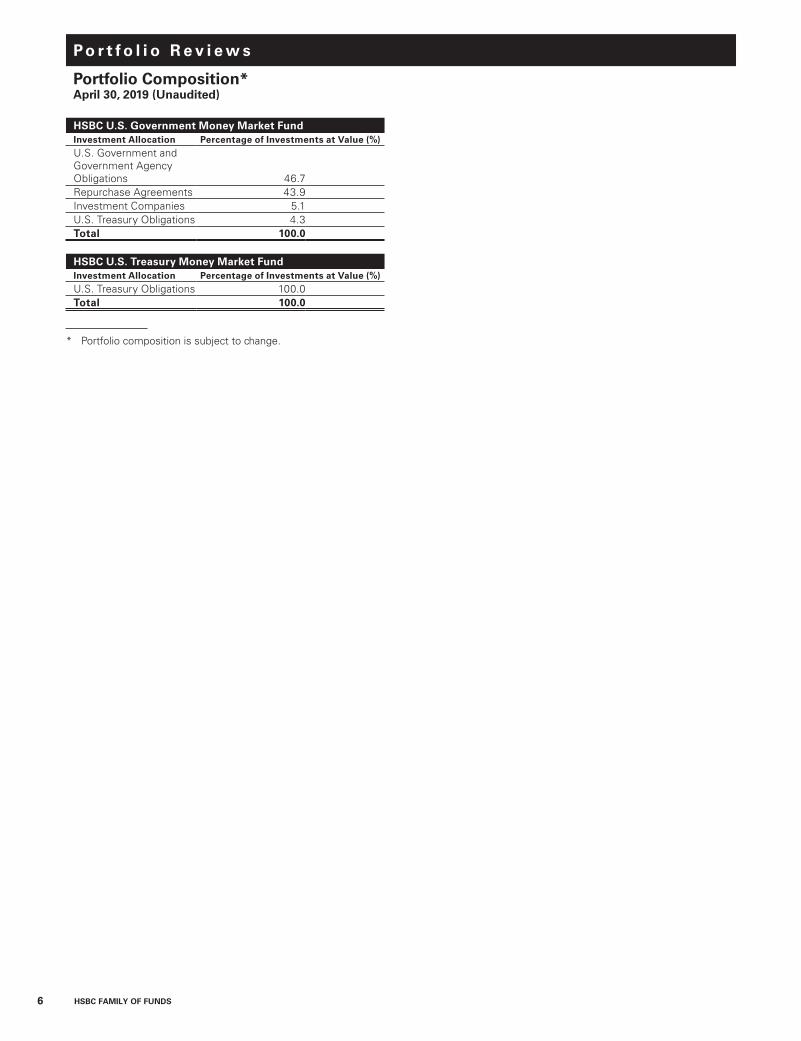
Portfolio Composition*April 30, 2019 (Unaudited)
6 HSBC FAMILY OF FUNDS
HSBC U.S. Government Money Market FundInvestment Allocation Percentage of Investments at Value (%)U.S. Government and Government Agency Obligations 46.7Repurchase Agreements 43.9Investment Companies 5.1U.S. Treasury Obligations 4.3Total 100.0
HSBC U.S. Treasury Money Market FundInvestment Allocation Percentage of Investments at Value (%)U.S. Treasury Obligations 100.0Total 100.0
* Portfolio composition is subject to change.
JOB TITLE HSBC Money Market SAR REVISION 6 SERIAL <12345678> DATE Friday, June 21, 2019 JOB NUMBER 358989-1 TYPE PAGE NO. 6 OPERATOR PAULJOHNO

H S B C U . S . G OV E R N M E N T M O N E Y M A R K E T F U N D
Schedule of Portfolio Investments—as of April 30, 2019 (Unaudited)
See notes to financial statements. HSBC FAMILY OF FUNDS 7
U.S. Government and Government Agency Obligations – 48.4%
Principal Amount ($) Value ($)
Federal Farm Credit Bank — 5.6%2.42% (US0001M - 8 bps),
06/01/2020(a) . . . . . . . . . . . . . . 73,000,000 72,991,9552.45% (US0001M - 4 bps),
03/11/2020(a) . . . . . . . . . . . . . . 150,000,000 149,986,8962.48% (US0001M - 1 bps),
07/20/2020(a) . . . . . . . . . . . . . . 75,000,000 75,000,0002.49%, 10/16/2019(b) . . . . . . . . . 40,000,000 39,537,0672.49% (FCPR DLY - 301 bps),
06/25/2020(a) . . . . . . . . . . . . . . 50,000,000 50,000,0002.50% (FCPR DLY - 300 bps),
03/22/2021(a) . . . . . . . . . . . . . . 50,000,000 49,990,6222.57% (FEDL01 + 12 bps),
02/09/2021(a) . . . . . . . . . . . . . . 115,000,000 115,000,0002.57% (FEDL01 + 12 bps),
02/22/2021(a) . . . . . . . . . . . . . . 110,000,000 110,000,0002.59% (FCPR DLY - 292 bps),
12/17/2020(a) . . . . . . . . . . . . . . 50,000,000 49,995,923
712,502,463
Federal Home Loan Bank – 39.4%1.13%, 06/21/2019 . . . . . . . . . . . . 200,000,000 199,620,9571.63%, 05/03/2019(b) . . . . . . . . . 50,000,000 49,993,2222.19%, 05/10/2019(b). . . . . . . . . . 103,520,000 103,456,9512.30%, 05/24/2019(b) . . . . . . . . . 200,100,000 199,793,1802.35% (US0001M - 13 bps),
06/07/2019(a) . . . . . . . . . . . . . . 200,000,000 199,999,5082.35%, 05/17/2019(b) . . . . . . . . . 150,000,000 149,834,0002.35%, 05/29/2019(b) . . . . . . . . . 440,000,000 439,169,5522.35% (US0003M - 23 bps),
10/28/2019(a) . . . . . . . . . . . . . . 100,000,000 100,000,0002.36% (US0001M - 13 bps),
06/24/2019(a) . . . . . . . . . . . . . . 100,000,000 100,000,0002.37% (US0003M - 22 bps),
01/24/2020(a) . . . . . . . . . . . . . . 150,000,000 150,000,0002.37% (US0001M - 12 bps),
09/20/2019(a) . . . . . . . . . . . . . . 100,000,000 100,000,0002.37%, 06/06/2019(b) . . . . . . . . . 200,000,000 199,515,0002.37%, 06/19/2019(b) . . . . . . . . . 100,000,000 99,672,1082.38%, 06/13/2019(b) . . . . . . . . . 100,000,000 99,709,7502.38% (US0003M - 22 bps),
12/23/2019(a) . . . . . . . . . . . . . . 200,000,000 200,000,0002.38% (US0001M - 9 bps),
02/07/2020(a) . . . . . . . . . . . . . . 50,000,000 50,000,0002.39% (US0001M - 10 bps),
10/23/2019(a) . . . . . . . . . . . . . . 75,000,000 75,000,0002.40% (US0003M - 19 bps),
04/28/2020(a) . . . . . . . . . . . . . . 150,000,000 150,000,0002.40%, 07/24/2019(b) . . . . . . . . . 100,000,000 99,436,7332.40% (US0003M - 20 bps),
01/02/2020(a) . . . . . . . . . . . . . . 100,000,000 100,000,0002.40% (US0001M - 9 bps),
11/21/2019(a). . . . . . . . . . . . . . . 65,000,000 65,000,0002.40% (US0001M - 7 bps),
02/07/2020(a) . . . . . . . . . . . . . . 125,000,000 125,000,0002.41% (US0003M - 22 bps),
12/19/2019(a) . . . . . . . . . . . . . . 200,000,000 200,000,0002.41% (US0001M - 7 bps),
07/25/2019(a) . . . . . . . . . . . . . . 100,000,000 100,000,000
U.S. Government and Government Agency Obligations, continued
Principal Amount ($) Value ($)
2.41% (US0001M - 7 bps), 08/28/2019(a) . . . . . . . . . . . . . . 100,000,000 100,000,000
2.42% (US0001M - 5 bps), 01/17/2020(a) . . . . . . . . . . . . . . 100,000,000 100,000,000
2.43% (US0001M - 6 bps), 02/20/2020(a) . . . . . . . . . . . . . . 150,000,000 150,000,000
2.43% (US0001M - 6 bps), 03/12/2020(a) . . . . . . . . . . . . . . 50,000,000 50,000,000
2.44% (US0001M - 5 bps), 08/21/2019(a) . . . . . . . . . . . . . . 200,000,000 200,000,000
2.44% (US0001M - 4 bps), 08/28/2019(a) . . . . . . . . . . . . . . 200,000,000 200,000,000
2.44% (US0001M - 6 bps), 11/01/2019(a). . . . . . . . . . . . . . . 100,000,000 100,000,000
2.45% (US0001M - 3 bps), 08/04/2020(a) . . . . . . . . . . . . . . 150,000,000 150,000,000
2.46% (US0001M - 3 bps), 05/21/2020(a) . . . . . . . . . . . . . . 100,000,000 100,000,000
2.46% (US0001M - 3 bps), 04/20/2020(a) . . . . . . . . . . . . . . 100,000,000 100,000,000
2.47% (SOFR - 1 bps), 05/13/2019(a) . . . . . . . . . . . . . . 95,000,000 95,000,000
2.49% (SOFR + 1 bps), 11/13/2019(a). . . . . . . . . . . . . . . 95,000,000 95,000,000
2.53% (SOFR - 5 bps), 01/17/2020(a) . . . . . . . . . . . . . . 20,000,000 20,000,000
2.54% (SOFR - 7 bps), 11/15/2019(a). . . . . . . . . . . . . . . 45,000,000 45,000,000
2.60% (US0003M - 20 bps), 02/18/2020(a) . . . . . . . . . . . . . . 150,000,000 150,000,000
5,010,200,961
Federal Home Loan Mortgage Corporation – 3.4%2.36%, 05/20/2019(b) . . . . . . . . . 20,000,000 19,973,7802.43%, 06/03/2019(b) . . . . . . . . . 140,000,000 139,679,5332.47% (SOFR - 1 bps),
05/20/2019(a) . . . . . . . . . . . . . . 150,000,000 150,000,0002.53%, 05/29/2020 . . . . . . . . . . . 125,000,000 125,000,000
434,653,313TOTAL U.S. GOVERNMENT
AND GOVERNMENT AGENCY OBLIGATIONS (Cost $6,157,356,737) . . . . . . . 6,157,356,737
U.S. Treasury Obligations – 4.6%
U.S. Treasury Bills – 2.6%2.45%, 08/29/2019(b) . . . . . . . . . 200,000,000 198,366,5672.45%, 09/05/2019(b) . . . . . . . . . 125,000,000 123,921,823
322,288,390
U.S. Treasury Notes – 2.0%2.47% (USBMMY3M + 6 bps),
07/31/2019(a) . . . . . . . . . . . . . . 60,000,000 60,011,3842.53% (USBMMY3M + 12 bps),
01/31/2021(a) . . . . . . . . . . . . . . 200,000,000 199,904,580
259,915,964TOTAL U.S. TREASURY
OBLIGATIONS (Cost $582,204,354) . . . . . . . . 582,204,354
JOB TITLE HSBC Money Market SAR REVISION 6 SERIAL <12345678> DATE Friday, June 21, 2019 JOB NUMBER 358989-1 TYPE PAGE NO. 7 OPERATOR PAULJOHNO

H S B C U . S . G OV E R N M E N T M O N E Y M A R K E T F U N D
Schedule of Portfolio Investments—as of April 30, 2019 (Unaudited) (continued)
8 HSBC FAMILY OF FUNDS See notes to financial statements.
Investment Companies – 5.4%
Shares Value ($)BlackRock Liquidity Funds
FedFund Portfolio, Institutional Shares, 2.32%(c). . . . . . . . . . . . 229,291,218 229,291,218
Dreyfus Government Cash Management, Institutional Shares, 2.32%(c). . . . . . . . . . . . 251,270,684 251,270,684
Federated Government Obligations Fund, Institutional Shares, 2.30%(c). . . . . . . . . . . . 201,466,480 201,466,480
TOTAL INVESTMENT COMPANIES (Cost $682,028,382) . . . . . . . . 682,028,382
Repurchase Agreements – 45.7%
Principal Amount ($) Value ($)
BNP Paribas, 2.40%, 5/2/19, Purchased on 4/25/19, with maturity value of $250,116,667, collateralized by U.S. Treasury Obligations, 0.00%-3.63%, 5/9/19-11/15/35, fair value $255,000,000 . . . . . . . . . . . . . . 250,000,000 250,000,000
BNP Paribas, 2.75%, 5/1/19, Purchased on 4/30/19, with maturity value of $200,015,278, collateralized by various U.S. Government and Government Agency Obligations, 0.00%-6.45%, 11/30/19-3/20/49, fair value $204,000,000 . . . . . . . . . . . . . . 200,000,000 200,000,000
Citigroup Global Markets, 2.77%, 5/1/19, Purchased on 4/30/19, with maturity value of $100,007,694, collateralized by various U.S. Government and Government Agency Obligations, 0.00%-8.50%, 2/3/20-4/1/49, fair value $102,000,000 . . . . . . . . . . . . . . 100,000,000 100,000,000
Credit Agricole Cib NY, 2.42%, 5/15/19, Purchased on 4/15/19, with maturity value of $200,403,333, collateralized by U.S. Treasury Obligations, 2.25%-2.50%, 12/31/24-1/31/25, fair value $204,000,052 . . . . . . . . . . . . . . 200,000,000 200,000,000
Credit Agricole Cib NY, 2.73%, 5/1/19, Purchased on 4/30/19, with maturity value of $110,008,342, collateralized by U.S. Government and Government Agency Obligation, 4.00%, 12/1/48, fair value $112,200,000 . . . . . . . . . 110,000,000 110,000,000
Repurchase Agreements, continued
Principal Amount ($) Value ($)
Credit Agricole Cib NY, 2.46%, 5/7/19, Purchased on 4/24/19, with maturity value of $200,177,667, collateralized by U.S. Treasury Obligation, 0.13%, 7/15/24, fair value $204,000,046 . . . . . . . . . . . . . . 200,000,000 200,000,000
Deutsche Bank Securities, Inc., 2.74%, 5/1/19, Purchased on 4/30/19, with maturity value of $500,038,056, collateralized by various U.S. Government and Government Agency Obligations, 0.00%-4.00%, 11/15/26-2/1/49, fair value $510,000,000 . . . . . . . . . . . . . . 500,000,000 500,000,000
Merrill Lynch Pierce Fenner & Smith, Inc., 2.70%, 5/1/19, Purchased on 4/30/19, with maturity value of $100,007,500, collateralized by U.S. Treasury Obligations, 2.50%-2.63%, 7/15/21-5/15/24, fair value $102,000,080 . . . . . . . . . . . . . . 100,000,000 100,000,000
Societe’ Generale, 2.75%, 5/1/19, Purchased on 4/30/19, with maturity value of $800,061,111, collateralized by various U.S. Government and Government Agency Obligations, 0.00%-6.13%, 7/3/19-4/1/49, fair value $816,000,051 . . . . . . . . . . . . . . 800,000,000 800,000,000
Societe’ Generale, 2.73%, 5/1/19, Purchased on 4/30/19, with maturity value of $200,015,167, collateralized by U.S. Treasury Obligations, 2.00%-2.50%, 10/31/22-4/30/26, fair value $202,000,090 . . . . . . . . . . . . . . 200,000,000 200,000,000
Societe’ Generale, 2.46%, 6/3/19, Purchased on 4/30/19, with maturity value of $400,929,333, collateralized by various U.S. Government and Government Agency Obligations, 2.38%-5.98%, 11/25/19-4/1/49, fair value $408,000,056 . . . . . . . . . . . . . . 400,000,000 400,000,000
Fixed Income Clearing Corporation, 2.75%, 5/1/19, Purchased on 4/30/19, with maturity value of $2,100,160,417, collateralized by U.S. Treasury Obligations, 2.75%, 12/31/23-2/15/26, fair value $2,142,003,565 . . . . . . . . 2,100,000,000 2,100,000,000
JOB TITLE HSBC Money Market SAR REVISION 6 SERIAL <12345678> DATE Friday, June 21, 2019 JOB NUMBER 358989-1 TYPE PAGE NO. 8 OPERATOR PAULJOHNO

H S B C U . S . G OV E R N M E N T M O N E Y M A R K E T F U N D
Schedule of Portfolio Investments—as of April 30, 2019 (Unaudited) (continued)
See notes to financial statements. HSBC FAMILY OF FUNDS 9
Repurchase Agreements, continued
Principal Amount ($) Value ($)
Standard Chartered Bank, 2.75%, 5/1/19, Purchased on 4/30/19, with maturity value of $100,007,639, collateralized by various U.S. Treasury Obligations, 0.00%-4.00%, 5/2/19-2/20/49, fair value $102,000,000 . . . . . . . . . . . . . . 100,000,000 100,000,000
Toronto Dominion Bank NY, 2.45%, 5/2/19, Purchased on 4/25/19, with maturity value of $200,095,278, collateralized by U.S. Treasury Obligations, 2.75%-6.13%, 8/15/29-2/15/49, fair value $204,000,086 . . . . . . . . . . . . . . 200,000,000 200,000,000
Toronto Dominion Bank NY, 2.75%, 5/1/19, Purchased on 4/30/19, with maturity value of $350,026,736, collateralized by U.S. Treasury Obligations, 0.00%-2.54%, 4/30/21-2/15/44, fair value $357,000,098 . . . . . . . . . . . . . . 350,000,000 350,000,000
TOTAL REPURCHASE AGREEMENTS (Cost $5,810,000,000) . . . . . . . . . . . . 5,810,000,000
TOTAL INVESTMENTS IN SECURITIES (Cost $13,231,589,473) – 104.1%. . . . 13,231,589,473
Other Assets (Liabilities) – (4.1)%. . . . . . . . . (524,231,002)
NET ASSETS – 100% . . . . . . . . . $12,707,358,471
(a) Floating or variable rate security linked to the referenced benchmark. The rate presented represents the rate in effect on April 30, 2019. These securities are deemed to have a maturity remaining until the next adjustment of the interest rate or the longer of the demand period or time to the next readjustment.
(b) Discount note. Rate presented represents the effective yield at time of purchase.
(c) The rate represents the annualized one day yield that was in effect on April 30, 2019.
bps - Basis PointsFCPR DLY - Federal Reserve Bank Prime Rate Loan USFEDL01 - Effective Federal Funds RateSOFR - Secured Overnight Financing RateUSBMMY3M - 3 Month Treasury Bill RateUS0001M - 1 Month US Dollar LIBORUS0003M - 3 Month US Dollar LIBOR
JOB TITLE HSBC Money Market SAR REVISION 6 SERIAL <12345678> DATE Friday, June 21, 2019 JOB NUMBER 358989-1 TYPE PAGE NO. 9 OPERATOR PAULJOHNO

H S B C U . S . T R E A S U RY M O N E Y M A R K E T F U N D
10 HSBC FAMILY OF FUNDS See notes to financial statements.
Schedule of Portfolio Investments—as of April 30, 2019 (Unaudited)
U.S. Treasury Obligations – 100.1%
Principal Amount ($) Value ($)
U.S. Treasury Bills – 75.8%1.13%, 05/02/2019(a) . . . . . . . . . . . . . . . . . . . . . . . . . . . . . . . . . . . . . . . . . . . . . . . . . . . . . . . . . . . . . . . . 132,300,000 132,291,7072.29%, 05/23/2019(a). . . . . . . . . . . . . . . . . . . . . . . . . . . . . . . . . . . . . . . . . . . . . . . . . . . . . . . . . . . . . . . . 75,000,000 74,890,2182.31%, 06/20/2019(a) . . . . . . . . . . . . . . . . . . . . . . . . . . . . . . . . . . . . . . . . . . . . . . . . . . . . . . . . . . . . . . . . 100,000,000 99,673,5072.32%, 06/11/2019(a) . . . . . . . . . . . . . . . . . . . . . . . . . . . . . . . . . . . . . . . . . . . . . . . . . . . . . . . . . . . . . . . . 438,700,000 437,513,9692.33%, 05/30/2019(a). . . . . . . . . . . . . . . . . . . . . . . . . . . . . . . . . . . . . . . . . . . . . . . . . . . . . . . . . . . . . . . . 100,000,000 99,806,4652.35%, 06/18/2019(a) . . . . . . . . . . . . . . . . . . . . . . . . . . . . . . . . . . . . . . . . . . . . . . . . . . . . . . . . . . . . . . . . 130,000,000 129,585,7342.38%, 06/27/2019(a) . . . . . . . . . . . . . . . . . . . . . . . . . . . . . . . . . . . . . . . . . . . . . . . . . . . . . . . . . . . . . . . . 100,000,000 99,618,2582.39%, 07/25/2019(a) . . . . . . . . . . . . . . . . . . . . . . . . . . . . . . . . . . . . . . . . . . . . . . . . . . . . . . . . . . . . . . . . 45,000,000 44,745,0002.45%, 08/29/2019(a) . . . . . . . . . . . . . . . . . . . . . . . . . . . . . . . . . . . . . . . . . . . . . . . . . . . . . . . . . . . . . . . . 75,000,000 74,387,5002.45%, 09/05/2019(a) . . . . . . . . . . . . . . . . . . . . . . . . . . . . . . . . . . . . . . . . . . . . . . . . . . . . . . . . . . . . . . . . 50,000,000 49,568,730
1,242,081,088
U.S. Treasury Notes – 24.3%2.41% (USBMMY3M), 01/31/2020(b) . . . . . . . . . . . . . . . . . . . . . . . . . . . . . . . . . . . . . . . . . . . . . . . . . . . 72,000,000 72,002,6572.45% (USBMMY3M + 3 bps), 04/30/2020(b) . . . . . . . . . . . . . . . . . . . . . . . . . . . . . . . . . . . . . . . . . . . . 20,000,000 20,005,3062.46% (USBMMY3M + 4 bps), 07/31/2020(b) . . . . . . . . . . . . . . . . . . . . . . . . . . . . . . . . . . . . . . . . . . . . 50,000,000 50,000,0002.42% (USBMMY3M + 5 bps), 10/31/2020(b) . . . . . . . . . . . . . . . . . . . . . . . . . . . . . . . . . . . . . . . . . . . . 25,000,000 24,960,8222.42% (USBMMY3M + 5 bps), 10/31/2019(b) . . . . . . . . . . . . . . . . . . . . . . . . . . . . . . . . . . . . . . . . . . . . 44,000,000 44,015,6022.47% (USBMMY3M + 6 bps), 07/31/2019(b) . . . . . . . . . . . . . . . . . . . . . . . . . . . . . . . . . . . . . . . . . . . . 145,000,000 145,019,2392.53% (USBMMY3M + 12 bps), 01/31/2021(b) . . . . . . . . . . . . . . . . . . . . . . . . . . . . . . . . . . . . . . . . . . . 45,000,000 44,968,410
400,972,036
TOTAL U.S. TREASURY OBLIGATIONS (Cost $1,643,053,124). . . . . . . . . . . . . . . . . . . . . . . . . . . . . . . 1,643,053,124
TOTAL INVESTMENTS IN SECURITIES (Cost $1,643,053,124) – 100.1% . . . . . . . . . . . . . . . . . . . . . . . 1,643,053,124
Other Assets (Liabilities) – (0.1)% . . . . . . . . . . . . . . . . . . . . . . . . . . . . . . . . . . . . . . . . . . . . . . . . . . . . . . (1,280,770)
NET ASSETS – 100% . . . . . . . . . . . . . . . . . . . . . . . . . . . . . . . . . . . . . . . . . . . . . . . . . . . . . . . . . . . . . . . . . $1,641,772,354
(a) Discount note. Rate presented represents the effective yield at time of purchase. (b) Floating or variable rate security linked to the referenced benchmark. The rate presented represents the rate in effect on April 30, 2019.
These securities are deemed to have a maturity remaining until the next adjustment of the interest rate or the longer of the demand period or time to the next readjustment.
bps - Basis PointsUSBMMY3M - 3 Month Treasury Bill Rate
JOB TITLE HSBC Money Market SAR REVISION 6 SERIAL <12345678> DATE Friday, June 21, 2019 JOB NUMBER 358989-1 TYPE PAGE NO. 10 OPERATOR PAULJOHNO

See notes to financial statements. HSBC FAMILY OF FUNDS 11
H S B C FA M I LY O F F U N D SStatements of Assets and Liabilities—as of April 30, 2019 (Unaudited)
HSBC U.S. Government
Money Market Fund
HSBC U.S. Treasury Money Market
Fund
Assets:Investments in securities, at value $ 7,421,589,473 $1,643,053,124Repurchase agreements, at value 5,810,000,000 —Cash 506,209 26,620Interest receivable 10,418,865 27,450Prepaid expenses and other assets 166,886 54,295Total Assets 13,242,681,433 1,643,161,489
Liabilities:Distributions payable 8,820,358 919,497Payable for investments purchased 524,247,267 —Accrued expenses and other liabilities:
Investment Management 940,965 173,677Administration 400,628 58,068Shareholder Servicing 338,565 27,364Accounting 5,534 4,956Custodian fees 94,198 14,957Professional 109,109 101,277Transfer Agent 15,633 3,762Trustee 2,791 2,793Other 347,914 82,784
Total Liabilities 535,322,962 1,389,135Net Assets $12,707,358,471 $1,641,772,354
Composition of Net Assets:Paid in capital 12,707,430,631 1,641,792,674Total distributable earnings/(loss) (72,160) (20,320)
Net Assets $12,707,358,471 $1,641,772,354
Net Assets:Class A Shares $ 3,013,291 $ —Class D Shares 1,609,464,851 129,674,943Class I Shares 8,709,269,311 543,134,740Intermediary Class Shares 103,311,875 179,636,048Intermediary Service Class Shares 201,277,249 78,179,653Class Y Shares 2,081,021,894 711,146,970
$12,707,358,471 $1,641,772,354
Shares Outstanding:($0.001 par value, unlimited number of shares authorized):Class A Shares 3,013,269 —Class D Shares 1,609,281,443 129,710,827Class I Shares 8,709,473,507 543,141,521Intermediary Class Shares 103,312,918 179,637,050Intermediary Service Class Shares 201,281,642 78,180,854Class Y Shares 2,081,084,199 711,127,389
Net Asset Value, Offering Price and Redemption Price per share:Class A Shares $ 1.00 $ —Class D Shares $ 1.00 $ 1.00Class I Shares $ 1.00 $ 1.00Intermediary Class Shares $ 1.00 $ 1.00Intermediary Service Class Shares $ 1.00 $ 1.00Class Y Shares $ 1.00 $ 1.00Investments in securities, at cost $ 7,421,589,473 $1,643,053,124Repurchase agreements, at cost $ 5,810,000,000 $ —
Amounts designated as “—“ are $0.00 or have been rounded to $0.00.
JOB TITLE HSBC Money Market SAR REVISION 6 SERIAL <12345678> DATE Friday, June 21, 2019 JOB NUMBER 358989-1 TYPE PAGE NO. 11 OPERATOR PAULJOHNO

12 HSBC FAMILY OF FUNDS See notes to financial statements.
H S B C FA M I LY O F F U N D SStatements of Operations—For the six months ended April 30, 2019 (Unaudited)
HSBC U.S. Government
Money Market Fund
HSBC U.S. Treasury Money Market
Fund
Investment Income:Interest $146,331,272 $21,863,034Dividends 4,964,284 —
Total Investment Income 151,295,556 21,863,034
Expenses:Investment Management 6,268,360 919,883Operational Support:
Class A Shares 1,485 —Class D Shares 807,504 89,417Intermediary Class Shares 89,970 81,583Intermediary Service Class Shares 70,320 31,823Class Y Shares 939,260 387,278
Administration:Class A Shares 573 —Class D Shares 311,639 34,633Class I Shares 1,680,564 127,359Intermediary Class Shares 34,652 31,480Intermediary Service Class Shares 27,158 12,261Class Y Shares 362,718 149,376
Shareholder Servicing:Class A Shares 5,941 —Class D Shares 2,018,774 223,545Intermediary Class Shares 44,986 40,793Intermediary Service Class Shares 70,320 31,823
Accounting 33,320 28,443Compliance Services 15,565 15,565Custodian 256,100 43,115Printing 208,027 21,863Professional 113,204 95,814Transfer Agent 151,911 63,330Trustee 41,116 41,116Registration fees 72,715 41,835Other 450,176 114,510
Total expenses before fee and expense reductions 14,076,358 2,626,845Fees voluntarily reduced/reimbursed by Investment Adviser (1,506,986) (270,284)Fees contractually reduced/reimbursed by Investment Adviser (406,787) (166,191)Fees voluntarily reduced by Administrator (435,986) (32,978)Fees voluntarily reduced by Shareholder Servicing Agent (115,307) (72,616)Custody earnings credits (63,197) (19,967)Net Expenses 11,548,095 2,064,809
Net Investment Income 139,747,461 19,798,225
Realized/Unrealized Gains/(Losses) from Investments:Net realized gains/(losses) from investments in securities 7,975 10,940
Net realized/unrealized gains/(losses) on investments 7,975 10,940Change in Net Assets Resulting from Operations $139,755,436 $19,809,165
Amounts designated as “—“ are $0.00 or have been rounded to $0.00.
JOB TITLE HSBC Money Market SAR REVISION 6 SERIAL <12345678> DATE Friday, June 21, 2019 JOB NUMBER 358989-1 TYPE PAGE NO. 12 OPERATOR PAULJOHNO
See notes to financial statements. HSBC FAMILY OF FUNDS 13
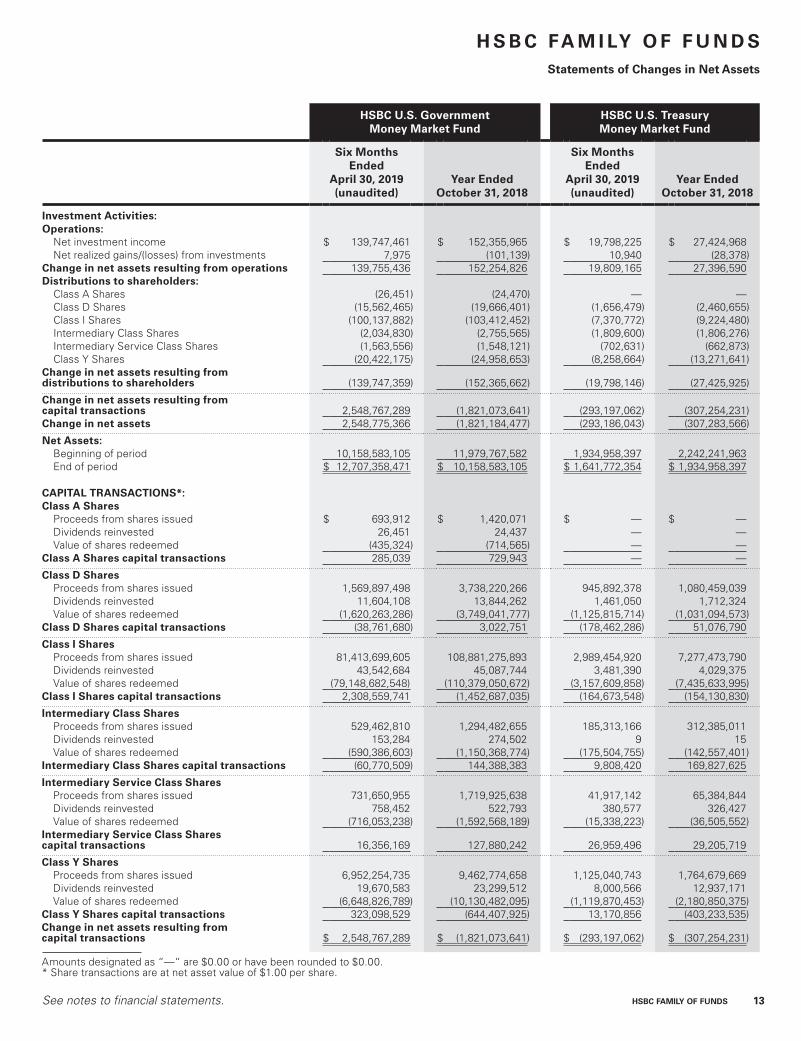
H S B C FA M I LY O F F U N D SStatements of Changes in Net Assets
HSBC U.S. Government Money Market Fund
HSBC U.S. Treasury Money Market Fund
Six Months Ended
April 30, 2019 (unaudited)
Year Ended October 31, 2018
Six Months Ended
April 30, 2019 (unaudited)
Year Ended October 31, 2018
Investment Activities:Operations:
Net investment income $ 139,747,461 $ 152,355,965 $ 19,798,225 $ 27,424,968Net realized gains/(losses) from investments 7,975 (101,139) 10,940 (28,378)
Change in net assets resulting from operations 139,755,436 152,254,826 19,809,165 27,396,590Distributions to shareholders:
Class A Shares (26,451) (24,470) — —Class D Shares (15,562,465) (19,666,401) (1,656,479) (2,460,655)Class I Shares (100,137,882) (103,412,452) (7,370,772) (9,224,480)Intermediary Class Shares (2,034,830) (2,755,565) (1,809,600) (1,806,276)Intermediary Service Class Shares (1,563,556) (1,548,121) (702,631) (662,873)Class Y Shares (20,422,175) (24,958,653) (8,258,664) (13,271,641)
Change in net assets resulting from distributions to shareholders (139,747,359) (152,365,662) (19,798,146) (27,425,925)
Change in net assets resulting from capital transactions 2,548,767,289 (1,821,073,641) (293,197,062) (307,254,231)Change in net assets 2,548,775,366 (1,821,184,477) (293,186,043) (307,283,566)
Net Assets:Beginning of period 10,158,583,105 11,979,767,582 1,934,958,397 2,242,241,963End of period $ 12,707,358,471 $ 10,158,583,105 $ 1,641,772,354 $ 1,934,958,397
CAPITAL TRANSACTIONS*:Class A Shares
Proceeds from shares issued $ 693,912 $ 1,420,071 $ — $ —Dividends reinvested 26,451 24,437 — —Value of shares redeemed (435,324) (714,565) — —
Class A Shares capital transactions 285,039 729,943 — —
Class D SharesProceeds from shares issued 1,569,897,498 3,738,220,266 945,892,378 1,080,459,039Dividends reinvested 11,604,108 13,844,262 1,461,050 1,712,324Value of shares redeemed (1,620,263,286) (3,749,041,777) (1,125,815,714) (1,031,094,573)
Class D Shares capital transactions (38,761,680) 3,022,751 (178,462,286) 51,076,790
Class I SharesProceeds from shares issued 81,413,699,605 108,881,275,893 2,989,454,920 7,277,473,790Dividends reinvested 43,542,684 45,087,744 3,481,390 4,029,375Value of shares redeemed (79,148,682,548) (110,379,050,672) (3,157,609,858) (7,435,633,995)
Class I Shares capital transactions 2,308,559,741 (1,452,687,035) (164,673,548) (154,130,830)
Intermediary Class SharesProceeds from shares issued 529,462,810 1,294,482,655 185,313,166 312,385,011Dividends reinvested 153,284 274,502 9 15Value of shares redeemed (590,386,603) (1,150,368,774) (175,504,755) (142,557,401)
Intermediary Class Shares capital transactions (60,770,509) 144,388,383 9,808,420 169,827,625
Intermediary Service Class SharesProceeds from shares issued 731,650,955 1,719,925,638 41,917,142 65,384,844Dividends reinvested 758,452 522,793 380,577 326,427Value of shares redeemed (716,053,238) (1,592,568,189) (15,338,223) (36,505,552)
Intermediary Service Class Shares capital transactions 16,356,169 127,880,242 26,959,496 29,205,719
Class Y SharesProceeds from shares issued 6,952,254,735 9,462,774,658 1,125,040,743 1,764,679,669Dividends reinvested 19,670,583 23,299,512 8,000,566 12,937,171Value of shares redeemed (6,648,826,789) (10,130,482,095) (1,119,870,453) (2,180,850,375)
Class Y Shares capital transactions 323,098,529 (644,407,925) 13,170,856 (403,233,535)Change in net assets resulting from capital transactions $ 2,548,767,289 $ (1,821,073,641) $ (293,197,062) $ (307,254,231)
Amounts designated as “—“ are $0.00 or have been rounded to $0.00.* Share transactions are at net asset value of $1.00 per share.
JOB TITLE HSBC Money Market SAR REVISION 6 SERIAL <12345678> DATE Friday, June 21, 2019 JOB NUMBER 358989-1 TYPE PAGE NO. 13 OPERATOR PAULJOHNO

14 HSBC FAMILY OF FUNDS See notes to financial statements.
HS
BC
U.S
. G
Ov
er
NM
eN
t M
ON
eY
MA
rk
et
FU
ND
Fin
anci
al H
igh
ligh
ts
Sel
ecte
d d
ata
for
a sh
are
ou
tsta
nd
ing
th
rou
gh
ou
t th
e p
erio
ds
ind
icat
ed.
Inve
stm
ent
Act
ivit
ies
Dis
trib
uti
on
sr
atio
s/S
up
ple
men
tary
Dat
a
Net
Ass
et
val
ue,
B
egin
nin
g
of
Per
iod
Net
In
vest
men
t In
com
e
Net
r
eali
zed
an
d
Un
real
ized
G
ain
s (L
oss
es)
fro
m
Inve
stm
ents
tota
l fro
m
Inve
stm
ent
Act
ivit
ies
Net
In
vest
men
t In
com
e
Net
r
eali
zed
G
ain
s fr
om
In
vest
men
t tr
ansa
ctio
ns
tota
l D
istr
ibu
tio
ns
Net
A
sset
v
alu
e,
en
d o
f P
erio
dto
tal
ret
urn
(a)
Net
A
sset
s at
en
d
of
Per
iod
(0
00’s
)
rat
io o
f N
et
exp
ense
s to
A
vera
ge
Net
A
sset
s(b
)
rat
io o
f N
et
Inve
stm
ent
Inco
me
to
Ave
rag
e N
et
Ass
ets(
b)
rat
io o
f e
xpen
ses
to A
vera
ge
Net
Ass
ets
(exc
lud
ing
Fee
r
edu
ctio
ns)
(b)
CL
AS
S A
SH
Ar
eS
Six
Mon
ths
End
ed
Apr
il 30
, 201
9 (u
naud
ited)
$1.0
0$0
.01
$—
$0.
01$
(0.0
1)$
—$
(0.0
1)$1
.00
0.89
%$
3,01
30.
63%
1.78
%0.
66%
Year
End
ed O
ctob
er 3
1, 2
018
1.00
0.01
—0.
01(0
.01)
—(0
.01)
1.00
1.05
% 2
,728
0.63
%1.
08%
0.65
%Ye
ar E
nded
Oct
ober
31,
201
71.
00—
——
——
—1.
000.
22%
1,9
980.
59%
0.23
%0.
68%
Year
End
ed O
ctob
er 3
1, 2
016
1.00
——
——
——
1.00
0.02
% 1
,720
0.34
%0.
02%
0.69
%Ye
ar E
nded
Oct
ober
31,
201
51.
00—
——
——
—1.
000.
03%
929
0.08
%0.
03%
0.69
%Ye
ar E
nded
Oct
ober
31,
201
41.
00—
——
——
—1.
000.
02%
154
0.07
%0.
02%
0.69
%
CL
AS
S D
SH
Ar
eS
Six
Mon
ths
End
ed
Apr
il 30
, 201
9 (u
naud
ited)
$1.0
0$0
.01
—$
0.01
$(0
.01)
—$
(0.0
1)$1
.00
0.96
%$
1,60
9,46
50.
48%
1.93
%0.
51%
Year
End
ed O
ctob
er 3
1, 2
018
1.00
0.01
—0.
01(0
.01)
—(0
.01)
1.00
1.20
% 1
,648
,226
0.48
%1.
19%
0.51
%Ye
ar E
nded
Oct
ober
31,
201
71.
00—
——
——
—1.
000.
34%
1,6
45,2
220.
47%
0.32
%0.
54%
Year
End
ed O
ctob
er 3
1, 2
016
1.00
——
——
——
1.00
0.02
% 1
,949
,225
0.34
%0.
02%
0.54
%Ye
ar E
nded
Oct
ober
31,
201
51.
00—
——
——
—1.
000.
03%
888
,084
0.07
%0.
03%
0.53
%Ye
ar E
nded
Oct
ober
31,
201
41.
00—
——
——
—1.
000.
02%
727
,290
0.06
%0.
02%
0.54
%
CL
AS
S e
SH
Ar
eS
Oct
ober
31,
201
6 th
roug
h A
ugus
t 10
, 201
7(c)
$1.0
0—
——
——
—$1
.00
0.26
%$
—0.
23%
0.33
%0.
29%
July
12,
201
6(d)
thr
ough
O
ctob
er 3
1, 2
016
1.00
——
——
——
1.00
0.11
%2
0.06
%0.
32%
0.31
%
CL
AS
S I
SH
Ar
eS
Six
Mon
ths
End
ed
Apr
il 30
, 201
9 (u
naud
ited)
$1.0
0$0
.01
—$
0.01
$(0
.01)
—$
(0.0
1)$1
.00
1.14
%$
8,70
9,26
90.
12%
2.30
%0.
16%
Year
End
ed O
ctob
er 3
1, 2
018
1.00
0.02
—0.
02(0
.02)
—(0
.02)
1.00
1.57
% 6
,400
,700
0.12
%1.
52%
0.16
%Ye
ar E
nded
Oct
ober
31,
201
71.
000.
01—
0.01
(0.0
1)—
(0.0
1)1.
000.
69%
7,8
53,4
570.
12%
0.71
%0.
18%
Year
End
ed O
ctob
er 3
1, 2
016
1.00
——
——
——
1.00
0.21
% 4
,687
,197
0.14
%0.
23%
0.19
%Ye
ar E
nded
Oct
ober
31,
201
51.
00—
——
——
—1.
000.
03%
1,5
89,2
640.
07%
0.03
%0.
18%
Year
End
ed O
ctob
er 3
1, 2
014
1.00
——
——
——
1.00
0.02
% 1
,411
,088
0.06
%0.
02%
0.19
%
INt
er
Me
DIA
rY
CL
AS
S S
HA
re
SS
ix M
onth
s E
nded
A
pril
30, 2
019
(una
udite
d)$1
.00
$0.0
1—
$0.
01$
(0.0
1)—
$(0
.01)
$1.0
01.
12%
$10
3,31
20.
16%
2.26
%0.
31%
Year
End
ed O
ctob
er 3
1, 2
018
1.00
0.02
—0.
02(0
.02)
—(0
.02)
1.00
1.52
% 1
64,0
820.
16%
1.57
%0.
31%
Year
End
ed O
ctob
er 3
1, 2
017
1.00
0.01
—0.
01(0
.01)
—(0
.01)
1.00
0.63
% 1
9,69
40.
18%
0.65
%0.
33%
July
12,
201
6(d)
thr
ough
O
ctob
er 3
1, 2
016
1.00
——
——
——
1.00
0.11
% 1
0,12
10.
18%
0.26
%0.
37%
JOB TITLE HSBC Money Market SAR REVISION 6 SERIAL <12345678> DATE Saturday, June 22, 2019 JOB NUMBER 358989-1 TYPE PAGE NO. 14 OPERATOR ABIGAELS

See notes to financial statements. HSBC FAMILY OF FUNDS 15
HS
BC
U.S
. G
Ov
er
NM
eN
t M
ON
eY
MA
rk
et
FU
ND
Fin
anci
al H
igh
ligh
ts (
con
tin
ued
)
Inve
stm
ent
Act
ivit
ies
Dis
trib
uti
on
sr
atio
s/S
up
ple
men
tary
Dat
a
Net
Ass
et
val
ue,
B
egin
nin
g
of
Per
iod
Net
In
vest
men
t In
com
e
Net
r
eali
zed
an
d
Un
real
ized
G
ain
s (L
oss
es)
fro
m
Inve
stm
ents
tota
l fro
m
Inve
stm
ent
Act
ivit
ies
Net
In
vest
men
t In
com
e
Net
r
eali
zed
G
ain
s fr
om
In
vest
men
t tr
ansa
ctio
ns
tota
l D
istr
ibu
tio
ns
Net
A
sset
v
alu
e,
en
d o
f P
erio
dto
tal
ret
urn
(a)
Net
A
sset
s at
en
d
of
Per
iod
(0
00’s
)
rat
io o
f N
et
exp
ense
s to
A
vera
ge
Net
A
sset
s(b
)
rat
io o
f N
et
Inve
stm
ent
Inco
me
to
Ave
rag
e N
et
Ass
ets(
b)
rat
io o
f e
xpen
ses
to A
vera
ge
Net
Ass
ets
(exc
lud
ing
Fee
r
edu
ctio
ns)
(b)
INt
er
Me
DIA
rY
Se
rv
ICe
C
LA
SS
SH
Ar
eS
Six
Mon
ths
End
ed
Apr
il 30
, 201
9 (u
naud
ited)
$1.0
0$0
.01
—$
0.01
$(0
.01)
—$
(0.0
1)$1
.00
1.11
%$
201,
277
0.18
%2.
22%
0.36
%Ye
ar E
nded
Oct
ober
31,
201
81.
000.
01—
0.01
(0.0
1)—
(0.0
1)1.
001.
50%
184,
921
0.18
%1.
70%
0.36
%Ye
ar E
nded
Oct
ober
31,
201
71.
000.
01—
0.01
(0.0
1)—
(0.0
1)1.
000.
61%
57,0
420.
20%
0.63
%0.
39%
July
12,
201
6(d)
thr
ough
O
ctob
er 3
1, 2
016
1.00
——
——
——
1.00
0.10
%5,
003
0.18
%0.
22%
0.42
%
CL
AS
S Y
SH
Ar
eS
Six
Mon
ths
End
ed
Apr
il 30
, 201
9 (u
naud
ited)
$1.0
0$0
.01
—$
0.01
$(0
.01)
—$
(0.0
1)$1
.00
1.09
%$
2,08
1,02
20.
23%
2.17
%0.
26%
Year
End
ed O
ctob
er 3
1, 2
018
1.00
0.01
—0.
01(0
.01)
—(0
.01)
1.00
1.45
%1,
757,
925
0.23
%1.
43%
0.26
%Ye
ar E
nded
Oct
ober
31,
201
71.
000.
01—
0.01
(0.0
1)—
(0.0
1)1.
000.
58%
2,40
2,35
40.
23%
0.53
%0.
29%
Year
End
ed O
ctob
er 3
1, 2
016
1.00
——
——
——
1.00
0.12
%3,
891,
299
0.23
%0.
11%
0.28
%Ye
ar E
nded
Oct
ober
31,
201
51.
00—
——
——
—1.
000.
03%
3,77
9,59
50.
07%
0.03
%0.
28%
Year
End
ed O
ctob
er 3
1, 2
014
1.00
——
——
——
1.00
0.02
%3,
458,
399
0.06
%0.
02%
0.29
%
(a) N
ot a
nnua
lized
for
per
iods
less
tha
n on
e ye
ar. T
otal
ret
urn
calc
ulat
ions
do
not
incl
ude
any
sale
s or
red
empt
ion
char
ges.
(b) A
nnua
lized
for
per
iods
less
tha
n on
e ye
ar.
(c) C
lose
d op
erat
ions
on
Aug
ust
10, 2
017.
(d) C
omm
ence
men
t of
ope
ratio
ns o
n Ju
ly 1
2, 2
016.
Am
ount
s de
sign
ated
as
“—”
are
$0.0
0 or
hav
e be
en r
ound
ed t
o $0
.00.
JOB TITLE HSBC Money Market SAR REVISION 6 SERIAL <12345678> DATE Saturday, June 22, 2019 JOB NUMBER 358989-1 TYPE PAGE NO. 15 OPERATOR ABIGAELS
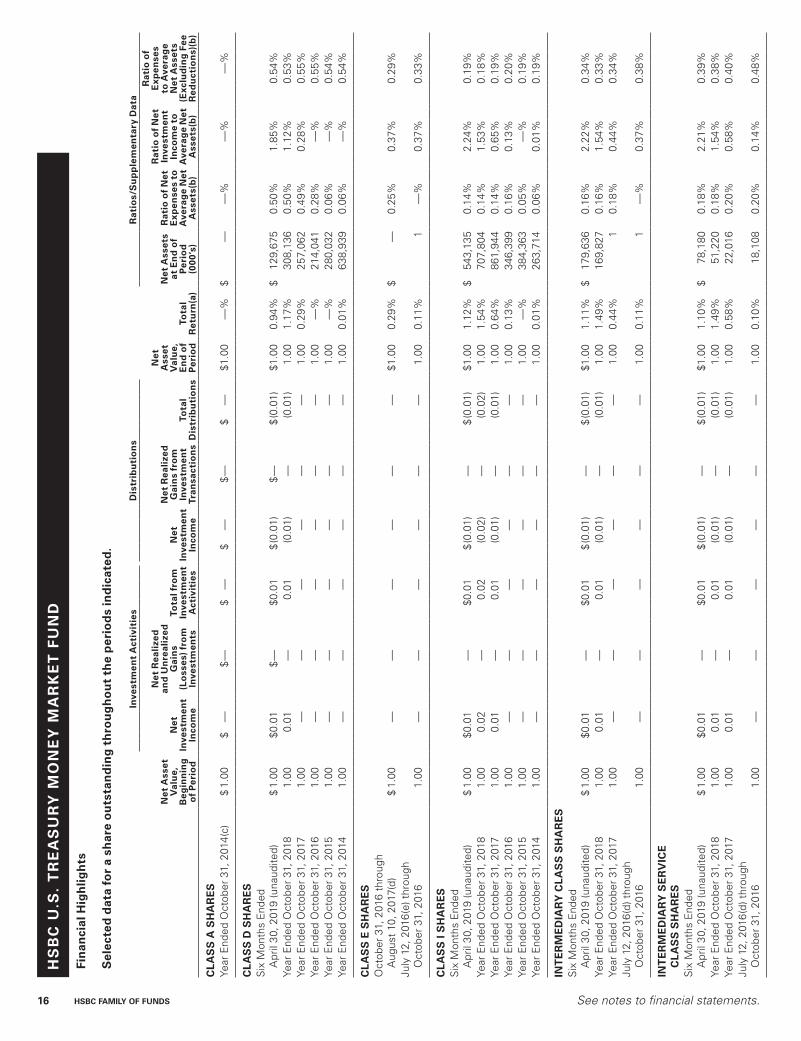
16 HSBC FAMILY OF FUNDS See notes to financial statements.
HS
BC
U.S
. T
re
AS
Ur
Y M
ON
eY
MA
rk
eT
FU
ND
Fin
anci
al H
igh
ligh
ts
Sel
ecte
d d
ata
for
a sh
are
ou
tsta
nd
ing
th
rou
gh
ou
t th
e p
erio
ds
ind
icat
ed.
Inve
stm
ent
Act
ivit
ies
Dis
trib
uti
on
sr
atio
s/S
up
ple
men
tary
Dat
a
Net
Ass
et
Val
ue,
B
egin
nin
g
of
Per
iod
Net
In
vest
men
t In
com
e
Net
rea
lize
d
and
Un
real
ized
G
ain
s (L
oss
es)
fro
m
Inve
stm
ents
Tota
l fro
m
Inve
stm
ent
Act
ivit
ies
Net
In
vest
men
t In
com
e
Net
rea
lize
d
Gai
ns
fro
m
Inve
stm
ent
Tran
sact
ion
sTo
tal
Dis
trib
uti
on
s
Net
A
sset
V
alu
e,
en
d o
f P
erio
dTo
tal
ret
urn
(a)
Net
Ass
ets
at e
nd
of
Per
iod
(0
00’s
)
rat
io o
f N
et
exp
ense
s to
A
vera
ge
Net
A
sset
s(b
)
rat
io o
f N
et
Inve
stm
ent
Inco
me
to
Ave
rag
e N
et
Ass
ets(
b)
rat
io o
f e
xpen
ses
to A
vera
ge
Net
Ass
ets
(exc
lud
ing
Fee
r
edu
ctio
ns)
(b)
CL
AS
S A
SH
Ar
eS
Year
End
ed O
ctob
er 3
1, 2
014(
c)$
1.00
$—
$—
$—
$—
$—
$—
$1.0
0—
%$
——
%—
%—
%
CL
AS
S D
SH
Ar
eS
Six
Mon
ths
End
ed
Apr
il 30
, 201
9 (u
naud
ited)
$1.
00$0
.01
$—
$0.0
1$
(0.0
1)$
—$
(0.0
1)$1
.00
0.94
%$
129,
675
0.50
%1.
85%
0.54
%Ye
ar E
nded
Oct
ober
31,
201
81.
000.
01—
0.01
(0.0
1)—
(0.0
1)1.
001.
17%
308
,136
0.50
%1.
12%
0.53
%Ye
ar E
nded
Oct
ober
31,
201
71.
00—
——
——
—1.
000.
29%
257
,062
0.49
%0.
28%
0.55
%Ye
ar E
nded
Oct
ober
31,
201
61.
00—
——
——
—1.
00—
% 2
14,0
410.
28%
—%
0.55
%Ye
ar E
nded
Oct
ober
31,
201
51.
00—
——
——
—1.
00—
% 2
80,0
320.
06%
—%
0.54
%Ye
ar E
nded
Oct
ober
31,
201
41.
00—
——
——
—1.
000.
01%
638
,939
0.06
%—
%0.
54%
CL
AS
S e
SH
Ar
eS
Oct
ober
31,
201
6 th
roug
h A
ugus
t 10
, 201
7(d)
$1.
00—
——
——
—$1
.00
0.29
%$
—0.
25%
0.37
%0.
29%
July
12,
201
6(e)
thr
ough
O
ctob
er 3
1, 2
016
1.00
——
——
——
1.00
0.11
%1
—%
0.37
%0.
33%
CL
AS
S I
SH
Ar
eS
Six
Mon
ths
End
ed
Apr
il 30
, 201
9 (u
naud
ited)
$1.
00$0
.01
—$0
.01
$(0
.01)
—$
(0.0
1)$1
.00
1.12
%$
543,
135
0.14
%2.
24%
0.19
%Ye
ar E
nded
Oct
ober
31,
201
81.
000.
02—
0.02
(0.0
2)—
(0.0
2)1.
001.
54%
707
,804
0.14
%1.
53%
0.18
%Ye
ar E
nded
Oct
ober
31,
201
71.
000.
01—
0.01
(0.0
1)—
(0.0
1)1.
000.
64%
861
,944
0.14
%0.
65%
0.19
%Ye
ar E
nded
Oct
ober
31,
201
61.
00—
——
——
—1.
000.
13%
346
,399
0.16
%0.
13%
0.20
%Ye
ar E
nded
Oct
ober
31,
201
51.
00—
——
——
—1.
00—
% 3
84,3
630.
05%
—%
0.19
%Ye
ar E
nded
Oct
ober
31,
201
41.
00—
——
——
—1.
000.
01%
263
,714
0.06
%0.
01%
0.19
%
INT
er
Me
DIA
rY
CL
AS
S S
HA
re
SS
ix M
onth
s E
nded
A
pril
30, 2
019
(una
udite
d)$
1.00
$0.0
1—
$0.0
1$
(0.0
1)—
$(0
.01)
$1.0
01.
11%
$17
9,63
60.
16%
2.22
%0.
34%
Year
End
ed O
ctob
er 3
1, 2
018
1.00
0.01
—0.
01(0
.01)
—(0
.01)
1.00
1.49
% 1
69,8
270.
16%
1.54
%0.
33%
Year
End
ed O
ctob
er 3
1, 2
017
1.00
——
——
——
1.00
0.44
% 1
0.18
%0.
44%
0.34
%Ju
ly 1
2, 2
016(
d) t
hrou
gh
Oct
ober
31,
201
61.
00—
——
——
—1.
000.
11%
1—
%0.
37%
0.38
%
INT
er
Me
DIA
rY
Se
rV
ICe
C
LA
SS
SH
Ar
eS
Six
Mon
ths
End
ed
Apr
il 30
, 201
9 (u
naud
ited)
$1.
00$0
.01
—$0
.01
$(0
.01)
—$
(0.0
1)$1
.00
1.10
%$
78,1
800.
18%
2.21
%0.
39%
Year
End
ed O
ctob
er 3
1, 2
018
1.00
0.01
—0.
01(0
.01)
—(0
.01)
1.00
1.49
% 5
1,22
00.
18%
1.54
%0.
38%
Year
End
ed O
ctob
er 3
1, 2
017
1.00
0.01
—0.
01(0
.01)
—(0
.01)
1.00
0.58
% 2
2,01
60.
20%
0.58
%0.
40%
July
12,
201
6(d)
thr
ough
O
ctob
er 3
1, 2
016
1.00
——
——
——
1.00
0.10
% 1
8,10
80.
20%
0.14
%0.
48%
JOB TITLE HSBC Money Market SAR REVISION 6 SERIAL <12345678> DATE Saturday, June 22, 2019 JOB NUMBER 358989-1 TYPE PAGE NO. 16 OPERATOR ABIGAELS

See notes to financial statements. HSBC FAMILY OF FUNDS 17
HS
BC
U.S
. T
re
AS
Ur
Y M
ON
eY
MA
rk
eT
FU
ND
Fin
anci
al H
igh
ligh
ts (
con
tin
ued
)
Inve
stm
ent
Act
ivit
ies
Dis
trib
uti
on
sr
atio
s/S
up
ple
men
tary
Dat
a
Net
Ass
et
Val
ue,
B
egin
nin
g
of
Per
iod
Net
In
vest
men
t In
com
e
Net
rea
lize
d
and
Un
real
ized
G
ain
s (L
oss
es)
fro
m
Inve
stm
ents
Tota
l fro
m
Inve
stm
ent
Act
ivit
ies
Net
In
vest
men
t In
com
e
Net
rea
lize
d
Gai
ns
fro
m
Inve
stm
ent
Tran
sact
ion
sTo
tal
Dis
trib
uti
on
s
Net
A
sset
V
alu
e,
en
d o
f P
erio
dTo
tal
ret
urn
(a)
Net
Ass
ets
at e
nd
of
Per
iod
(0
00’s
)
rat
io o
f N
et
exp
ense
s to
A
vera
ge
Net
A
sset
s(b
)
rat
io o
f N
et
Inve
stm
ent
Inco
me
to
Ave
rag
e N
et
Ass
ets(
b)
rat
io o
f e
xpen
ses
to A
vera
ge
Net
Ass
ets
(exc
lud
ing
Fee
r
edu
ctio
ns)
(b)
CL
AS
S Y
SH
Ar
eS
Six
Mon
ths
End
ed
Apr
il 30
, 201
9 (u
naud
ited)
$1.
00$0
.01
—$0
.01
$(0
.01)
—$
(0.0
1)$1
.00
1.06
%$
711,
147
0.25
%2.
13%
0.29
%Ye
ar E
nded
Oct
ober
31,
201
81.
000.
01—
0.01
(0.0
1)—
(0.0
1)1.
001.
43%
697
,972
0.25
%1.
37%
0.28
%Ye
ar E
nded
Oct
ober
31,
201
71.
000.
01—
0.01
(0.0
1)—
(0.0
1)1.
000.
53%
1,1
01,2
190.
25%
0.56
%0.
29%
Year
End
ed O
ctob
er 3
1, 2
016
1.00
——
——
——
1.00
0.04
% 6
97,8
660.
25%
0.04
%0.
30%
Year
End
ed O
ctob
er 3
1, 2
015
1.00
——
——
——
1.00
—%
763
,473
0.06
%—
%0.
29%
Year
End
ed O
ctob
er 3
1, 2
014
1.00
——
——
——
1.00
0.01
% 9
56,3
120.
06%
0.01
%0.
29%
(a) N
ot a
nnua
lized
for
per
iods
less
tha
n on
e ye
ar. T
otal
ret
urn
calc
ulat
ions
do
not
incl
ude
any
sale
s or
red
empt
ion
char
ges.
(b) A
nnua
lized
for
per
iods
less
tha
n on
e ye
ar.
(c) C
lass
A S
hare
s w
ere
oper
atio
nal d
urin
g a
port
ion
of t
he y
ear
only
. Am
ount
s re
flect
per
form
ance
for
a p
erio
d of
tim
e th
e cl
ass
had
oper
atio
ns, w
hich
was
201
day
s du
ring
the
perio
d.
The
net
asse
t va
lue
refle
cted
rep
rese
nts
the
last
day
the
cla
ss h
ad o
pera
tions
.(d
) Clo
sed
oper
atio
ns o
n A
ugus
t 10
, 201
7.(e
) Com
men
cem
ent
of o
pera
tions
on
July
12,
201
6.A
mou
nts
desi
gnat
ed a
s “—
” ar
e $0
.00
or h
ave
been
rou
nded
to
$0.0
0.
JOB TITLE HSBC Money Market SAR REVISION 6 SERIAL <12345678> DATE Saturday, June 22, 2019 JOB NUMBER 358989-1 TYPE PAGE NO. 17 OPERATOR ABIGAELS

18 HSBC FAMILY OF FUNDS
HSBC FAM ILY OF FUNDS
Notes to Financial Statements—as of April 30, 2019 (Unaudited)
1. Organization:
The HSBC Funds (the “Trust”), a Delaware statutory trust organized on March 2, 2016, is registered under the Investment Company Act of 1940, as amended (the “Act”), as an open-end management investment company. As of April 30, 2019, the Trust is composed of 10 separate operational funds, each a series of the HSBC Family of Funds. The accompanying financial statements are presented for the following two funds (individually a “Fund”, collectively the “Funds”) of the Trust:
Fund Short Name
HSBC U.S. Government Money Market Fund U.S. Government Money Market Fund
HSBC U.S. Treasury Money Market Fund U.S. Treasury Money Market Fund
Both of the Funds are diversified funds. Financial statements for all other funds of the Trust are published separately.
Both of the Funds are government money market funds (as defined in Rule 2a-7) and seek to maintain a stable net asset value (“NAV”) of $1.00 per share, although it is possible to lose money by investing in the Funds. The Funds are authorized to issue an unlimited number of shares of beneficial interest with a par value of $0.001 per share. Each of the Funds has eight classes of shares: Class A Shares, Class C Shares, Class D Shares, Class E Shares, Class I Shares, Intermediary Class Shares, Intermediary Service Class Shares and Class Y Shares. Class C Shares of the Funds are offered without any front-end sales charge but will be subject to a maximum CDSC of 1.00% if redeemed less than one year after purchase. Class C Shares are not offered for sale, but are offered as an exchange option for Class C shareholders of the Trust’s other funds. No sales charges are assessed with respect to Class A, Class D, Class E, Class I, Intermediary Class, Intermediary Service Class or Class Y Shares of the Funds. Each class of shares in each Fund has identical rights and privileges, except with respect to arrangements pertaining to shareholder servicing and/or distribution, class-related expenses, voting rights on matters affecting a single class of shares, and exchange privileges.
Under the Trust’s organizational documents, the Trust’s officers and Trustees are indemnified against certain liabilities arising out of the performance of their duties to the Funds. In addition, in the normal course of business, the Trust may enter into contracts with its service providers, which also provide for indemnifications by the Funds. The Funds’ maximum exposure under these arrangements is unknown as this would involve future claims that may be made against the Funds. However, based on experience, the Trust believes the risk of loss to be remote.
The Funds are investment companies and follow accounting and reporting guidance under Financial Accounting Standards Board (“FASB”) Accounting Standards Codification (“ASC”) Topic 946, “Financial Services-Investment Companies.”
2. Significant Accounting Policies:
The following is a summary of the significant accounting policies followed by the Funds in the preparation of their financial statements. The policies are in conformity with generally accepted accounting principles in the United States of America (“GAAP”). The preparation of financial statements requires management to make certain estimates and assumptions that affect the reported amounts of assets and liabilities and disclosure of contingent assets and liabilities at the date of the financial statements and the reported amounts of increases and decreases in net assets from operations during the reporting period. Actual results could differ from those estimates.
JOB TITLE HSBC Money Market SAR REVISION 6 SERIAL <12345678> DATE Friday, June 21, 2019 JOB NUMBER 358989-1 TYPE PAGE NO. 18 OPERATOR PAULJOHNO

HSBC FAMILY OF FUNDS 19
HSBC FAM ILY OF FUNDS
Notes to Financial Statements—as of April 30, 2019 (Unaudited) (continued)
Securities Valuation:
Investments of the Funds, other than investments in other money market funds, are valued using the amortized cost method pursuant to Rule 2a-7 under the Act, provided that certain conditions are met. Generally, amortized cost approximates fair value. Investments in other money market funds are priced at NAV as reported by such investment companies. Repurchase agreements are valued at original cost. Fair value is defined as the price that would be received to sell an asset or paid to transfer a liability in an orderly transaction between market participants at the measurement date. The valuation techniques used to determine fair value are further described in Note 3 below.
Investment Transactions and Related Income:
Investment transactions are accounted for no later than one business day after trade date. However, for financial reporting purposes, investment transactions are accounted for on trade date. Investment gains and losses are calculated on the identified cost basis. Interest income is determined on the basis of coupon interest accrued using the effective interest method which adjusts for amortization of premiums and accretion of discounts. Dividend income is recorded on the ex-dividend date.
Restricted Securities:
The Funds may invest in restricted securities. A restricted security is a security which has been purchased through a private offering and cannot be resold to the general public without prior registration under the Securities Act of 1933 (the “1933 Act”) or pursuant to the resale limitations provided by Rule 144 under the 1933 Act, or another exemption from the registration requirements of the 1933 Act. Certain restricted securities may be resold in transactions exempt from registration, normally to qualified institutional buyers, and may be deemed liquid by the Investment Adviser (as defined in Note 4) based on procedures established by the Board of Trustees (the “Board”). Therefore, not all restricted securities are considered illiquid. To the extent that a Fund purchases securities that are restricted as to resale or for which current market quotations are not available, such securities will be valued based upon all relevant factors as outlined in Securities and Exchange Commission (“SEC”) Financial Reporting Release No. 1. Disposal of restricted securities may involve time consuming negotiations and expense. Prompt sale at the current valuation may be difficult and could adversely affect the net assets of the Funds. At April 30, 2019, there were no restricted securities held by the Funds.
Repurchase Agreements:
The U.S. Government Money Market Fund may enter into repurchase agreements with an entity which is a member of the Federal Reserve System or which is a “primary dealer” (as designated by the Federal Reserve Bank of New York) in U.S. government obligations. The U.S. Government Money Market Fund may also enter into a repurchase agreement with the Federal Reserve Bank of New York, the Fixed Income Clearing Corporation, or certain couterparties approved by the Adviser (as defined below). The U.S. Treasury Money Market Fund may temporarily invest in repurchase agreements collateralized by U.S. Treasury Obligations under adverse market conditions. The repurchase price generally equals the price paid by a Fund plus interest negotiated on the basis of current short-term rates, which may be more or less than the rate on the underlying portfolio securities. The seller, under a repurchase agreement, is required to maintain the collateral held pursuant to the agreement, with a fair value equal to or greater than the repurchase price (including accrued interest). Securities subject to repurchase agreements are held by the Funds’ custodian or another qualified custodian or in the Federal Reserve/Treasury book-entry system. Master Repurchase Agreements (“MRA”) permit the Fund, under certain circumstances, including an event of default (such as bankruptcy or insolvency), to offset receivables under the MRA with collateral posted by the counterparty and create one net payment due to or from the Fund. However, bankruptcy or insolvency laws of a particular jurisdiction may impose restrictions on or prohibitions against such a right of offset in the event of the MRA counterparty’s bankruptcy or insolvency. Pursuant to terms of the MRA, the Fund receives securities as collateral with a market value in excess of the repurchase price to be received by the Fund upon the maturity of the transaction. Upon bankruptcy or insolvency of the MRA counterparty, the Fund would recognize a liability with respect to such excess collateral to reflect the Fund’s obligation under bankruptcy law to return the excess to the counterparty. There is potential for loss to a Fund in the event the Fund is delayed or prevented from exercising its rights to dispose of the collateral securities, including the risk of a possible decline in the fair value of the underlying securities during the period while the Fund seeks to assert its rights.
JOB TITLE HSBC Money Market SAR REVISION 6 SERIAL <12345678> DATE Friday, June 21, 2019 JOB NUMBER 358989-1 TYPE PAGE NO. 19 OPERATOR PAULJOHNO
20 HSBC FAMILY OF FUNDS
HSBC FAM ILY OF FUNDS
Notes to Financial Statements—as of April 30, 2019 (Unaudited) (continued)
Cash:
Cash is held in deposit accounts at the Funds’ custodian bank, The Northern Trust Company (“Custodian”), and is a significant portion of the net assets, which may exceed the amount insured by the Federal Deposit Insurance Corporation (“FDIC”). To the extent that such balances exceed FDIC insurance limits, the Funds are subject to the creditworthiness of the Custodian.
Allocations:
Expenses directly attributable to a Fund are charged to that Fund. Expenses not directly attributable to a Fund are allocated among the applicable series within the Trust equally to each fund, in relation to its net assets, or another appropriate basis. Class specific expenses are charged directly to the class incurring the expense. In addition, income, expenses (other than class specific expenses), and unrealized and realized gains and losses are allocated to each class based on relative net assets on a daily basis.
Distributions to Shareholders:
Dividends distributed to shareholders of the Funds from net investment income, if any, are declared daily and distributed monthly from each Fund. Distributions from net realized gains, if any, are declared and paid at least annually by the Funds. Additional distributions are also made to the Funds’ shareholders to the extent necessary to avoid the federal excise tax on certain undistributed income and net realized gains of regulated investment companies.
Federal Income Taxes:
Each Fund is a separate taxable entity for federal income tax purposes. Each Fund has qualified and intends to continue to qualify each year as a “regulated investment company’’ under Subchapter M of the Internal Revenue Code, as amended, and to distribute substantially all of its taxable net investment income and net realized gains, if any, to its shareholders. Accordingly, no provision for federal income or excise tax is required for the Funds, although shareholders may be taxed on distributions they receive.
Management of the Funds has reviewed tax positions taken in tax years that remain subject to examination by all major tax jurisdictions, including federal (i.e., the last four tax year ends and the interim tax period since then, as applicable). Management believes that there is no tax liability resulting from unrecognized tax benefits related to uncertain tax positions taken. Management’s conclusions may be subject to future review based on changes in, or interpretation of, accounting standards or tax laws and regulations.
3. Investment Valuation Summary
The valuation techniques employed by the Funds, as described below, maximize the use of observable inputs and minimize the use of unobservable inputs in determining fair value. The Funds’ investments are classified within the fair value hierarchy based on the lowest level of input that is significant to the fair value measurement. The inputs used for valuing the Funds’ investments are summarized in the three broad levels listed below:
• Level 1—quoted prices in active markets for identical assets
• Level 2—other significant observable inputs (including quoted prices for similar securities, interest rates, prepayments speeds, credit risk, etc.)
• Level 3—significant unobservable inputs (including the Fund’s own assumptions in determining the fair value of investments)
Changes in valuation techniques may result in transfers in or out of an assigned level within the fair value hierarchy. The inputs or methodology used for valuing investments are not necessarily an indication of the risk associated with investing in those investments.
JOB TITLE HSBC Money Market SAR REVISION 6 SERIAL <12345678> DATE Friday, June 21, 2019 JOB NUMBER 358989-1 TYPE PAGE NO. 20 OPERATOR PAULJOHNO
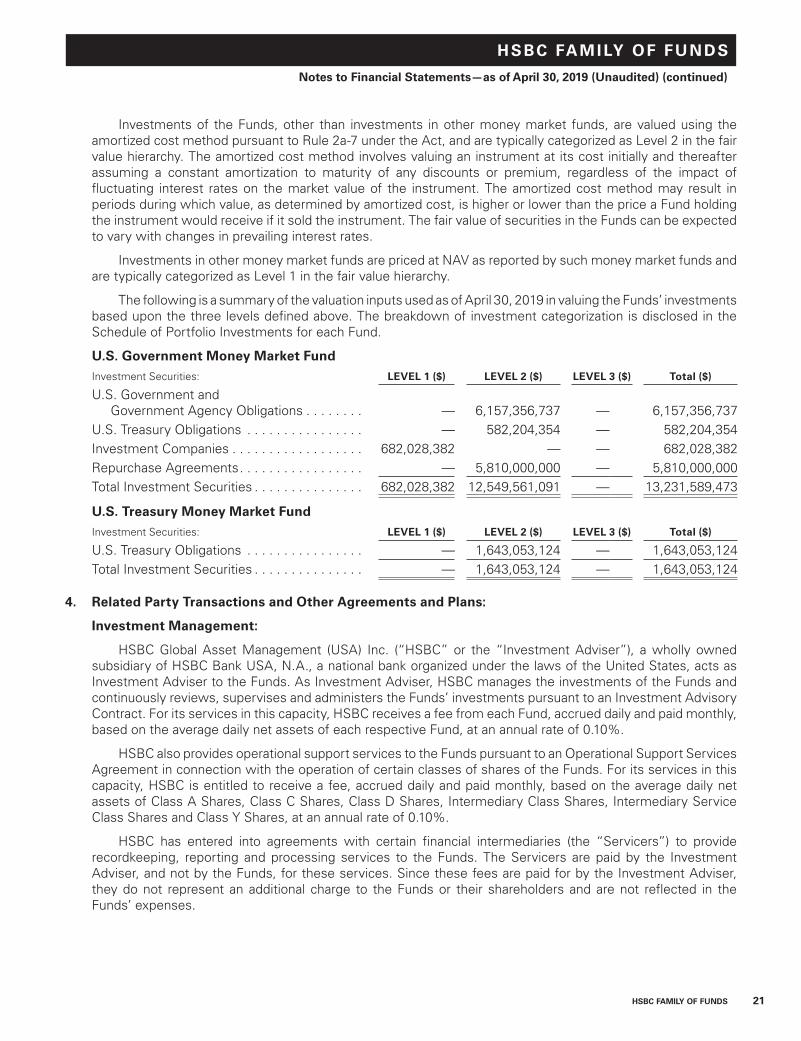
HSBC FAMILY OF FUNDS 21
HSBC FAM ILY OF FUNDS
Notes to Financial Statements—as of April 30, 2019 (Unaudited) (continued)
Investments of the Funds, other than investments in other money market funds, are valued using the amortized cost method pursuant to Rule 2a-7 under the Act, and are typically categorized as Level 2 in the fair value hierarchy. The amortized cost method involves valuing an instrument at its cost initially and thereafter assuming a constant amortization to maturity of any discounts or premium, regardless of the impact of fluctuating interest rates on the market value of the instrument. The amortized cost method may result in periods during which value, as determined by amortized cost, is higher or lower than the price a Fund holding the instrument would receive if it sold the instrument. The fair value of securities in the Funds can be expected to vary with changes in prevailing interest rates.
Investments in other money market funds are priced at NAV as reported by such money market funds and are typically categorized as Level 1 in the fair value hierarchy.
The following is a summary of the valuation inputs used as of April 30, 2019 in valuing the Funds’ investments based upon the three levels defined above. The breakdown of investment categorization is disclosed in the Schedule of Portfolio Investments for each Fund.
U.S. Government Money Market FundInvestment Securities: LEVEL 1 ($) LEVEL 2 ($) LEVEL 3 ($) Total ($)
U.S. Government and Government Agency Obligations . . . . . . . . — 6,157,356,737 — 6,157,356,737
U.S. Treasury Obligations . . . . . . . . . . . . . . . . — 582,204,354 — 582,204,354Investment Companies . . . . . . . . . . . . . . . . . . 682,028,382 — — 682,028,382Repurchase Agreements . . . . . . . . . . . . . . . . . — 5,810,000,000 — 5,810,000,000Total Investment Securities . . . . . . . . . . . . . . . 682,028,382 12,549,561,091 — 13,231,589,473
U.S. Treasury Money Market FundInvestment Securities: LEVEL 1 ($) LEVEL 2 ($) LEVEL 3 ($) Total ($)
U.S. Treasury Obligations . . . . . . . . . . . . . . . . — 1,643,053,124 — 1,643,053,124Total Investment Securities . . . . . . . . . . . . . . . — 1,643,053,124 — 1,643,053,124
4. Related Party Transactions and Other Agreements and Plans:
Investment Management:
HSBC Global Asset Management (USA) Inc. (“HSBC” or the “Investment Adviser”), a wholly owned subsidiary of HSBC Bank USA, N.A., a national bank organized under the laws of the United States, acts as Investment Adviser to the Funds. As Investment Adviser, HSBC manages the investments of the Funds and continuously reviews, supervises and administers the Funds’ investments pursuant to an Investment Advisory Contract. For its services in this capacity, HSBC receives a fee from each Fund, accrued daily and paid monthly, based on the average daily net assets of each respective Fund, at an annual rate of 0.10%.
HSBC also provides operational support services to the Funds pursuant to an Operational Support Services Agreement in connection with the operation of certain classes of shares of the Funds. For its services in this capacity, HSBC is entitled to receive a fee, accrued daily and paid monthly, based on the average daily net assets of Class A Shares, Class C Shares, Class D Shares, Intermediary Class Shares, Intermediary Service Class Shares and Class Y Shares, at an annual rate of 0.10%.
HSBC has entered into agreements with certain financial intermediaries (the “Servicers”) to provide recordkeeping, reporting and processing services to the Funds. The Servicers are paid by the Investment Adviser, and not by the Funds, for these services. Since these fees are paid for by the Investment Adviser, they do not represent an additional charge to the Funds or their shareholders and are not reflected in the Funds’ expenses.
JOB TITLE HSBC Money Market SAR REVISION 6 SERIAL <12345678> DATE Friday, June 21, 2019 JOB NUMBER 358989-1 TYPE PAGE NO. 21 OPERATOR PAULJOHNO

22 HSBC FAMILY OF FUNDS
HSBC FAM ILY OF FUNDS
Notes to Financial Statements—as of April 30, 2019 (Unaudited) (continued)
Administration, Fund Accounting and Other Services:
HSBC also serves the Funds as Administrator. Under the terms of the Administration Services Agreement, HSBC receives from the Funds (as well as other funds in the Trust combined) a fee, accrued daily and paid monthly, at an annual rate of:
Based on Average Daily Net Assets of Fee Rate(%)
Up to $10 billion . . . . . . . . . . . . . . . . . . . . . . . . . . . . . . . . . . . . . . . . . . . . . . . . . . . . . . . . . . . 0.0400In excess of $10 billion but not exceeding $20 billion . . . . . . . . . . . . . . . . . . . . . . . . . . . . . . 0.0350In excess of $20 billion but not exceeding $50 billion . . . . . . . . . . . . . . . . . . . . . . . . . . . . . . 0.0265In excess of $50 billion . . . . . . . . . . . . . . . . . . . . . . . . . . . . . . . . . . . . . . . . . . . . . . . . . . . . . . 0.0245
The fee rates and breakpoints are determined on the basis of the aggregate average daily net assets of the Trust. For the six-month period ended April 30, 2019, the effective annualized rate was 0.038%, prior to any fee waivers or expense reimbursements, based on the average daily net assets of the Trust. The total administration fee paid to HSBC is allocated to each series based upon its proportionate share of the aggregate net assets of the Trust, subject to certain allocations in cases where one fund invests some or all of its assets in another fund.
Pursuant to a Sub-Administration Services Agreement with HSBC, Citi Fund Services Ohio, Inc. (“Citi”), a wholly-owned subsidiary of Citigroup, Inc., serves as the Trust’s Sub-Administrator. For these services, Citi is entitled to a fee, payable by HSBC, at an annual rate equivalent to the fee rates set forth below:
Based on Average Daily Net Assets of Fee Rate(%)
Up to $10 billion . . . . . . . . . . . . . . . . . . . . . . . . . . . . . . . . . . . . . . . . . . . . . . . . . . . . . . . . . . . 0.0200In excess of $10 billion but not exceeding $20 billion . . . . . . . . . . . . . . . . . . . . . . . . . . . . . . 0.0150In excess of $20 billion but not exceeding $50 billion . . . . . . . . . . . . . . . . . . . . . . . . . . . . . . 0.0065In excess of $50 billion . . . . . . . . . . . . . . . . . . . . . . . . . . . . . . . . . . . . . . . . . . . . . . . . . . . . . . 0.0045
Under a Services Agreement between the Trust and Citi (the “Services Agreement”), Citi makes an individual available to serve as the Trust’s Chief Compliance Officer (the “CCO”). Citi also provides infrastructure and support in implementing the written policies and procedures comprising the Trust’s compliance program, including support services to the CCO. For the services provided under the Services Agreement, the Trust paid Citi $156,958 for the six-month period ended April 30, 2019, plus reimbursement of certain out-of-pocket expenses. Expenses incurred by each Fund are reflected on the Statements of Operations as “Compliance Services.” Citi pays the salary and other compensation earned by individuals performing these services, as employees of Citi.
In addition, Citi provides fund accounting services for each Fund under the Services Agreement. As fund accountant, Citi receives an annual fee per Fund and share class, subject to certain minimums and reimbursements of certain expenses. Citi receives additional fees paid by the Trust for regulatory administration services and money market fund reporting services.
Distribution Arrangements:
Foreside Distribution Services, L.P. (“Foreside”) serves the Trust as Distributor (the “Distributor”). The Trust has adopted a non-compensatory Distribution Plan and Agreement (the “Distribution Plan”) pursuant to Rule 12b-1 of the Act. The Distribution Plan provides for reimbursement of expenses incurred by the Distributor related to distribution and marketing, at a rate not to exceed 0.25%, 1.00% and 0.25% of the average daily net assets of Class A Shares (currently not being charged), Class C Shares (currently charging 0.75%) and Class D Shares (currently not being charged) of the Funds, respectively. For the six-month period ended April 30, 2019, Foreside, as Distributor, also received $20 in commissions from sales of the Trust.
Expenses reduced during the six-month period ended April 30, 2019 are reflected on the Statements of Operations as “Fees voluntarily reduced by Distributor”, as applicable.
JOB TITLE HSBC Money Market SAR REVISION 6 SERIAL <12345678> DATE Friday, June 21, 2019 JOB NUMBER 358989-1 TYPE PAGE NO. 22 OPERATOR PAULJOHNO

HSBC FAMILY OF FUNDS 23
HSBC FAM ILY OF FUNDS
Notes to Financial Statements—as of April 30, 2019 (Unaudited) (continued)
Shareholder Servicing:
The Trust has adopted a Shareholder Services Plan, which provides for payments to shareholder servicing agents (which includes HSBC and its affiliates) for providing various shareholder services. As disclosed in the Statements of Operations, for the current fiscal period certain amounts of the Shareholder Servicing Fees have been waived by those shareholder servicing agents, including HSBC and its affiliates. Expenses reduced during the six-month period ended April 30, 2019 are reflected on the Statements of Operations as “Fees voluntarily reduced by Shareholder Servicing Agent.” For performing these services, the shareholder servicing agents are entitled to receive a fee that is computed daily and paid monthly up to the following:
Share Class Fee Rate(%)
Class A Shares . . . . . . . . . . . . . . . . . . . . . . . . . . . . . . . . . . . . . . . . . . . . . . . . . . . . . . . . . . 0.60%*Class C Shares . . . . . . . . . . . . . . . . . . . . . . . . . . . . . . . . . . . . . . . . . . . . . . . . . . . . . . . . . . 0.25%Class D Shares . . . . . . . . . . . . . . . . . . . . . . . . . . . . . . . . . . . . . . . . . . . . . . . . . . . . . . . . . . 0.25%Class E Shares . . . . . . . . . . . . . . . . . . . . . . . . . . . . . . . . . . . . . . . . . . . . . . . . . . . . . . . . . . 0.10%Intermediary Class Shares . . . . . . . . . . . . . . . . . . . . . . . . . . . . . . . . . . . . . . . . . . . . . . . . . 0.05%Intermediary Service Class Shares. . . . . . . . . . . . . . . . . . . . . . . . . . . . . . . . . . . . . . . . . . . 0.10%
* Currently charging 0.40%
The aggregate fees paid to the Distributor pursuant to the Distribution Plan and to shareholder servicing agents pursuant to the Shareholder Services Plan may not exceed, in the aggregate, the following:
Share Class Fee Rate(%)
Class A Shares . . . . . . . . . . . . . . . . . . . . . . . . . . . . . . . . . . . . . . . . . . . . . . . . . . . . . . . . . . 0.60%Class C Shares . . . . . . . . . . . . . . . . . . . . . . . . . . . . . . . . . . . . . . . . . . . . . . . . . . . . . . . . . . 1.00%Class D Shares . . . . . . . . . . . . . . . . . . . . . . . . . . . . . . . . . . . . . . . . . . . . . . . . . . . . . . . . . . 0.25%Class E Shares . . . . . . . . . . . . . . . . . . . . . . . . . . . . . . . . . . . . . . . . . . . . . . . . . . . . . . . . . . 0.10%Intermediary Class Shares . . . . . . . . . . . . . . . . . . . . . . . . . . . . . . . . . . . . . . . . . . . . . . . . . 0.05%Intermediary Service Class Shares. . . . . . . . . . . . . . . . . . . . . . . . . . . . . . . . . . . . . . . . . . . 0.10%
The Trust has entered into shareholder services contracts with affiliated and unaffiliated financial intermediaries who provide shareholder services and other related services to their clients or customers who invest in the Funds under which the Funds will pay all or a portion of such fees earned to financial intermediaries for performing such services.
Transfer Agency:
DST Asset Manager Solutions, Inc. (“DST”) provides transfer agency services for each Fund. As transfer agent, DST receives a fee based on the number of funds and shareholder accounts, subject to certain minimums, and reimbursement of certain expenses.
JOB TITLE HSBC Money Market SAR REVISION 6 SERIAL <12345678> DATE Friday, June 21, 2019 JOB NUMBER 358989-1 TYPE PAGE NO. 23 OPERATOR PAULJOHNO
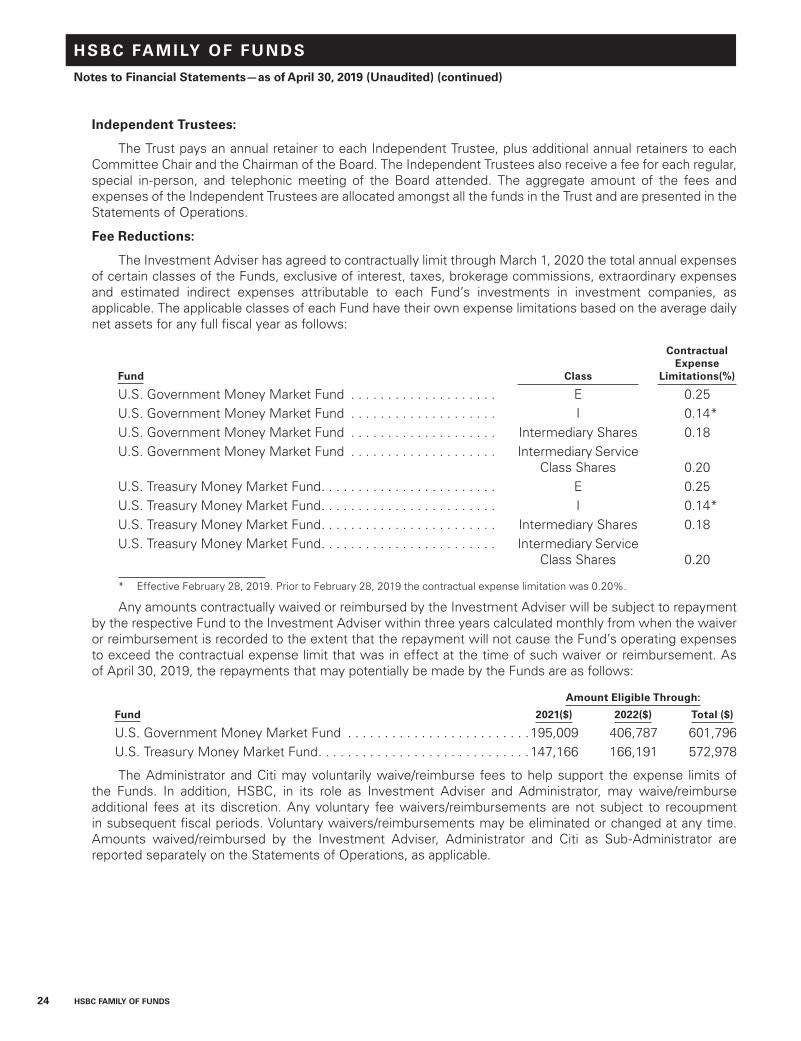
24 HSBC FAMILY OF FUNDS
HSBC FAM ILY OF FUNDS
Notes to Financial Statements—as of April 30, 2019 (Unaudited) (continued)
Independent Trustees:
The Trust pays an annual retainer to each Independent Trustee, plus additional annual retainers to each Committee Chair and the Chairman of the Board. The Independent Trustees also receive a fee for each regular, special in-person, and telephonic meeting of the Board attended. The aggregate amount of the fees and expenses of the Independent Trustees are allocated amongst all the funds in the Trust and are presented in the Statements of Operations.
Fee Reductions:
The Investment Adviser has agreed to contractually limit through March 1, 2020 the total annual expenses of certain classes of the Funds, exclusive of interest, taxes, brokerage commissions, extraordinary expenses and estimated indirect expenses attributable to each Fund’s investments in investment companies, as applicable. The applicable classes of each Fund have their own expense limitations based on the average daily net assets for any full fiscal year as follows:
Fund Class
ContractualExpense
Limitations(%)
U.S. Government Money Market Fund . . . . . . . . . . . . . . . . . . . . E 0.25U.S. Government Money Market Fund . . . . . . . . . . . . . . . . . . . . I 0.14*U.S. Government Money Market Fund . . . . . . . . . . . . . . . . . . . . Intermediary Shares 0.18U.S. Government Money Market Fund . . . . . . . . . . . . . . . . . . . . Intermediary Service
Class Shares 0.20U.S. Treasury Money Market Fund. . . . . . . . . . . . . . . . . . . . . . . . E 0.25U.S. Treasury Money Market Fund. . . . . . . . . . . . . . . . . . . . . . . . I 0.14*U.S. Treasury Money Market Fund. . . . . . . . . . . . . . . . . . . . . . . . Intermediary Shares 0.18U.S. Treasury Money Market Fund. . . . . . . . . . . . . . . . . . . . . . . . Intermediary Service
Class Shares 0.20
* Effective February 28, 2019. Prior to February 28, 2019 the contractual expense limitation was 0.20%.
Any amounts contractually waived or reimbursed by the Investment Adviser will be subject to repayment by the respective Fund to the Investment Adviser within three years calculated monthly from when the waiver or reimbursement is recorded to the extent that the repayment will not cause the Fund’s operating expenses to exceed the contractual expense limit that was in effect at the time of such waiver or reimbursement. As of April 30, 2019, the repayments that may potentially be made by the Funds are as follows:
Amount Eligible Through:
Fund 2021($) 2022($) Total ($)
U.S. Government Money Market Fund . . . . . . . . . . . . . . . . . . . . . . . . .195,009 406,787 601,796U.S. Treasury Money Market Fund. . . . . . . . . . . . . . . . . . . . . . . . . . . . .147,166 166,191 572,978
The Administrator and Citi may voluntarily waive/reimburse fees to help support the expense limits of the Funds. In addition, HSBC, in its role as Investment Adviser and Administrator, may waive/reimburse additional fees at its discretion. Any voluntary fee waivers/reimbursements are not subject to recoupment in subsequent fiscal periods. Voluntary waivers/reimbursements may be eliminated or changed at any time. Amounts waived/reimbursed by the Investment Adviser, Administrator and Citi as Sub-Administrator are reported separately on the Statements of Operations, as applicable.
JOB TITLE HSBC Money Market SAR REVISION 6 SERIAL <12345678> DATE Friday, June 21, 2019 JOB NUMBER 358989-1 TYPE PAGE NO. 24 OPERATOR PAULJOHNO

HSBC FAMILY OF FUNDS 25
HSBC FAM ILY OF FUNDS
Notes to Financial Statements—as of April 30, 2019 (Unaudited) (continued)
During the six-month period ended April 30, 2019, the following amounts of expenses were voluntarily and contractually waived:
FundClass A
($)Class D
($)Class E
($)Class I
($)Class Y
($)Intermediary
Class ($)
IntermediaryServiceClass ($)
Total ($)
U.S. Government Money Market Fund . . . 432 235,457 — 1,695,225 274,404 133,410 126,138 2,465,066
U.S. Treasury Money Market Fund . . . . . . — 32,406 — 155,145 144,068 144,460 65,990 542,069
The Funds have entered into an arrangement with their Custodian whereby credits realized as a result of uninvested cash balances are used to reduce the Custodian’s expenses. Expenses reduced during the six-month period ended April 30, 2019 are reflected on the Statements of Operations as “Custody earnings credits,” as applicable.
Overdraft Facility:
The Funds have entered into an arrangement with the Custodian whereby an uncommitted, secured overdraft facility is made available to meet unanticipated end-of-day liquidity needs of the Funds which cannot be fulfilled by trading activities. The interest rate on overdraft amounts is calculated at an annual rate of 0.50% plus the Federal Funds Rate. The overdraft facility is limited to $750,000,000 and $50,000,000 for the U.S. Government Money Market Fund and the U.S. Treasury Money Market Fund, respectively. As of April 30, 2019, the Funds did not have any overdrafts outstanding. Fees incurred during the six-month period ended April 30, 2019 by the Funds on overdrafts are reflected on the Statements of Operations within the “Custodian” expenses, and were as follows:
U.S. Government Money Market Fund . . . . . . . . . . . . . . . . . . . . . . . . . . . . . . . . . . . . . . . . . $18,400U.S. Treasury Money Market Fund. . . . . . . . . . . . . . . . . . . . . . . . . . . . . . . . . . . . . . . . . . . . . $ 15
5. Federal Income Tax Information:
At April 30, 2019, the cost basis of investments for federal income tax purposes, gross unrealized appreciation, gross unrealized depreciation and net unrealized appreciation/depreciation were as follows:
Tax Cost ($)Tax Unrealized
Appreciation ($)Tax Unrealized Depreciation ($)
Net Unrealized Appreciation/
(Depreciation) ($)
U.S. Government Money Market Fund . . . . 13,231,589,473 — — —U.S. Treasury Money Market Fund . . . . . . . . 1,643,053,124 — — —
The tax character of distributions paid by the Funds for the tax year ended October 31, 2018, was as follows:
Distributions paid from
Ordinary Income ($)
Net Long Term
Capital Gains ($)
Total Taxable
Distributions ($)
Total Distributions
Paid ($)(1)
U.S. Government Money Market Fund . . . . . . . . . . . 150,216,85 12,281 150,229,135 150,229,135U.S. Treasury Money Market Fund . . . . . . . . . . . . . . . 26,994,417 — 26,994,417 26,994,417
(1) Total distributions paid may differ from the amount reported in the Statements of Changes in Net Assets because distributions are recognized when actually paid for tax purposes.
JOB TITLE HSBC Money Market SAR REVISION 6 SERIAL <12345678> DATE Friday, June 21, 2019 JOB NUMBER 358989-1 TYPE PAGE NO. 25 OPERATOR PAULJOHNO

26 HSBC FAMILY OF FUNDS
HSBC FAM ILY OF FUNDS
Notes to Financial Statements—as of April 30, 2019 (Unaudited) (continued)
As of the tax year ended October 31, 2018, the components of accumulated earnings/(deficit) on a tax basis for the Funds were as follows:
UndistributedOrdinary
Income ($)AccumulatedEarnings ($)
DistributionsPayable ($)
AccumulatedCapital and
Other Losses
($)
UnrealizedAppreciation/(Depreciation)
($)
TotalAccumulated
Earnings/ (Deficit) ($)
U.S. Government Money Market Fund . . . . . . . . . . . . . 5,977,656 5,977,656 (5,956,754) (101,139) — (80,237)
U.S. Treasury Money Market Fund . . . . . . . . . . . . . . 818,990 818,990 (815,432) (34,897) — (31,339)
As of the tax year ended October 31, 2018, the Funds have net capital loss carryforwards (“CLCFs”) not subject to expiration as summarized in the table below. The Board does not intend to authorize a distribution of any realized gain for the Funds until any applicable CLCF has been offset or expires.
Short Term Amount ($)
U.S. Government Money Market Fund . . . . . . . . . . . . . . . . . . . . . . . . . . . . . . . . . . . . . . . . . . . . 101,139U.S. Treasury Money Market Fund . . . . . . . . . . . . . . . . . . . . . . . . . . . . . . . . . . . . . . . . . . . . . . . 34,897
Under current law, capital losses and specified ordinary losses realized after October 31 and non-specified ordinary losses incurred after December 31 (ordinary losses collectively known as “late year ordinary loss”) may be deferred and treated as occurring on the first business day of the following fiscal year. As of the tax year ended October 31, 2018, the Funds had no deferred losses.
The amount and character of net investment income and net realized gains distributed are determined in accordance with federal income tax regulations, which may differ from GAAP. These “book/tax” differences are either considered temporary or permanent in nature. To the extent these differences are permanent in nature (e.g., reclassification of market discounts, certain gain/loss, and certain distributions), such amounts are reclassified within the composition of net assets based on their federal tax-basis treatment; temporary differences (e.g., wash losses and post-October loss deferrals) do not require reclassification. To the extent distributions to shareholders from net investment income and net realized gains exceed net investment income and net realized gains for tax purposes, they are reported as distributions of capital.
6. Significant Shareholders:
Shareholders, including other funds, individuals, and accounts, as well as each Fund’s investment manager(s) and/or investment personnel, may from time to time own (beneficially or of record) a significant percentage of the Fund’s Shares and can be considered to “control” the Fund when that ownership exceeds 25% of the Fund’s assets (and which may differ from control as determined in accordance with GAAP).
JOB TITLE HSBC Money Market SAR REVISION 6 SERIAL <12345678> DATE Friday, June 21, 2019 JOB NUMBER 358989-1 TYPE PAGE NO. 26 OPERATOR PAULJOHNO

HSBC FAMILY OF FUNDS 27
HSBC FAM ILY OF FUNDS
Notes to Financial Statements—as of April 30, 2019 (Unaudited) (continued)
The following list includes the Funds which had individual shareholder accounts with ownership of voting securities greater than 10% of the total outstanding voting securities but less than 25% and/or accounts with ownership of voting securities greater than 25% of the total outstanding voting securities. Significant transactions by these shareholder accounts may negatively impact the Funds’ performance.
Fund
Number of shareholders with ownership of
voting securities of the Portfolio greater than 10% and less than 25% of the total Portfolio’s
outstanding voting securities
% owned inaggregate
by 10% - 25%shareholders
Number of shareholders with
ownership of voting securities of the Portfolio greater
than 25% of the total Portfolio’s outstanding
voting securities
% owned inaggregate by
greater than 25%
shareholders
U.S. Government Money Market Fund . . 3 47%(a) — —U.S. Treasury Money Market Fund . . . . . — — 1 58%(b)
(a) 20% owned by the Investment Adviser or an affiliate
(b) 58% owned by the Investment Adviser or an affiliate
7. Subsequent Events:
Management has evaluated subsequent events through the date these financial statements were issued. Based on the evaluation, no adjustments or additional disclosures were required to the financial statements as of April 30, 2019.
JOB TITLE HSBC Money Market SAR REVISION 6 SERIAL <12345678> DATE Friday, June 21, 2019 JOB NUMBER 358989-1 TYPE PAGE NO. 27 OPERATOR PAULJOHNO

28 HSBC FAMILY OF FUNDS
HSBC FAM ILY OF FUNDS
Investment Adviser Contract Approval (Unaudited)
Section 15(c) of the Investment Company Act of 1940, as amended (the “1940 Act”), generally requires that a majority of the trustees of a mutual fund who are not “interested persons” of the fund or the investment adviser, as defined in the 1940 Act (the “Independent Trustees”), review and approve the investment advisory agreement at an in person meeting for an initial period of up to two years and thereafter on an annual basis. A summary of the material factors considered by the Independent Trustees and the Board of Trustees (the “Board”) of HSBC Funds (the “Trust”) in connection with approving investment advisory and sub-advisory agreements for the series of the Trust (each, a “Fund”) and the conclusions the Independent Trustees and Board made as a result of those considerations are set forth below.
Annual Continuation of Advisory and Sub-Advisory Agreements
The Independent Trustees met separately on November 9, 2018 (in person), and the Board met on December 12-13, 2018 (in person) (each, a “Meeting,” and together, the “Meetings”) to consider, among other matters, the approval of the continuation of the: (i) Investment Advisory Contract and related Supplements (“Advisory Contracts”) between the Trust and the Adviser and (ii) Sub-Advisory Agreements (“Sub-Advisory Contracts” and, together with the Advisory Contracts, the “Agreements”) between the Adviser and each investment sub-adviser (“Sub-Adviser”) on behalf of one or more of the Funds.
Prior to the Meetings, the Independent Trustees requested, received and reviewed information to help them evaluate the terms of the Agreements. This information included, among other things, information about: (i) the services that the Adviser and Sub-Advisers provide; (ii) the personnel who provide such services; (iii) investment performance, including comparative data provided by Strategic Insight; (iv) trading practices of the Adviser and Sub-Advisers; (v) fees received or to be received by the Adviser and Sub-Advisers, including comparison with the advisory fees paid by other similar funds based on materials provided by Strategic Insight; (vi) total expense ratios, including in comparison with the total expense ratios of other similar funds provided by Strategic Insight; (vii) the profitability of the Adviser and certain of the Sub-Advisers; (viii) compliance-related matters pertaining to the Adviser and Sub-Advisers; (ix) regulatory developments, including rulemaking initiatives of the U.S. Securities and Exchange Commission (“SEC”); and (x) other information regarding the nature, extent and quality of services provided by the Adviser and the Sub-Advisers under their respective Agreements.
The Independent Trustees were separately advised by independent counsel throughout the process, and met with independent counsel in periodic executive and private sessions at which no representatives of management were present, including during the November 9, 2018 Meeting. During the November 9, 2018 Meeting and prior to voting to continue the Agreements, the Independent Trustees also received a memorandum from their independent counsel discussing the legal standards for their consideration of the proposed continuation of the Agreements.
The Board, including the Independent Trustees, considered and reviewed, among other things: (i) the information provided in advance of the Meetings; (ii) the Funds’ investment advisory arrangements and expense limitation agreements with the Adviser; (iii) the Trust’s arrangements with the unaffiliated Sub-Adviser to the Trust, Westfield Capital Management Company, LP (“Westfield”); (iv) the Trust’s arrangements with the affiliated Sub-Advisers to the Trust, HSBC Global Asset Management (UK) Limited, HSBC Global Asset Management (France) Limited and HSBC Global Asset Management (Hong Kong) Limited; (v) the fees paid to the Adviser pursuant to the Trust’s agreements with the Adviser for the provision of various non-advisory services, including the Administration Agreement, Support Services Agreement and Operational Support Services Agreement, and the terms and purpose of these agreements and comparative information about services and fees of other peer funds; (vi) regulatory considerations; (vii) the Adviser’s multi-manager function and the level of oversight services provided to the HSBC Opportunity Portfolio; (viii) the Adviser’s advisory services with respect to the Funds that are money market funds (“Money Market Funds”); (ix) the Adviser’s profitability and direct and indirect expenses; (x) a presentation by the Adviser’s Global Chief Investment Officer of Fixed Income regarding the strategy and outlook of the HSBC Emerging Markets Debt Fund, the HSBC Global High Yield Bond Fund and HSBC Global High Income Bond Fund; and (xi) additional information provided by the Adviser at the request of the Independent Trustees, following the November 9, 2018 Meeting.
JOB TITLE HSBC Money Market SAR REVISION 6 SERIAL <12345678> DATE Friday, June 21, 2019 JOB NUMBER 358989-1 TYPE PAGE NO. 28 OPERATOR PAULJOHNO

HSBC FAMILY OF FUNDS 29
HSBC FAM ILY OF FUNDS
Investment Adviser Contract Approval (Unaudited) (continued)
In addition, the Board took into consideration its overall experience with the Adviser and the Sub-Advisers, and its experience with them during the prior year, as well as information contained in the various written and oral reports provided to the Board, including but not limited to quarterly performance reports prepared by management containing reviews of investment results and periodic presentations from portfolio managers, product managers and other senior employees of the Adviser and certain of the Sub-Advisers. As a result of this process, at the in-person meeting held on December 12-13, 2018, the Board unanimously agreed to approve the continuation of the Agreements with respect to each Fund. The Board reviewed materials and made their respective determinations on a Fund-by-Fund basis.
Nature, Extent, and Quality of Services Provided by Adviser and Sub-Advisers. The Board, including the Independent Trustees, examined the nature, quality and extent of the investment advisory services provided (or to be provided) by the Adviser to the Funds, as well as the quality and experience of the Adviser’s personnel.
The Board, including the Independent Trustees, also considered: (i) the long-term relationship between the Adviser and the Funds; (ii) the Adviser’s reputation and financial condition; (iii) the assets of the HSBC Family of Funds; (iv) the Adviser’s ongoing commitment to implement rulemaking initiatives of the SEC, including the SEC’s liquidity risk management and data modernization rules and rule amendments; (iv) the business strategy of the Adviser and its parent company and their financial and other resources that are committed to the Funds’ business; (v) the capabilities and performance of the Adviser’s portfolio management teams and other personnel; and (vi) the support, in terms of personnel, allocated by the Adviser to the Funds.
With respect to the Money Market Funds, the Board also considered the additional yield support, in the form of additional expense reductions, provided by the Adviser and its affiliates to maintain a competitive yield for the Money Market Funds, and noted the impact of these subsidies and waivers had on the profitability of the Adviser. In addition, the Board considered the Adviser’s plans for increasing the competitive yield for the Money Market Funds, as previously discussed with the Board. Also, the Board considered the Adviser’s performance in fulfilling its responsibilities for overseeing its own and the Sub-Advisers’ compliance with the Funds’ compliance policies and procedures and investment objectives.
The Board, including the Independent Trustees, also examined the nature, quality and extent of the services that the Sub-Advisers provide (or will provide) to their respective Funds. In this regard, the Board considered the investment performance, as described below, and the portfolio risk characteristics achieved by the Sub-Advisers and the Sub-Advisers’ portfolio management teams, their experience, and the quality of their compliance programs, among other factors.
Based on these considerations, the Board, including the Independent Trustees, concluded that the nature, quality and extent of the services provided by the Adviser and Sub-Advisers supported continuance of the Agreements.
Investment Performance of the Funds, Adviser and Sub-Advisers. The Board, including the Independent Trustees, considered the investment performance of each Fund over various periods of time, as compared to one another as well as to comparable peer funds, one or more benchmark indices and other accounts managed by the Adviser and Sub-Advisers.
In the context of the HSBC Opportunity Portfolio, the Board discussed Fund expenses, including the sub-advisory fees paid to Westfield, recent performance, recent performance as compared to the competitive peers of the HSBC Opportunity Portfolio, Westfield’s efforts to obtain best execution, and volatility information.
In the context of the HSBC Emerging Markets Debt Fund, HSBC Frontier Markets Fund, HSBC Asia ex-Japan Smaller Companies Equity Fund, HSBC Global High Yield Bond Fund, and HSBC Global High Income Bond Fund, the Board evaluated each Fund’s performance against the comparative data provided by Strategic Insight. The Independent Trustees also considered the Adviser’s commentary on this comparative data.
The Board also considered each Fund’s current expense ratios compared to its peers, and the current asset size of each Fund. In addition, with respect to the HSBC Frontier Markets Fund, the Board considered the changes to the Fund’s contractual expense limits which reduced the total annual operating expenses of each share class of the Fund.
JOB TITLE HSBC Money Market SAR REVISION 6 SERIAL <12345678> DATE Friday, June 21, 2019 JOB NUMBER 358989-1 TYPE PAGE NO. 29 OPERATOR PAULJOHNO

30 HSBC FAMILY OF FUNDS
HSBC FAM ILY OF FUNDS
Investment Adviser Contract Approval (Unaudited) (continued)
For the Money Market Funds, the Board considered the additional yield support that the Adviser had provided in order for the Money Market Funds to maintain positive yield and performance, and that the returns of the Funds were similar to their competitors.
The Board, including the Independent Trustees, considered the Adviser’s commitment to continue to evaluate and undertake actions to help generate competitive investment performance. The Board, including the Independent Trustees, concluded that under the circumstances, the investment performance of each Fund was such that each Agreement should continue.
Costs of Services and Profits Realized by the Adviser and Sub-Advisers. The Board, including the Independent Trustees, considered the costs of the services provided by the Adviser and Sub-Advisers and the expense ratios of the Funds more generally. The Board considered the Adviser’s profitability and costs, including, but not limited to, an analysis provided by the Adviser of its estimated profitability attributable to its relationship with the Funds. The Board also considered the contractual advisory fees under the Advisory Contracts and compared those fees to the fees of similar funds, which had been compiled and provided by Strategic Insight. The Board determined that, although some competitors had lower fees than the Funds, in general, the Fund’s advisory fees were reasonable in light of the nature and quality of services provided, noting the resources, expertise and experience provided to the Funds by the Adviser and Sub-Advisers.
The Board also considered information comparing the advisory fees under the Advisory Contracts with those of other accounts managed by the Adviser.
The Board further considered the costs of the services provided by the Sub-Advisers, as available; the relative portions of the total advisory fees paid to the Sub-Advisers and retained by the Adviser in its capacity as the Funds’ investment adviser; and the services provided by the Adviser and Sub-Advisers. In the context of the HSBC Opportunity Portfolio, the Board considered the sub-advisory fee structures, and any applicable breakpoints. In addition, the Board discussed the distinction between the services provided by the Adviser to HSBC Funds with sub-advisers pursuant to the Advisory Contracts and the services provided by the Sub-Advisers pursuant to the Sub-Advisory Contracts. The Board also considered information on profitability where provided by the Sub-Advisers.
The Board, including the Independent Trustees, concluded that the advisory fees payable to the Adviser and the Funds’ Sub-Advisers were reasonable in light of the factors set forth above.
Other Relevant Considerations. The Board, including the Independent Trustees, also considered the extent to which the Adviser and Sub-Advisers had achieved economies of scale, whether the Funds’ expense structure permits economies of scale to be shared with the Funds’ shareholders and, if so, the extent to which the Funds’ shareholders may benefit from these economies of scale. The Board also noted the contractual caps on certain Fund expenses provided by the Adviser with respect to many of the Funds in order to reduce or control the overall operating expenses of those Funds and noted the Adviser’s entrepreneurial commitment to the Funds. In addition, the Board considered certain information provided by the Adviser and Sub-Advisers with respect to the benefits they may derive from their relationships with the Funds, including the fact that certain Sub-Advisers have “soft dollar” arrangements with respect to Fund brokerage and therefore may have access to research and other permissible services.
In approving the renewal of the Agreements, the Board, including the Independent Trustees, did not identify any single factor as controlling, and generally attributed different weights to various factors for the various Funds. The Board evaluated all information available to them on a Fund-by-Fund basis, and their decisions were made separately with respect to each Fund. In light of the above considerations and such other factors and information it considered relevant, the Board by a unanimous vote of those present in person at the Meeting (including a separate unanimous vote of the Independent Trustees present in person at the Meeting) approved the continuation of each Agreement.
JOB TITLE HSBC Money Market SAR REVISION 6 SERIAL <12345678> DATE Friday, June 21, 2019 JOB NUMBER 358989-1 TYPE PAGE NO. 30 OPERATOR PAULJOHNO
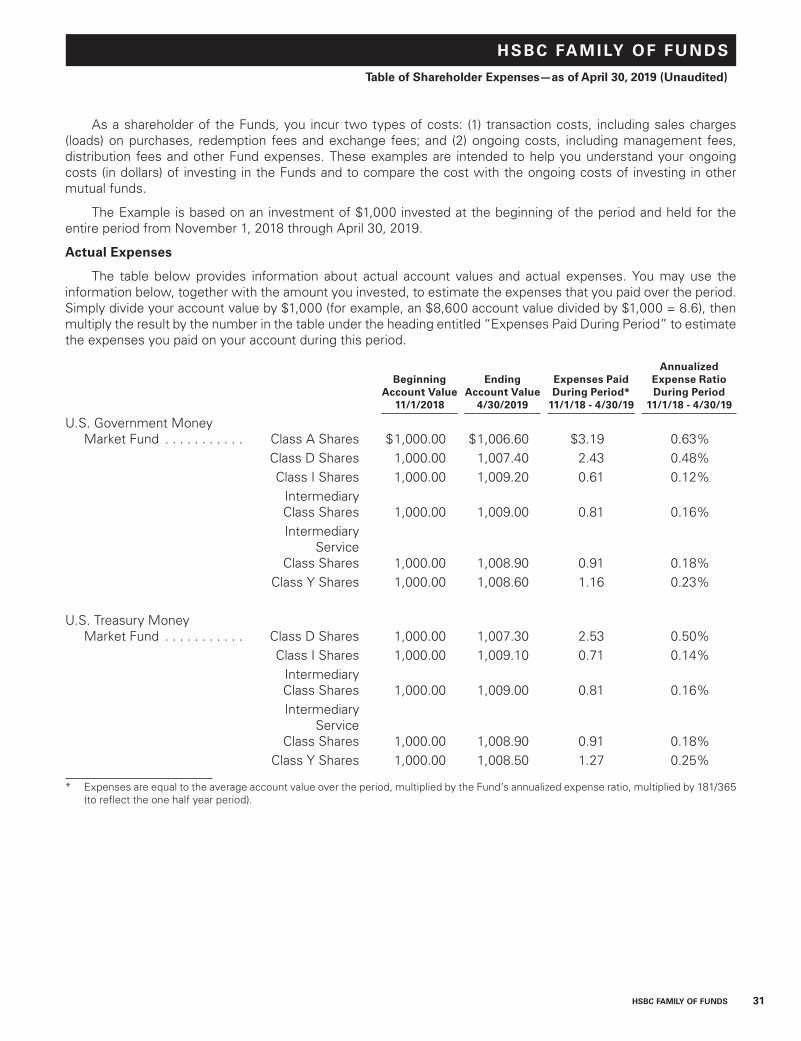
HSBC FAMILY OF FUNDS 31
HSBC FAM ILY OF FUNDS
Table of Shareholder Expenses—as of April 30, 2019 (Unaudited)
As a shareholder of the Funds, you incur two types of costs: (1) transaction costs, including sales charges (loads) on purchases, redemption fees and exchange fees; and (2) ongoing costs, including management fees, distribution fees and other Fund expenses. These examples are intended to help you understand your ongoing costs (in dollars) of investing in the Funds and to compare the cost with the ongoing costs of investing in other mutual funds.
The Example is based on an investment of $1,000 invested at the beginning of the period and held for the entire period from November 1, 2018 through April 30, 2019.
Actual Expenses
The table below provides information about actual account values and actual expenses. You may use the information below, together with the amount you invested, to estimate the expenses that you paid over the period. Simply divide your account value by $1,000 (for example, an $8,600 account value divided by $1,000 = 8.6), then multiply the result by the number in the table under the heading entitled “Expenses Paid During Period” to estimate the expenses you paid on your account during this period.
Beginning Account Value
11/1/2018
Ending Account Value
4/30/2019
Expenses Paid During Period*
11/1/18 - 4/30/19
Annualized Expense Ratio During Period
11/1/18 - 4/30/19
U.S. Government Money Market Fund . . . . . . . . . . . Class A Shares $1,000.00 $1,006.60 $3.19 0.63%
Class D Shares 1,000.00 1,007.40 2.43 0.48%Class I Shares 1,000.00 1,009.20 0.61 0.12%
Intermediary Class Shares 1,000.00 1,009.00 0.81 0.16%Intermediary
Service Class Shares 1,000.00 1,008.90 0.91 0.18%
Class Y Shares 1,000.00 1,008.60 1.16 0.23%
U.S. Treasury Money Market Fund . . . . . . . . . . . Class D Shares 1,000.00 1,007.30 2.53 0.50%
Class I Shares 1,000.00 1,009.10 0.71 0.14%Intermediary Class Shares 1,000.00 1,009.00 0.81 0.16%Intermediary
Service Class Shares 1,000.00 1,008.90 0.91 0.18%
Class Y Shares 1,000.00 1,008.50 1.27 0.25%
* Expenses are equal to the average account value over the period, multiplied by the Fund’s annualized expense ratio, multiplied by 181/365 (to reflect the one half year period).
JOB TITLE HSBC Money Market SAR REVISION 6 SERIAL <12345678> DATE Friday, June 21, 2019 JOB NUMBER 358989-1 TYPE PAGE NO. 31 OPERATOR PAULJOHNO

32 HSBC FAMILY OF FUNDS
HSBC FAM ILY OF FUNDS
Table of Shareholder Expenses—as of April 30, 2019 (Unaudited) (continued)
Hypothetical Example for Comparison Purposes
The table below provides information about hypothetical account values and hypothetical expenses based on each Fund’s actual expense ratio and an assumed rate of return of 5% per year before expenses, which is not the Fund’s actual return. The hypothetical account values and expenses may not be used to estimate the actual ending account balance or expenses you paid for the period. You may use this information to compare this 5% hypothetical example with the 5% hypothetical examples that appear in the shareholder reports of other funds.
Please note that the expenses shown in the table are meant to highlight your ongoing costs only and do not reflect any transactional costs, such as sales charges (loads), redemption fees, or exchange fees. Therefore, the table is useful in comparing ongoing costs only, and will not help you determine the relative total costs of owning different funds. In addition, if these transactional costs were included, your costs would have been higher.
Beginning Account Value
11/1/2018
Ending Account Value
4/30/2019
Expenses Paid During Period*
11/1/18 - 4/30/19
Annualized Expense Ratio During Period
11/1/18 - 4/30/19
U.S. Government Money Market Fund . . . . . . . . . Class A Shares $1,000.00 $1,022.03 $3.21 0.63%
Class D Shares 1,000.00 1,022.79 2.45 0.48%Class I Shares 1,000.00 1,024.60 0.61 0.12%
Intermediary Class Shares 1,000.00 1,024.40 0.82 0.16%Intermediary
Service Class Shares 1,000.00 1,024.30 0.92 0.18%
Class Y Shares 1,000.00 1,024.05 1.17 0.23%
U.S. Treasury Money Market Fund . . . . . . . . . Class D Shares 1,000.00 1,022.68 2.55 0.50%
Class I Shares 1,000.00 1,024.50 0.71 0.14%Intermediary Class Shares 1,000.00 1,024.40 0.82 0.16%Intermediary
Service Class Shares 1,000.00 1,024.30 0.92 0.18%
Class Y Shares 1,000.00 1,023.95 1.28 0.25%
* Expenses are equal to the average account value over the period, multiplied by the Fund’s annualized expense ratio, multiplied by 181/365 (to reflect the one half year period).
JOB TITLE HSBC Money Market SAR REVISION 6 SERIAL <12345678> DATE Friday, June 21, 2019 JOB NUMBER 358989-1 TYPE PAGE NO. 32 OPERATOR PAULJOHNO

HSBC FAMILY OF FUNDS 33
HSBC FAM ILY OF FUNDS
Other Information (Unaudited)
Information regarding how the Funds voted proxies relating to portfolio securities during the most recent 12-month period ended June 30th is available (i) without charge, upon request, by calling 1-800-525-5757 for HSBC Bank USA and HSBC Brokerage (USA) Inc. clients and 1-800-782-8183 for all other shareholders; (ii) on the Funds’ website at www.investorfunds.us.hsbc.com; and (iii) on the SEC’s website at http://www.sec.gov.
The Funds file their complete schedules of portfolio holdings with the SEC for the first and third quarters of each fiscal year on Form N-Q. The Funds’ Forms N-Q are available on the SEC’s website at http://www.sec.gov. The Funds’ Schedules of Investments will be available no later than 60 days after each period end, without charge, on the Funds’ website at www.investorfunds.us.hsbc.com.
An investment in a Fund is not a deposit of HSBC Bank USA, National Association, and is not insured or guaranteed by the Federal Deposit Insurance Corporation or any other government agency.
JOB TITLE HSBC Money Market SAR REVISION 6 SERIAL <12345678> DATE Friday, June 21, 2019 JOB NUMBER 358989-1 TYPE PAGE NO. 33 OPERATOR PAULJOHNO

HSBC FAMILY OF FUNDS:
INVESTMENT ADVISER AND ADMINISTRATOR
HSBC Global Asset Management (USA) Inc. 452 Fifth Avenue New York, NY 10018
SHAREHOLDER SERVICING AGENTS
For HSBC Bank USA, N.A. and HSBC Securities (USA) Inc. Clients: HSBC Bank USA, N.A. 452 Fifth Avenue New York, NY 10018 1-888-525-5757
For All Other Shareholders:
HSBC Funds P.O. Box 8106 Boston, MA 02266-8106 1-800-782-8183
TRANSFER AGENT
DST Asset Manager Solutions, Inc. 2000 Crown Colony Drive Quincy, MA 02169
DISTRIBUTOR
Foreside Distribution Services, L.P. Three Canal Plaza, Suite 100 Portland, ME 04101
CUSTODIAN
The Northern Trust Company 50 South LaSalle Street Chicago, IL 60603
INDEPENDENT REGISTERED PUBLIC ACCOUNTING FIRM
PricewaterhouseCoopers LLP 300 Madison Avenue New York, NY 10017
LEGAL COUNSEL
Dechert LLP 1900 K Street, N.W. Washington, D.C. 20006
Investment products are offered by HSBC Securities (USA) Inc. (HSI), member NYSE/FINRA/SIPC. HSI is an affiliate of HSBC Bank USA, N.A. Investment products: Are not a deposit or other obligation of the bank or any of its affiliates; Not FDIC insured or insured by any federal government agency of the United States; Not guaranteed by the bank or any of its affiliates; and are subject to investment risk, including possible loss of principal invested.
Investors should consider the investment objectives, risks, charges, and expenses of the investment company carefully before investing. The prospectus contains this and other important information about the investment company. For clients of HSBC Securities (USA) Inc., please call 1-888-525-5757 for more information. For other investors and prospective investors, please call the Funds directly at 1-800-782-8183 or visit our website at www.investorfunds.us.hsbc.com. Investors should read the prospectus carefully before investing or sending money.
HSB-SAR-MMF-0619 06/19
Investment products:
ARE NOT A BANK DEPOSIT OR OBLIGATION OF THE BANK OR ANY OF ITS AFFILIATES
ARE NOT FDIC INSURED
ARE NOT INSURED BY ANY FEDERAL GOVERNMENT AGENCY
ARE NOT GUARANTEED BY THE BANK OR ANY OF ITS AFFILIATES
MAY LOSE VALUE
JOB TITLE HSBC Money Market SAR REVISION 6 SERIAL <12345678> DATE Saturday, June 22, 2019 JOB NUMBER 358989-1 TYPE PAGE NO. 34 OPERATOR ABIGAELS