Embed Size (px)
Citation preview
JO DAVIESS COUNTY GIS INTERNET MAPPING SITE USER GUIDE
VERSION 3.0 FEBRUARY 10, 2011
Jo Daviess GIS Website User Guide February 10, 2011 Version 3.0 2
TABLE OF CONTENTS
Introduction………………………………………………………………………………………………3 Getting Started…………………………………………………………………………………………. 4 Site Layout……………………………………………………………………………………………….. 5 Map Area…………………………………………………………………………………………………. 6 Overview Map…………………………………………………………………………………………..7 Map List…………………………………………………………………………………………………….8 Legend…………………………………………………………………………………………………..9‐12 Map Navigation Tools………………………………………………………………………….13‐14 Search Tool………………………………………………………………………………………….14‐21 Selection Tools…………………………………………………………………………………….22‐25 Measure & Coordinate Tools……………………………………………………………….26‐27 Printing Maps………………………………………………………………………………………28‐39 Help Tool………………………………………………………………………………………………….40 Options Tool……………………………………………………………………………………..…40‐42 Log Out……………………………………..………………………………………………………………42 Keep Connected Tools………………………….……………………………………………………43

Jo Daviess GIS Website User Guide February 10, 2011 Version 3.0 3
INTRODUCTION
This document describes the uses and functionality available to employees/officials and subscribers on the Jo Daviess County Geographic Information System Internet Mapping Site. This guide was created to be a reference for users. Users should feel free to explore all aspects of this site – the site can not be harmed in any way by end users. Please note that large amounts of data are potentially transmitted during a user’s session on this site. The time required for the maps to load into your browser will depend on your Internet connection speed and the amount of data being requested. Also please note that clicking too quickly can result in errors and sometimes require a user to start over from the beginning. This site may be taken offline periodically to install data updates and software maintenance. All efforts will be made to limit downtime. Email notifications with the scheduled downtime will be sent to users prior to performing maintenance.
Jo Daviess GIS Website User Guide February 10, 2011 Version 3.0 4
GETTING STARTED
Users of the Jo Daviess GIS Internet Mapping Site are encouraged to visit www.jodaviessgis.com for additional information about this site.
Any computer to be used for accessing the GIS Internet Mapping Site must have the Adobe Flash Player installed. The player is available for free download at http://get.adobe.com/flashplayer/
For the best results when using the Jo Daviess County GIS Internet Mapping Site we recommend:
Cable, DSL, T1 or a faster Internet Connection Disable pop‐up blocking software Screen Resolution set to 1024 x 768 or higher Internet Explorer 7.0 or higher (Firefox is not 100% compatible with the Flash Player) Adobe Reader 5.0 or higher
Please read the Site disclaimer found at http://www.jodaviessgis.com/GISWebDisclaimer.htm
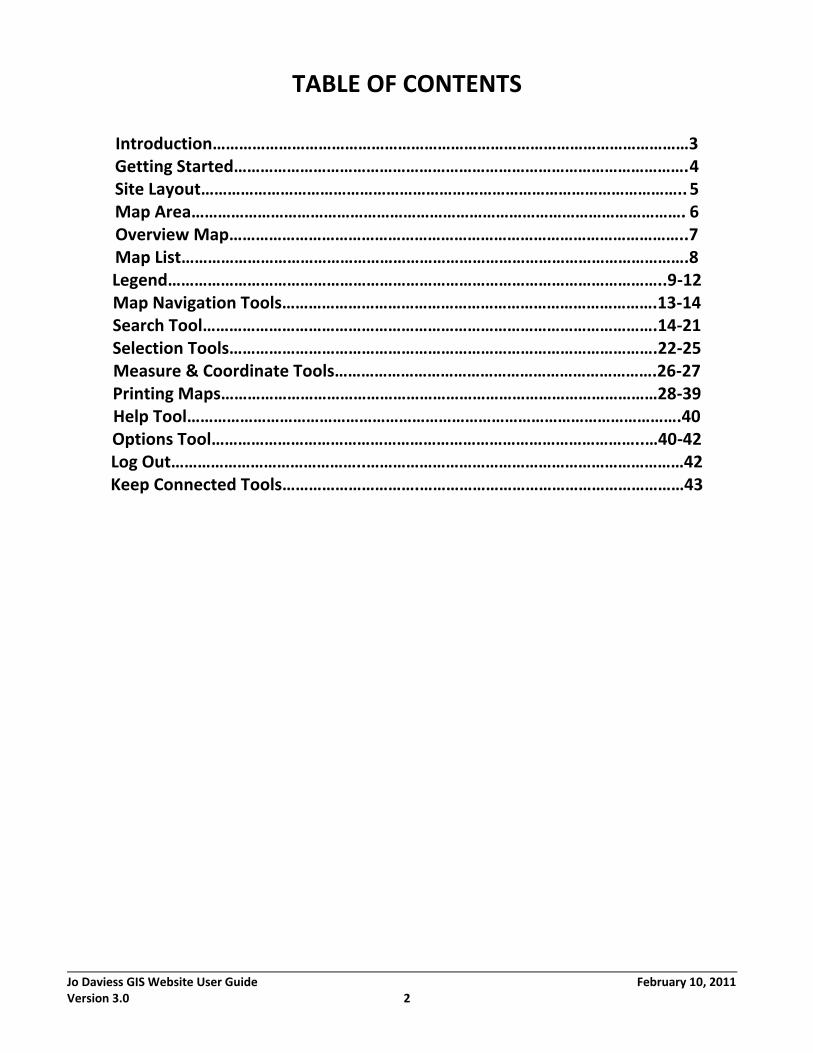
The default page is http://www.jodaviessgis.com/GISWebPortals.htm. Please add this site to your Favorites in Internet Explorer for easy access in the future. Click on the appropriate button to access the site. Subscription and Government Access requires the username and password to be entered as shown below.
‐‐‐‐‐‐‐‐‐‐‐‐‐‐‐‐‐‐‐‐‐‐‐‐‐‐‐‐‐‐‐‐‐‐‐‐‐‐‐‐‐‐‐‐‐‐‐‐‐‐‐‐‐‐‐‐‐‐‐‐‐‐‐‐‐‐‐‐‐‐‐‐‐‐‐‐‐‐‐‐‐‐‐‐‐‐‐‐‐‐‐‐‐‐‐‐‐‐‐‐‐‐‐‐‐‐‐‐‐‐‐‐‐‐‐‐‐‐‐‐‐‐‐‐‐‐‐‐‐‐‐‐‐‐‐‐‐‐‐‐‐‐‐‐‐‐‐‐‐‐‐‐‐‐‐‐‐‐‐‐‐‐‐‐‐‐‐‐‐‐‐‐‐‐‐‐‐‐‐‐‐‐‐‐‐‐‐‐‐‐‐‐‐‐‐‐‐‐‐‐‐‐‐‐‐‐‐‐
Jo Daviess GIS Website User Guide February 10, 2011 Version 3.0 5
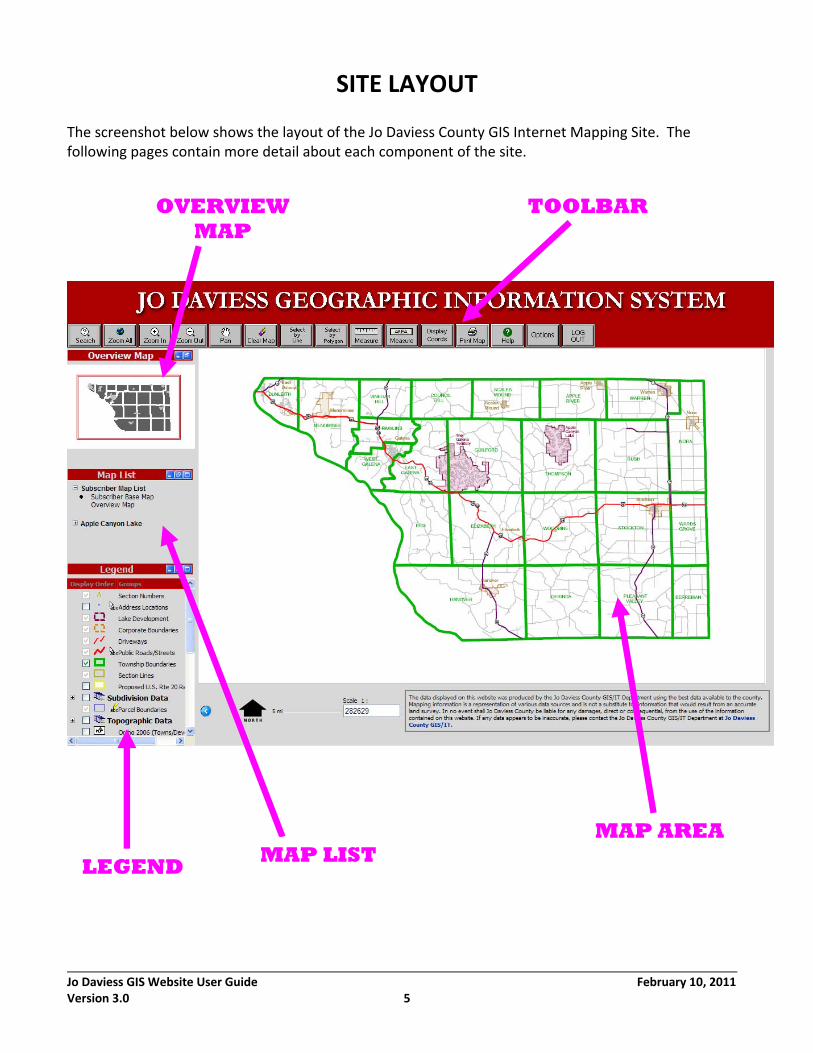
SITE LAYOUT
The screenshot below shows the layout of the Jo Daviess County GIS Internet Mapping Site. The following pages contain more detail about each component of the site.
TOOLBAR OVERVIEW MAP
MAP AREA MAP LIST LEGEND
Jo Daviess GIS Website User Guide February 10, 2011 Version 3.0 6
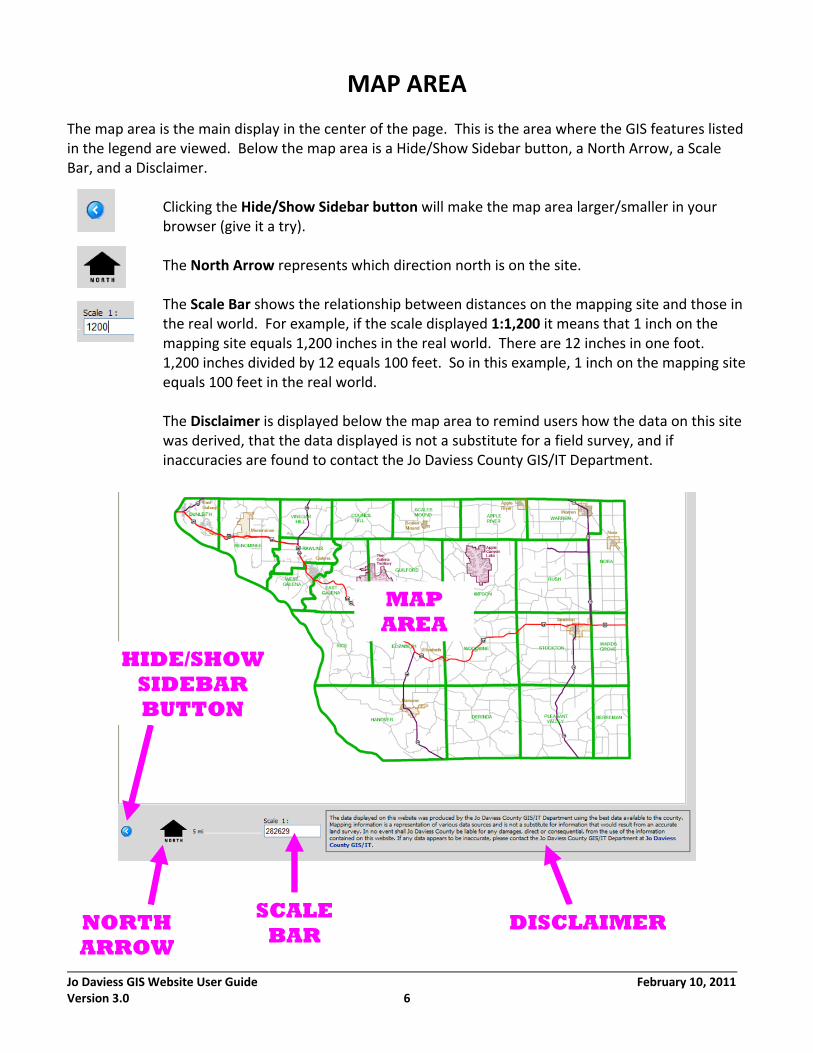
MAP AREA
The map area is the main display in the center of the page. This is the area where the GIS features listed in the legend are viewed. Below the map area is a Hide/Show Sidebar button, a North Arrow, a Scale Bar, and a Disclaimer.
Clicking the Hide/Show Sidebar button will make the map area larger/smaller in your browser (give it a try).
The North Arrow represents which direction north is on the site.
The Scale Bar shows the relationship between distances on the mapping site and those in the real world. For example, if the scale displayed 1:1,200 it means that 1 inch on the mapping site equals 1,200 inches in the real world. There are 12 inches in one foot. 1,200 inches divided by 12 equals 100 feet. So in this example, 1 inch on the mapping site equals 100 feet in the real world.
The Disclaimer is displayed below the map area to remind users how the data on this site was derived, that the data displayed is not a substitute for a field survey, and if inaccuracies are found to contact the Jo Daviess County GIS/IT Department.
NORTH
ARROW
HIDE/SHOW SIDEBAR BUTTON
MAP AREA
SCALE BAR
DISCLAIMER
Jo Daviess GIS Website User Guide February 10, 2011 Version 3.0 7
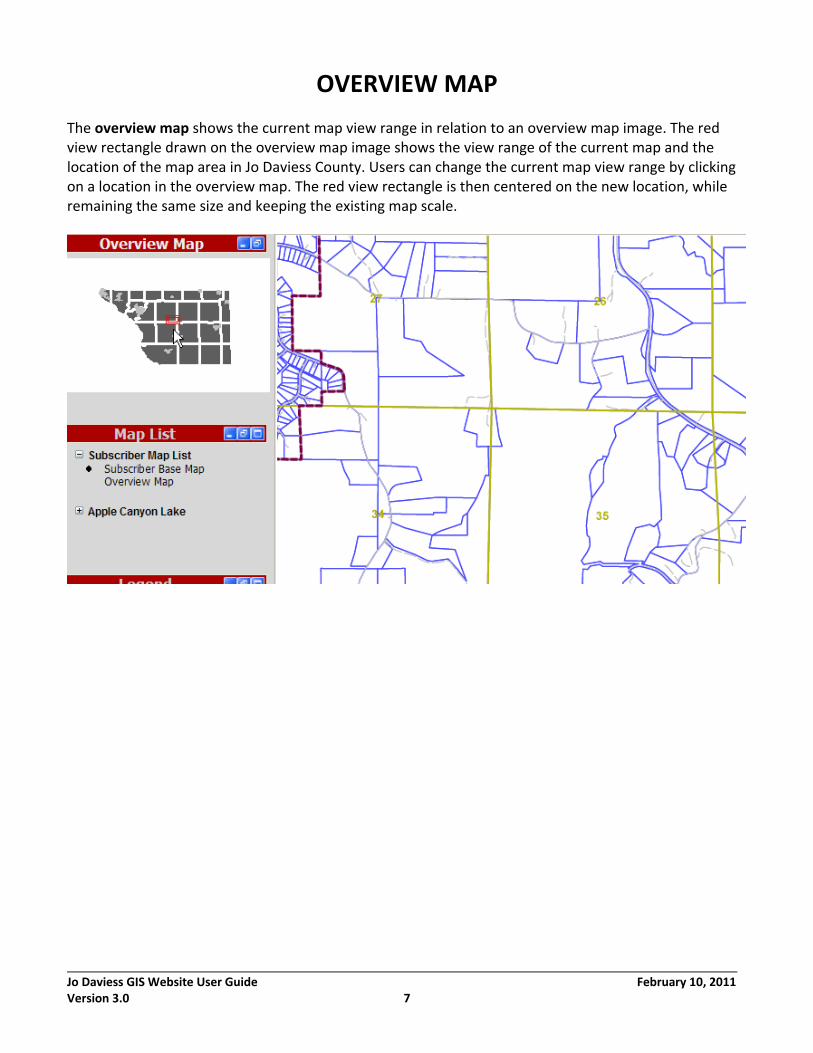
OVERVIEW MAP The overview map shows the current map view range in relation to an overview map image. The red view rectangle drawn on the overview map image shows the view range of the current map and the location of the map area in Jo Daviess County. Users can change the current map view range by clicking on a location in the overview map. The red view rectangle is then centered on the new location, while remaining the same size and keeping the existing map scale.
Jo Daviess GIS Website User Guide February 10, 2011 Version 3.0 8
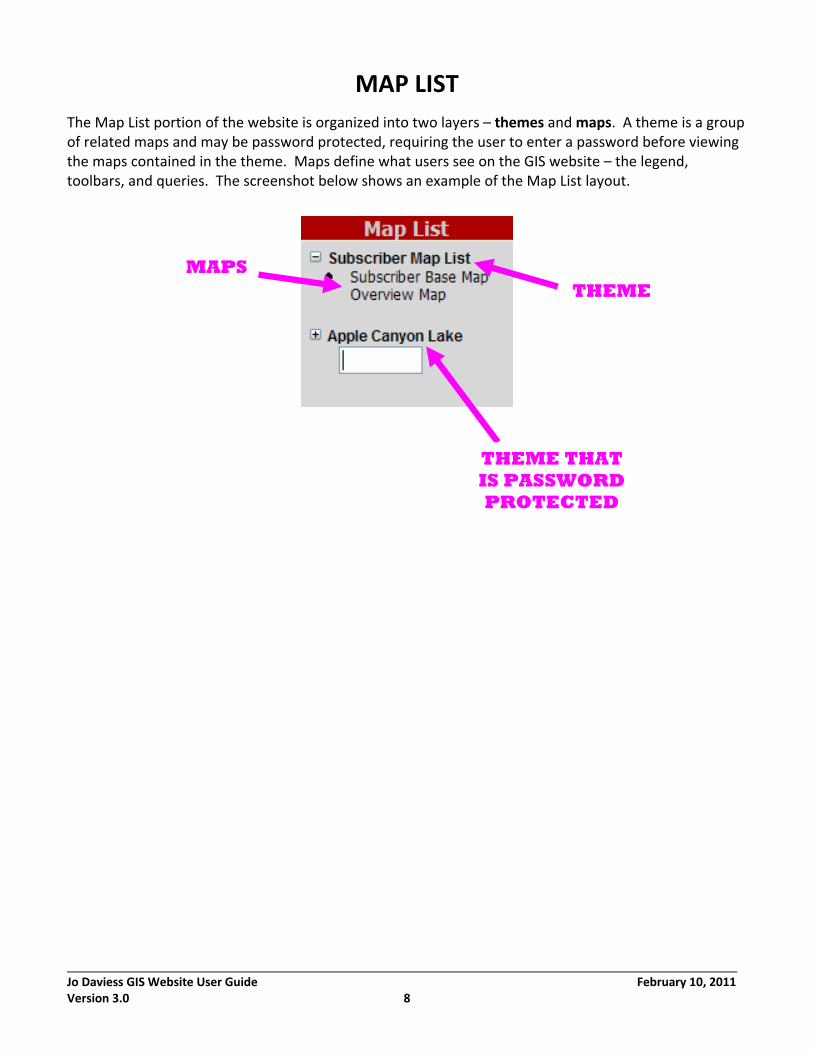
MAP LIST
The Map List portion of the website is organized into two layers – themes and maps. A theme is a group of related maps and may be password protected, requiring the user to enter a password before viewing the maps contained in the theme. Maps define what users see on the GIS website – the legend, toolbars, and queries. The screenshot below shows an example of the Map List layout.
THEME
THEME THAT IS PASSWORD PROTECTED
MAPS
Jo Daviess GIS Website User Guide February 10, 2011 Version 3.0 9
LEGEND
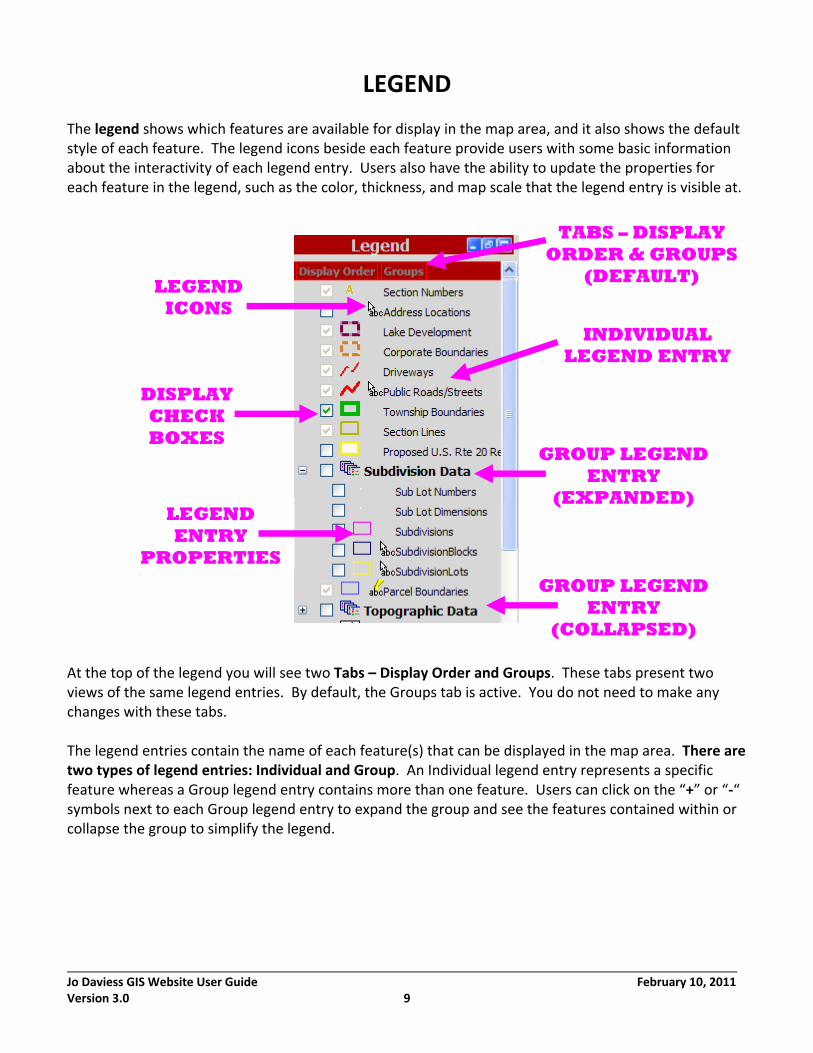
The legend shows which features are available for display in the map area, and it also shows the default style of each feature. The legend icons beside each feature provide users with some basic information about the interactivity of each legend entry. Users also have the ability to update the properties for each feature in the legend, such as the color, thickness, and map scale that the legend entry is visible at.
At the top of the legend you will see two Tabs – Display Order and Groups. These tabs present two views of the same legend entries. By default, the Groups tab is active. You do not need to make any changes with these tabs. The legend entries contain the name of each feature(s) that can be displayed in the map area. There are two types of legend entries: Individual and Group. An Individual legend entry represents a specific feature whereas a Group legend entry contains more than one feature. Users can click on the “+” or “‐“ symbols next to each Group legend entry to expand the group and see the features contained within or collapse the group to simplify the legend.
TABS – DISPLAY ORDER & GROUPS
(DEFAULT)
LEGEND ENTRY
PROPERTIES
INDIVIDUAL LEGEND ENTRY
LEGEND ICONS
GROUP LEGEND ENTRY
(EXPANDED)
GROUP LEGEND ENTRY
(COLLAPSED)
DISPLAY CHECK BOXES
Jo Daviess GIS Website User Guide February 10, 2011 Version 3.0 10
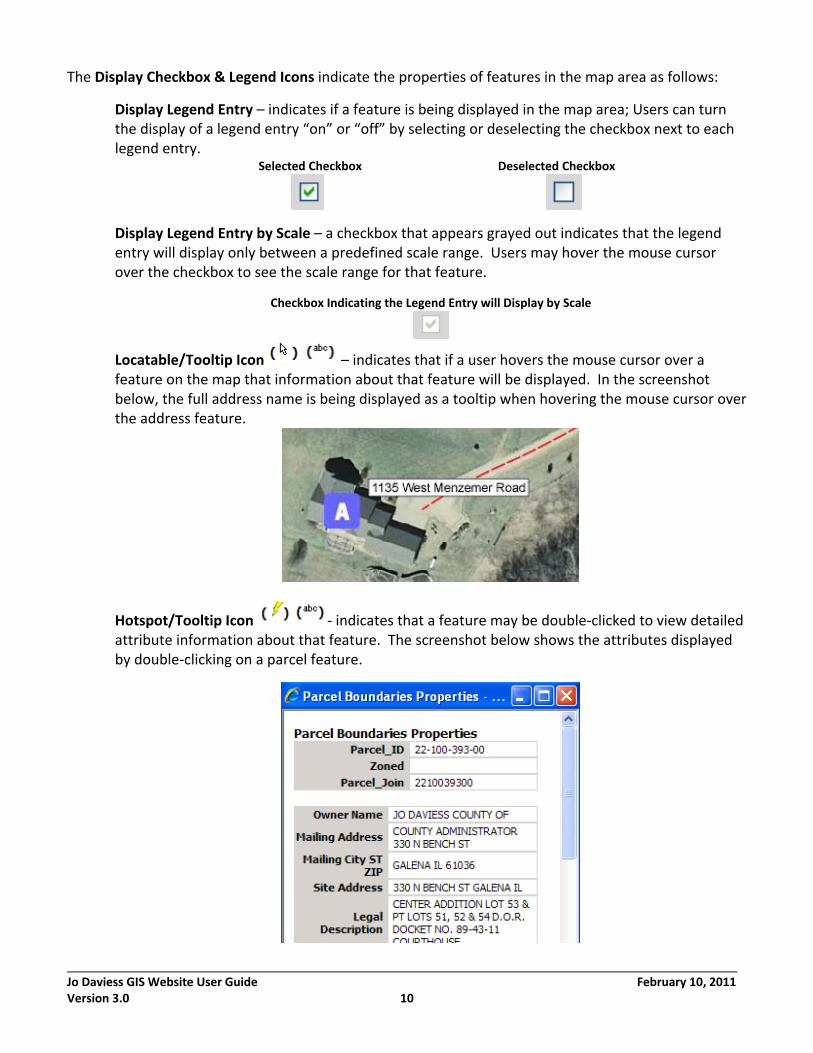
The Display Checkbox & Legend Icons indicate the properties of features in the map area as follows:
Display Legend Entry – indicates if a feature is being displayed in the map area; Users can turn the display of a legend entry “on” or “off” by selecting or deselecting the checkbox next to each legend entry. Selected Checkbox Deselected Checkbox
Display Legend Entry by Scale – a checkbox that appears grayed out indicates that the legend entry will display only between a predefined scale range. Users may hover the mouse cursor over the checkbox to see the scale range for that feature.
Checkbox Indicating the Legend Entry will Display by Scale
Locatable/Tooltip Icon – indicates that if a user hovers the mouse cursor over a feature on the map that information about that feature will be displayed. In the screenshot below, the full address name is being displayed as a tooltip when hovering the mouse cursor over the address feature.
Hotspot/Tooltip Icon ‐ indicates that a feature may be double‐clicked to view detailed attribute information about that feature. The screenshot below shows the attributes displayed by double‐clicking on a parcel feature.
Jo Daviess GIS Website User Guide February 10, 2011 Version 3.0 11
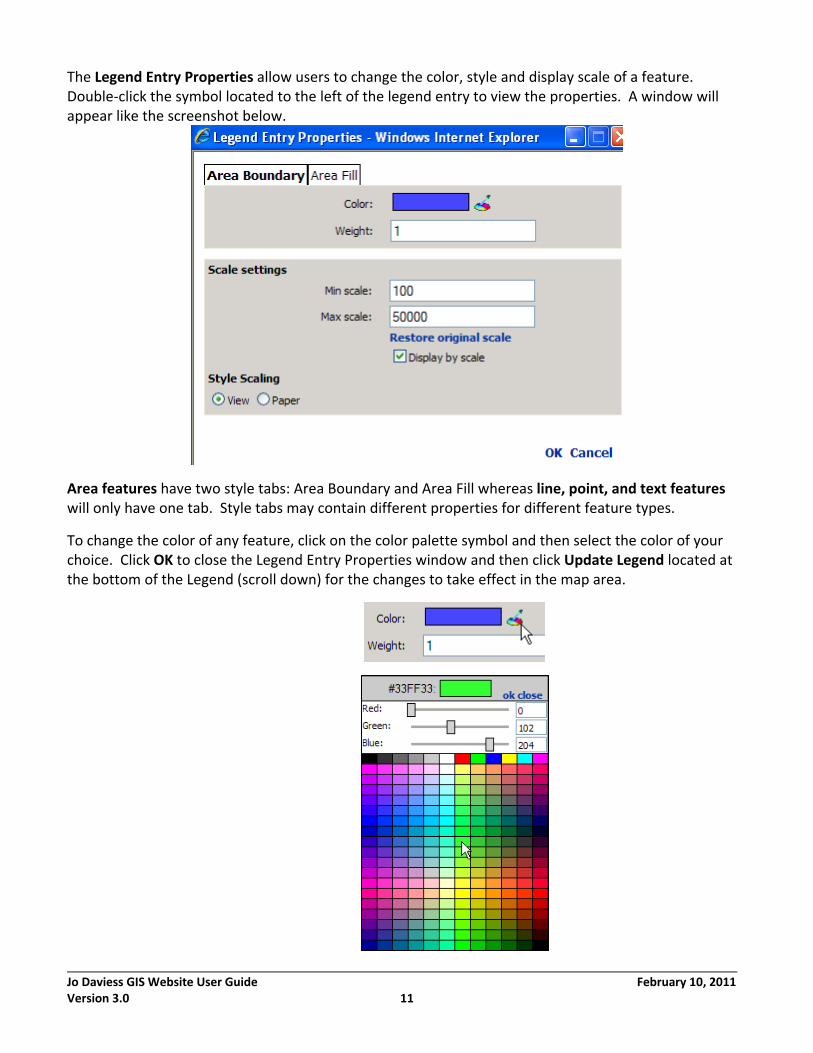
The Legend Entry Properties allow users to change the color, style and display scale of a feature. Double‐click the symbol located to the left of the legend entry to view the properties. A window will appear like the screenshot below.
Area features have two style tabs: Area Boundary and Area Fill whereas line, point, and text features will only have one tab. Style tabs may contain different properties for different feature types.
To change the color of any feature, click on the color palette symbol and then select the color of your choice. Click OK to close the Legend Entry Properties window and then click Update Legend located at the bottom of the Legend (scroll down) for the changes to take effect in the map area.
Jo Daviess GIS Website User Guide February 10, 2011 Version 3.0 12
Changing the weight of a line or area feature will change the thickness of a line or border. For example, changing the weight of a line feature such as the driveway feature from a 1.25 to a 3.00 will increase the thickness. Again, after the desired changes are made, click OK to close the Legend Entry Properties window and then click Update Legend at the bottom of the Legend (scroll down) for the changes to take effect in the map area.
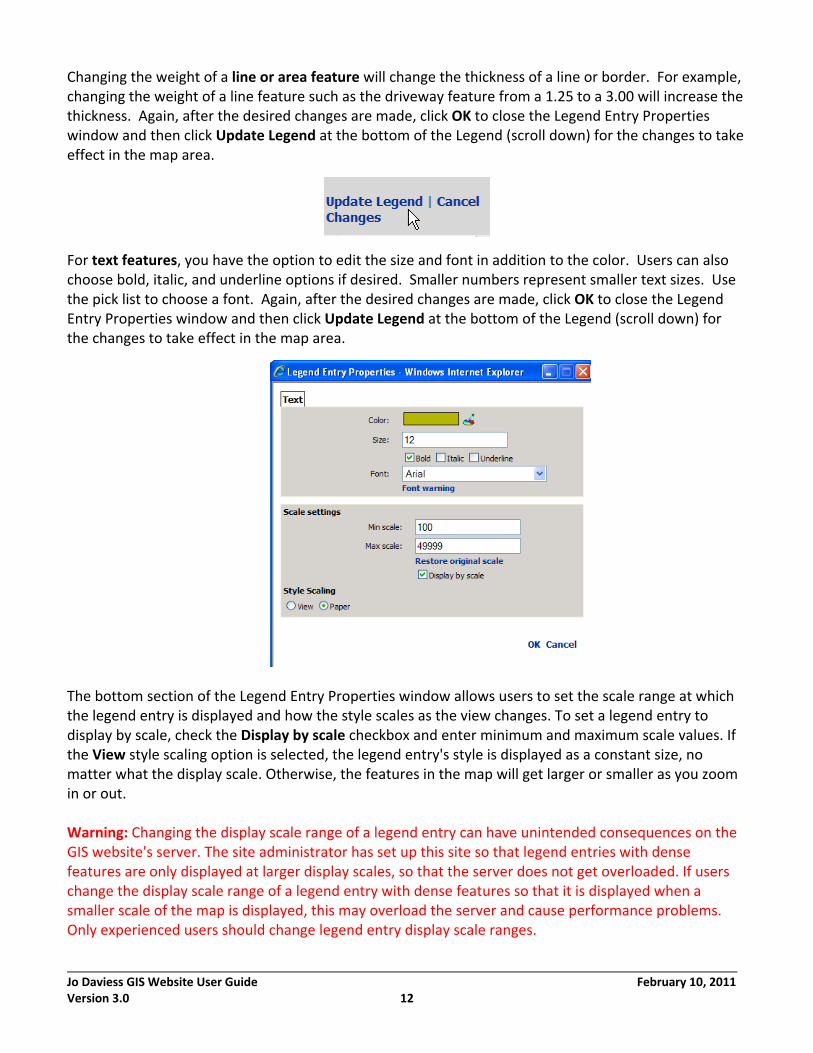
For text features, you have the option to edit the size and font in addition to the color. Users can also choose bold, italic, and underline options if desired. Smaller numbers represent smaller text sizes. Use the pick list to choose a font. Again, after the desired changes are made, click OK to close the Legend Entry Properties window and then click Update Legend at the bottom of the Legend (scroll down) for the changes to take effect in the map area.
The bottom section of the Legend Entry Properties window allows users to set the scale range at which the legend entry is displayed and how the style scales as the view changes. To set a legend entry to display by scale, check the Display by scale checkbox and enter minimum and maximum scale values. If the View style scaling option is selected, the legend entry's style is displayed as a constant size, no matter what the display scale. Otherwise, the features in the map will get larger or smaller as you zoom in or out. Warning: Changing the display scale range of a legend entry can have unintended consequences on the GIS website's server. The site administrator has set up this site so that legend entries with dense features are only displayed at larger display scales, so that the server does not get overloaded. If users change the display scale range of a legend entry with dense features so that it is displayed when a smaller scale of the map is displayed, this may overload the server and cause performance problems. Only experienced users should change legend entry display scale ranges.
Jo Daviess GIS Website User Guide February 10, 2011 Version 3.0 13
TOOLBAR
The Toolbar section contains commands that users can use to navigate the map and perform other functions such as querying, selecting features, measuring, and printing. Listed below is each command in more detail.
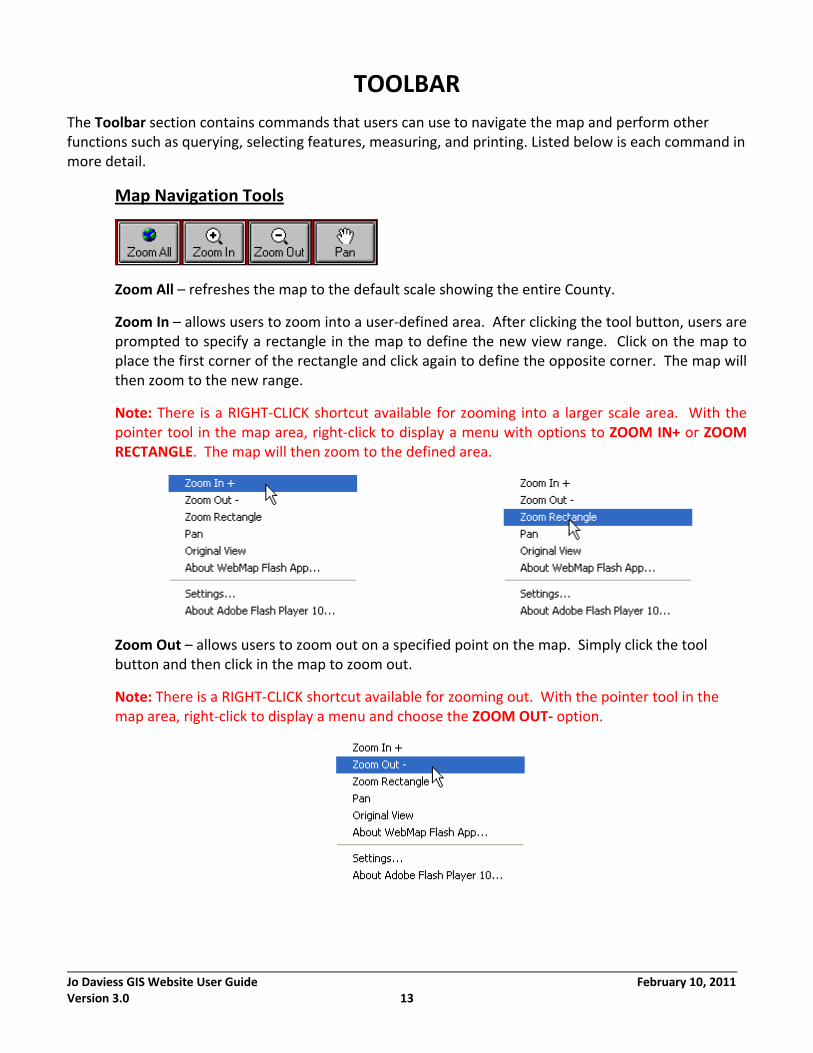
Map Navigation Tools
Zoom All – refreshes the map to the default scale showing the entire County.
Zoom In – allows users to zoom into a user‐defined area. After clicking the tool button, users are prompted to specify a rectangle in the map to define the new view range. Click on the map to place the first corner of the rectangle and click again to define the opposite corner. The map will then zoom to the new range.
Note: There is a RIGHT‐CLICK shortcut available for zooming into a larger scale area. With the pointer tool in the map area, right‐click to display a menu with options to ZOOM IN+ or ZOOM RECTANGLE. The map will then zoom to the defined area.
Zoom Out – allows users to zoom out on a specified point on the map. Simply click the tool button and then click in the map to zoom out.
Note: There is a RIGHT‐CLICK shortcut available for zooming out. With the pointer tool in the map area, right‐click to display a menu and choose the ZOOM OUT‐ option.
Jo Daviess GIS Website User Guide February 10, 2011 Version 3.0 14
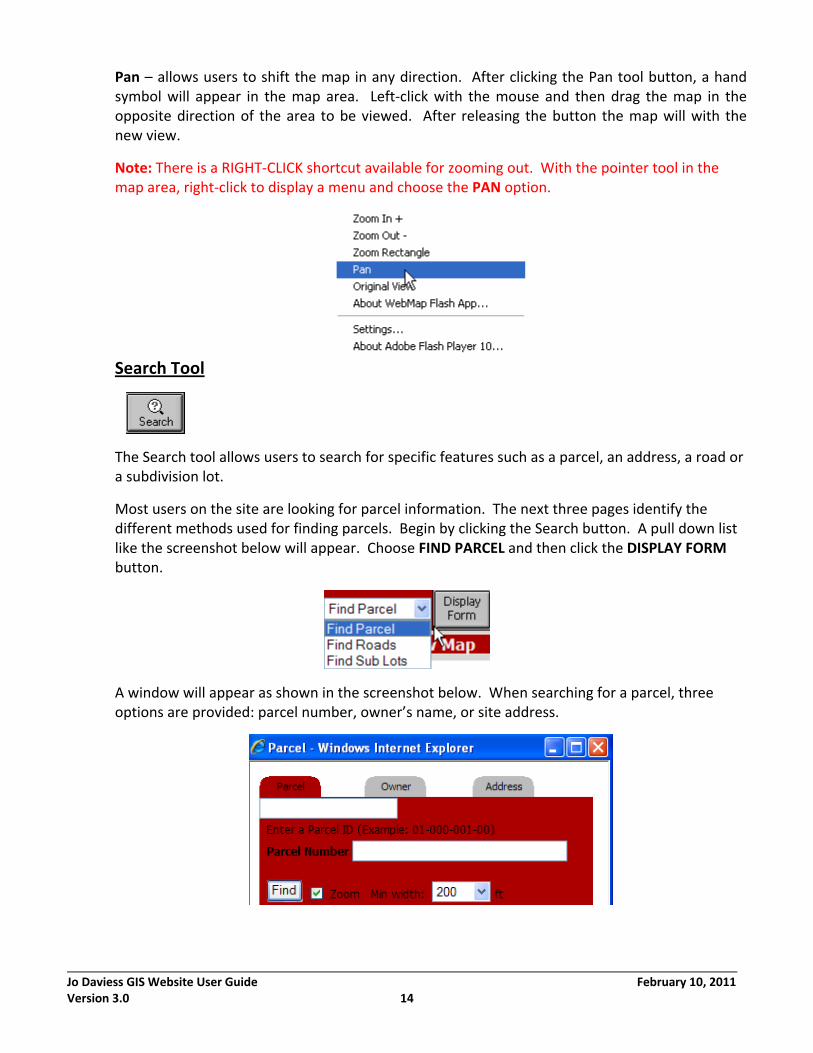
Pan – allows users to shift the map in any direction. After clicking the Pan tool button, a hand symbol will appear in the map area. Left‐click with the mouse and then drag the map in the opposite direction of the area to be viewed. After releasing the button the map will with the new view.
Note: There is a RIGHT‐CLICK shortcut available for zooming out. With the pointer tool in the map area, right‐click to display a menu and choose the PAN option.
Search Tool
The Search tool allows users to search for specific features such as a parcel, an address, a road or a subdivision lot.
Most users on the site are looking for parcel information. The next three pages identify the different methods used for finding parcels. Begin by clicking the Search button. A pull down list like the screenshot below will appear. Choose FIND PARCEL and then click the DISPLAY FORM button.
A window will appear as shown in the screenshot below. When searching for a parcel, three options are provided: parcel number, owner’s name, or site address.
Jo Daviess GIS Website User Guide February 10, 2011 Version 3.0 15
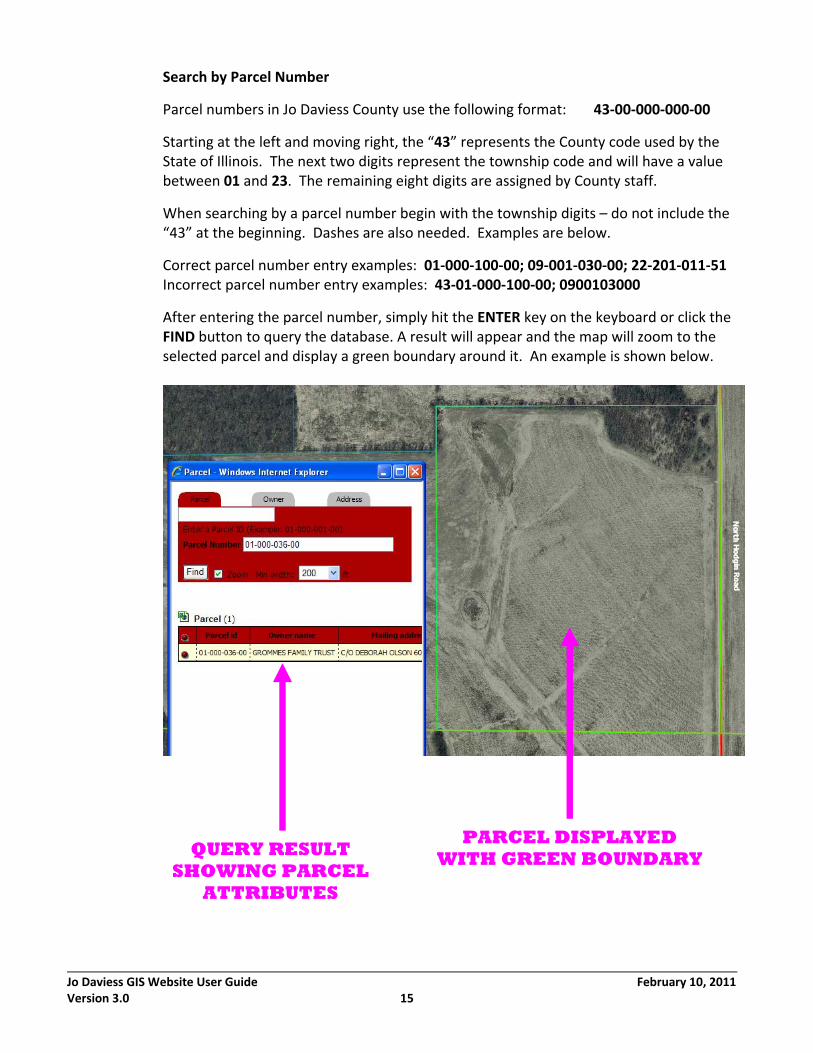
Search by Parcel Number
Parcel numbers in Jo Daviess County use the following format: 43‐00‐000‐000‐00
Starting at the left and moving right, the “43” represents the County code used by the State of Illinois. The next two digits represent the township code and will have a value between 01 and 23. The remaining eight digits are assigned by County staff.
When searching by a parcel number begin with the township digits – do not include the “43” at the beginning. Dashes are also needed. Examples are below.
Correct parcel number entry examples: 01‐000‐100‐00; 09‐001‐030‐00; 22‐201‐011‐51 Incorrect parcel number entry examples: 43‐01‐000‐100‐00; 0900103000
After entering the parcel number, simply hit the ENTER key on the keyboard or click the FIND button to query the database. A result will appear and the map will zoom to the selected parcel and display a green boundary around it. An example is shown below.
QUERY RESULT SHOWING PARCEL
ATTRIBUTES
PARCEL DISPLAYED WITH GREEN BOUNDARY
Jo Daviess GIS Website User Guide February 10, 2011 Version 3.0 16
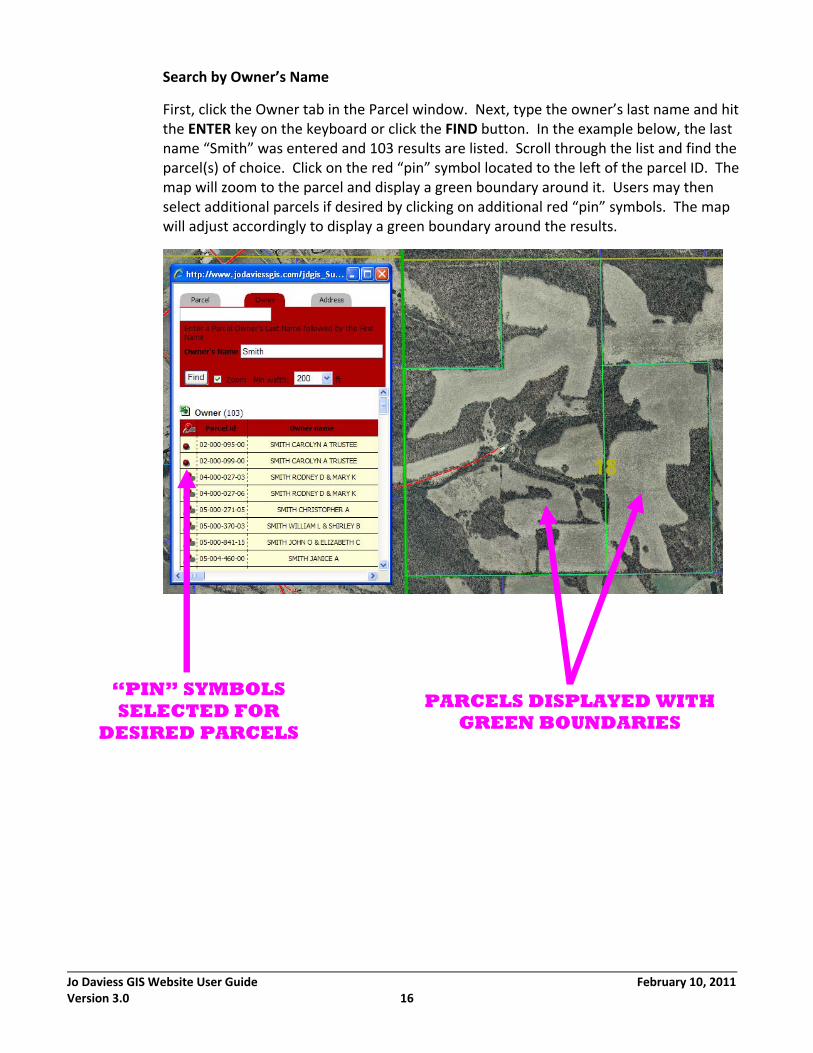
Search by Owner’s Name
First, click the Owner tab in the Parcel window. Next, type the owner’s last name and hit the ENTER key on the keyboard or click the FIND button. In the example below, the last name “Smith” was entered and 103 results are listed. Scroll through the list and find the parcel(s) of choice. Click on the red “pin” symbol located to the left of the parcel ID. The map will zoom to the parcel and display a green boundary around it. Users may then select additional parcels if desired by clicking on additional red “pin” symbols. The map will adjust accordingly to display a green boundary around the results.
“PIN” SYMBOLS SELECTED FOR
DESIRED PARCELS
PARCELS DISPLAYED WITH GREEN BOUNDARIES
Jo Daviess GIS Website User Guide February 10, 2011 Version 3.0 17
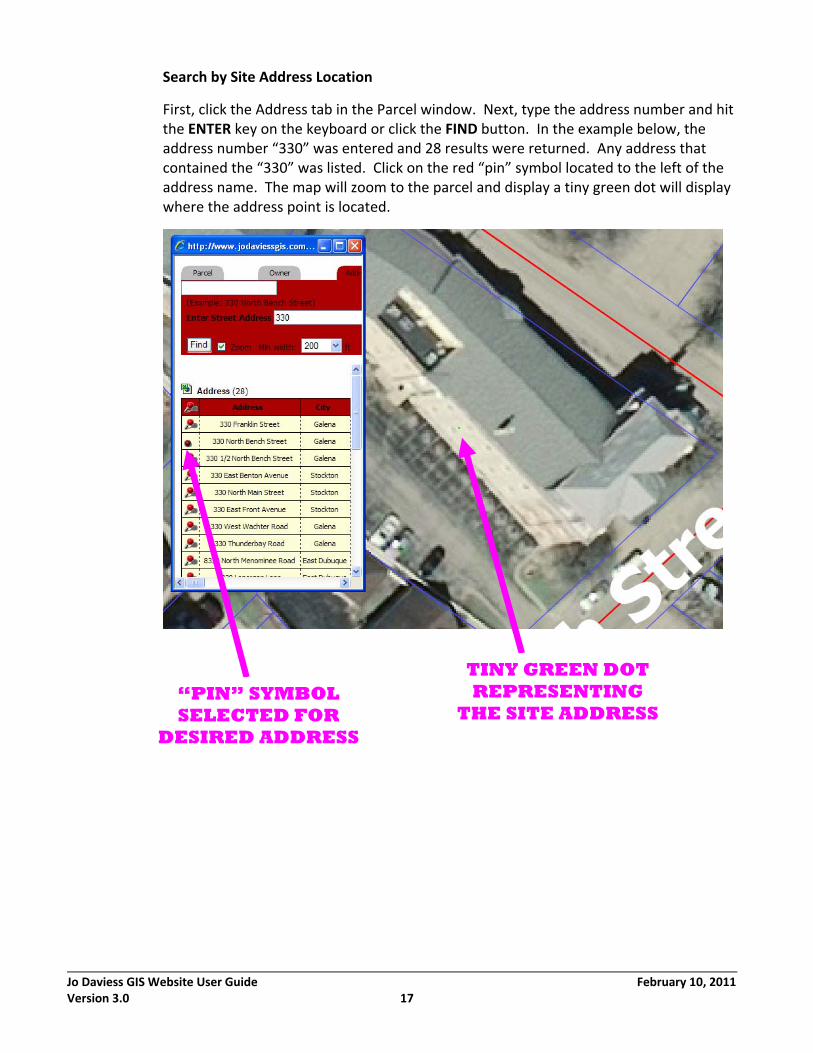
Search by Site Address Location
First, click the Address tab in the Parcel window. Next, type the address number and hit the ENTER key on the keyboard or click the FIND button. In the example below, the address number “330” was entered and 28 results were returned. Any address that contained the “330” was listed. Click on the red “pin” symbol located to the left of the address name. The map will zoom to the parcel and display a tiny green dot will display where the address point is located.
“PIN” SYMBOL SELECTED FOR
DESIRED ADDRESS
TINY GREEN DOT REPRESENTING
THE SITE ADDRESS
Jo Daviess GIS Website User Guide February 10, 2011 Version 3.0 18
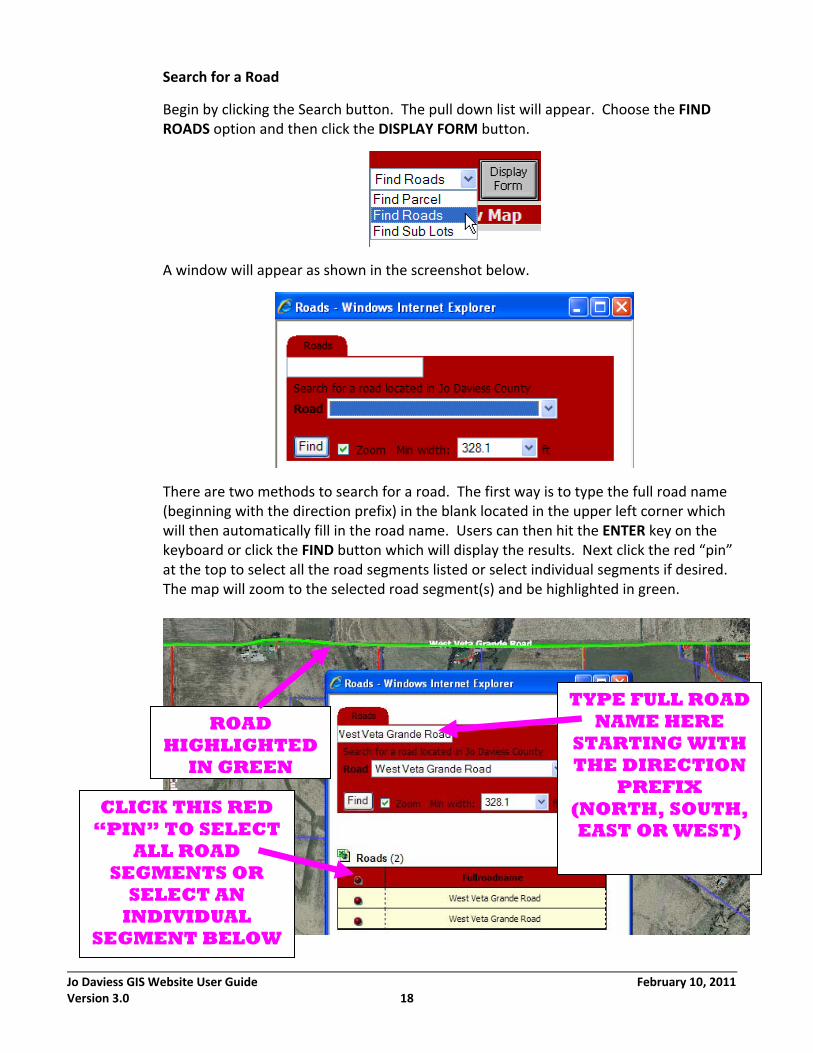
Search for a Road
Begin by clicking the Search button. The pull down list will appear. Choose the FIND ROADS option and then click the DISPLAY FORM button.
A window will appear as shown in the screenshot below.
There are two methods to search for a road. The first way is to type the full road name (beginning with the direction prefix) in the blank located in the upper left corner which will then automatically fill in the road name. Users can then hit the ENTER key on the keyboard or click the FIND button which will display the results. Next click the red “pin” at the top to select all the road segments listed or select individual segments if desired. The map will zoom to the selected road segment(s) and be highlighted in green.
ROAD HIGHLIGHTED
IN GREEN
CLICK THIS RED “PIN” TO SELECT
ALL ROAD SEGMENTS OR
SELECT AN INDIVIDUAL
SEGMENT BELOW
TYPE FULL ROAD NAME HERE
STARTING WITH THE DIRECTION
PREFIX (NORTH, SOUTH, EAST OR WEST)
Jo Daviess GIS Website User Guide February 10, 2011 Version 3.0 19
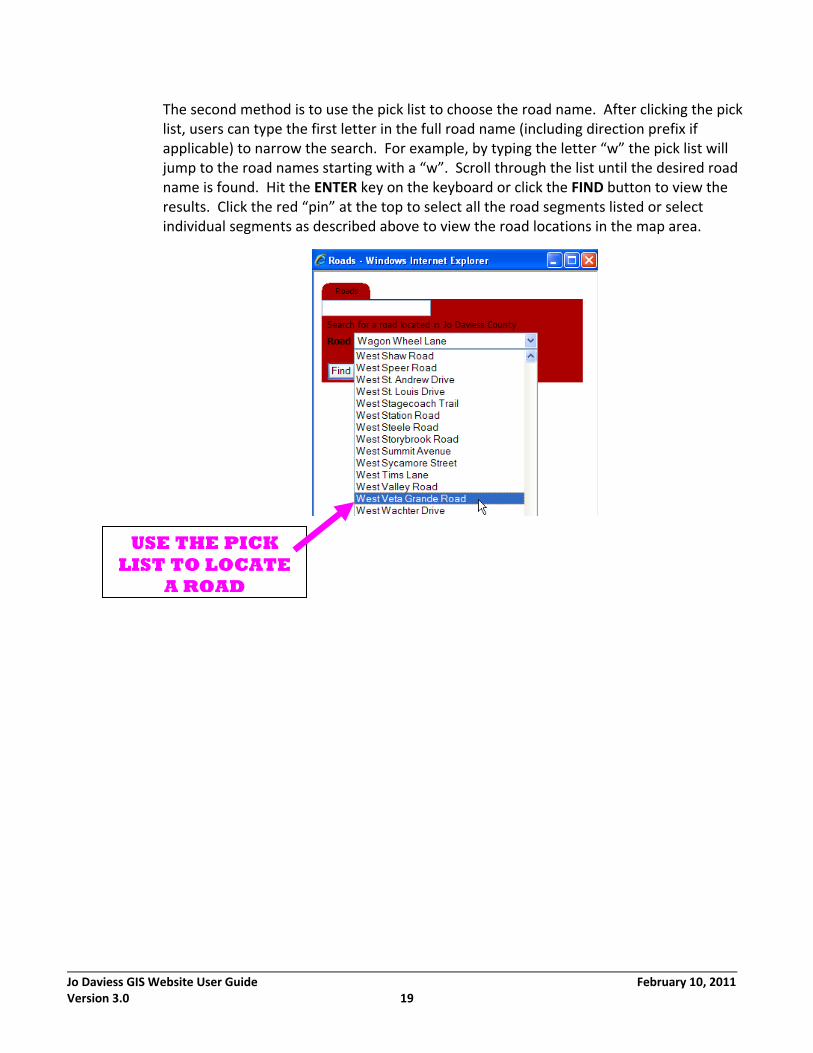
The second method is to use the pick list to choose the road name. After clicking the pick list, users can type the first letter in the full road name (including direction prefix if applicable) to narrow the search. For example, by typing the letter “w” the pick list will jump to the road names starting with a “w”. Scroll through the list until the desired road name is found. Hit the ENTER key on the keyboard or click the FIND button to view the results. Click the red “pin” at the top to select all the road segments listed or select individual segments as described above to view the road locations in the map area.
USE THE PICK LIST TO LOCATE
A ROAD
Jo Daviess GIS Website User Guide February 10, 2011 Version 3.0 20
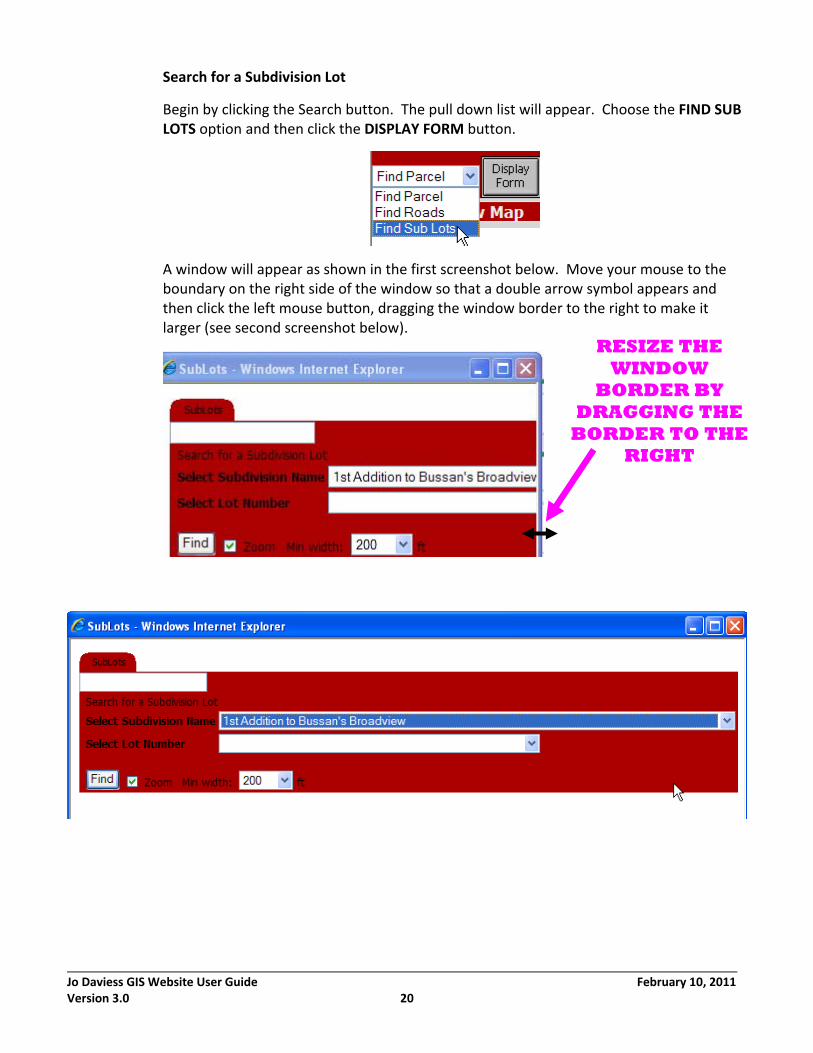
Search for a Subdivision Lot
Begin by clicking the Search button. The pull down list will appear. Choose the FIND SUB LOTS option and then click the DISPLAY FORM button.
A window will appear as shown in the first screenshot below. Move your mouse to the boundary on the right side of the window so that a double arrow symbol appears and then click the left mouse button, dragging the window border to the right to make it larger (see second screenshot below).
RESIZE THE WINDOW
BORDER BY DRAGGING THE
BORDER TO THE RIGHT
Jo Daviess GIS Website User Guide February 10, 2011 Version 3.0 21
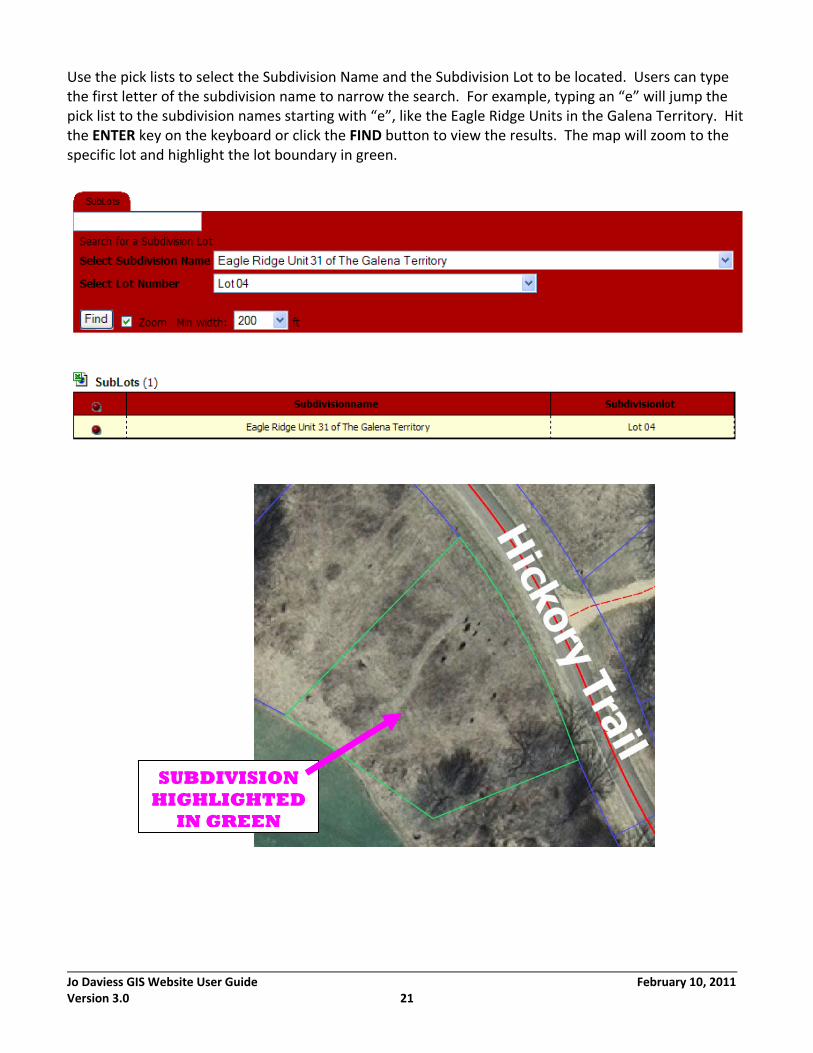
Use the pick lists to select the Subdivision Name and the Subdivision Lot to be located. Users can type the first letter of the subdivision name to narrow the search. For example, typing an “e” will jump the pick list to the subdivision names starting with “e”, like the Eagle Ridge Units in the Galena Territory. Hit the ENTER key on the keyboard or click the FIND button to view the results. The map will zoom to the specific lot and highlight the lot boundary in green.
SUBDIVISION HIGHLIGHTED
IN GREEN
Jo Daviess GIS Website User Guide February 10, 2011 Version 3.0 22
Selection Tools
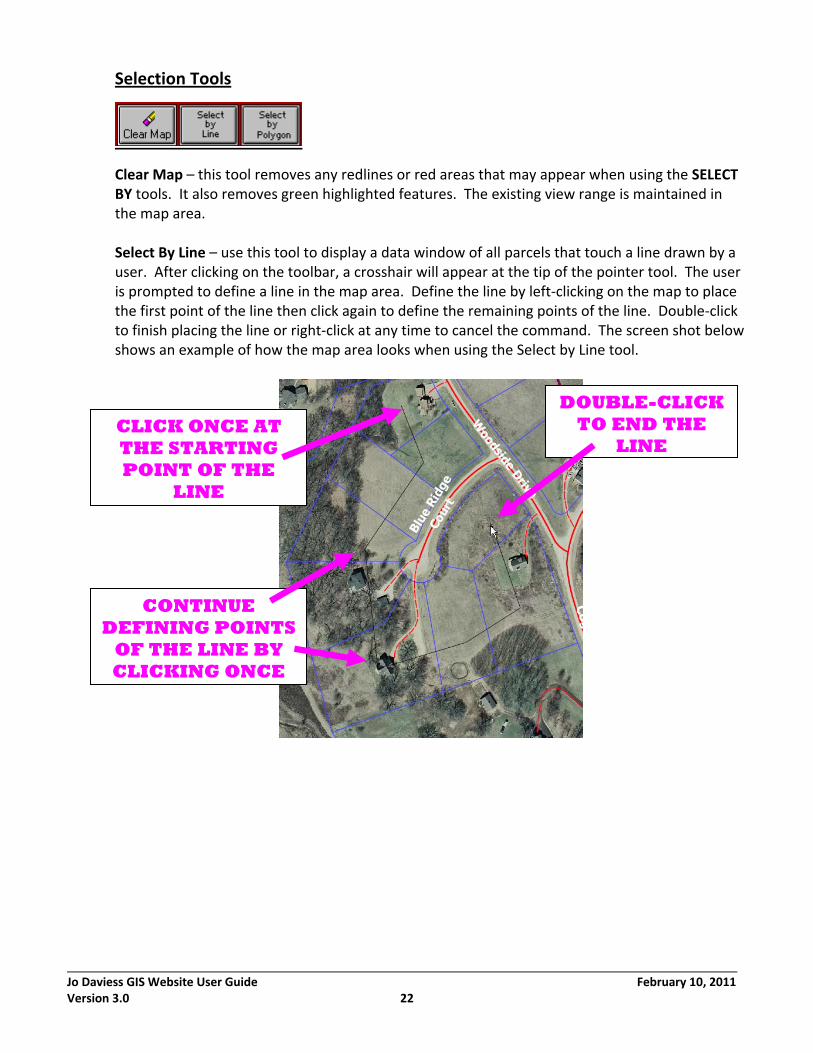
Clear Map – this tool removes any redlines or red areas that may appear when using the SELECT BY tools. It also removes green highlighted features. The existing view range is maintained in the map area. Select By Line – use this tool to display a data window of all parcels that touch a line drawn by a user. After clicking on the toolbar, a crosshair will appear at the tip of the pointer tool. The user is prompted to define a line in the map area. Define the line by left‐clicking on the map to place the first point of the line then click again to define the remaining points of the line. Double‐click to finish placing the line or right‐click at any time to cancel the command. The screen shot below shows an example of how the map area looks when using the Select by Line tool.
CLICK ONCE AT THE STARTING POINT OF THE
LINE
DOUBLE-CLICK TO END THE
LINE
CONTINUE DEFINING POINTS
OF THE LINE BY CLICKING ONCE
Jo Daviess GIS Website User Guide February 10, 2011 Version 3.0 23
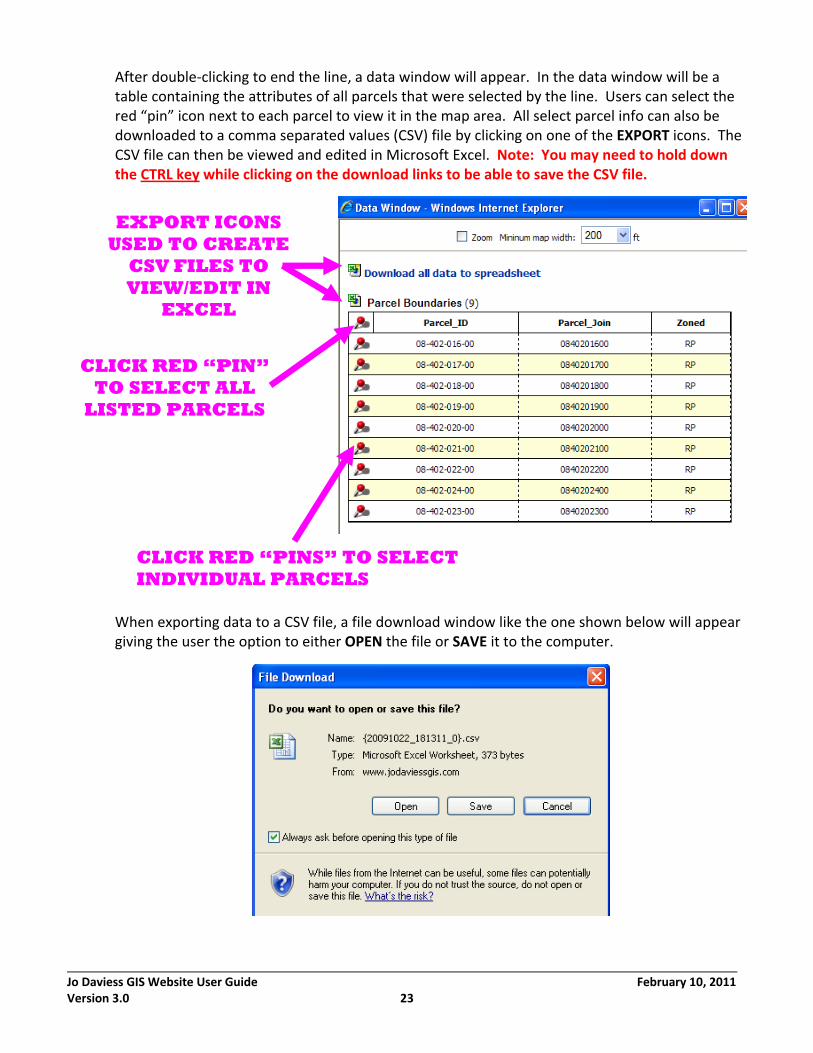
After double‐clicking to end the line, a data window will appear. In the data window will be a table containing the attributes of all parcels that were selected by the line. Users can select the red “pin” icon next to each parcel to view it in the map area. All select parcel info can also be downloaded to a comma separated values (CSV) file by clicking on one of the EXPORT icons. The CSV file can then be viewed and edited in Microsoft Excel. Note: You may need to hold down the CTRL key while clicking on the download links to be able to save the CSV file.
When exporting data to a CSV file, a file download window like the one shown below will appear giving the user the option to either OPEN the file or SAVE it to the computer.
EXPORT ICONS USED TO CREATE
CSV FILES TO VIEW/EDIT IN
EXCEL
CLICK RED “PINS” TO SELECT INDIVIDUAL PARCELS
CLICK RED “PIN” TO SELECT ALL
LISTED PARCELS
Jo Daviess GIS Website User Guide February 10, 2011 Version 3.0 24
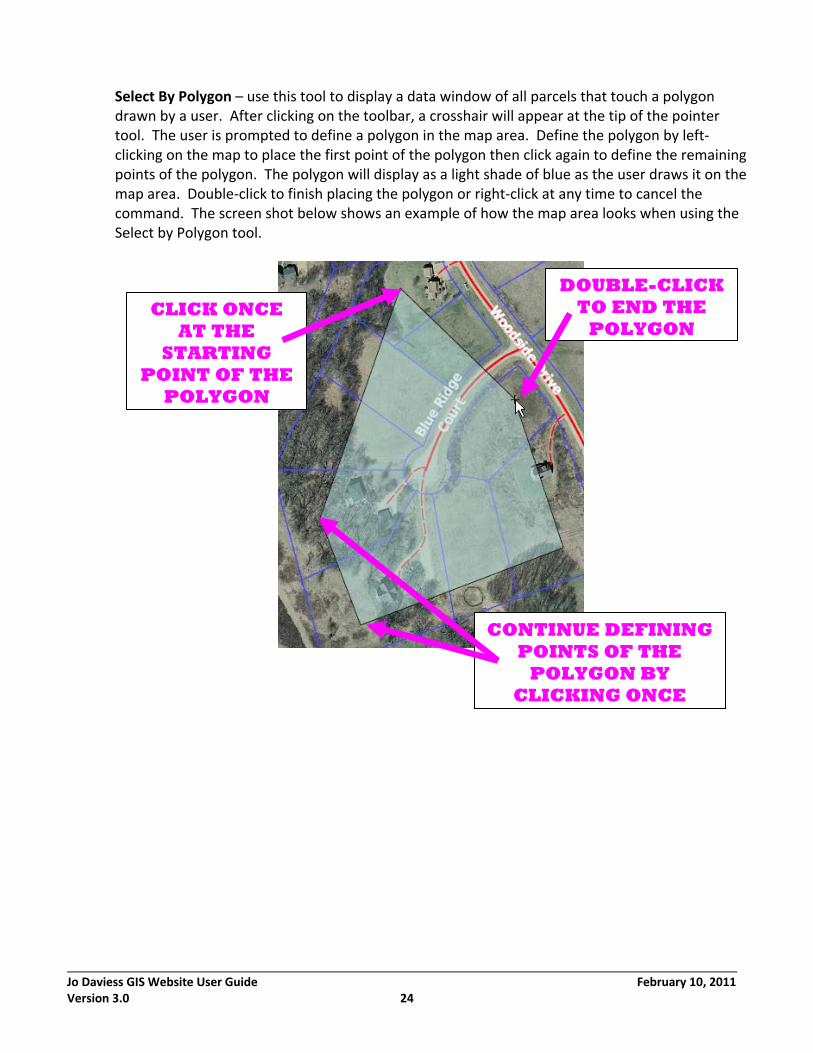
Select By Polygon – use this tool to display a data window of all parcels that touch a polygon drawn by a user. After clicking on the toolbar, a crosshair will appear at the tip of the pointer tool. The user is prompted to define a polygon in the map area. Define the polygon by left‐clicking on the map to place the first point of the polygon then click again to define the remaining points of the polygon. The polygon will display as a light shade of blue as the user draws it on the map area. Double‐click to finish placing the polygon or right‐click at any time to cancel the command. The screen shot below shows an example of how the map area looks when using the Select by Polygon tool.
CLICK ONCE AT THE
STARTING POINT OF THE
POLYGON
DOUBLE-CLICK TO END THE
POLYGON
CONTINUE DEFINING POINTS OF THE
POLYGON BY CLICKING ONCE

Jo Daviess GIS Website User Guide February 10, 2011 Version 3.0 25
After double‐clicking to end the polygon, a data window will appear. In the data window will be a table containing the attributes of all parcels that were selected by the polygon. Users can select the red “pin” icon next to each parcel to view it in the map area. All select parcel info can also be downloaded to a comma separated values (CSV) file by clicking on one of the EXPORT icons. The CSV file can then be viewed and edited in Microsoft Excel. Note: You may need to hold down the CTRL key while clicking on the download links to be able to save the CSV file.
When exporting data to a CSV file, a file download window like the one shown below will appear giving the user the option to either OPEN the file or SAVE it to the computer.
EXPORT ICONS USED TO CREATE
CSV FILES TO VIEW/EDIT IN
EXCEL
CLICK RED “PINS” TO SELECT INDIVIDUAL PARCELS
CLICK RED “PIN” TO SELECT ALL
LISTED PARCELS
Jo Daviess GIS Website User Guide February 10, 2011 Version 3.0 26
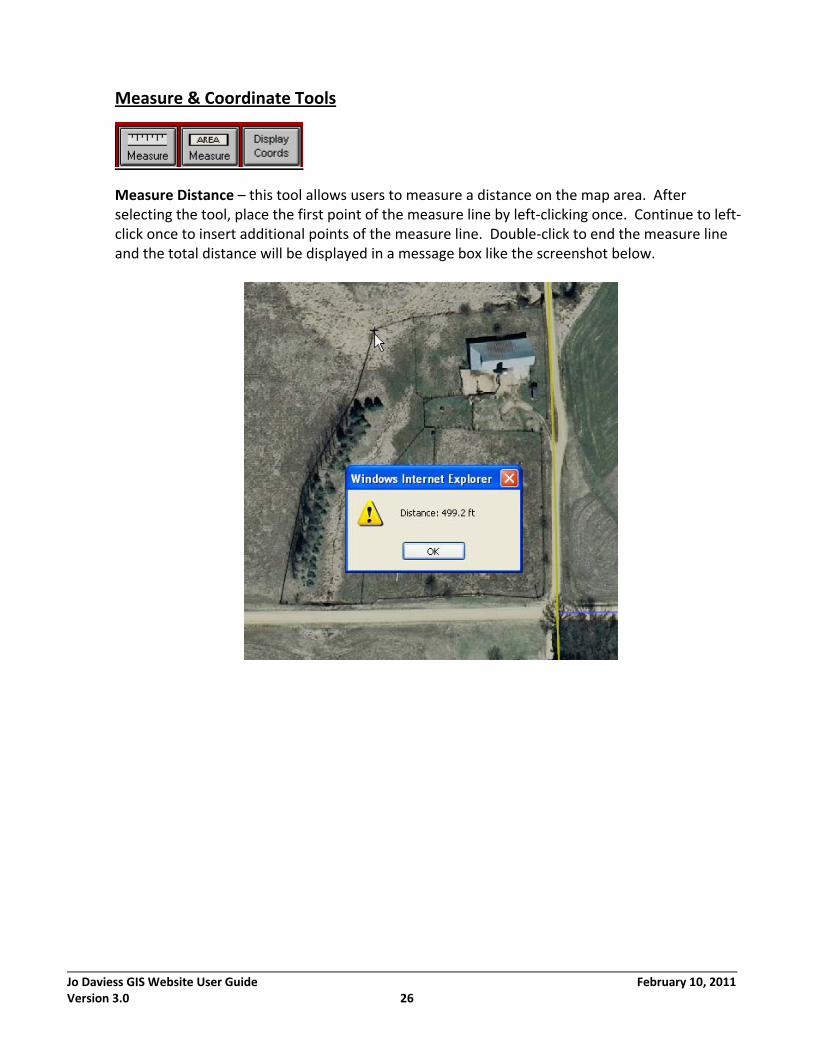
Measure & Coordinate Tools
Measure Distance – this tool allows users to measure a distance on the map area. After selecting the tool, place the first point of the measure line by left‐clicking once. Continue to left‐click once to insert additional points of the measure line. Double‐click to end the measure line and the total distance will be displayed in a message box like the screenshot below.
Jo Daviess GIS Website User Guide February 10, 2011 Version 3.0 27
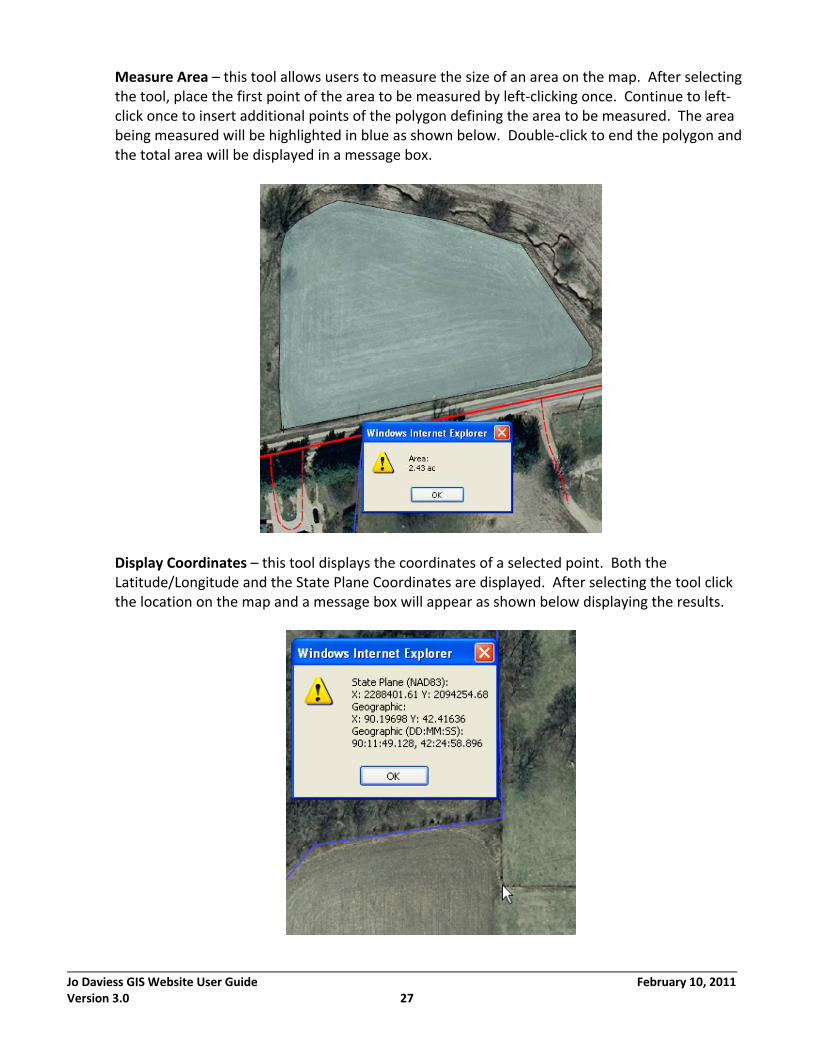
Measure Area – this tool allows users to measure the size of an area on the map. After selecting the tool, place the first point of the area to be measured by left‐clicking once. Continue to left‐click once to insert additional points of the polygon defining the area to be measured. The area being measured will be highlighted in blue as shown below. Double‐click to end the polygon and the total area will be displayed in a message box.
Display Coordinates – this tool displays the coordinates of a selected point. Both the Latitude/Longitude and the State Plane Coordinates are displayed. After selecting the tool click the location on the map and a message box will appear as shown below displaying the results.
Jo Daviess GIS Website User Guide February 10, 2011 Version 3.0 28
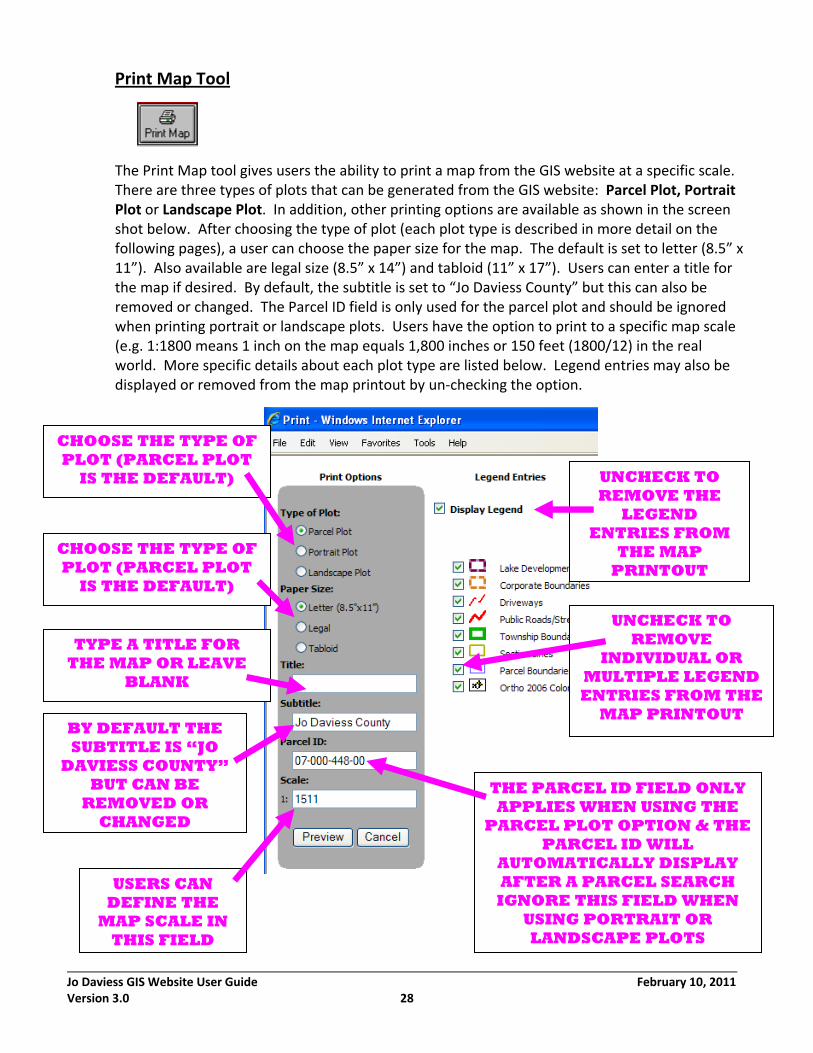
Print Map Tool
The Print Map tool gives users the ability to print a map from the GIS website at a specific scale. There are three types of plots that can be generated from the GIS website: Parcel Plot, Portrait Plot or Landscape Plot. In addition, other printing options are available as shown in the screen shot below. After choosing the type of plot (each plot type is described in more detail on the following pages), a user can choose the paper size for the map. The default is set to letter (8.5” x 11”). Also available are legal size (8.5” x 14”) and tabloid (11” x 17”). Users can enter a title for the map if desired. By default, the subtitle is set to “Jo Daviess County” but this can also be removed or changed. The Parcel ID field is only used for the parcel plot and should be ignored when printing portrait or landscape plots. Users have the option to print to a specific map scale (e.g. 1:1800 means 1 inch on the map equals 1,800 inches or 150 feet (1800/12) in the real world. More specific details about each plot type are listed below. Legend entries may also be displayed or removed from the map printout by un‐checking the option.
UNCHECK TO REMOVE
INDIVIDUAL OR MULTIPLE LEGEND ENTRIES FROM THE
MAP PRINTOUT
UNCHECK TO REMOVE THE
LEGEND ENTRIES FROM
THE MAP PRINTOUT
THE PARCEL ID FIELD ONLY APPLIES WHEN USING THE
PARCEL PLOT OPTION & THE PARCEL ID WILL
AUTOMATICALLY DISPLAY AFTER A PARCEL SEARCH IGNORE THIS FIELD WHEN
USING PORTRAIT OR LANDSCAPE PLOTS
USERS CAN DEFINE THE
MAP SCALE IN THIS FIELD
BY DEFAULT THE SUBTITLE IS “JO
DAVIESS COUNTY” BUT CAN BE
REMOVED OR CHANGED
CHOOSE THE TYPE OF PLOT (PARCEL PLOT
IS THE DEFAULT)
CHOOSE THE TYPE OF PLOT (PARCEL PLOT
IS THE DEFAULT)
TYPE A TITLE FOR THE MAP OR LEAVE
BLANK
Jo Daviess GIS Website User Guide February 10, 2011 Version 3.0 29
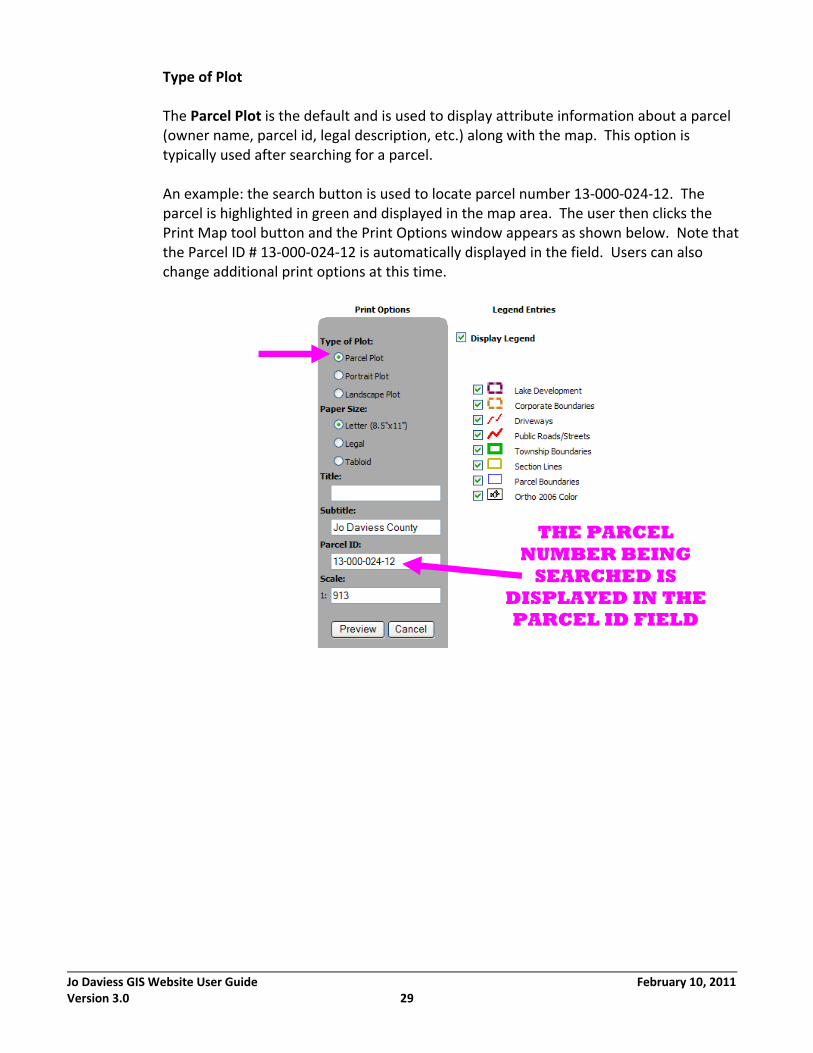
Type of Plot
The Parcel Plot is the default and is used to display attribute information about a parcel (owner name, parcel id, legal description, etc.) along with the map. This option is typically used after searching for a parcel. An example: the search button is used to locate parcel number 13‐000‐024‐12. The parcel is highlighted in green and displayed in the map area. The user then clicks the Print Map tool button and the Print Options window appears as shown below. Note that the Parcel ID # 13‐000‐024‐12 is automatically displayed in the field. Users can also change additional print options at this time.
THE PARCEL NUMBER BEING
SEARCHED IS DISPLAYED IN THE PARCEL ID FIELD
Jo Daviess GIS Website User Guide February 10, 2011 Version 3.0 30
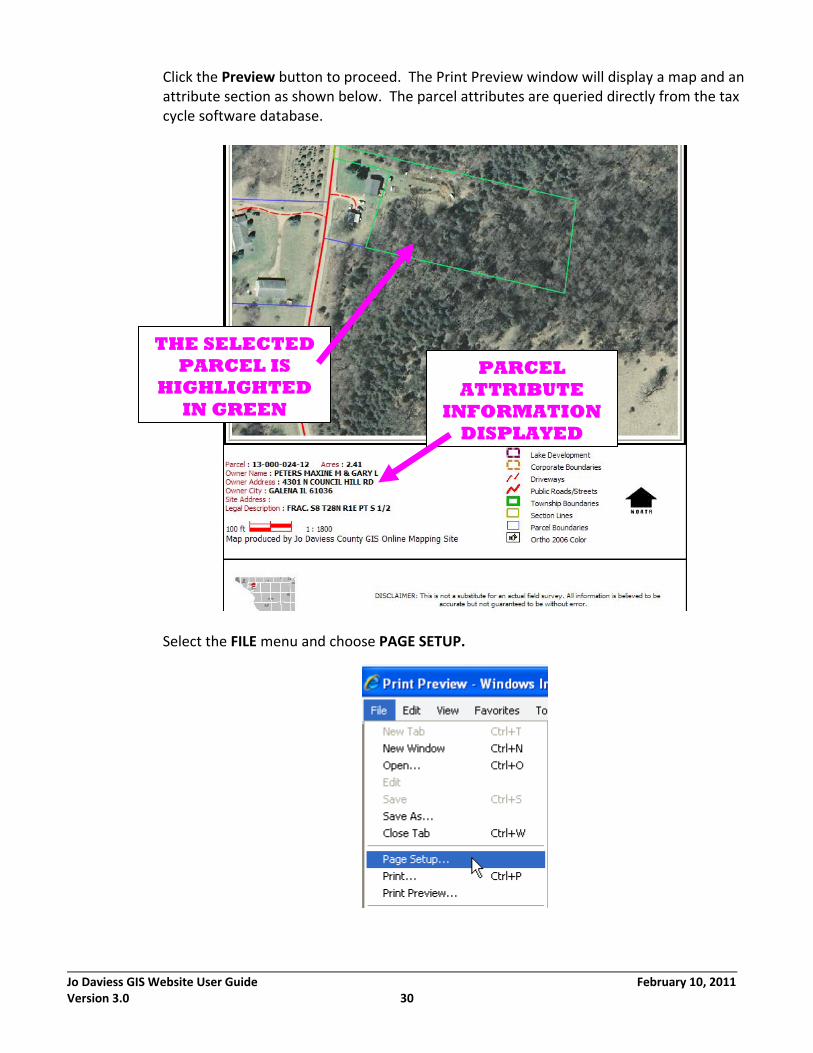
Click the Preview button to proceed. The Print Preview window will display a map and an attribute section as shown below. The parcel attributes are queried directly from the tax cycle software database.
Select the FILE menu and choose PAGE SETUP.
THE SELECTED PARCEL IS
HIGHLIGHTED IN GREEN
PARCEL ATTRIBUTE
INFORMATION DISPLAYED
Jo Daviess GIS Website User Guide February 10, 2011 Version 3.0 31
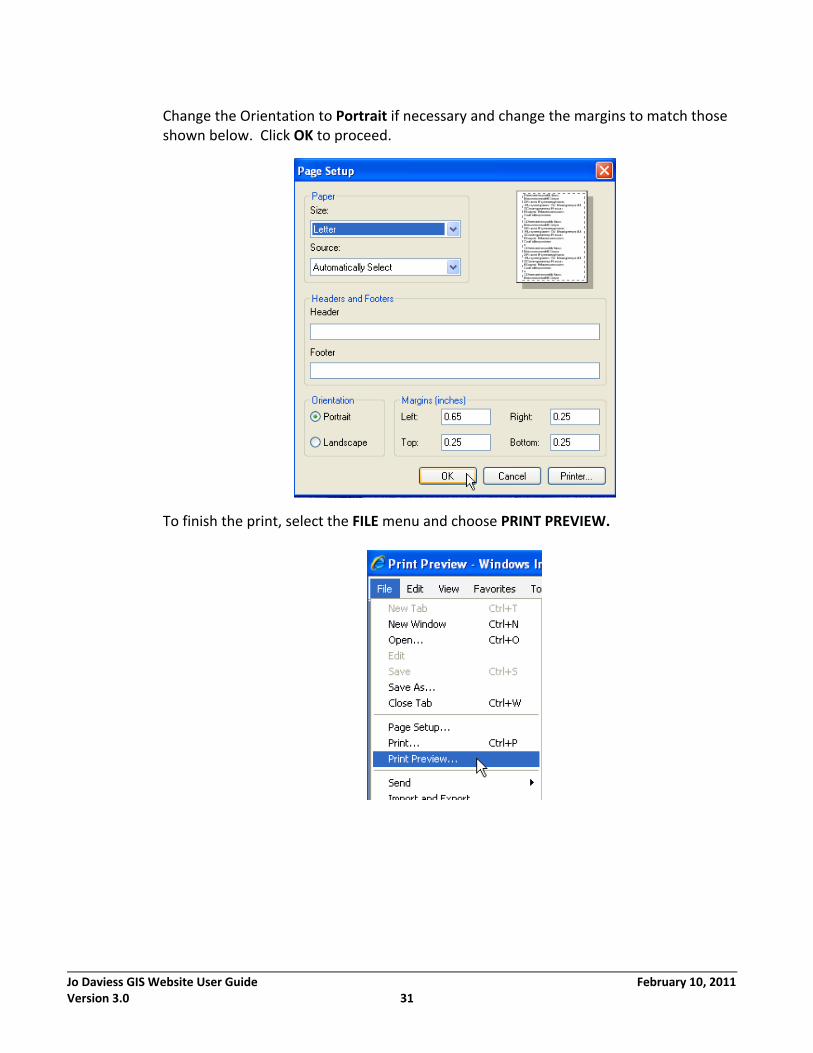
Change the Orientation to Portrait if necessary and change the margins to match those shown below. Click OK to proceed.
To finish the print, select the FILE menu and choose PRINT PREVIEW.
Jo Daviess GIS Website User Guide February 10, 2011 Version 3.0 32
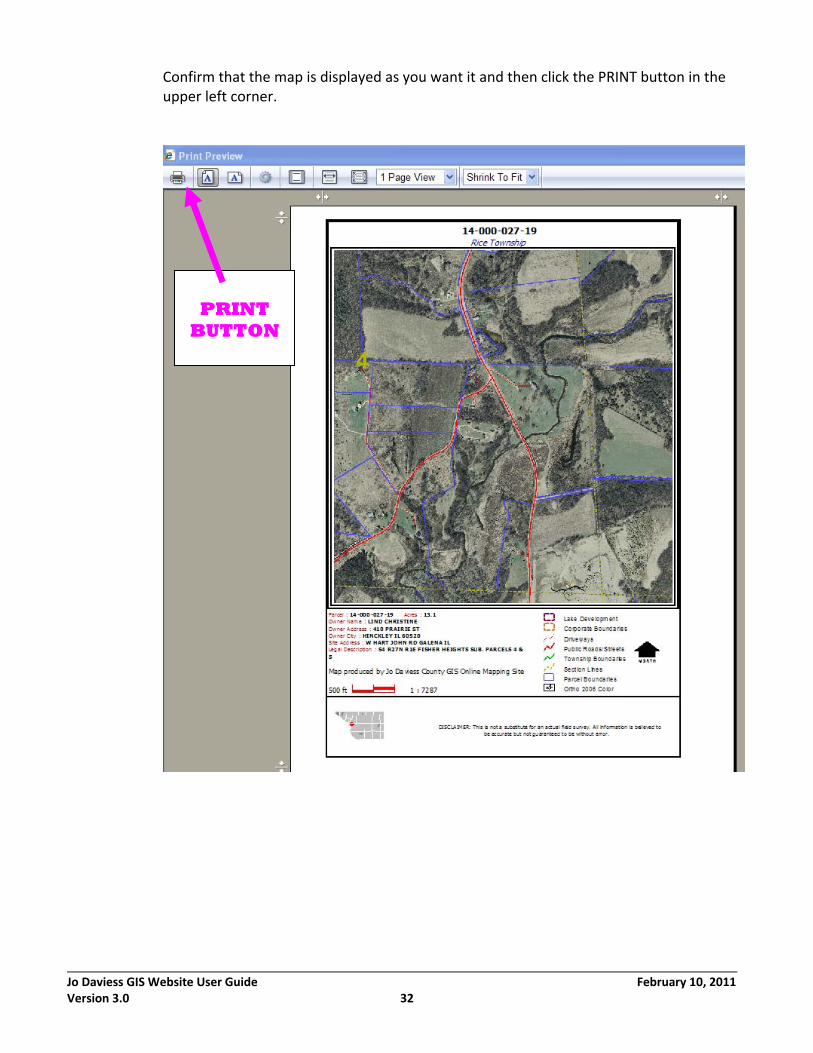
Confirm that the map is displayed as you want it and then click the PRINT button in the upper left corner.
BUTTON
Jo Daviess GIS Website User Guide February 10, 2011 Version 3.0 33
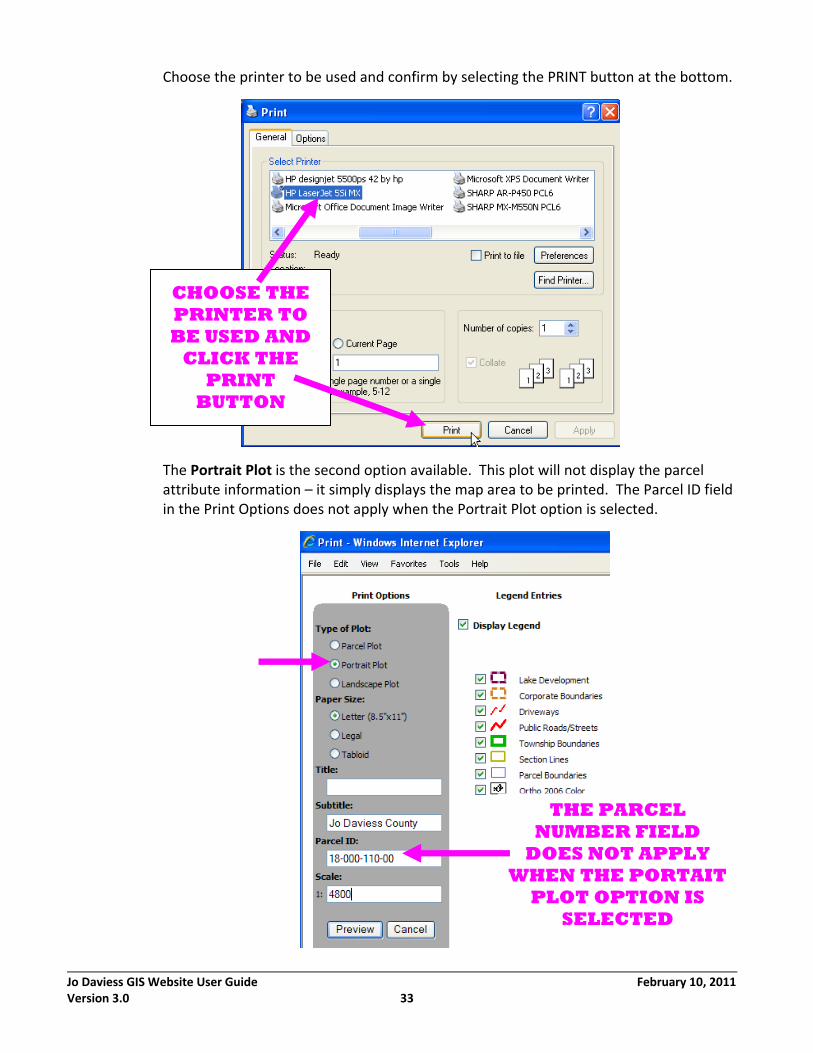
Choose the printer to be used and confirm by selecting the PRINT button at the bottom.
The Portrait Plot is the second option available. This plot will not display the parcel attribute information – it simply displays the map area to be printed. The Parcel ID field in the Print Options does not apply when the Portrait Plot option is selected.
CHOOSE THE PRINTER TO BE USED AND
CLICK THE PRINT
BUTTON
THE PARCEL NUMBER FIELD
DOES NOT APPLY WHEN THE PORTAIT
PLOT OPTION IS SELECTED
Jo Daviess GIS Website User Guide February 10, 2011 Version 3.0 34
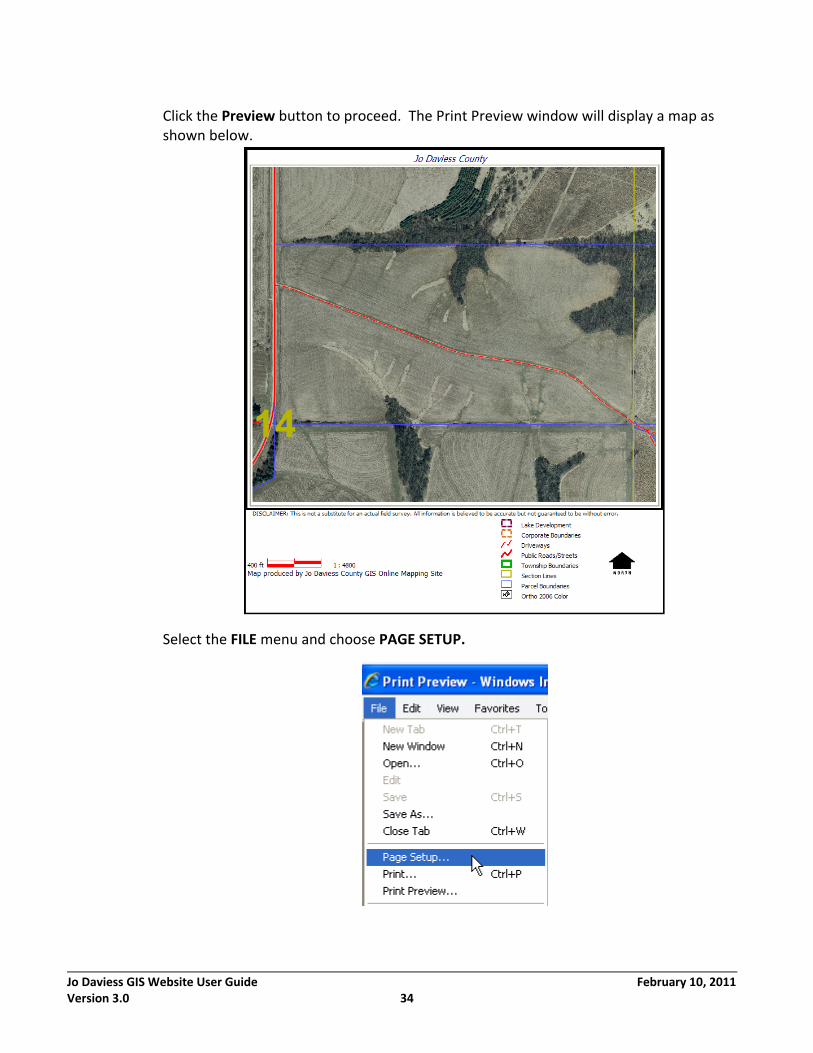
Click the Preview button to proceed. The Print Preview window will display a map as shown below.
Select the FILE menu and choose PAGE SETUP.
Jo Daviess GIS Website User Guide February 10, 2011 Version 3.0 35
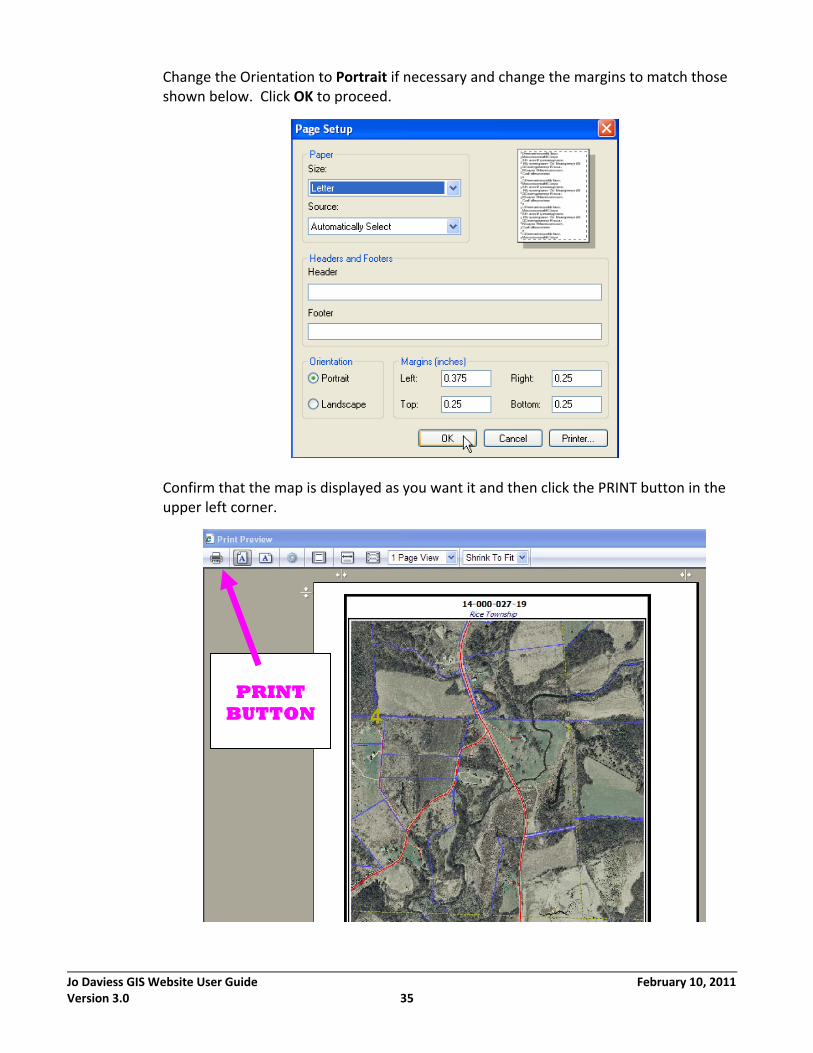
Change the Orientation to Portrait if necessary and change the margins to match those shown below. Click OK to proceed.
Confirm that the map is displayed as you want it and then click the PRINT button in the upper left corner.
BUTTON
Jo Daviess GIS Website User Guide February 10, 2011 Version 3.0 36
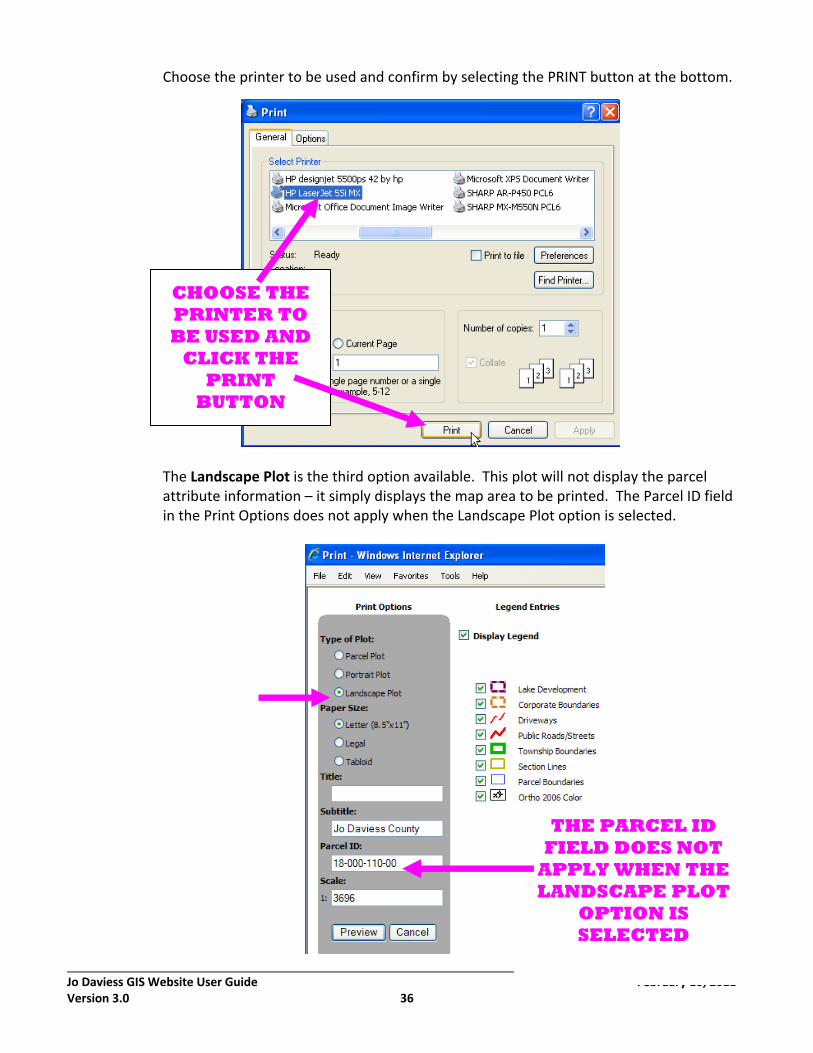
Choose the printer to be used and confirm by selecting the PRINT button at the bottom.
The Landscape Plot is the third option available. This plot will not display the parcel attribute information – it simply displays the map area to be printed. The Parcel ID field in the Print Options does not apply when the Landscape Plot option is selected.
THE PARCEL ID FIELD DOES NOT
APPLY WHEN THE LANDSCAPE PLOT
OPTION IS SELECTED
CHOOSE THE PRINTER TO BE USED AND
CLICK THE PRINT
BUTTON
Jo Daviess GIS Website User Guide February 10, 2011 Version 3.0 37
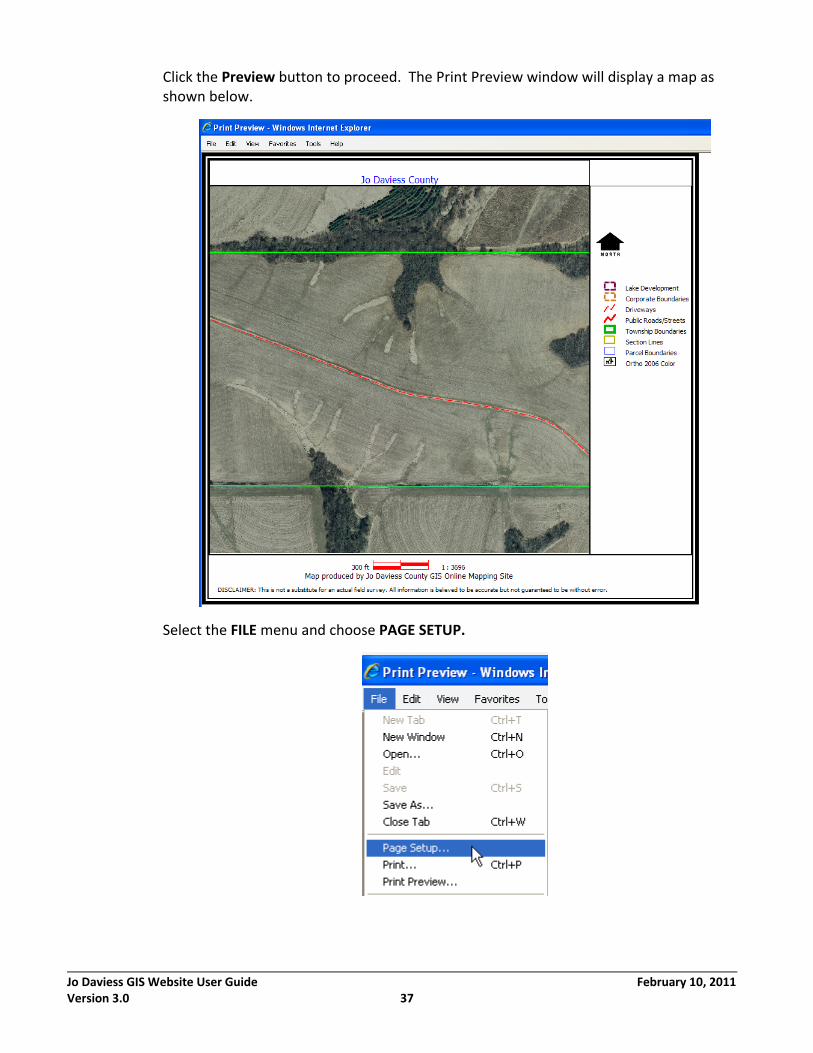
Click the Preview button to proceed. The Print Preview window will display a map as shown below.
Select the FILE menu and choose PAGE SETUP.
Jo Daviess GIS Website User Guide February 10, 2011 Version 3.0 38
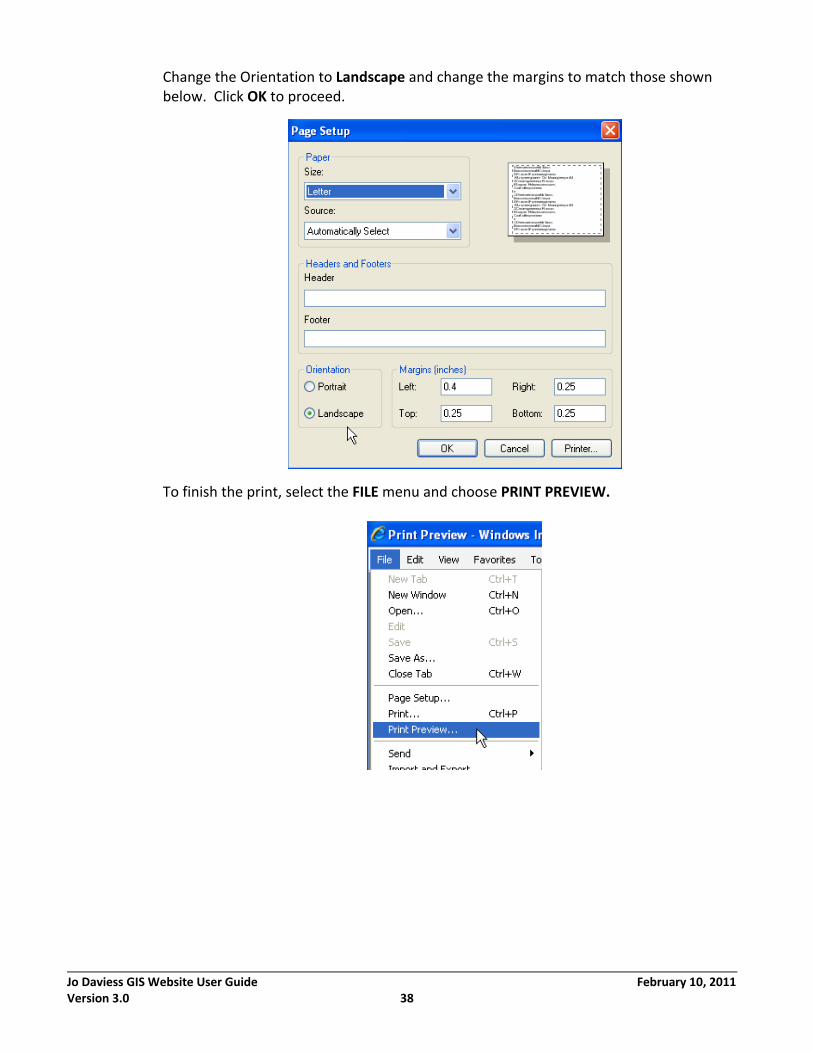
Change the Orientation to Landscape and change the margins to match those shown below. Click OK to proceed.
To finish the print, select the FILE menu and choose PRINT PREVIEW.
Jo Daviess GIS Website User Guide February 10, 2011 Version 3.0 39
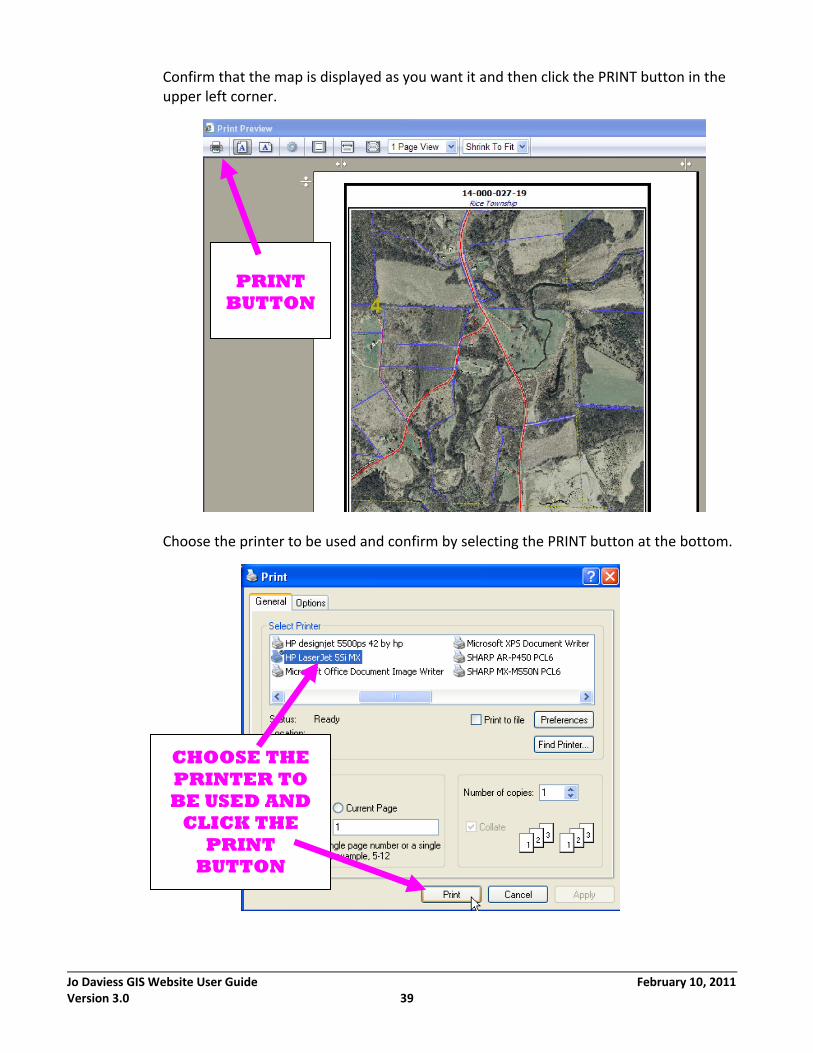
Confirm that the map is displayed as you want it and then click the PRINT button in the upper left corner.
Choose the printer to be used and confirm by selecting the PRINT button at the bottom.
BUTTON
CHOOSE THE PRINTER TO BE USED AND
CLICK THE PRINT
BUTTON
Jo Daviess GIS Website User Guide February 10, 2011 Version 3.0 40
Help Tool
The Help tool allows users to view this User Guide in PDF format.
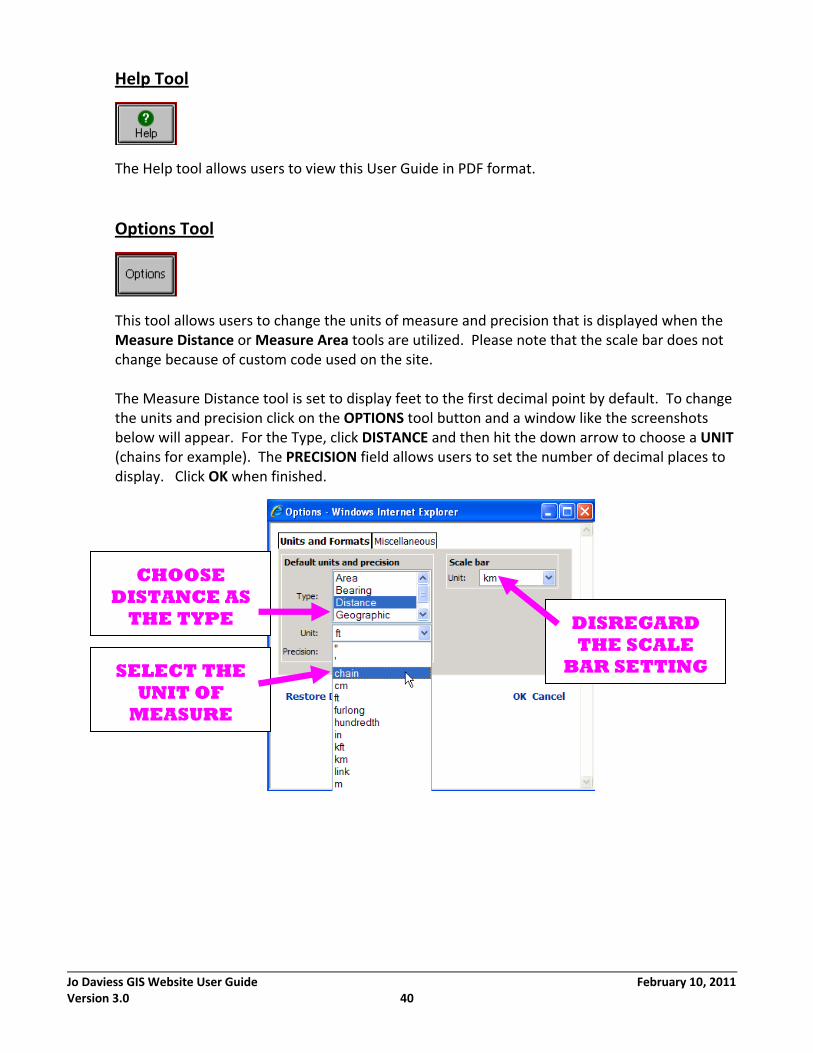
Options Tool
This tool allows users to change the units of measure and precision that is displayed when the Measure Distance or Measure Area tools are utilized. Please note that the scale bar does not change because of custom code used on the site. The Measure Distance tool is set to display feet to the first decimal point by default. To change the units and precision click on the OPTIONS tool button and a window like the screenshots below will appear. For the Type, click DISTANCE and then hit the down arrow to choose a UNIT (chains for example). The PRECISION field allows users to set the number of decimal places to display. Click OK when finished.
CHOOSE DISTANCE AS
THE TYPE
SELECT THE UNIT OF
MEASURE
DISREGARD THE SCALE
BAR SETTING
Jo Daviess GIS Website User Guide February 10, 2011 Version 3.0 41
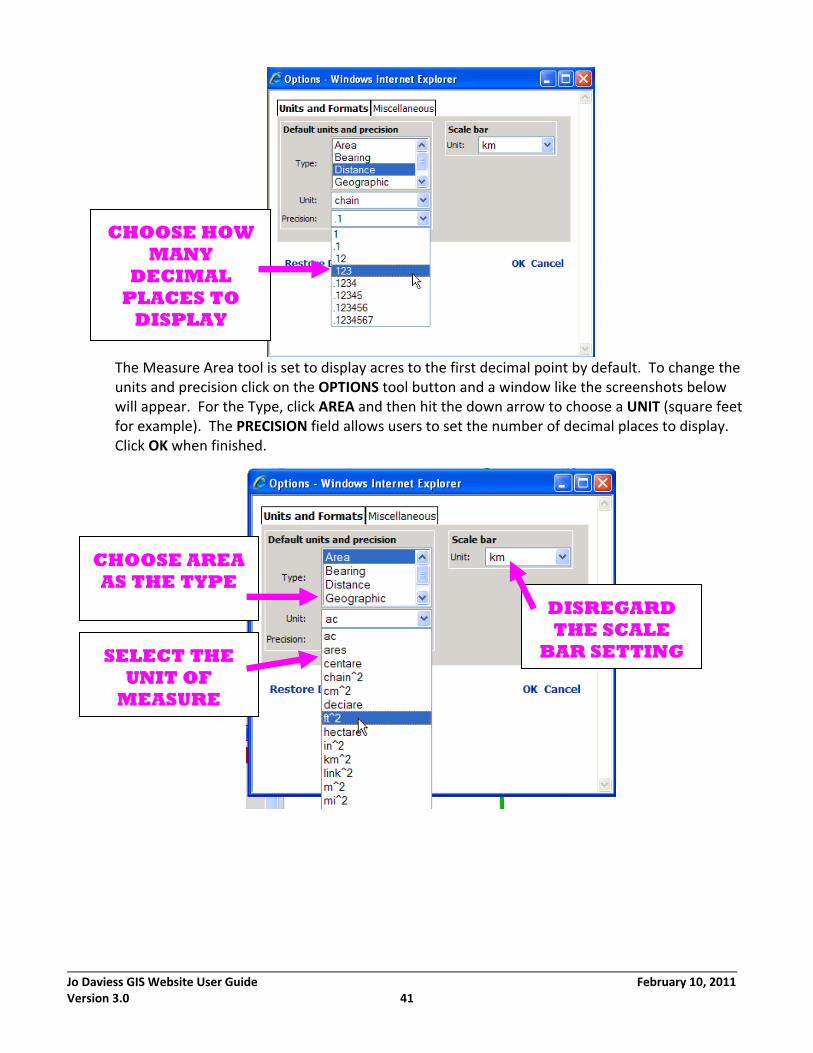
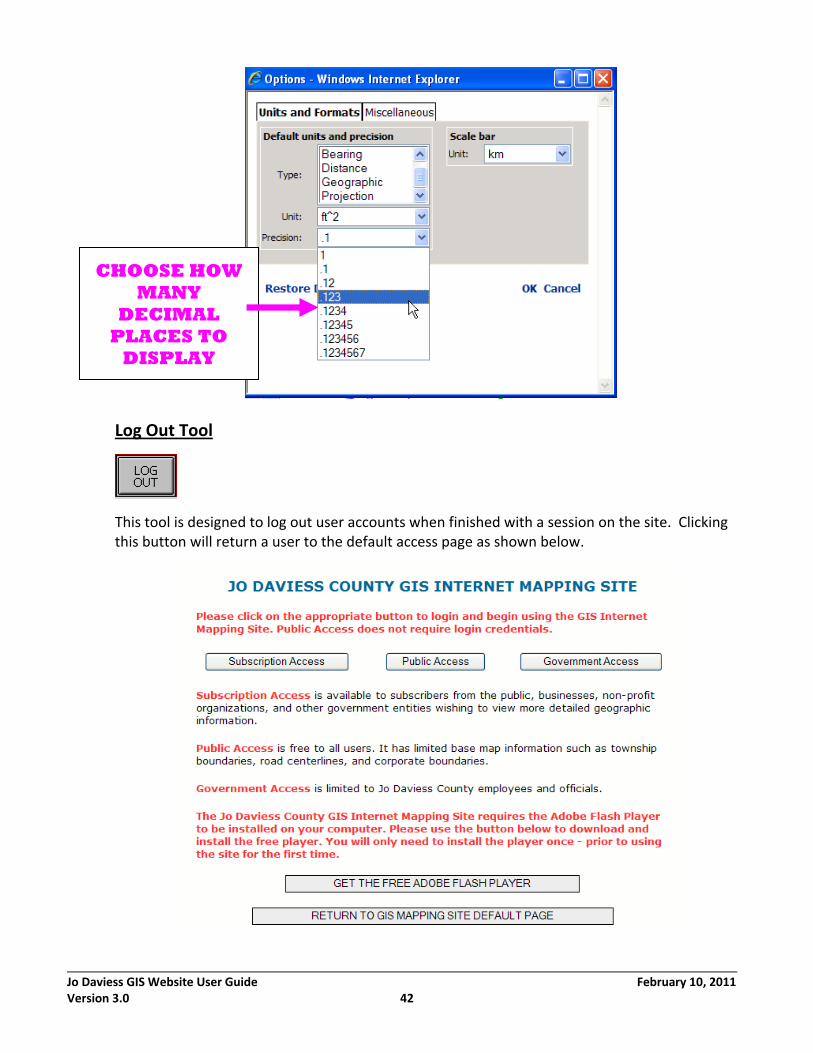
The Measure Area tool is set to display acres to the first decimal point by default. To change the units and precision click on the OPTIONS tool button and a window like the screenshots below will appear. For the Type, click AREA and then hit the down arrow to choose a UNIT (square feet for example). The PRECISION field allows users to set the number of decimal places to display. Click OK when finished.
CHOOSE HOW MANY
DECIMAL PLACES TO
DISPLAY
DISREGARD THE SCALE
BAR SETTING
CHOOSE AREA AS THE TYPE
SELECT THE UNIT OF
MEASURE
Jo Daviess GIS Website User Guide February 10, 2011 Version 3.0 42
Log Out Tool
This tool is designed to log out user accounts when finished with a session on the site. Clicking this button will return a user to the default access page as shown below.
CHOOSE HOW MANY
DECIMAL PLACES TO
DISPLAY

Jo Daviess GIS Website User Guide February 10, 2011 Version 3.0 43
Keep Connected Tool
This tool allows users to stay connected during a session on the site. After logging on, if the site remains idle for 9 minutes, the Keep Connected Tool button will begin flashing yellow and black for 1 minute giving the user the opportunity to click the button and stay connected. If the user does not click the button, then the site will automatically log out the account.