Embed Size (px)
Citation preview
JMP Clinical® 4 0JMP Clinical® 4.0adds Ways to Explore Clinical Trials Data Visually
Dr. Valerie NedbalJMP Pharmaceutical Technical Manager
SAS Institute
Copyright © 2010 SAS Institute Inc. All rights reserved.
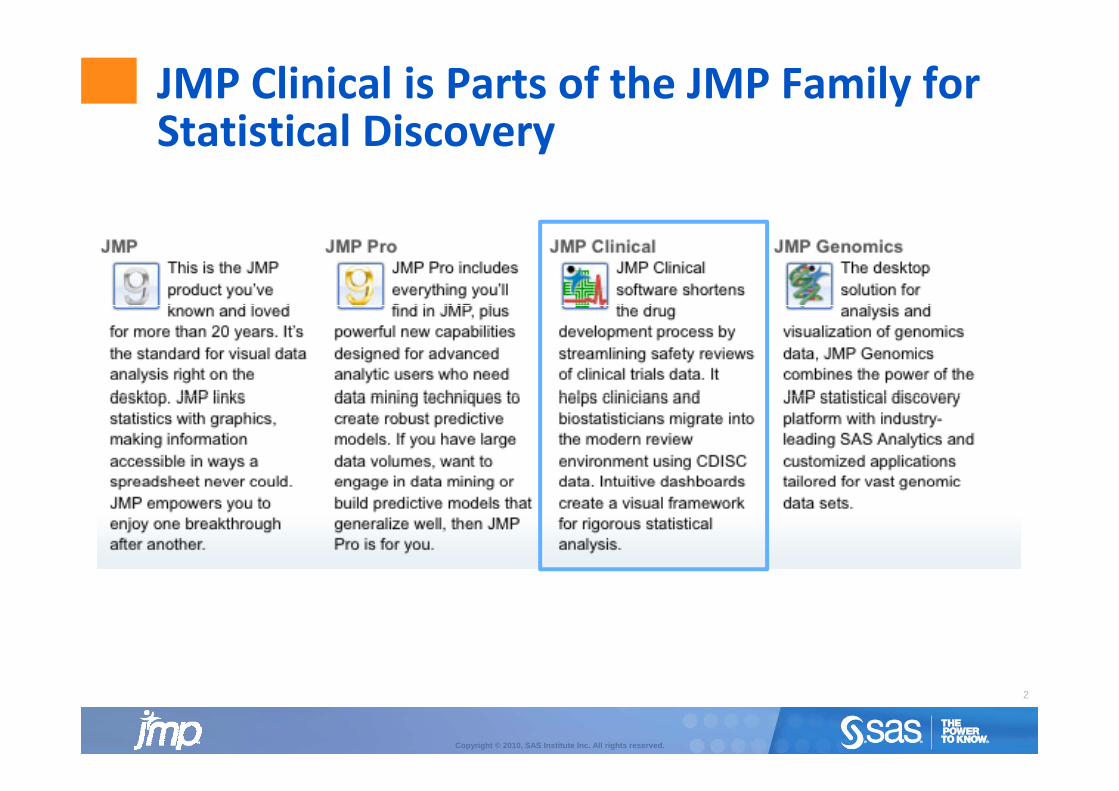
JMP Clinical is Parts of the JMP Family for Statistical DiscoveryStatistical Discovery
2
Copyright © 2010, SAS Institute Inc. All rights reserved.
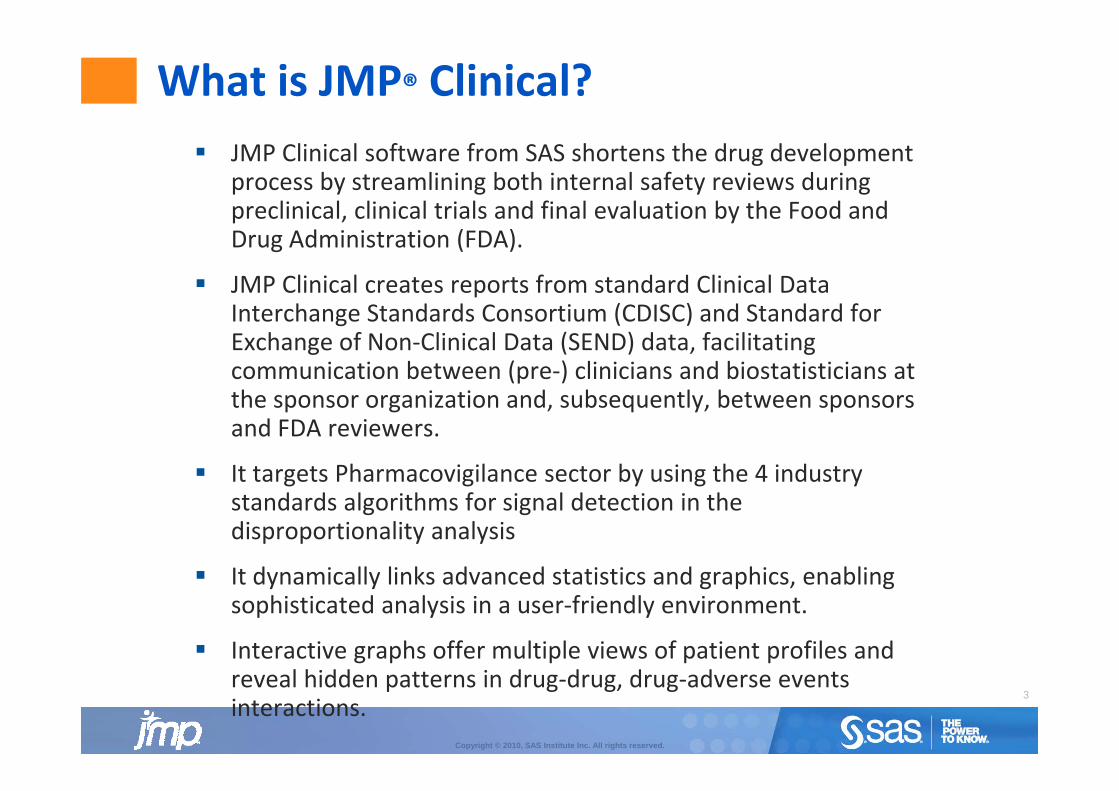
What is JMP® Clinical? JMP Clinical software from SAS shortens the drug development
process by streamlining both internal safety reviews during preclinical, clinical trials and final evaluation by the Food andpreclinical, clinical trials and final evaluation by the Food and Drug Administration (FDA).
JMP Clinical creates reports from standard Clinical Data I h S d d C i (CDISC) d S d d fInterchange Standards Consortium (CDISC) and Standard for Exchange of Non‐Clinical Data (SEND) data, facilitating communication between (pre‐) clinicians and biostatisticians at the sponsor organization and subsequently between sponsorsthe sponsor organization and, subsequently, between sponsors and FDA reviewers.
It targets Pharmacovigilance sector by using the 4 industry g g y g ystandards algorithms for signal detection in the disproportionality analysis
It dynamically links advanced statistics and graphics enabling It dynamically links advanced statistics and graphics, enabling sophisticated analysis in a user‐friendly environment.
Interactive graphs offer multiple views of patient profiles and 3
Copyright © 2010, SAS Institute Inc. All rights reserved.
reveal hidden patterns in drug‐drug, drug‐adverse events interactions.
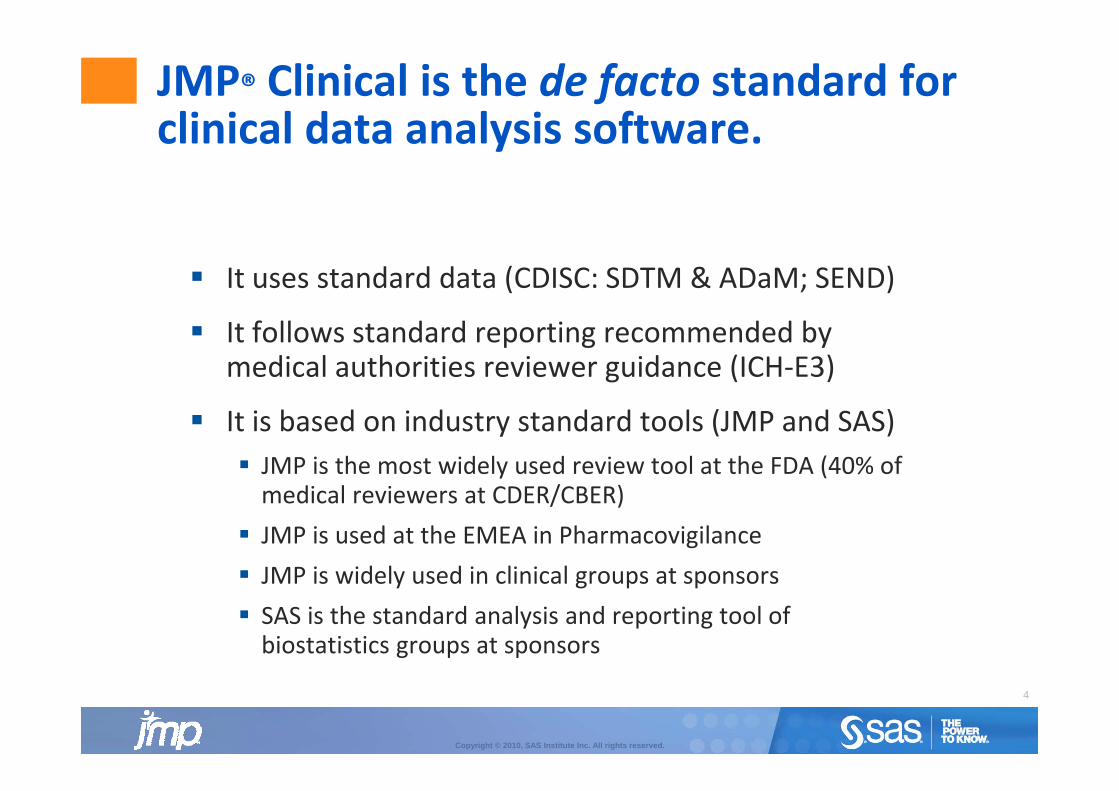
JMP® Clinical is the de facto standard for clinical data analysis softwareclinical data analysis software.
It uses standard data (CDISC: SDTM & ADaM; SEND)
It follows standard reporting recommended by medical authorities reviewer guidance (ICH‐E3)
It is based on industry standard tools (JMP and SAS) JMP is the most widely used review tool at the FDA (40% of
d l / )medical reviewers at CDER/CBER) JMP is used at the EMEA in Pharmacovigilance JMP is widely used in clinical groups at sponsors JMP is widely used in clinical groups at sponsors SAS is the standard analysis and reporting tool of biostatistics groups at sponsors
4
Copyright © 2010, SAS Institute Inc. All rights reserved.
JMP® ClinicalPourquoi integrer SAS et JMP
Highly Visual
JMP seul sur un ordinateur de bureau offre une plate-
Interactive GraphicsIntuitive
JMP seul sur un ordinateur de bureau offre une plate-forme hautement productive pour visualiser, explorer et modeler de données.
S S (S S/ S S/S ) Par contre, SAS (SAS/Base, SAS/STAT) est utilisé comme un environnement de «haute production de données», et fourni des outils a l'accès aux données, la manipulation et l' l d d é
+l'analyse de données
Les avantages de la combinaison de SAS JMP: Les scientifiques utilisent JMP à explorer, visualiser et à es sc e t ques ut se t J à e p o e , sua se et àmodeler de données. L’approche de l'analyse est alors déployé par SAS, celle-ci effectue la manipulation des données, et l'analyse statistique de haute qualité afin de
ScalableValidated Powerful Analytics
5
Copyright © 2010, SAS Institute Inc. All rights reserved.
, y q qles visualiser dans JMP
a dated o e u a yt cs
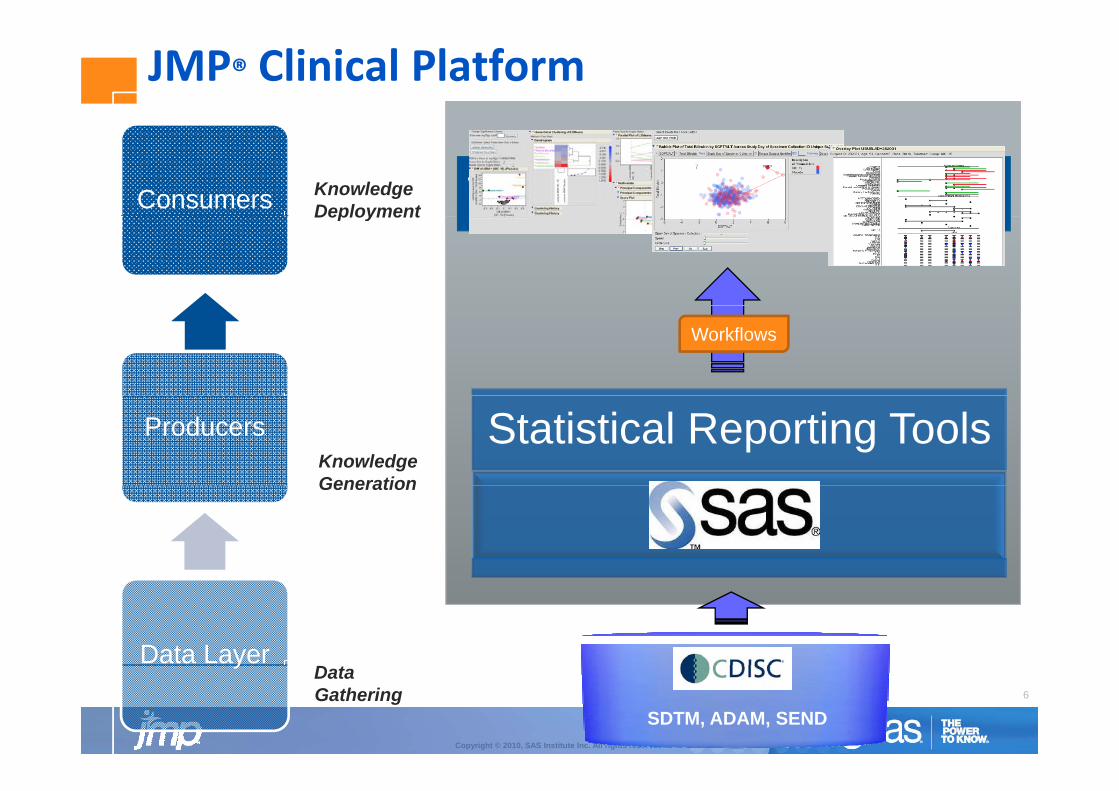
JMP® Clinical Platform
Consumers Visual Reporting ProcessKnowledgeDeployment p gDeployment
Workflows
Producers Statistical Reporting ToolsKnowledgeGeneration
SASGeneration
Data Layer6
Copyright © 2010, SAS Institute Inc. All rights reserved.
yDataGathering
SDTM, ADAM, SEND
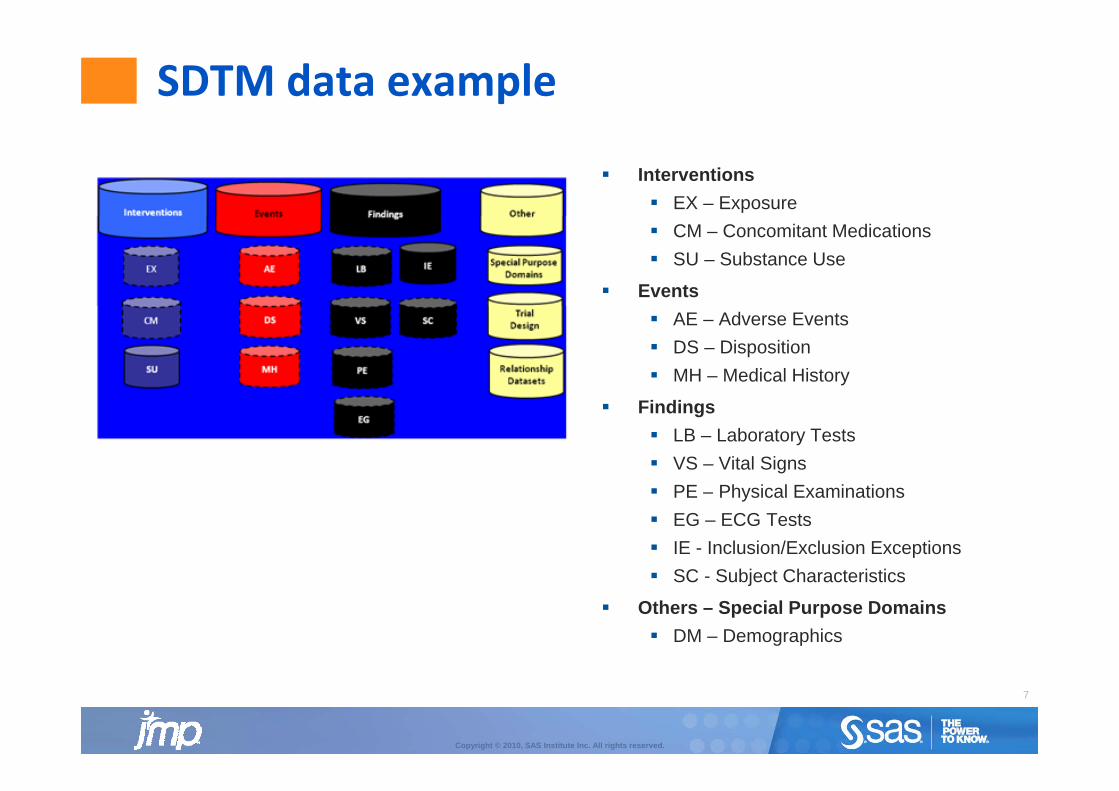
SDTM data example
Interventions EX – Exposure CM – Concomitant Medications SU – Substance Use
Events AE – Adverse Events DS – Disposition MH – Medical History
Findings LB – Laboratory Tests VS – Vital Signs
PE Ph i l E i ti PE – Physical Examinations EG – ECG Tests IE - Inclusion/Exclusion Exceptions SC Subject Characteristics SC - Subject Characteristics
Others – Special Purpose Domains DM – Demographics
7
Copyright © 2010, SAS Institute Inc. All rights reserved.
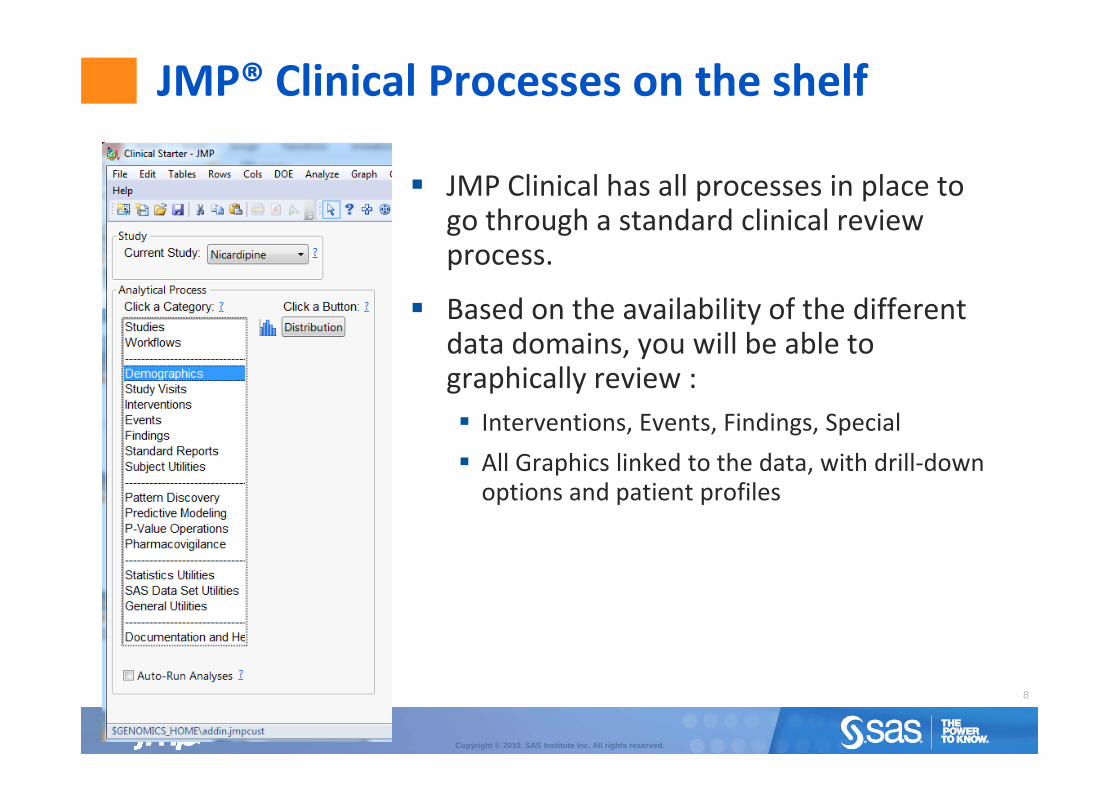
JMP® Clinical Processes on the shelf
JMP Clinical has all processes in place togo through a standard clinical reviewgo through a standard clinical reviewprocess.
Based on the availability of the different Based on the availability of the different data domains, you will be able tographically review : Interventions, Events, Findings, Special All Graphics linked to the data, with drill‐down
ti d ti t filoptions and patient profiles
8
Copyright © 2010, SAS Institute Inc. All rights reserved.
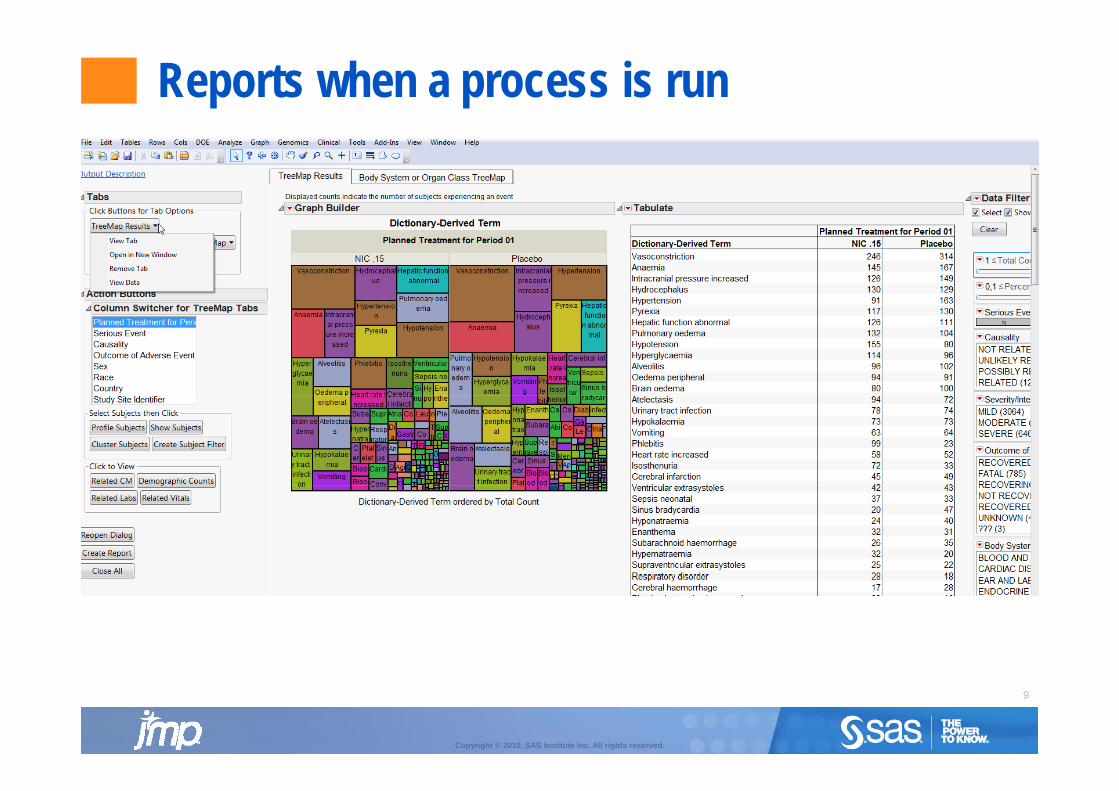
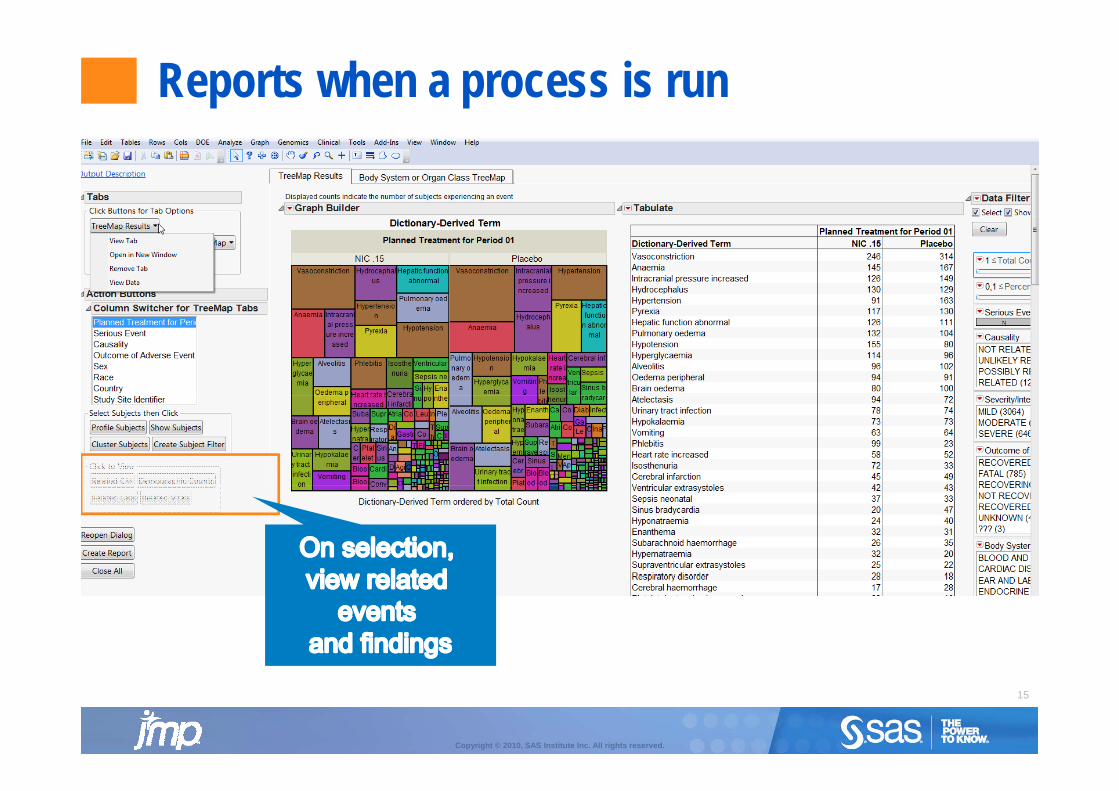
Reports when a process is run
9
Copyright © 2010, SAS Institute Inc. All rights reserved.
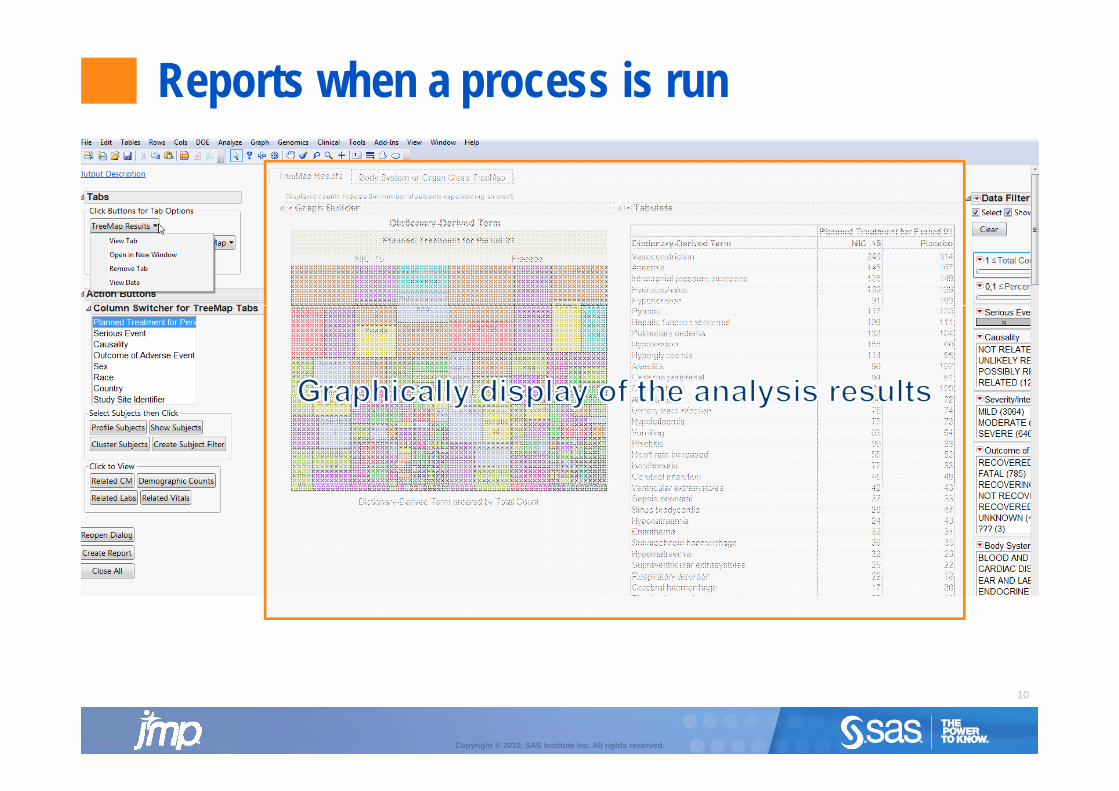
Reports when a process is run
10
Copyright © 2010, SAS Institute Inc. All rights reserved.
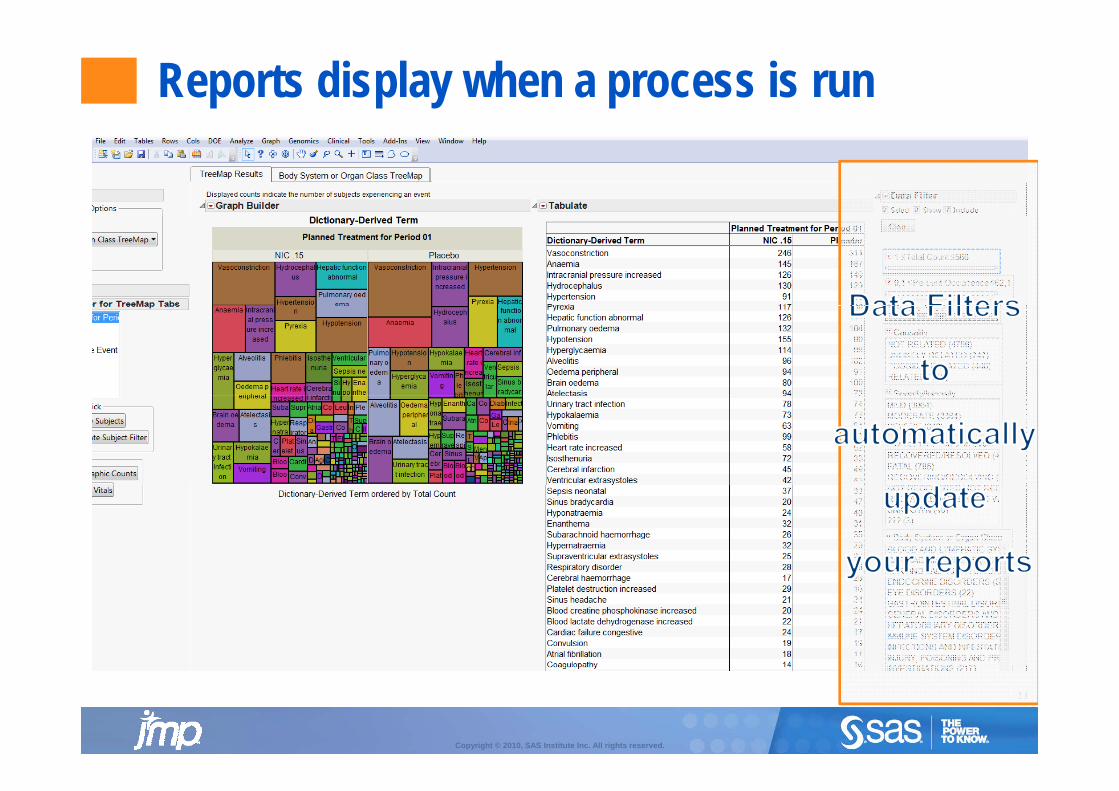
Reports display when a process is run
11
Copyright © 2010, SAS Institute Inc. All rights reserved.
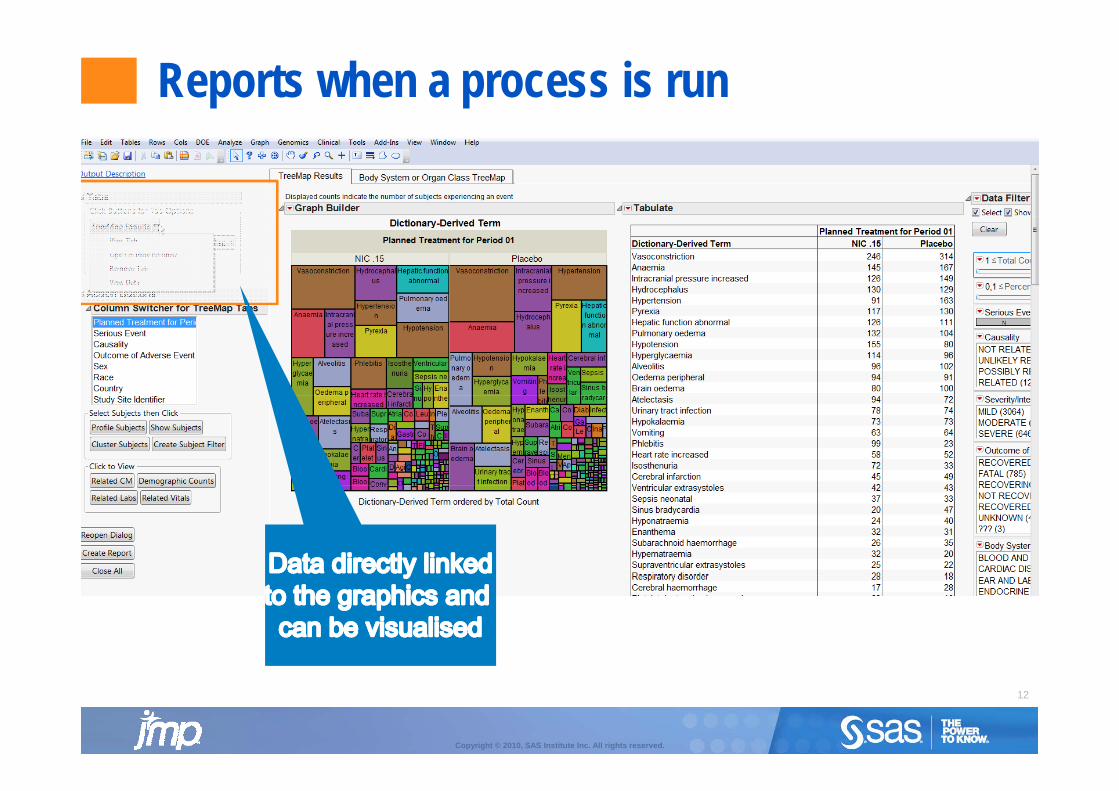
Reports when a process is run
12
Copyright © 2010, SAS Institute Inc. All rights reserved.
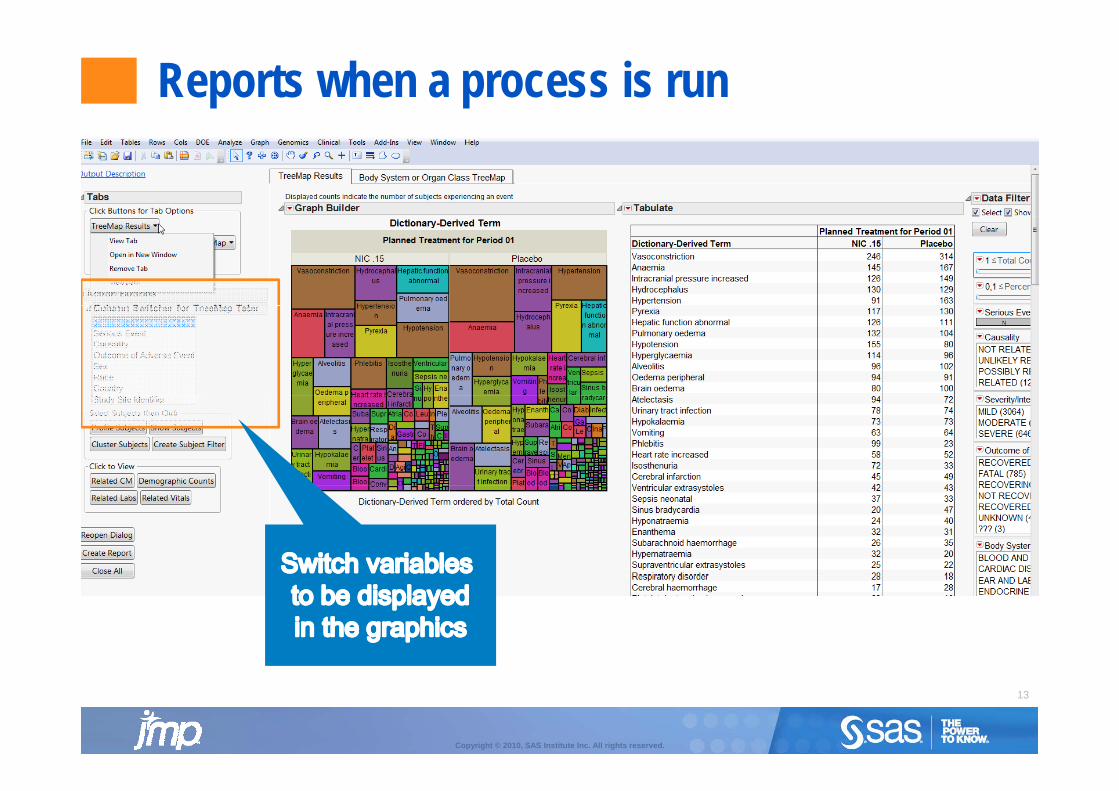
Reports when a process is run
13
Copyright © 2010, SAS Institute Inc. All rights reserved.
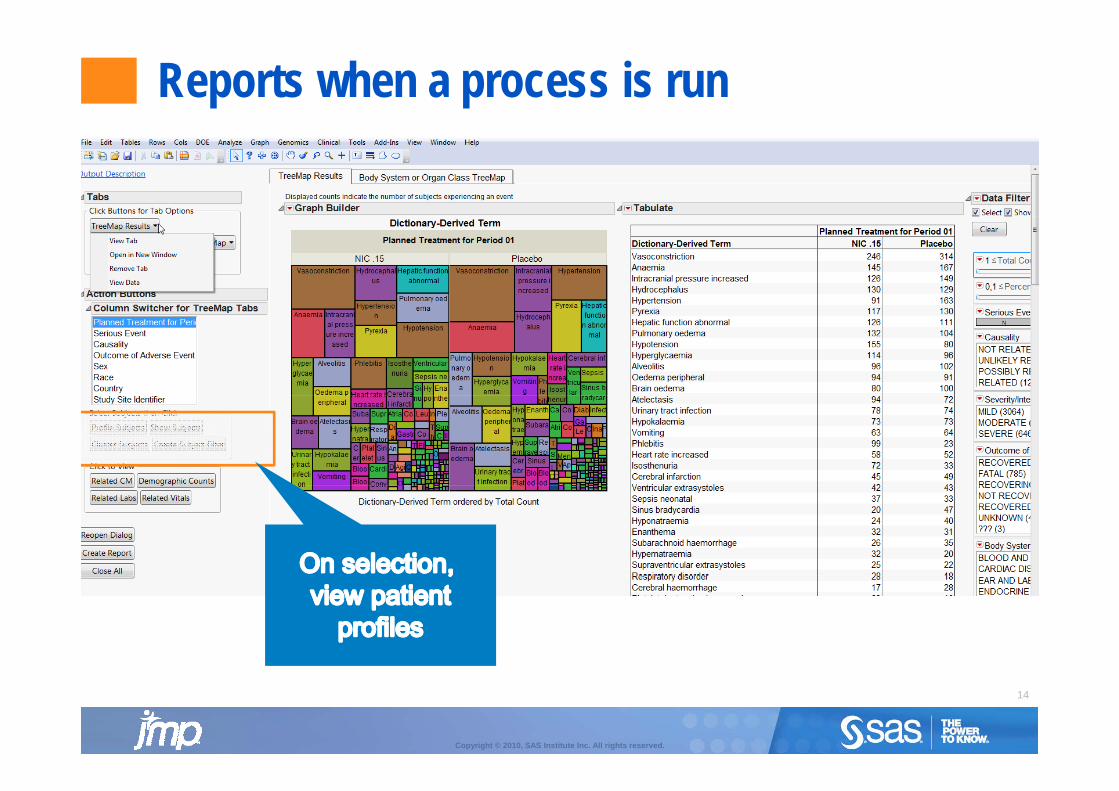
Reports when a process is run
14
Copyright © 2010, SAS Institute Inc. All rights reserved.
Reports when a process is run
15
Copyright © 2010, SAS Institute Inc. All rights reserved.
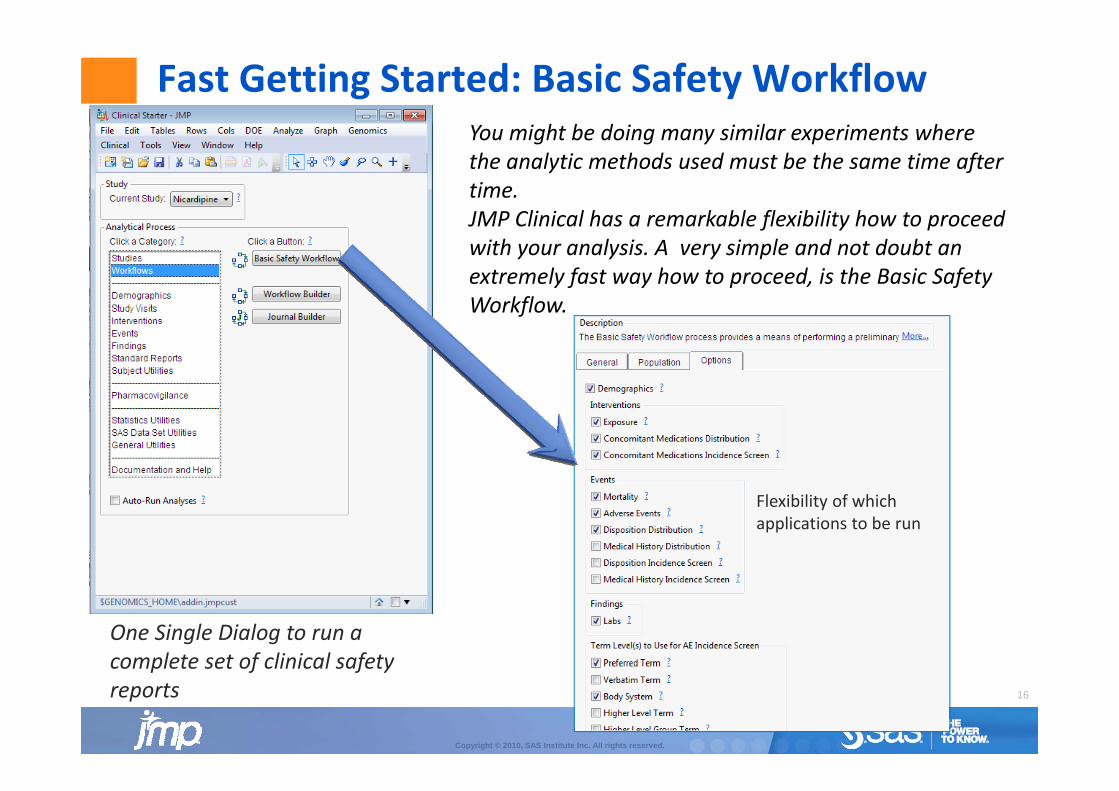
Fast Getting Started: Basic Safety WorkflowY i ht b d i i il i t hYou might be doing many similar experiments wherethe analytic methods used must be the same time after time. JMP Clinical has a remarkable flexibility how to proceedJMP Clinical has a remarkable flexibility how to proceed with your analysis. A very simple and not doubt an extremely fast way how to proceed, is the Basic Safety WorkflowWorkflow.
Flexibility of whichapplications to be run
One Single Dialog to run a complete set of clinical safety
16
Copyright © 2010, SAS Institute Inc. All rights reserved.
complete set of clinical safety reports
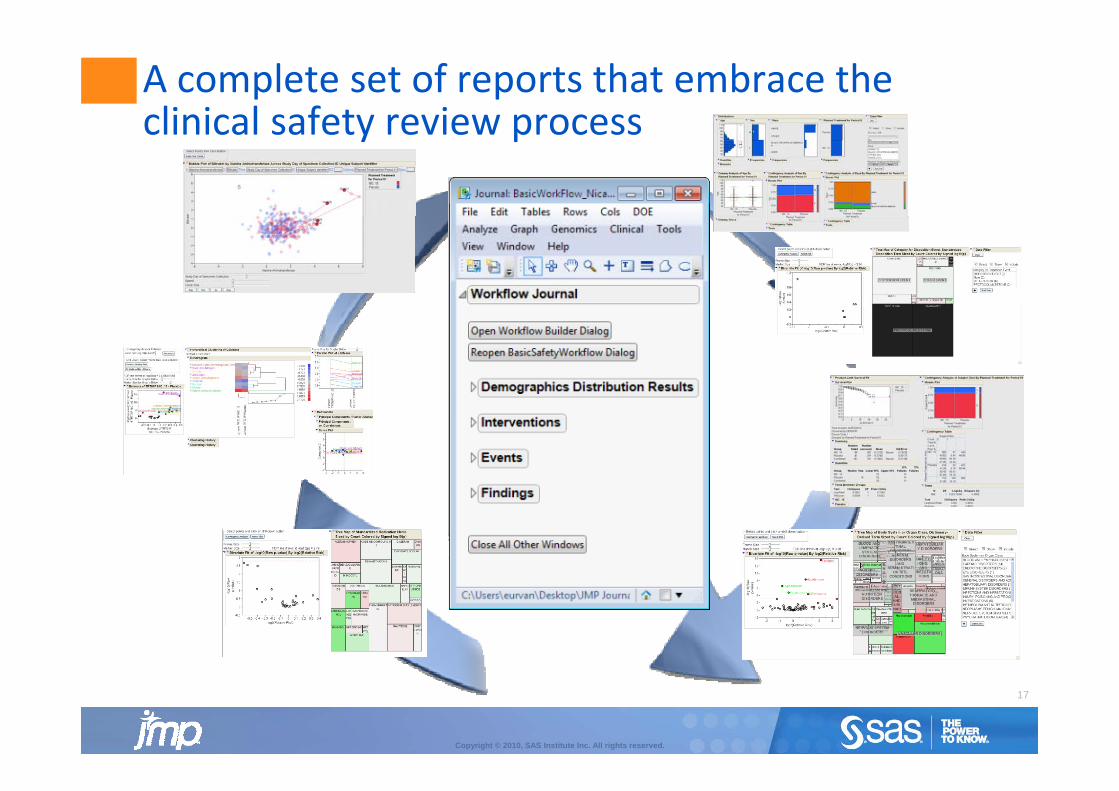
A complete set of reports that embrace the clinical safety review processclinical safety review process
17
Copyright © 2010, SAS Institute Inc. All rights reserved.
Benefits for producers and consumers
JMP Clinical streamlines the clinical reporting and reviewing process by:
Faster and easier safety review process by delivering unparalleled flexibility, point and click and drill down
process by:
p y, pfunctionalities for exploring prominent results in more detail.
Lower cost‐to‐market via better decision making on safety outcomes: JMP Clinical reduces the false discovery rate, by mitigating the risk of over reporting adverse eventsmitigating the risk of over‐reporting adverse events.
Spending time more efficiently in the safety review process: more time spend by exploring patterns andprocess: more time spend by exploring patterns and predicting outcomes in clinical trials data – and less time programming or manipulating data tables.
18
Copyright © 2010, SAS Institute Inc. All rights reserved.
JMP® Clinical Data Analysis WorkflowLive Demonstration
Copyright © 2010 SAS Institute Inc. All rights reserved.
The Study Design
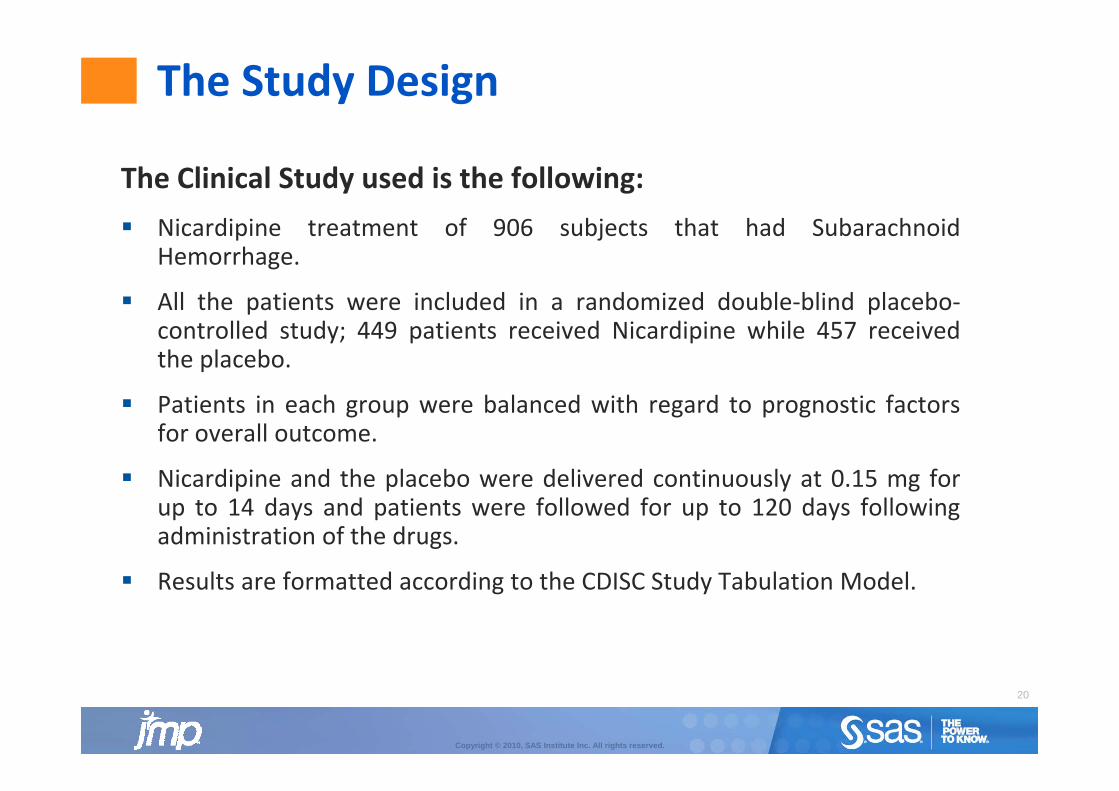
The Clinical Study used is the following: Nicardipine treatment of 906 subjects that had Subarachnoid
Hemorrhage.
All the patients were included in a randomized double‐blind placebo‐All the patients were included in a randomized double blind placebocontrolled study; 449 patients received Nicardipine while 457 receivedthe placebo.
i i h b l d i h d i f Patients in each group were balanced with regard to prognostic factorsfor overall outcome.
Nicardipine and the placebo were delivered continuously at 0.15 mg forNicardipine and the placebo were delivered continuously at 0.15 mg forup to 14 days and patients were followed for up to 120 days followingadministration of the drugs.
R lt f tt d di t th CDISC St d T b l ti M d l Results are formatted according to the CDISC Study Tabulation Model.
20
Copyright © 2010, SAS Institute Inc. All rights reserved.
JMP® Clinical Starter Menu
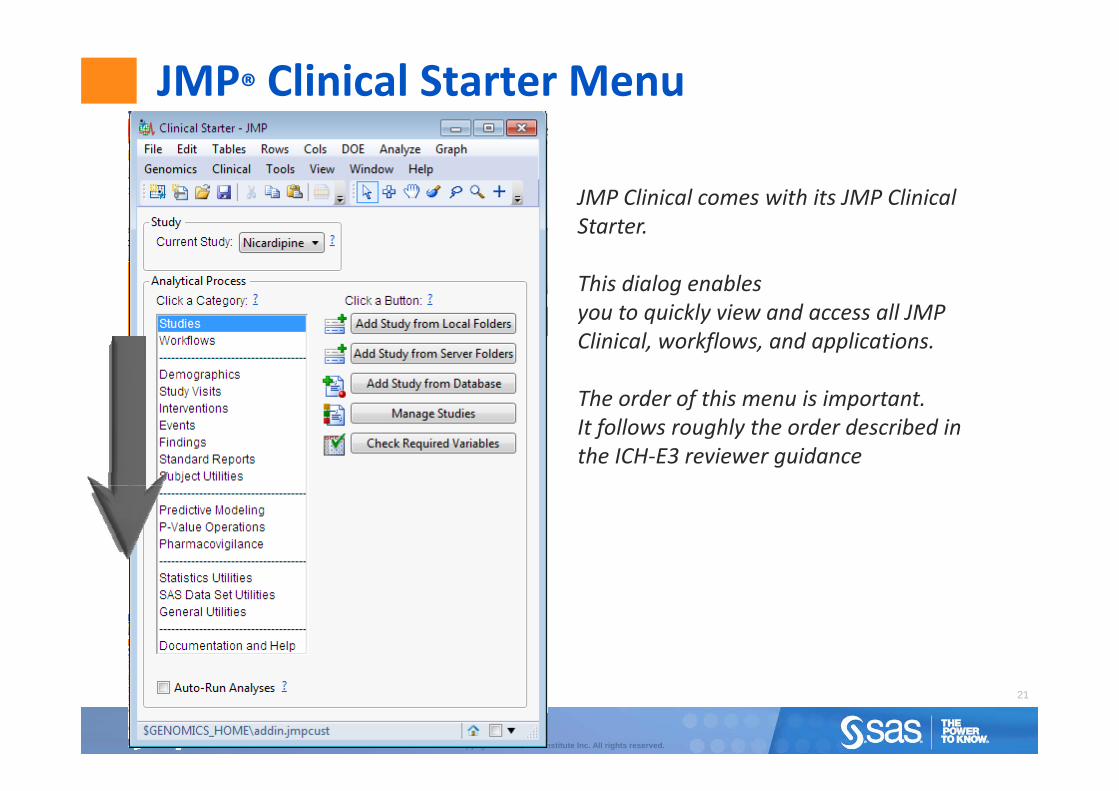
JMP Clinical comes with its JMP Clinical Starter.
This dialog enablest i kl i d ll JMPyou to quickly view and access all JMP
Clinical, workflows, and applications.
The order of this menu is importantThe order of this menu is important.It follows roughly the order described in the ICH‐E3 reviewer guidance
21
Copyright © 2010, SAS Institute Inc. All rights reserved.
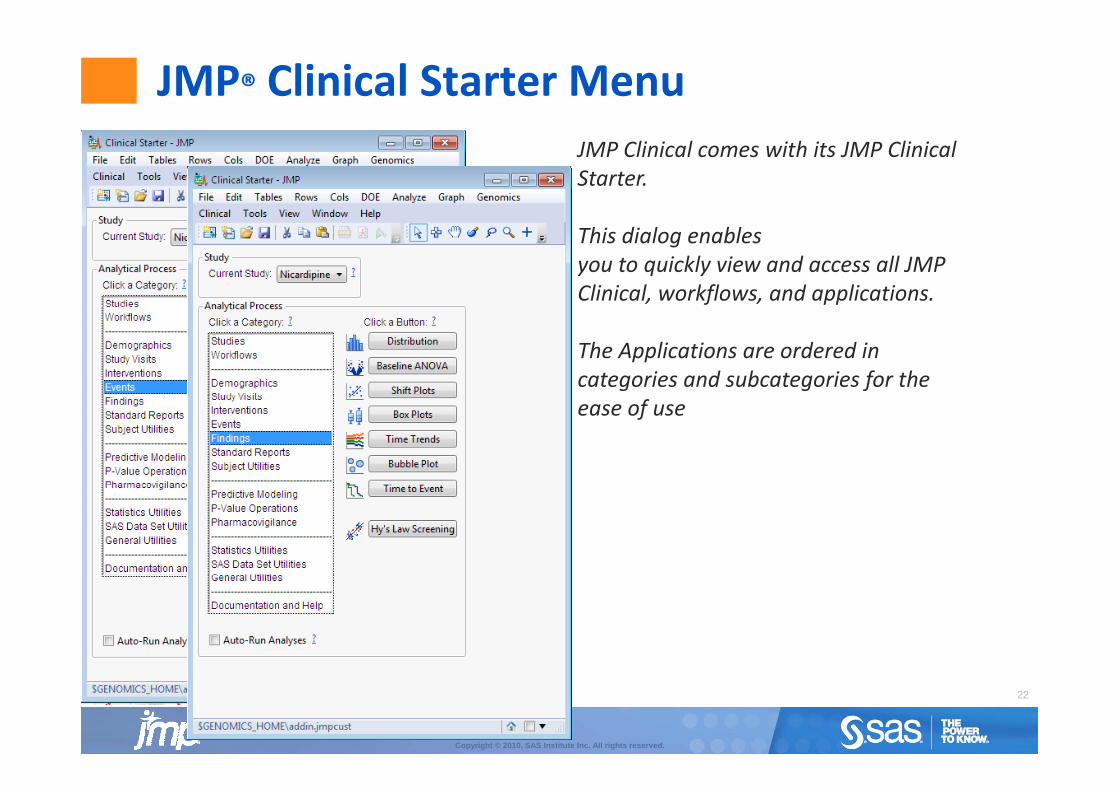
JMP® Clinical Starter MenuJMP Clinical comes with its JMP Clinical Starter.
This dialog enablesyou to quickly view and access all JMP Clinical, workflows, and applications.
The Applications are ordered in categories and subcategories for the ease of use
22
Copyright © 2010, SAS Institute Inc. All rights reserved.
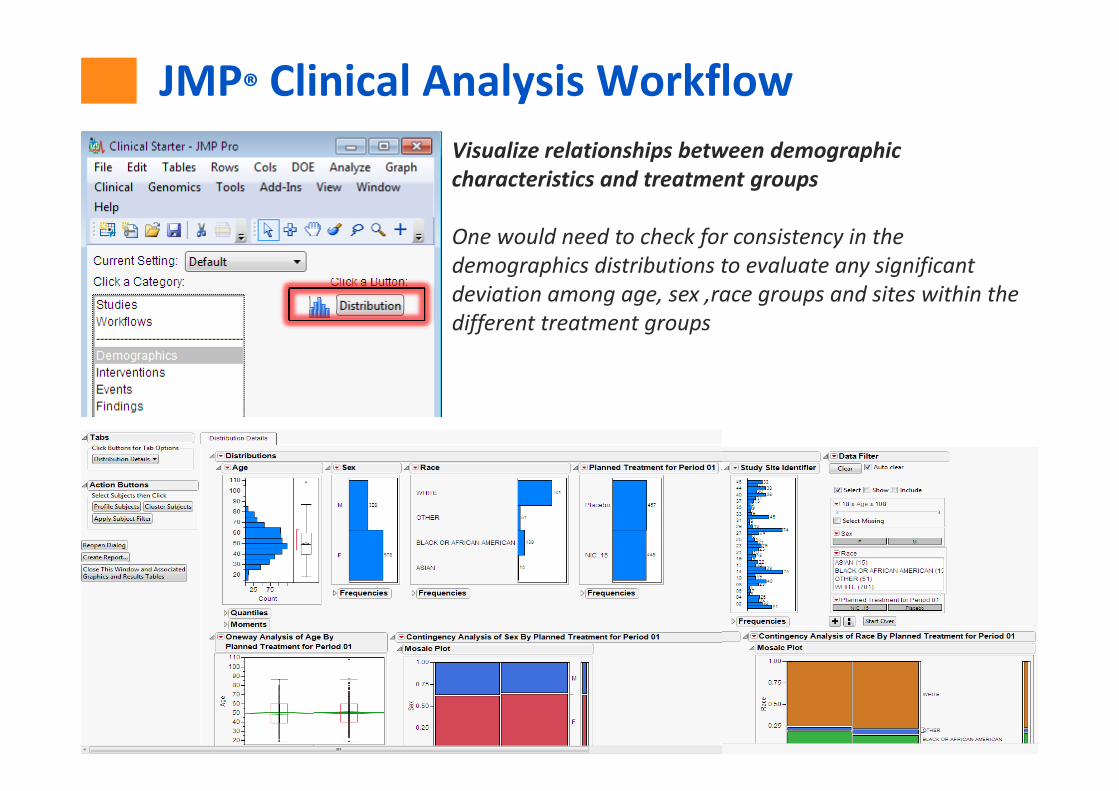
JMP® Clinical Analysis WorkflowVisualize relationships between demographic characteristics and treatment groups
One would need to check for consistency in the demographics distributions to evaluate any significant deviation among age, sex ,race groups and sites within the different treatment groups
23
Copyright © 2010, SAS Institute Inc. All rights reserved.
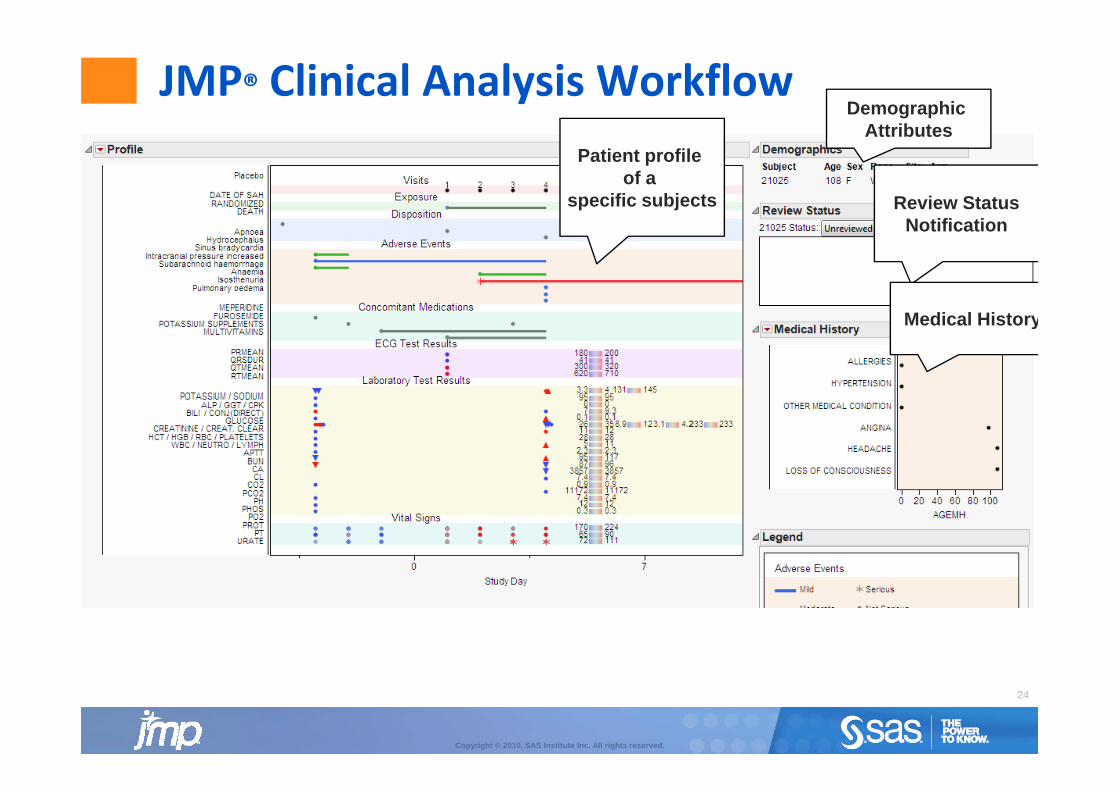
JMP® Clinical Analysis WorkflowDemographic
Att ib tPatient profile
of a specific subjects
Attributes
Review StatusNotification
Medical History
24
Copyright © 2010, SAS Institute Inc. All rights reserved.
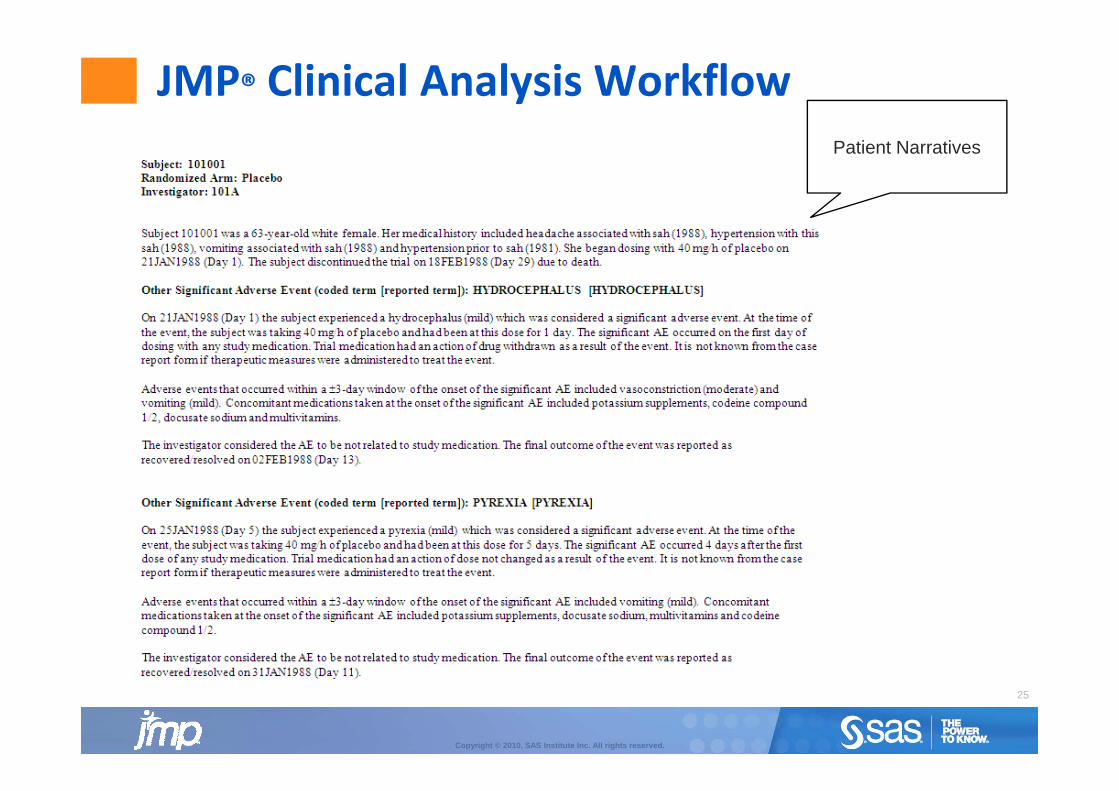
JMP® Clinical Analysis WorkflowPatient Narratives
25
Copyright © 2010, SAS Institute Inc. All rights reserved.
JMP® Clinical Analysis Workflow
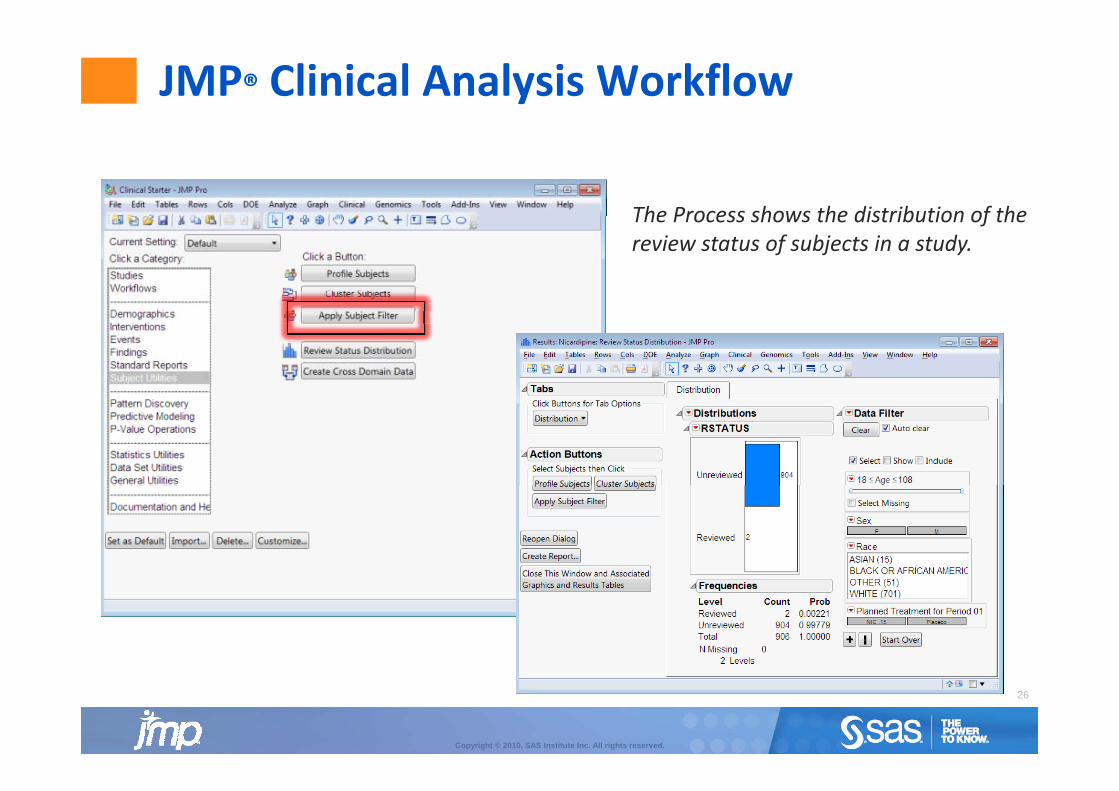
The Process shows the distribution of theThe Process shows the distribution of the review status of subjects in a study.
26
Copyright © 2010, SAS Institute Inc. All rights reserved.
JMP® Clinical Analysis Workflow
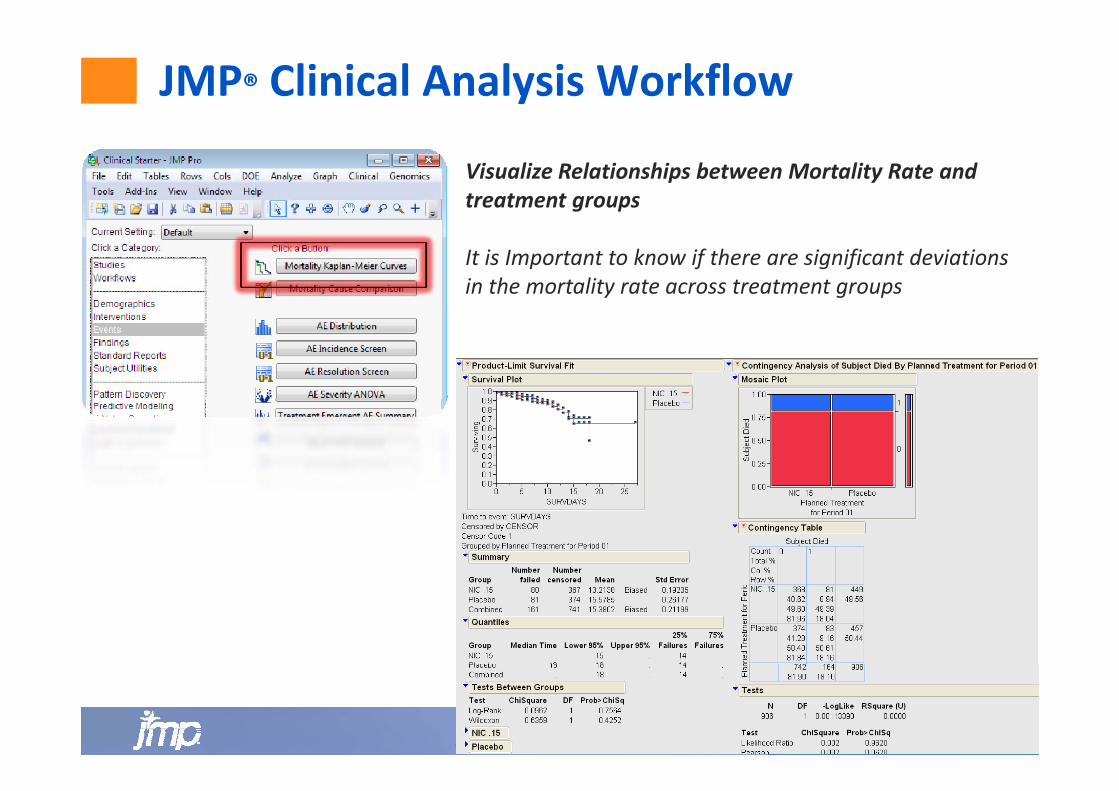
Visualize Relationships between Mortality Rate and treatment groups
It is Important to know if there are significant deviations in the mortality rate across treatment groups
27
Copyright © 2010, SAS Institute Inc. All rights reserved.
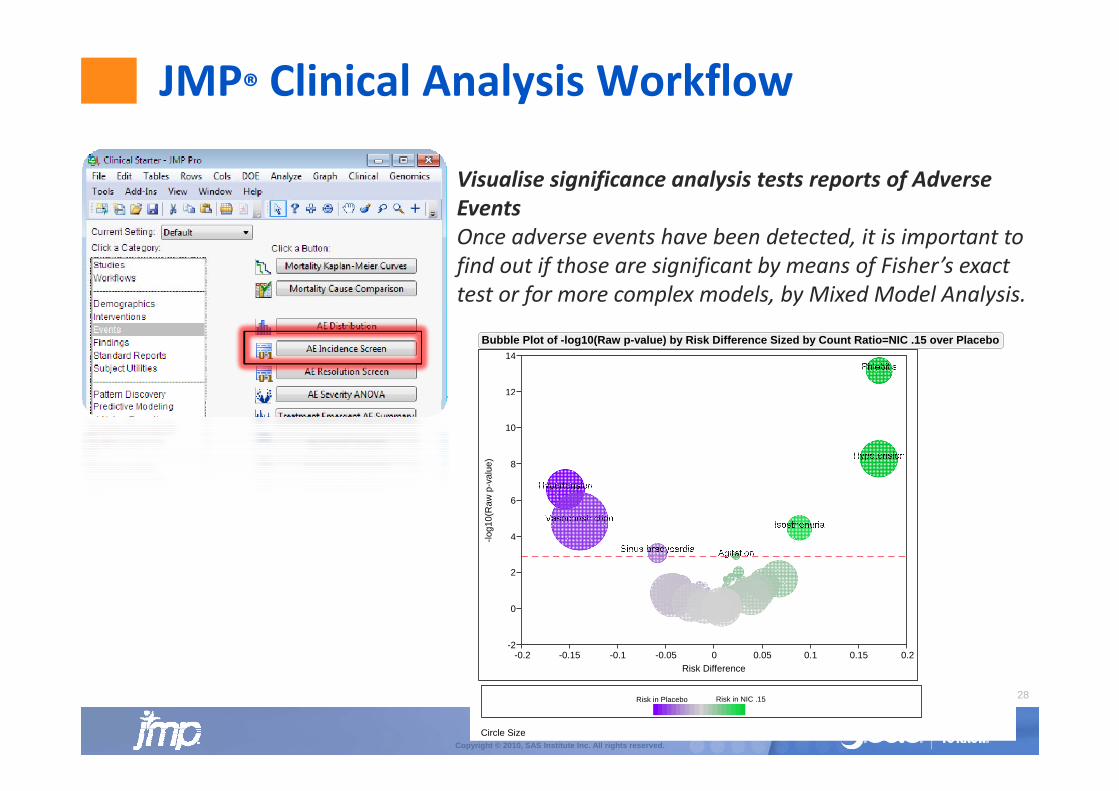
JMP® Clinical Analysis Workflow
Visualise significance analysis tests reports of Adverse EventsOnce adverse events have been detected, it is important to find out if those are significant by means of Fisher’s exact test or for more complex models, by Mixed Model Analysis. f p y y
12
14Bubble Plot of -log10(Raw p-value) by Risk Difference Sized by Count Ratio=NIC .15 over Placebo
8
10
-val
ue)
2
4
6-lo
g10(
Raw
p-
-2
0
2
-0.2 -0.15 -0.1 -0.05 0 0.05 0.1 0.15 0.2Ri k Diff
28
Copyright © 2010, SAS Institute Inc. All rights reserved.
Risk Difference
Risk in Placebo Risk in NIC .15
Circle Size
10
12
14Bubble Plot of -log10(Raw p-value) by Risk Difference Sized by Count Ratio=NIC .15 over Placebo
4
6
8
-log1
0(R
aw p
-val
ue)
Drill Down Options
-2
0
2
-0.2 -0.15 -0.1 -0.05 0 0.05 0.1 0.15 0.2Risk Difference
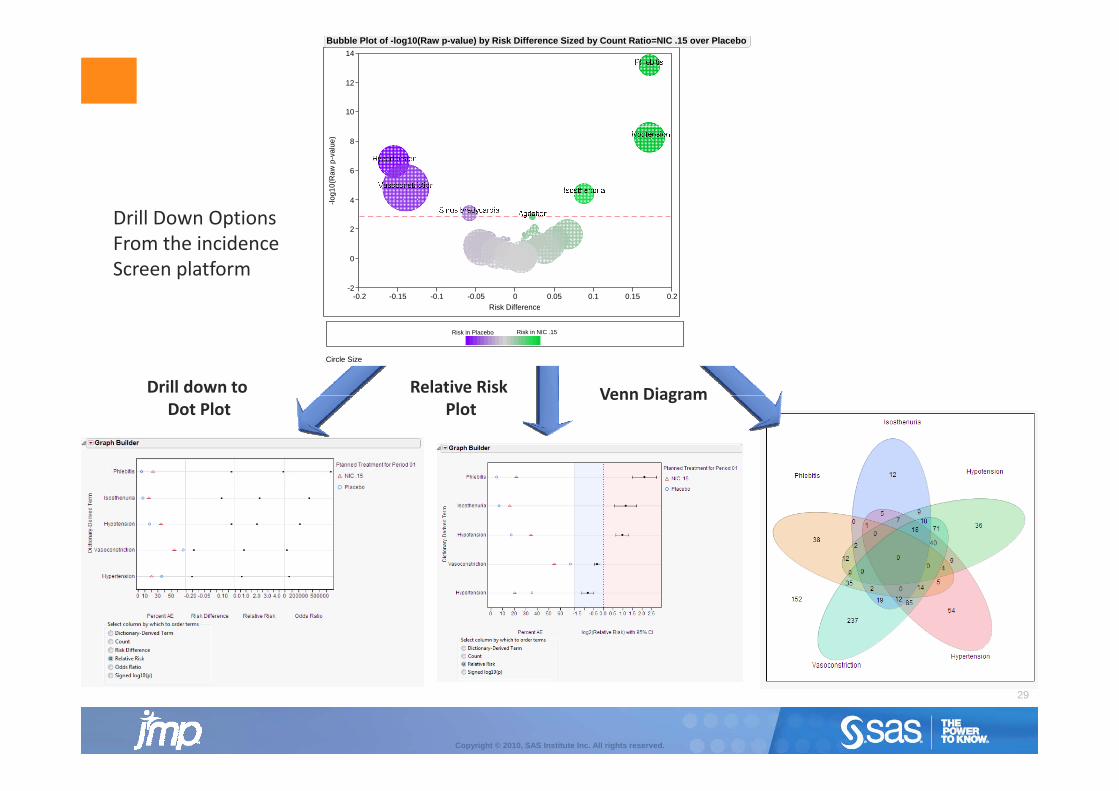
Drill Down OptionsFrom the incidenceScreen platform
Drill down to Relative Risk Venn Diagram
Risk Difference
Risk in Placebo Risk in NIC .15
Circle Size
Dot Plot PlotVenn Diagram
29
Copyright © 2010, SAS Institute Inc. All rights reserved.
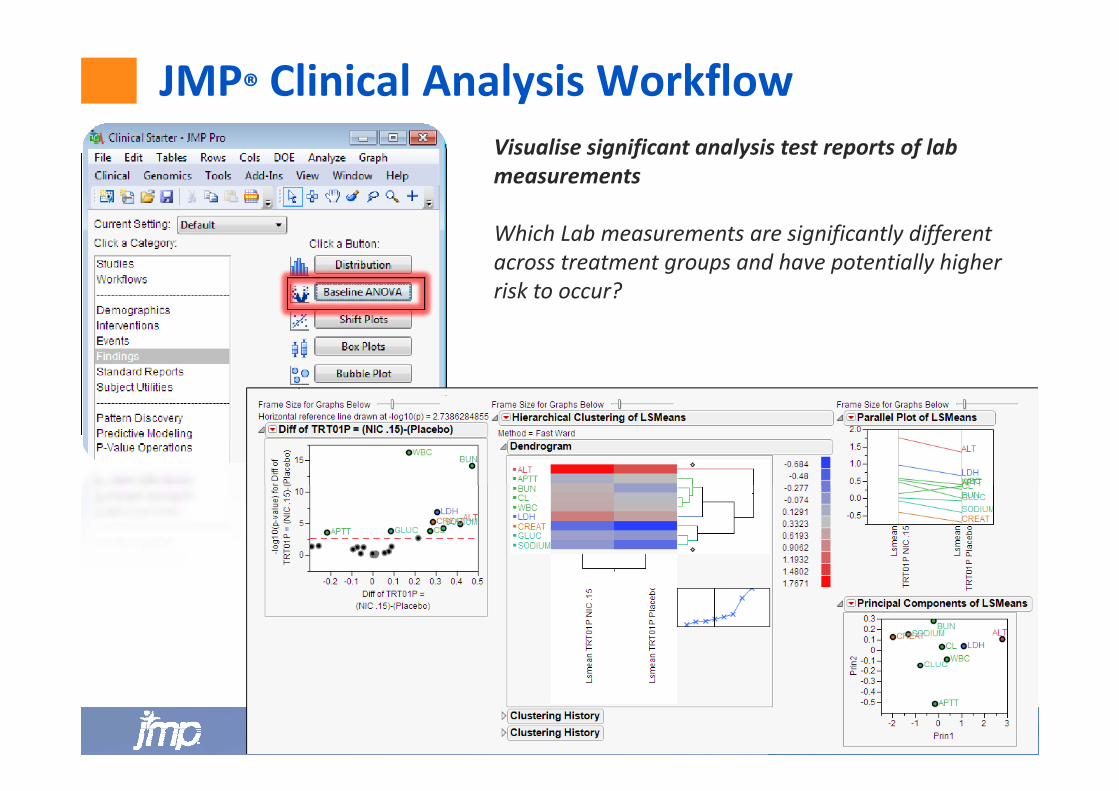
JMP® Clinical Analysis WorkflowVisualise significant analysis test reports of lab measurements
Which Lab measurements are significantly different across treatment groups and have potentially higher risk to occur?
30
Copyright © 2010, SAS Institute Inc. All rights reserved.
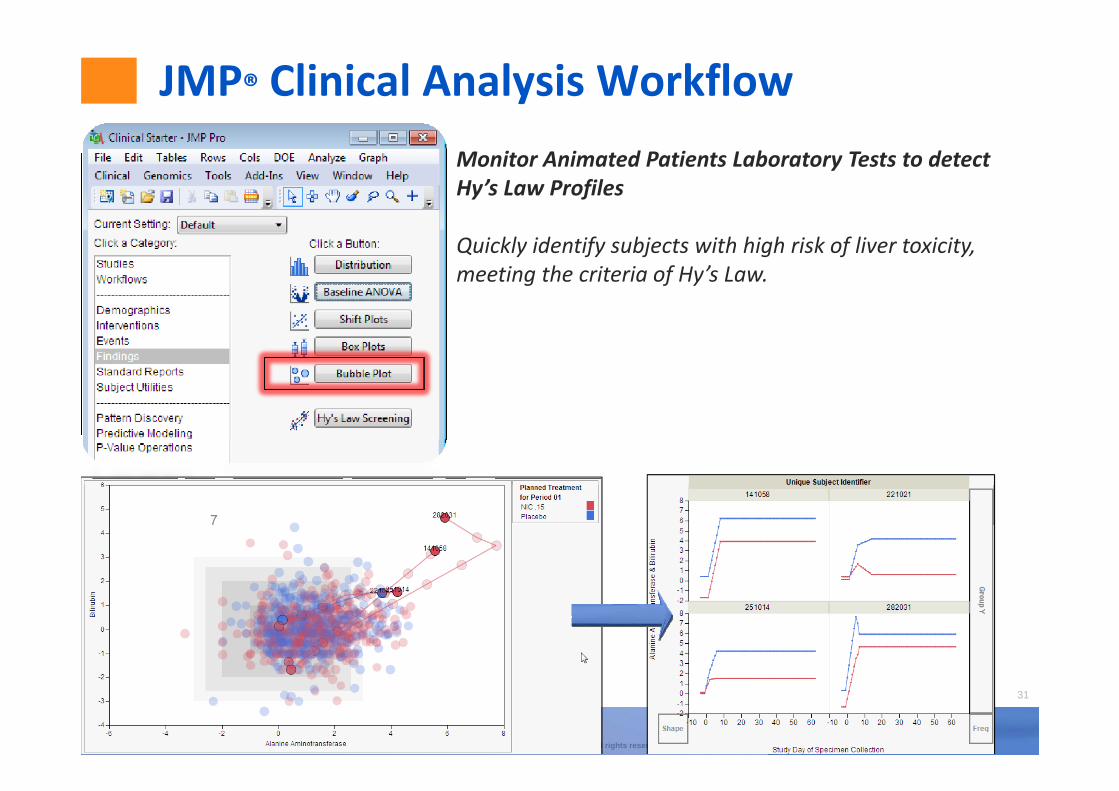
JMP® Clinical Analysis WorkflowMonitor Animated Patients Laboratory Tests to detect Hy’s Law Profiles
Quickly identify subjects with high risk of liver toxicity, meeting the criteria of Hy’s Law.
31
Copyright © 2010, SAS Institute Inc. All rights reserved.
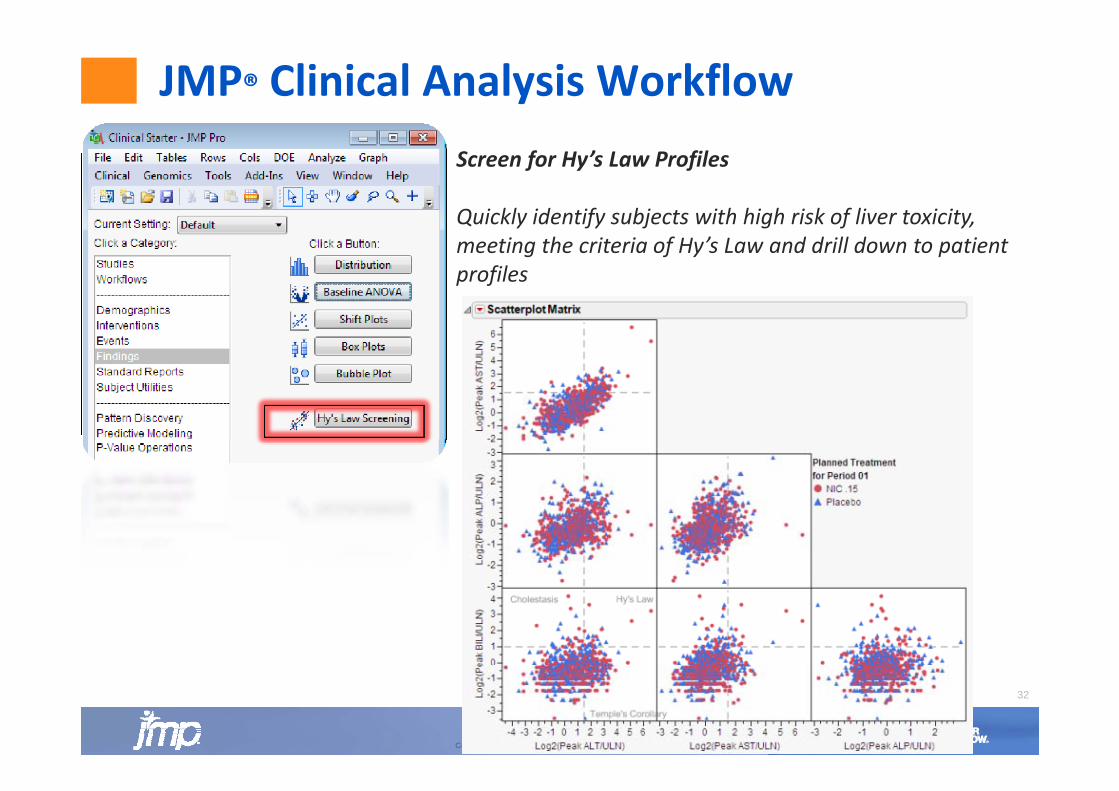
JMP® Clinical Analysis WorkflowScreen for Hy’s Law Profiles
Quickly identify subjects with high risk of liver toxicityQuickly identify subjects with high risk of liver toxicity, meeting the criteria of Hy’s Law and drill down to patient profiles
32
Copyright © 2010, SAS Institute Inc. All rights reserved.
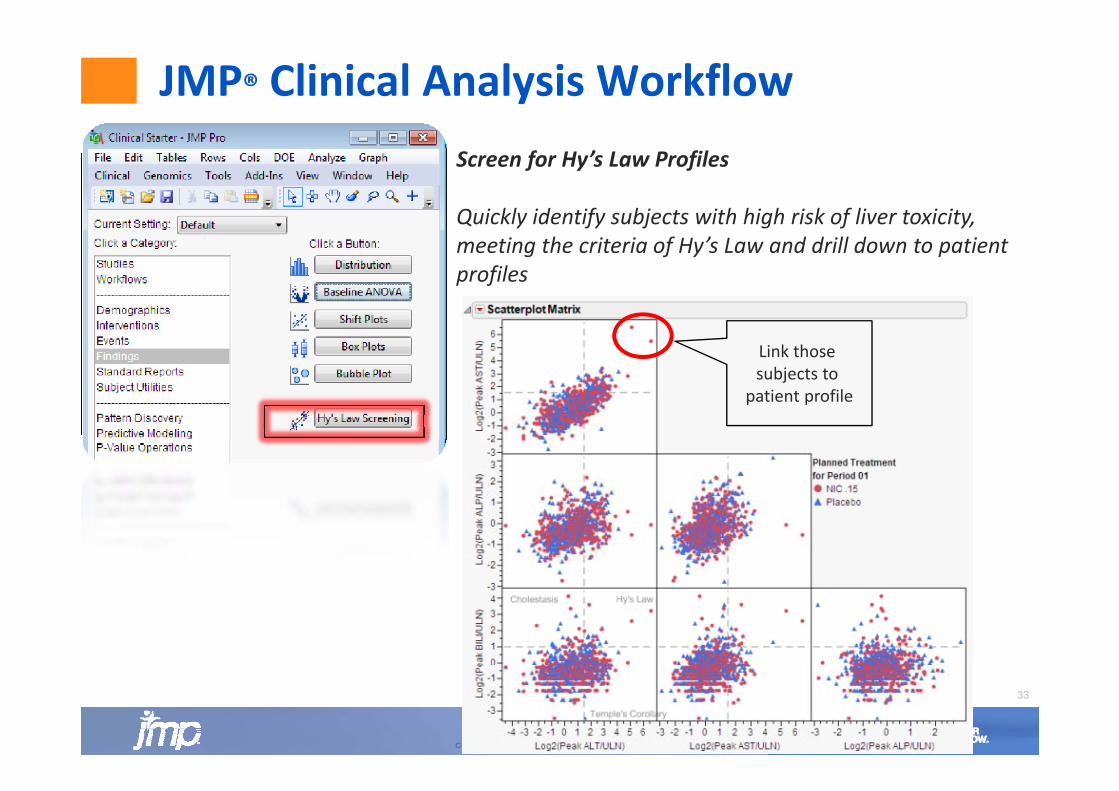
JMP® Clinical Analysis WorkflowScreen for Hy’s Law Profiles
Quickly identify subjects with high risk of liver toxicityQuickly identify subjects with high risk of liver toxicity, meeting the criteria of Hy’s Law and drill down to patient profiles
Link those subjects to
patient profilepatient profile
33
Copyright © 2010, SAS Institute Inc. All rights reserved.
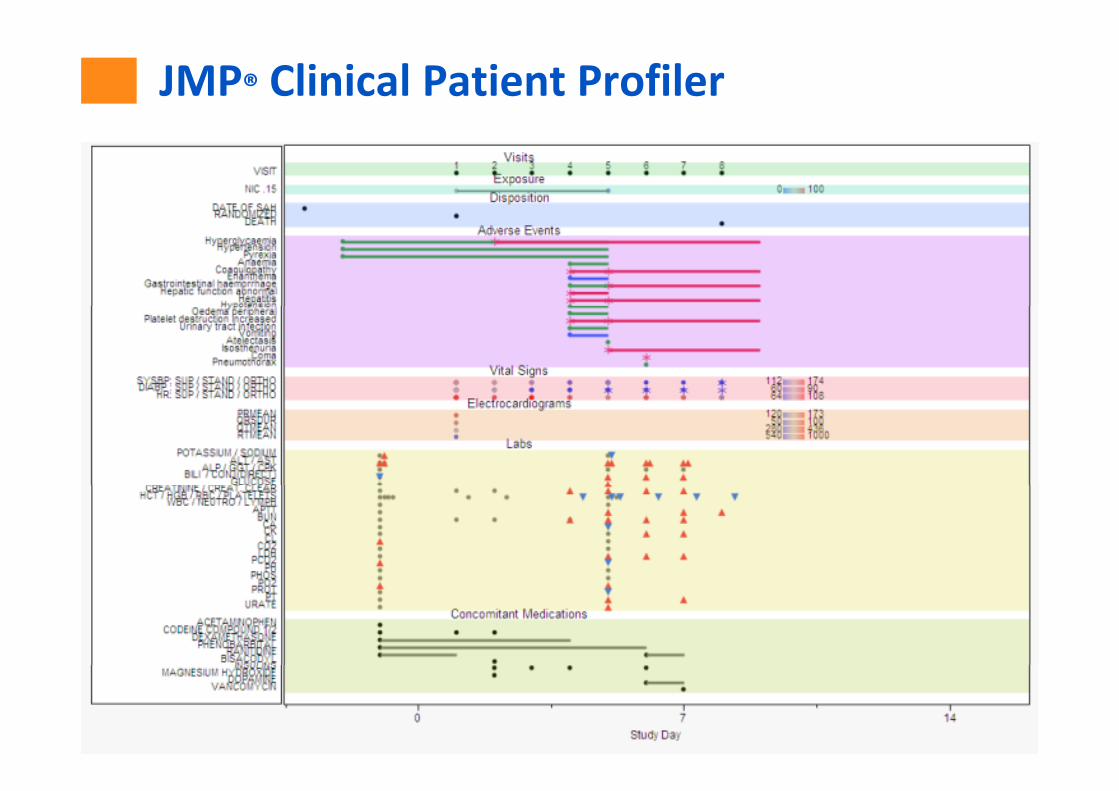
JMP® Clinical Patient Profiler
34
Copyright © 2010, SAS Institute Inc. All rights reserved.
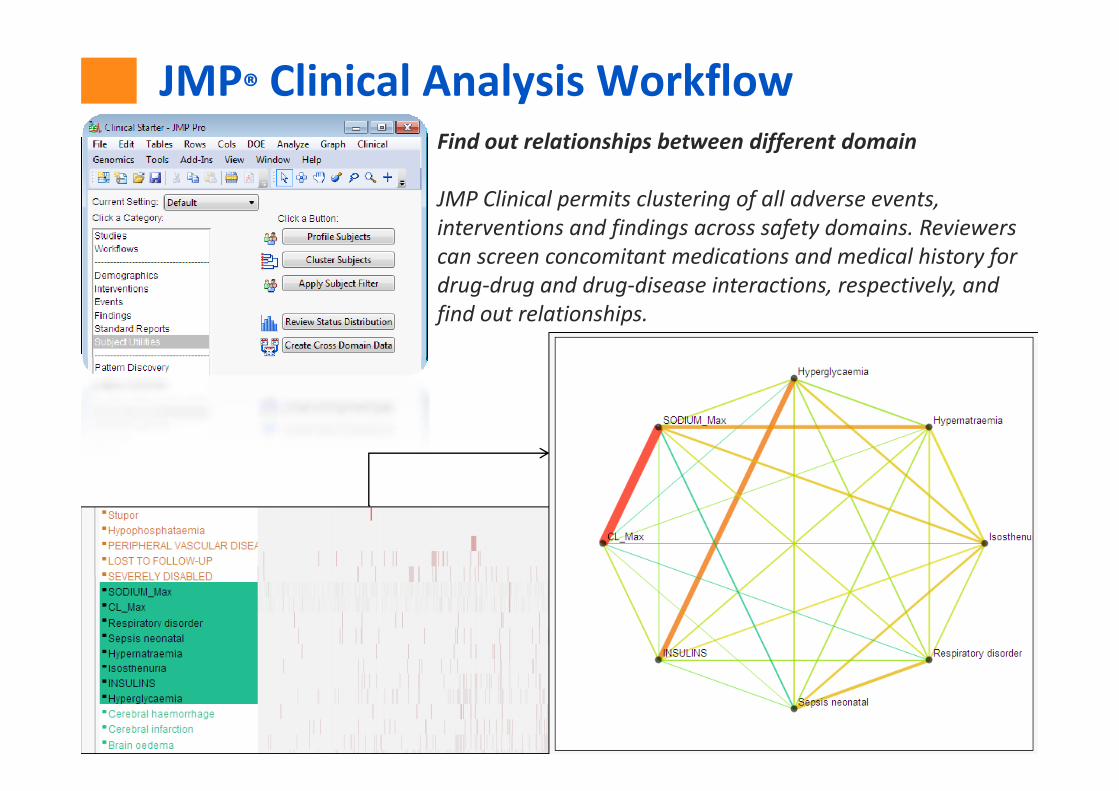
JMP® Clinical Analysis WorkflowFind out relationships between different domain
JMP Clinical permits clustering of all adverse events, interventions and findings across safety domains. Reviewers can screen concomitant medications and medical history for drug‐drug and drug‐disease interactions, respectively, and fi d l i hifind out relationships.
35
Copyright © 2010, SAS Institute Inc. All rights reserved.
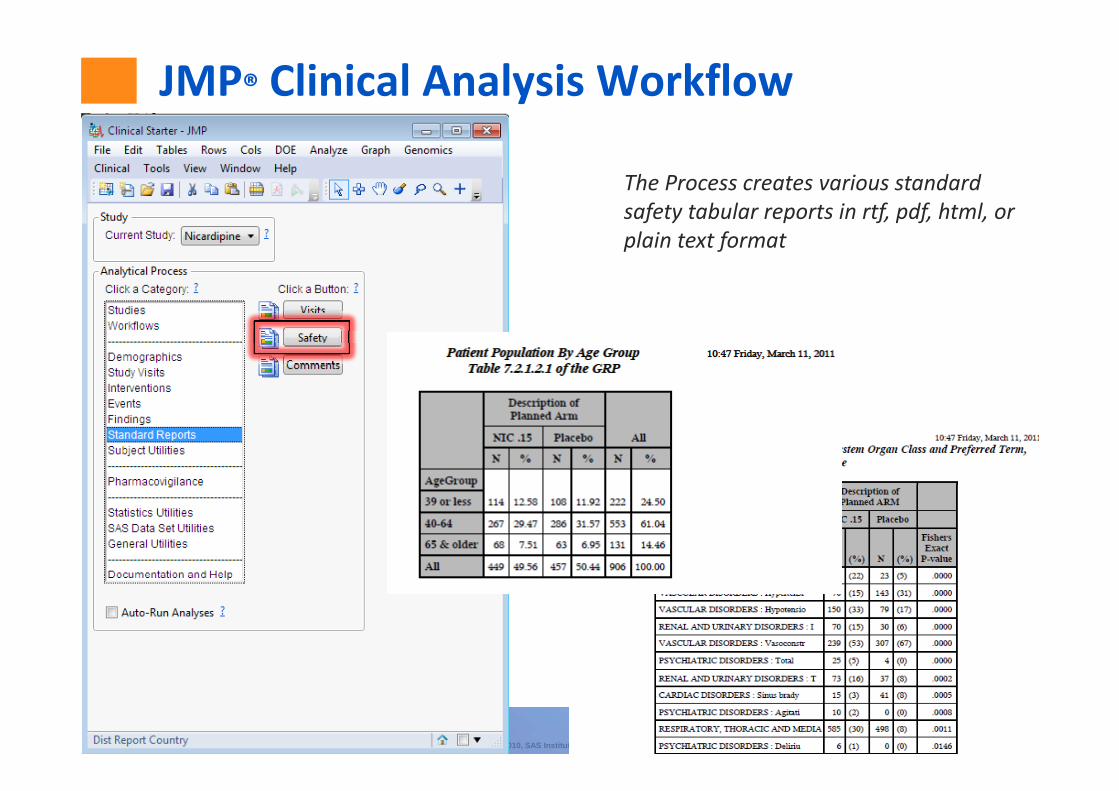
JMP® Clinical Analysis Workflow
The Process creates various standard safety tabular reports in rtf pdf html orsafety tabular reports in rtf, pdf, html, or plain text format
36
Copyright © 2010, SAS Institute Inc. All rights reserved.
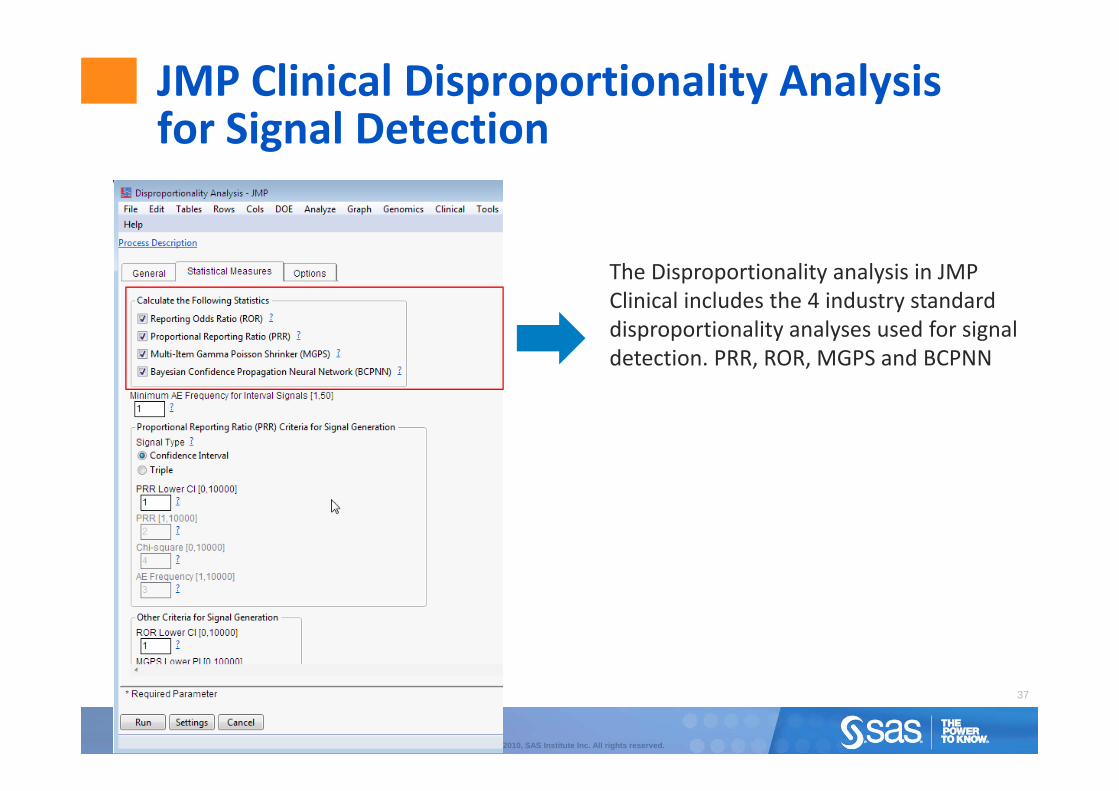
JMP Clinical Disproportionality Analysis for Signal Detectionfor Signal Detection
The Disproportionality analysis in JMP Clinical includes the 4 industry standardClinical includes the 4 industry standard disproportionality analyses used for signal detection. PRR, ROR, MGPS and BCPNN
37
Copyright © 2010, SAS Institute Inc. All rights reserved.
JMP Clinical Disproportionality Analysis for Signal Detectionfor Signal Detection
Disproportionality analysis is associated to “Signal Detection” in Pharmacovigilance.
Pharmacovigilance, abbreviated PV, is the pharmacological science to detect signal or adverse events (ae) once the drug i th k t ( t b i i ) i il t dis on the market (post‐submission), similar to drug‐aesurveillance.
Th Di ti lit l i i JMP Cli i l i l d th 4 The Disproportionality analysis in JMP Clinical includes the 4 industry standard disproportionality analyses used for signal detection.
38
Copyright © 2010, SAS Institute Inc. All rights reserved.
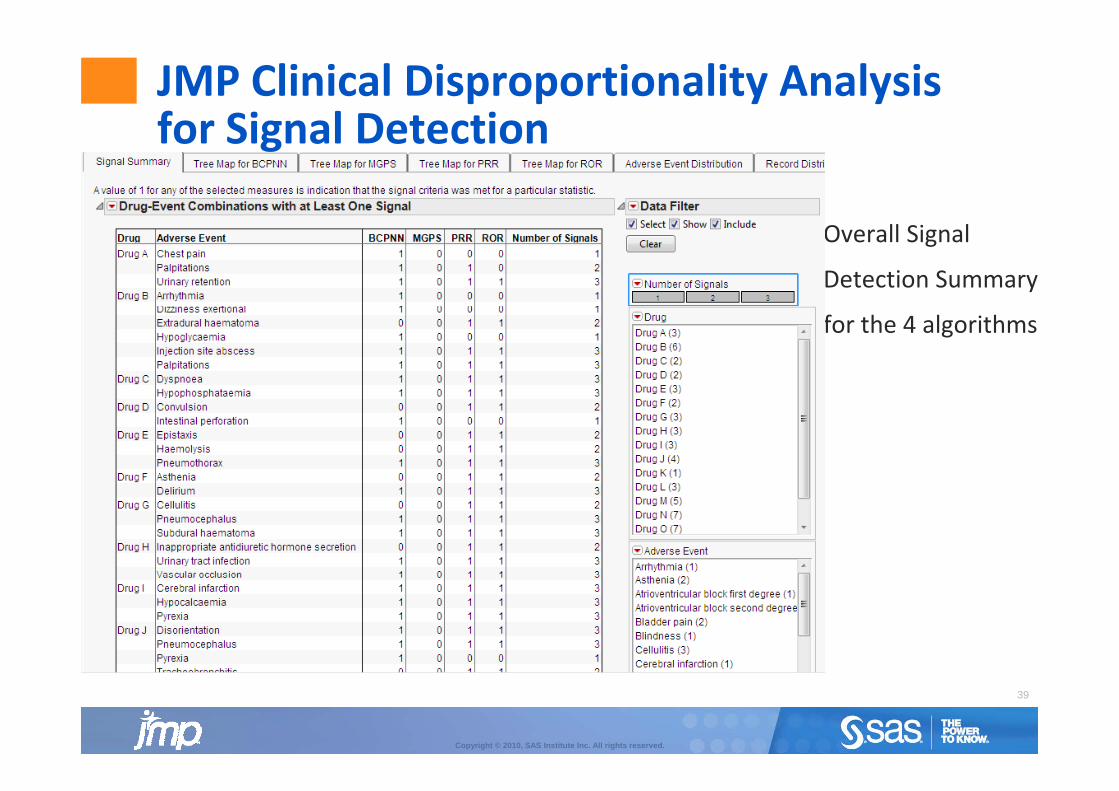
JMP Clinical Disproportionality Analysis for Signal Detectionfor Signal Detection
Overall Signal
Detection Summary
for the 4 algorithms
39
Copyright © 2010, SAS Institute Inc. All rights reserved.
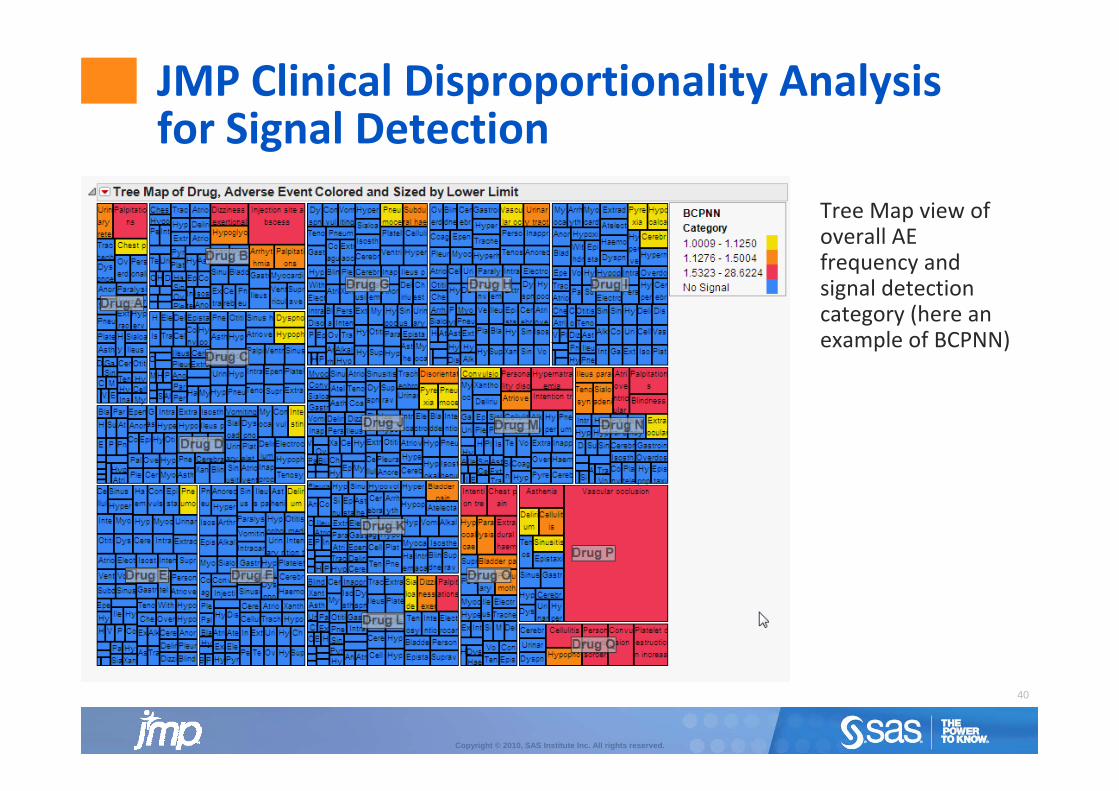
JMP Clinical Disproportionality Analysis for Signal Detectionfor Signal Detection
Tree Map view ofTree Map view of overall AE frequency and signal detection
(hcategory (here an example of BCPNN)
40
Copyright © 2010, SAS Institute Inc. All rights reserved.
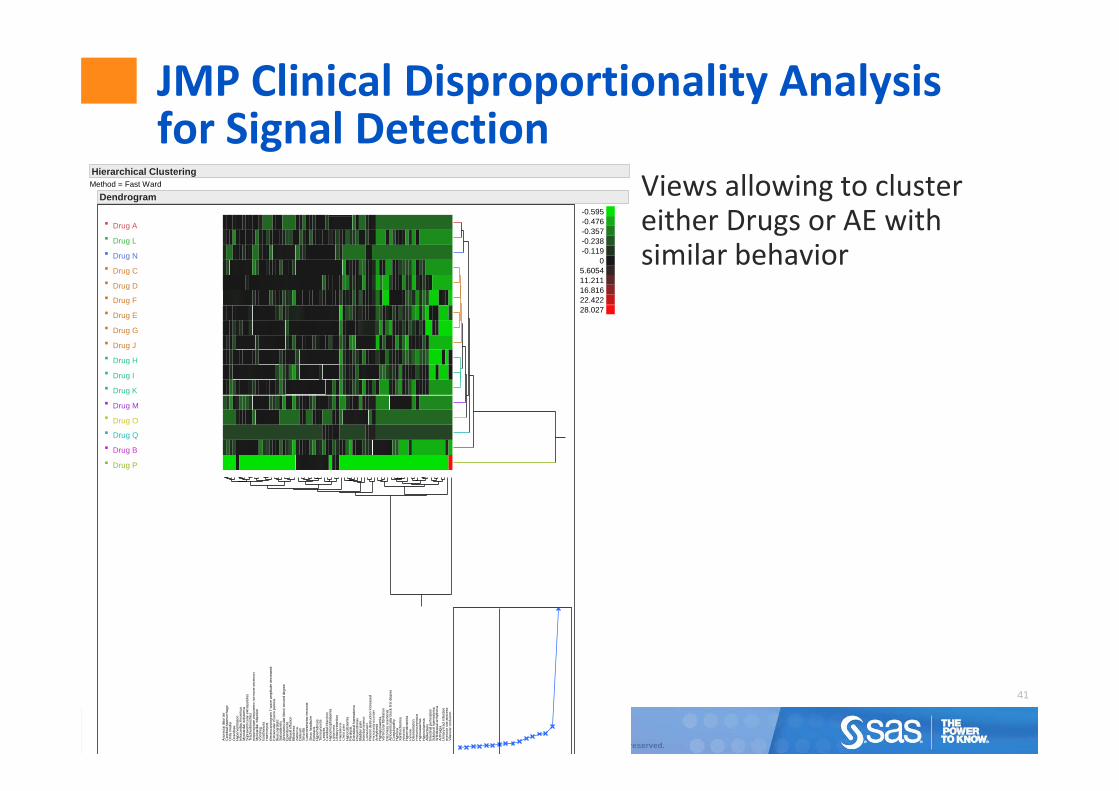
JMP Clinical Disproportionality Analysis for Signal Detectionfor Signal Detection
Views allowing to cluster either Drugs or AE with
Method = Fast Ward
-0.595
Dendrogram
Hierarchical Clustering
either Drugs or AE with similar behavior
Drug A
Drug C
Drug D
Drug F
Drug L
Drug N
-0.476-0.357-0.238-0.119
05.605411.21116.81622.422
Drug E
Drug G
Drug H
Drug I
Drug J
Drug K
28.027
Drug B
Drug M
Drug O
Drug P
Drug Q
41
Copyright © 2010, SAS Institute Inc. All rights reserved.
Anor
ecta
l dis
orde
r
Asth
enia
Cel
lulit
is
Cer
ebra
l hae
mor
rhag
e
Cer
ebra
l inf
arct
ion
Che
st p
ain
Con
vuls
ion
Del
irium
Dys
pnoe
a
Epis
taxi
s
Extra
ocul
ar m
uscl
e pa
resi
s
Gas
troin
test
inal
nec
rosi
s
Hyp
erhi
dros
is
Hyp
erve
ntila
tion
Hyp
ocal
caem
ia
Hyp
opho
spha
taem
ia
Ileus
par
alyt
ic
Inap
prop
riate
ant
idiu
retic
hor
mon
e se
cret
ion
Intra
card
iac
thro
mbu
s
Myo
card
ial i
nfar
ctio
n
Myo
card
ial i
scha
emia
Otit
is m
edia
Ove
rdos
e
Palp
itatio
ns
Para
lysi
s
Pers
onal
ity d
isor
der
Plat
elet
des
truct
ion
incr
ease
d
Pneu
mot
hora
x
Sial
oade
nitis
Sinu
s he
adac
he
Supr
aven
tricu
lar e
xtra
syst
oles
Teno
syno
vitis
Trac
heob
ronc
hitis
Urin
ary
rete
ntio
n
Vom
iting
Arrh
ythm
ia
Atrio
vent
ricul
ar b
lock
firs
t deg
ree
Atrio
vent
ricul
ar b
lock
sec
ond
degr
ee
Blad
der p
ain
Coa
gulo
path
y
Diz
zine
ss e
xerti
onal
Elec
troca
rdio
gram
T w
ave
ampl
itude
dec
reas
ed
Epen
dym
itis
Extra
dura
l hae
mat
oma
Hae
mol
ysis
Hyp
ogly
caem
ia
Hyp
oxia
Inje
ctio
n si
te a
bsce
ss
Inte
ntio
n tre
mor
Isos
then
uria
Pleu
ral e
ffusi
on
Pyre
xia
Sinu
sitis
Vent
ricul
ar fi
brill
atio
n
Alka
losi
s
Blin
dnes
s
Hyp
erna
traem
ia
Hyp
okal
aem
iaH
ypov
olae
mia
Pneu
moc
epha
lus
Xant
hoch
rom
ia
Atel
ecta
sis
Inte
stin
al p
erfo
ratio
n
Dis
orie
ntat
ion
Subd
ural
hae
mat
oma
Vasc
ular
occ
lusi
on
With
draw
al a
rrhy
thm
iaAr
thra
lgia
Urin
ary
tract
infe
ctio
n
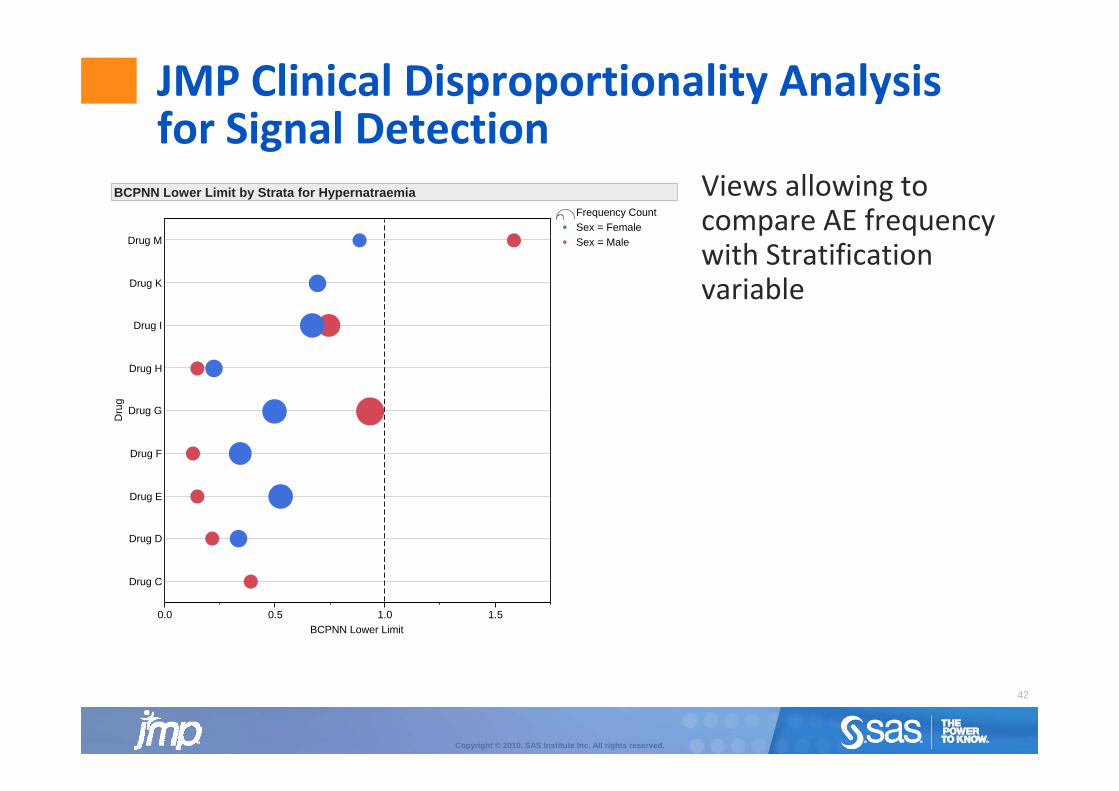
JMP Clinical Disproportionality Analysis for Signal Detectionfor Signal Detection
Views allowing to compare AE frequencyFrequency Count
BCPNN Lower Limit by Strata for HypernatraemiaFrequency Count
BCPNN Lower Limit by Strata for Hypernatraemia
compare AE frequency with Stratification variableDrug K
Drug M
q ySex = FemaleSex = Male
Drug K
Drug M
q ySex = FemaleSex = Male
Drug H
Drug I
Drug H
Drug I
Dru
g
Drug F
Drug G
Dru
g
Drug F
Drug G
Drug D
Drug E
Drug D
Drug E
Drug C
0.0 0.5 1.0 1.5BCPNN Lower Limit
Drug C
0.0 0.5 1.0 1.5BCPNN Lower Limit
42
Copyright © 2010, SAS Institute Inc. All rights reserved.
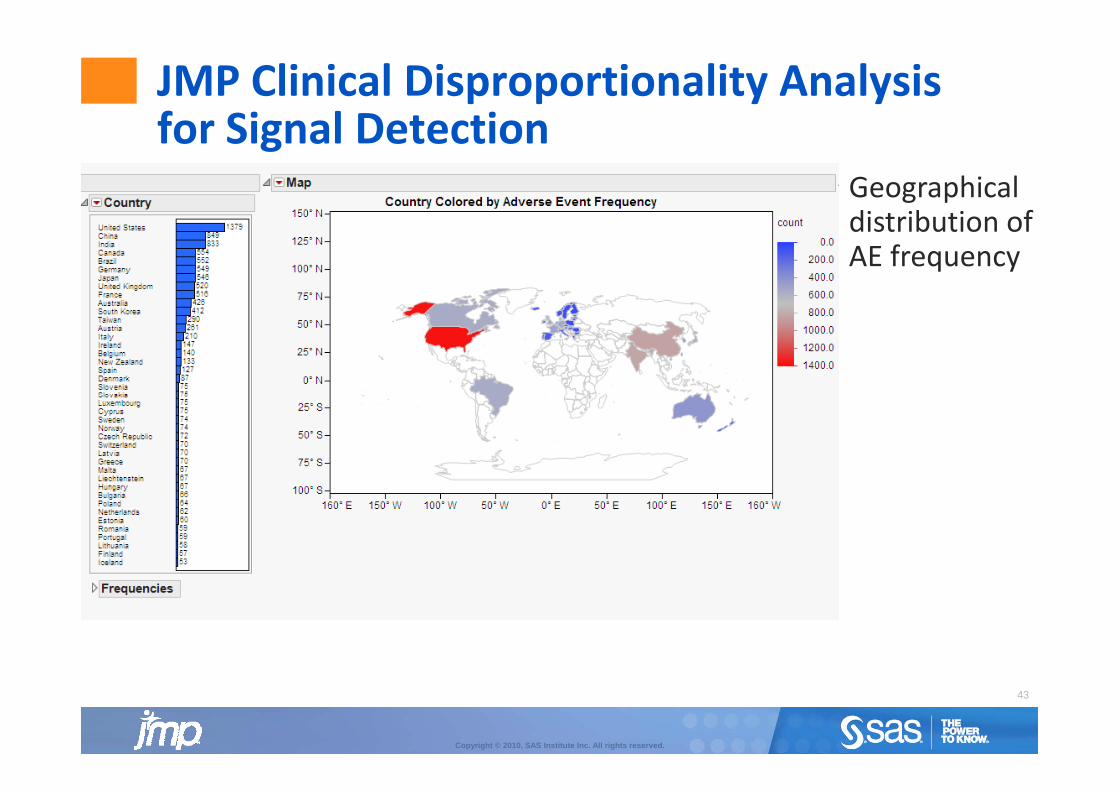
JMP Clinical Disproportionality Analysis for Signal Detectionfor Signal Detection
Geographical di t ib ti fdistribution of AE frequency
43
Copyright © 2010, SAS Institute Inc. All rights reserved.
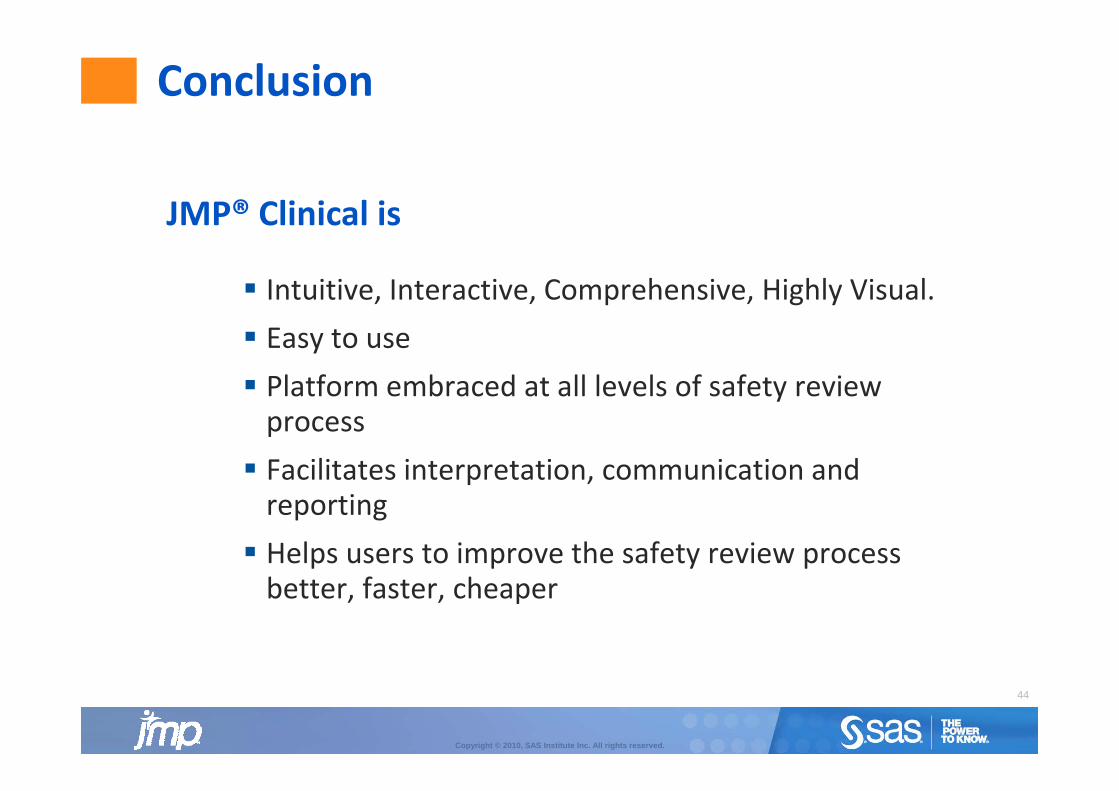
Conclusion
JMP® Clinical is
Intuitive, Interactive, Comprehensive, Highly Visual.
JMP Clinical is
Easy to use Platform embraced at all levels of safety reviewPlatform embraced at all levels of safety review process Facilitates interpretation, communication and reporting Helps users to improve the safety review process better, faster, cheaper
44
Copyright © 2010, SAS Institute Inc. All rights reserved.
For more information,
ask for a demo
i it
htt // j / ft / li i l/
or visit
Copyright © 2010 SAS Institute Inc. All rights reserved.
http://www.jmp.com/software/clinical/