Embed Size (px)
Citation preview
2
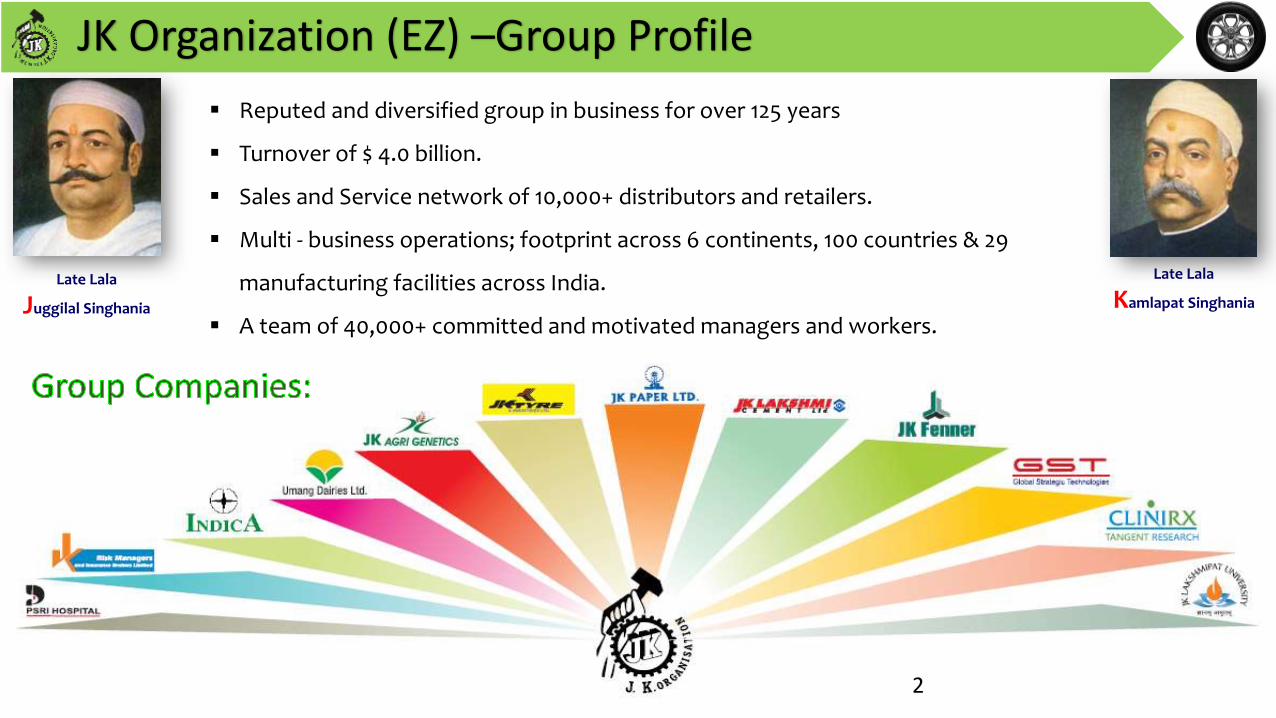
JK Organization (EZ) –Group Profile
Reputed and diversified group in business for over 125 years
Turnover of $ 4.0 billion.
Sales and Service network of 10,000+ distributors and retailers.
Multi - business operations; footprint across 6 continents, 100 countries & 29
manufacturing facilities across India.
A team of 40,000+ committed and motivated managers and workers.
Late Lala
Juggilal Singhania
Late Lala
Kamlapat Singhania
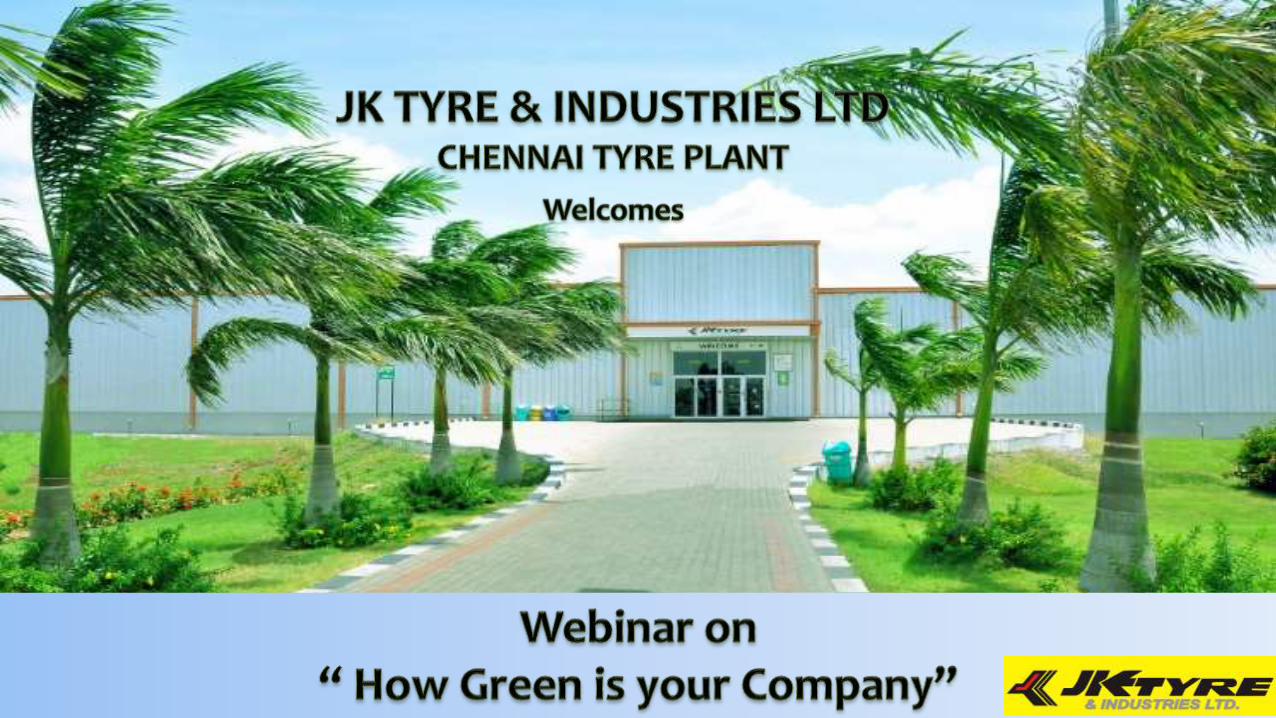
JK Tyre : Vision ,Mission, Values
3
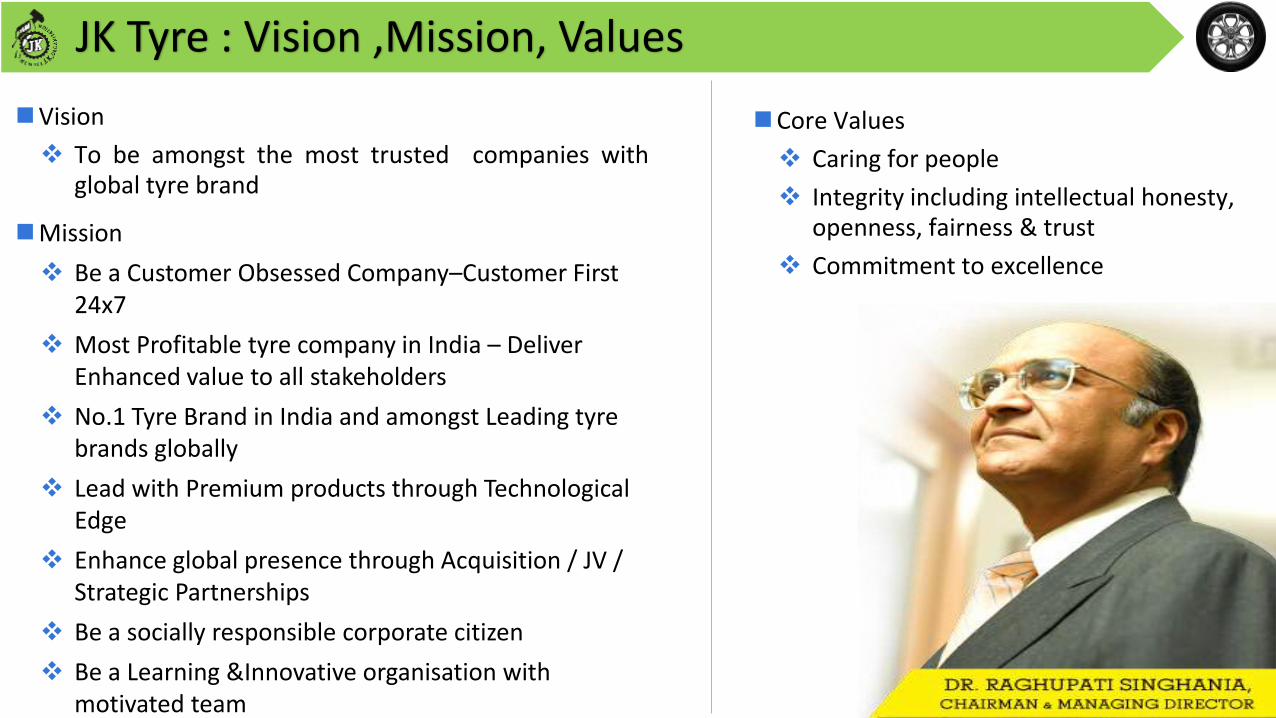
Vision
To be amongst the most trusted companies withglobal tyre brand
Mission
Be a Customer Obsessed Company–Customer First 24x7
Most Profitable tyre company in India – Deliver Enhanced value to all stakeholders
No.1 Tyre Brand in India and amongst Leading tyre brands globally
Lead with Premium products through Technological Edge
Enhance global presence through Acquisition / JV / Strategic Partnerships
Be a socially responsible corporate citizen
Be a Learning &Innovative organisation with motivated team
Core Values
Caring for people
Integrity including intellectual honesty, openness, fairness & trust
Commitment to excellence
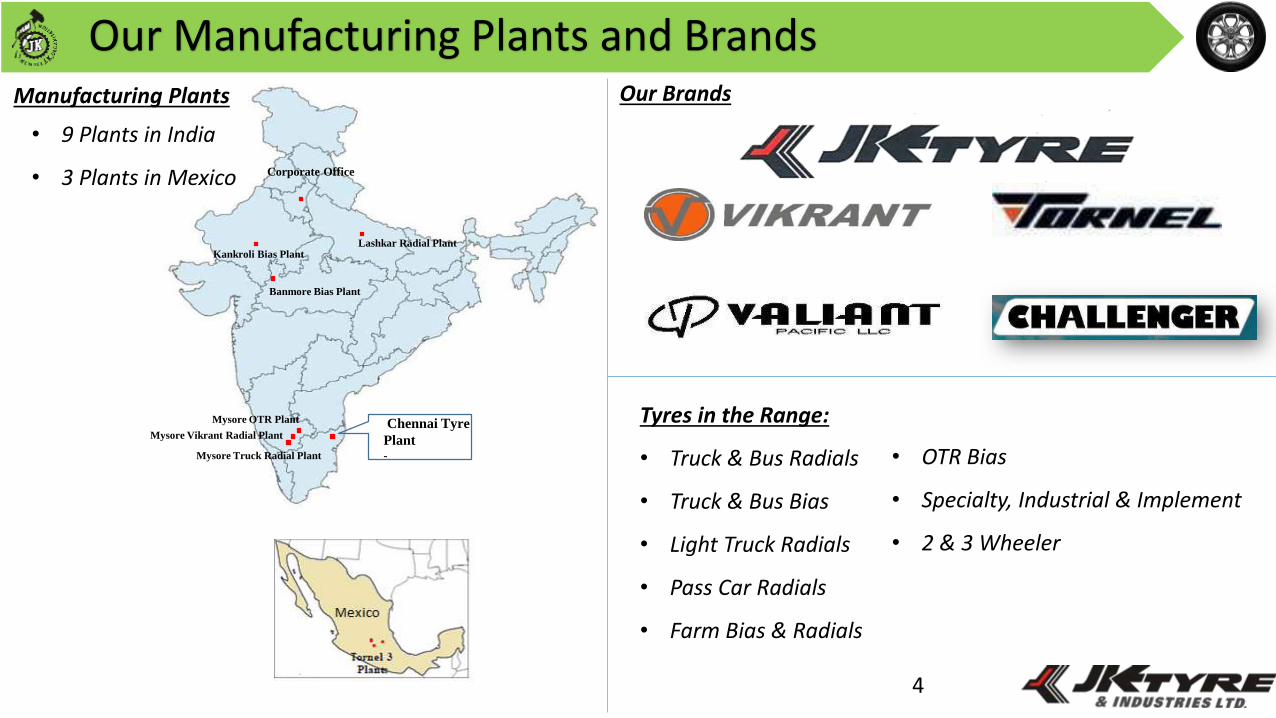
Our Manufacturing Plants and Brands
4
Corporate Office
Mysore OTR Plant
Banmore Bias Plant
Lashkar Radial Plant
Chennai Tyre
Plant-Mysore Truck Radial Plant
Mysore Vikrant Radial Plant
Kankroli Bias Plant
Tyres in the Range:
• Truck & Bus Radials
• Truck & Bus Bias
• Light Truck Radials
• Pass Car Radials
• Farm Bias & Radials
• OTR Bias
• Specialty, Industrial & Implement
• 2 & 3 Wheeler
Manufacturing Plants
• 9 Plants in India
• 3 Plants in Mexico
Our Brands
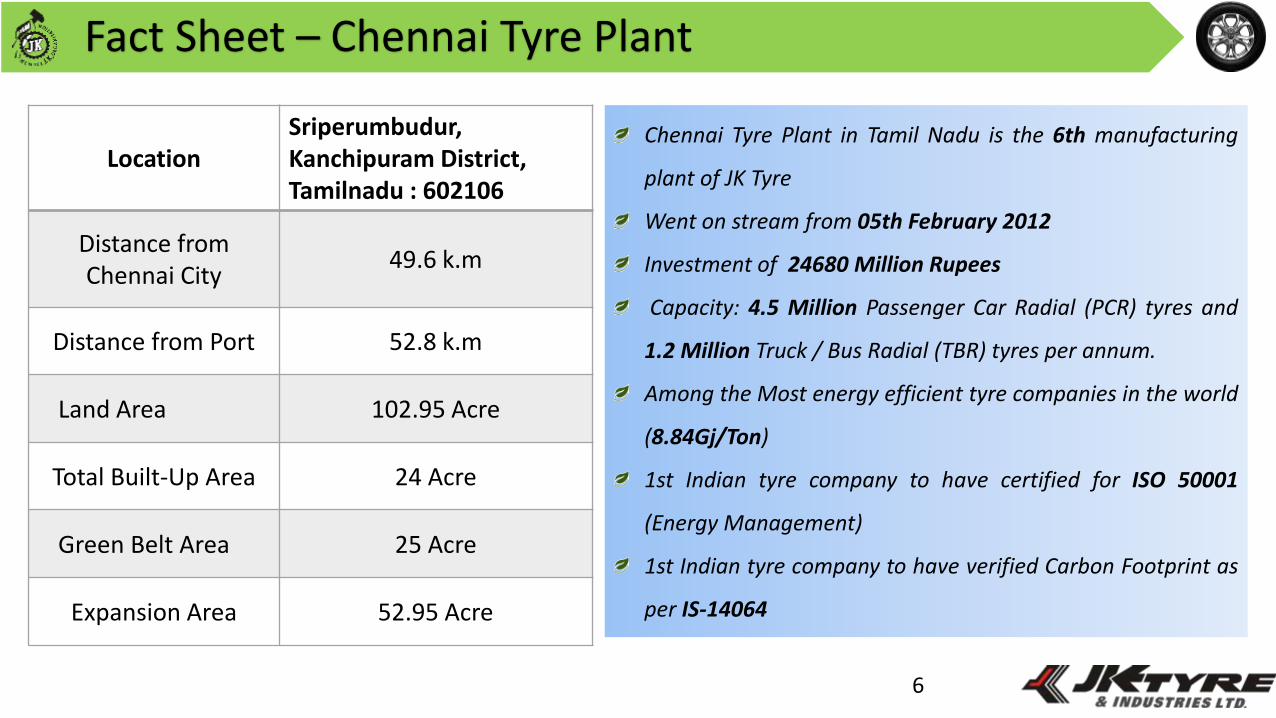
Fact Sheet – Chennai Tyre Plant
LocationSriperumbudur, Kanchipuram District, Tamilnadu : 602106
Distance from Chennai City
49.6 k.m
Distance from Port 52.8 k.m
Land Area 102.95 Acre
Total Built-Up Area 24 Acre
Green Belt Area 25 Acre
Expansion Area 52.95 Acre
6
Chennai Tyre Plant in Tamil Nadu is the 6th manufacturing
plant of JK Tyre
Went on stream from 05th February 2012
Investment of 24680 Million Rupees
Capacity: 4.5 Million Passenger Car Radial (PCR) tyres and
1.2 Million Truck / Bus Radial (TBR) tyres per annum.
Among the Most energy efficient tyre companies in the world
(8.84Gj/Ton)
1st Indian tyre company to have certified for ISO 50001
(Energy Management)
1st Indian tyre company to have verified Carbon Footprint as
per IS-14064
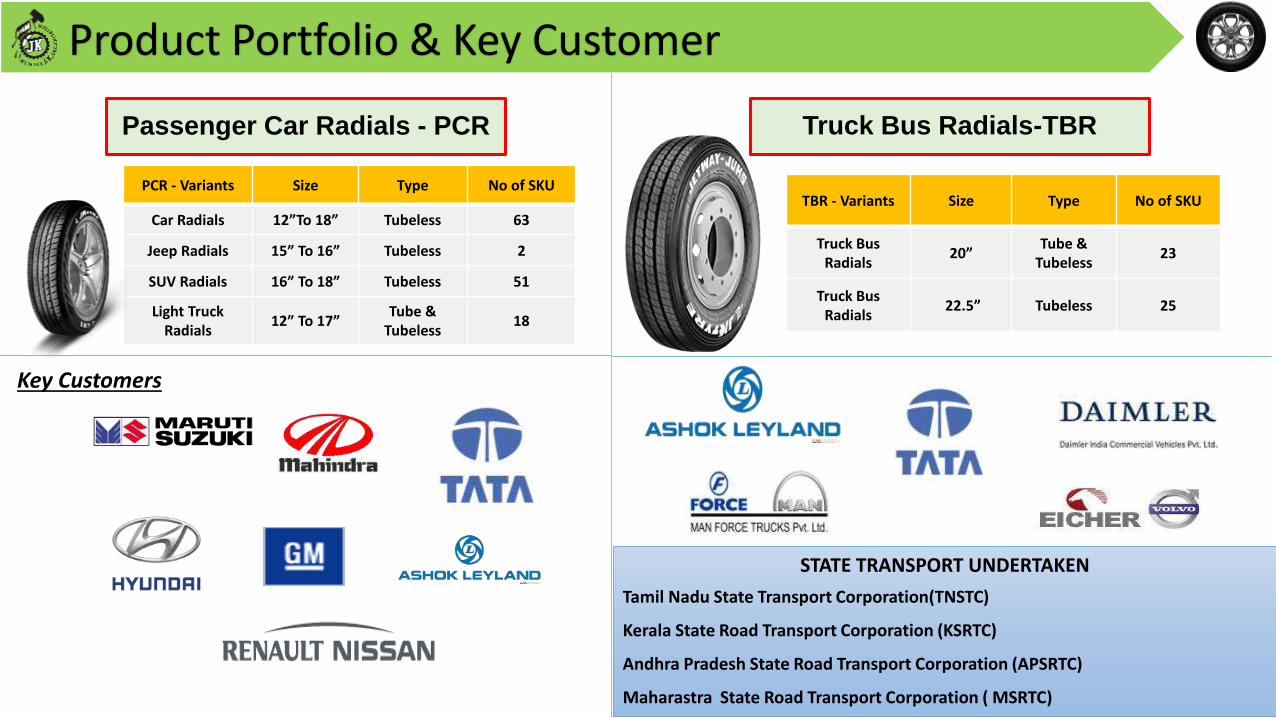
Product Portfolio & Key Customer
Passenger Car Radials - PCR
PCR - Variants Size Type No of SKU
Car Radials 12”To 18” Tubeless 63
Jeep Radials 15” To 16” Tubeless 2
SUV Radials 16” To 18” Tubeless 51
Light Truck Radials
12” To 17”Tube &
Tubeless18
TBR - Variants Size Type No of SKU
Truck Bus Radials
20”Tube &
Tubeless 23
Truck Bus Radials
22.5” Tubeless 25
Truck Bus Radials-TBR
7
STATE TRANSPORT UNDERTAKEN
Tamil Nadu State Transport Corporation(TNSTC)
Kerala State Road Transport Corporation (KSRTC)
Andhra Pradesh State Road Transport Corporation (APSRTC)
Maharastra State Road Transport Corporation ( MSRTC)
Key Customers
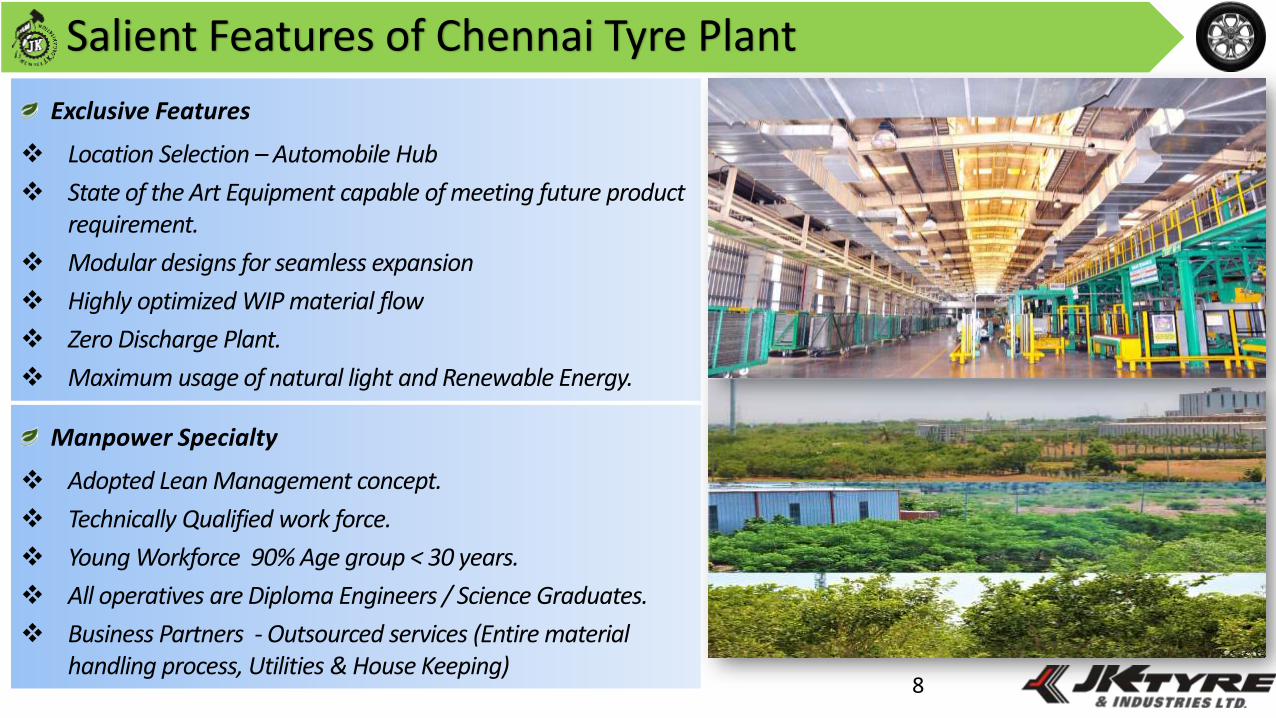
Salient Features of Chennai Tyre Plant
Exclusive Features
Location Selection –Automobile Hub
State of the Art Equipment capable of meeting future product requirement.
Modular designs for seamless expansion
Highly optimized WIP material flow
Zero Discharge Plant.
Maximum usage of natural light and Renewable Energy.
Manpower Specialty
Adopted Lean Management concept.
Technically Qualified work force.
Young Workforce 90% Age group < 30 years.
All operatives are Diploma Engineers / Science Graduates.
Business Partners - Outsourced services (Entire material handling process, Utilities & House Keeping)
8

9
GreenCo Journey
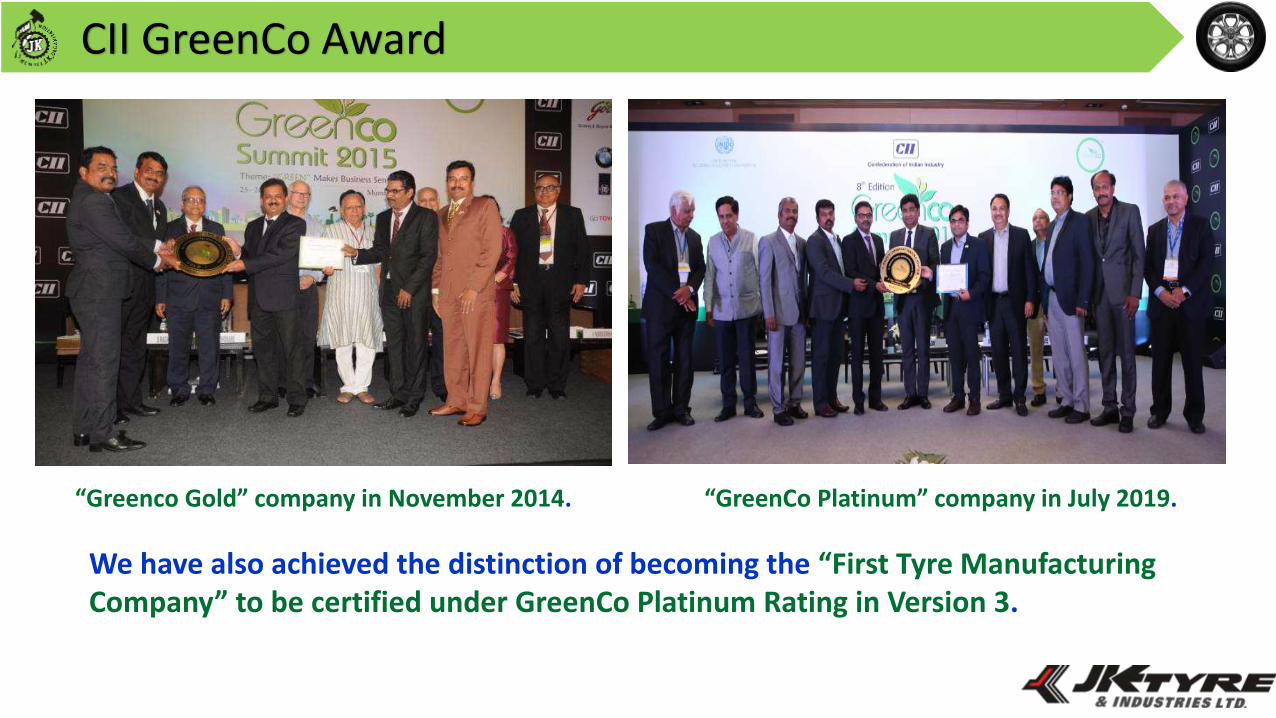
CII GreenCo Award
“Greenco Gold” company in November 2014. “GreenCo Platinum” company in July 2019.
We have also achieved the distinction of becoming the “First Tyre Manufacturing Company” to be certified under GreenCo Platinum Rating in Version 3.
11
Energy Efficiency &
Renewable Energy
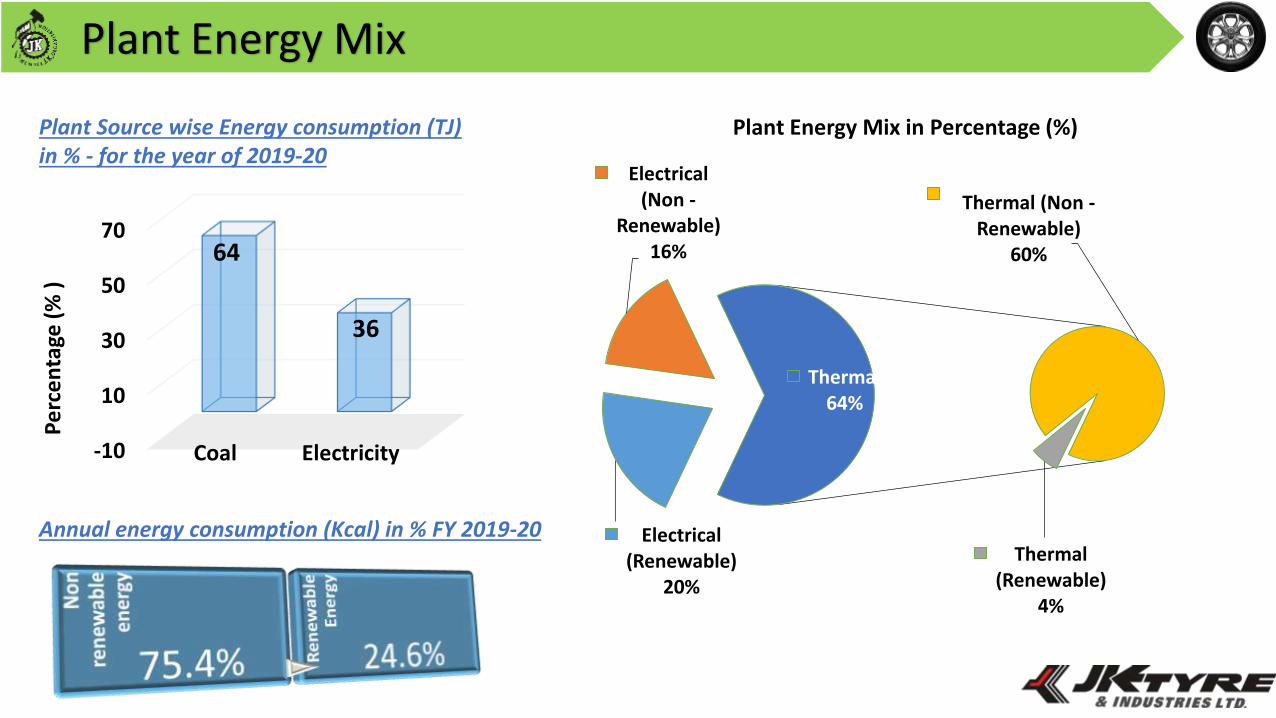
Plant Energy Mix
Electrical (Renewable)
20%
Electrical (Non -
Renewable)16%
Thermal (Renewable)
4%
Thermal (Non -Renewable)
60%
Thermal64%
Plant Energy Mix in Percentage (%)
-10
10
30
50
70
Coal Electricity
64
36
Pe
rce
nta
ge (
% )
Plant Source wise Energy consumption (TJ)in % - for the year of 2019-20
Annual energy consumption (Kcal) in % FY 2019-20
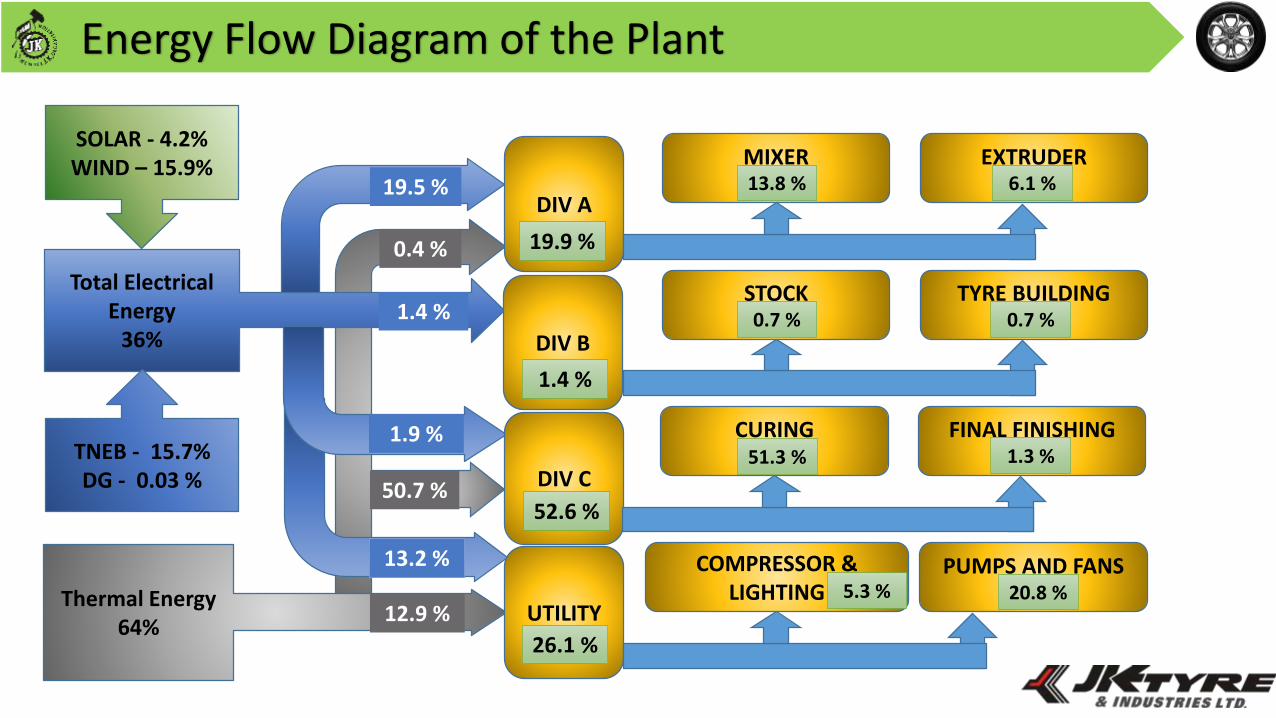
Energy Flow Diagram of the Plant
SOLAR - 4.2% WIND – 15.9%
Thermal Energy64%
Total Electrical Energy
36%
DIV A
DIV B
DIV C
UTILITY
MIXER EXTRUDER
STOCK TYRE BUILDING
CURING FINAL FINISHING
COMPRESSOR & LIGHTING
PUMPS AND FANS
TNEB - 15.7%DG - 0.03 % 50.7 %
0.4 %
12.9 %
19.5 %
1.9 %
1.4 %
13.2 %
19.9 %
1.4 %
52.6 %
26.1 %
13.8 %
0.7 %
51.3 %
5.3 % 20.8 %
1.3 %
0.7 %
6.1 %
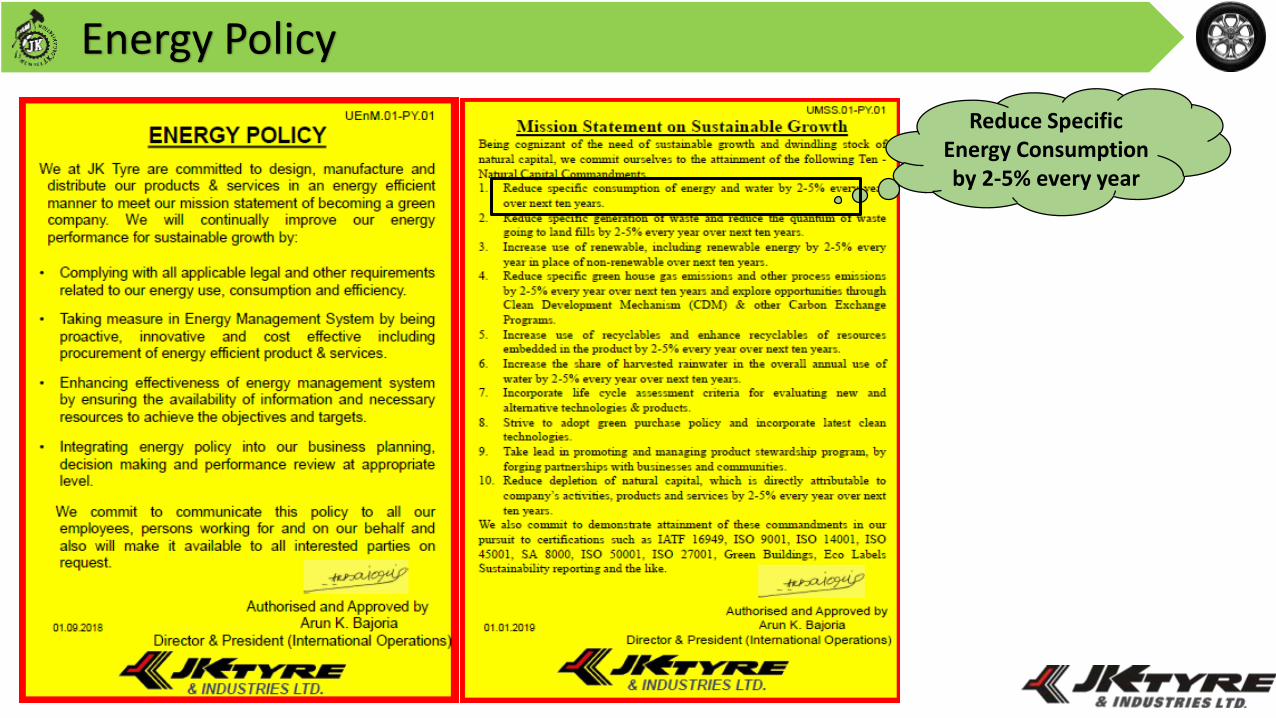
Energy Policy
Reduce Specific Energy Consumption by 2-5% every year
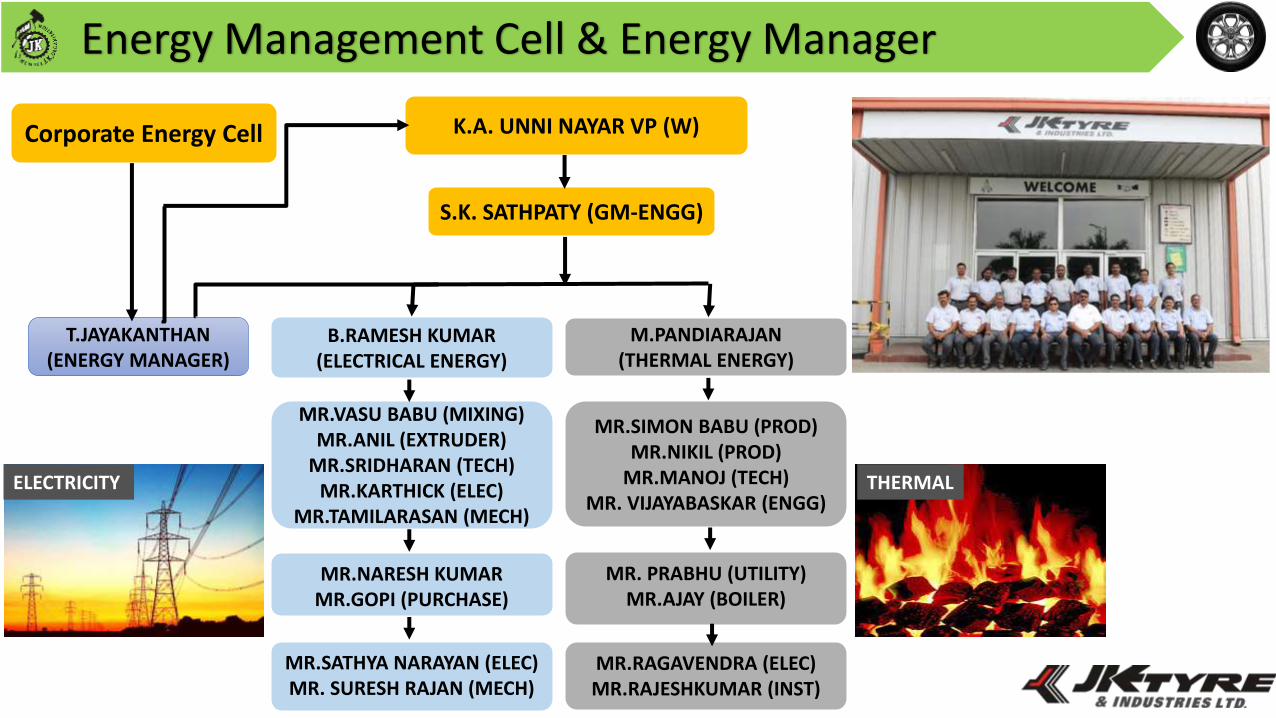
Energy Management Cell & Energy Manager
K.A. UNNI NAYAR VP (W)
S.K. SATHPATY (GM-ENGG)
MR.SIMON BABU (PROD)MR.NIKIL (PROD)
MR.MANOJ (TECH)MR. VIJAYABASKAR (ENGG)
MR.RAGAVENDRA (ELEC)MR.RAJESHKUMAR (INST)
B.RAMESH KUMAR (ELECTRICAL ENERGY)
MR.VASU BABU (MIXING)MR.ANIL (EXTRUDER)
MR.SRIDHARAN (TECH)MR.KARTHICK (ELEC)
MR.TAMILARASAN (MECH)
MR.NARESH KUMAR MR.GOPI (PURCHASE)
MR.SATHYA NARAYAN (ELEC)MR. SURESH RAJAN (MECH)
MR. PRABHU (UTILITY)MR.AJAY (BOILER)
M.PANDIARAJAN (THERMAL ENERGY)
T.JAYAKANTHAN (ENERGY MANAGER)
Corporate Energy Cell
ELECTRICITY THERMAL
Monthly Review
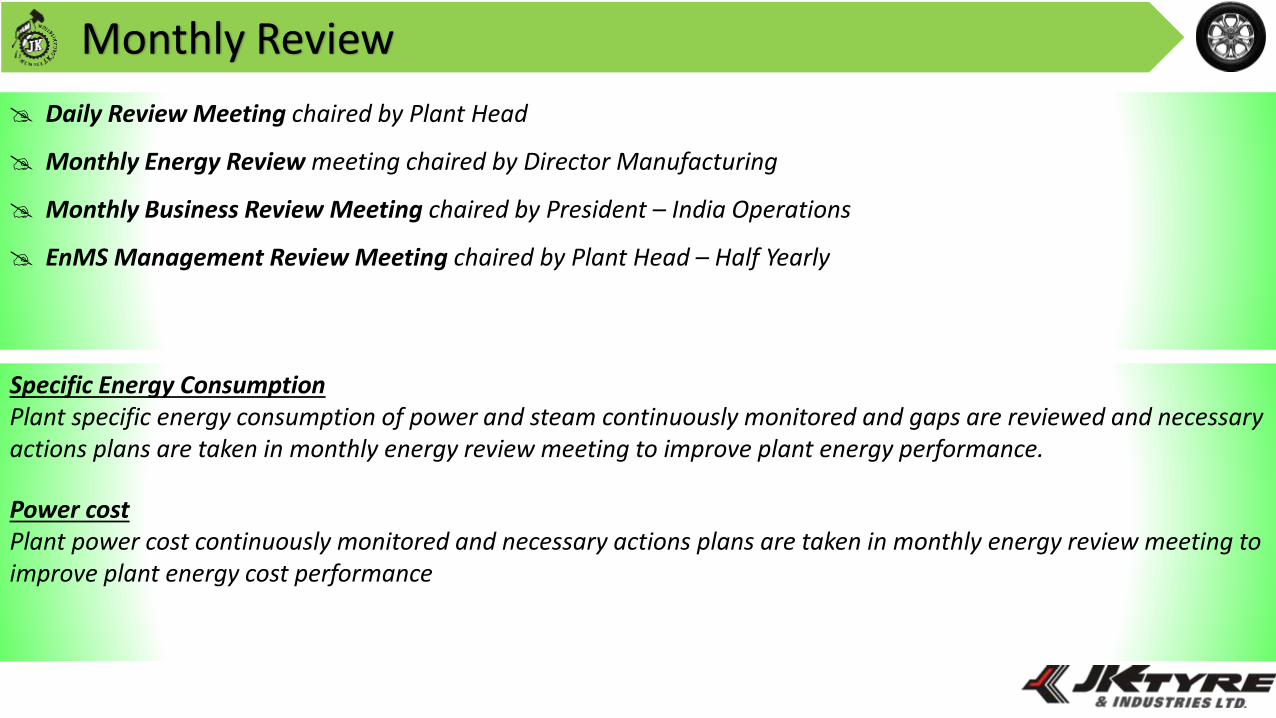
Daily Review Meeting chaired by Plant Head
Monthly Energy Review meeting chaired by Director Manufacturing
Monthly Business Review Meeting chaired by President – India Operations
EnMS Management Review Meeting chaired by Plant Head – Half Yearly
Specific Energy Consumption Plant specific energy consumption of power and steam continuously monitored and gaps are reviewed and necessary actions plans are taken in monthly energy review meeting to improve plant energy performance.
Power costPlant power cost continuously monitored and necessary actions plans are taken in monthly energy review meeting to improve plant energy cost performance
Energy Monitoring for Equipment
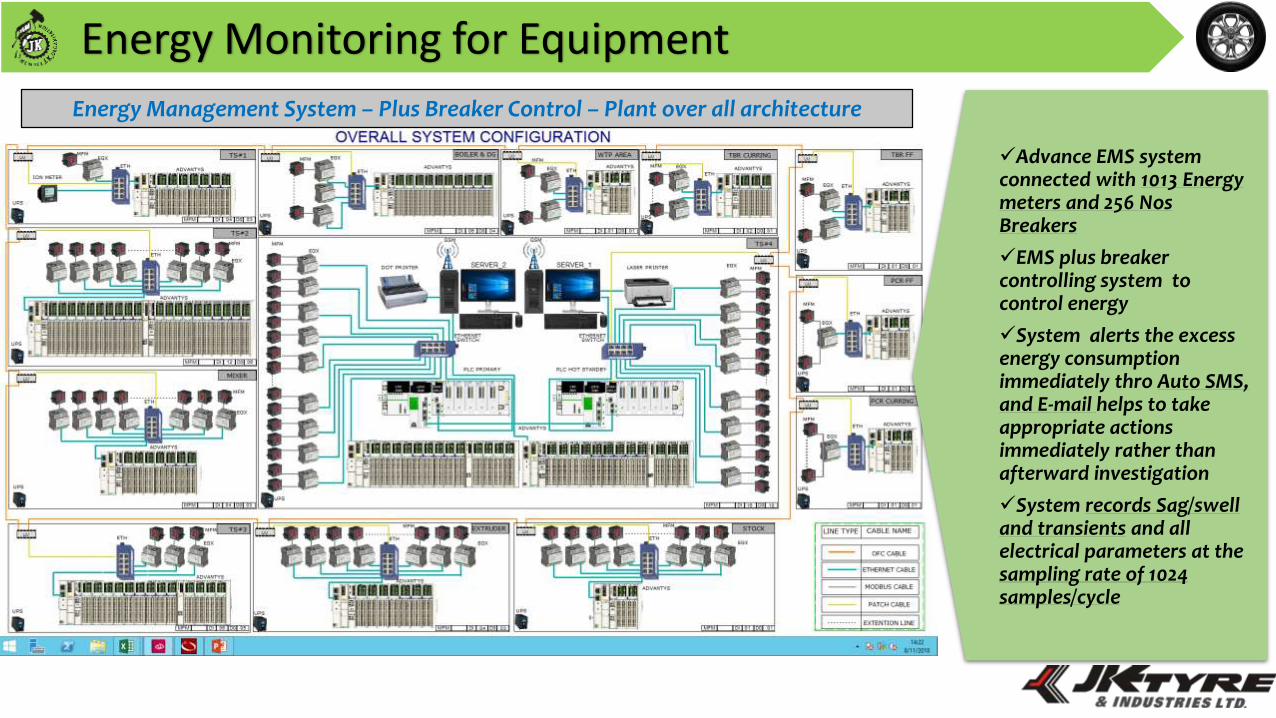
Energy Management System – Plus Breaker Control – Plant over all architecture
Advance EMS system connected with 1013 Energy meters and 256 NosBreakers
EMS plus breaker controlling system to control energy
System alerts the excess energy consumption immediately thro Auto SMS, and E-mail helps to take appropriate actions immediately rather than afterward investigation
System records Sag/swell and transients and all electrical parameters at the sampling rate of 1024 samples/cycle
Energy Monitoring for Equipment
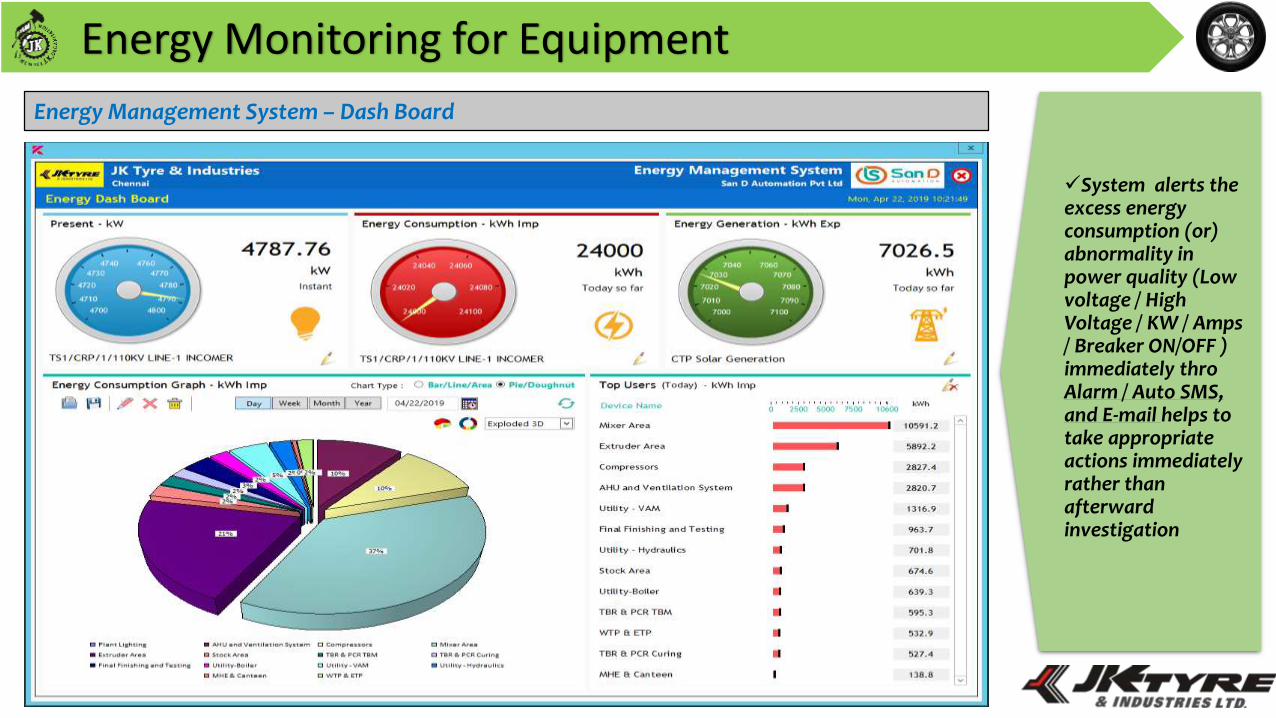
Energy Management System – Dash Board
System alerts the excess energy consumption (or) abnormality in power quality (Low voltage / High Voltage / KW / Amps / Breaker ON/OFF ) immediately thro Alarm / Auto SMS, and E-mail helps to take appropriate actions immediately rather than afterward investigation

Energy Monitoring for Equipment
Mixer, 38.28%
Extruder, 15.91%
TBM, 1.89%Stock, 1.95%
Curing, 1.73%
SEMI FIXED LOAD, 0
Boiler, 1.95%
Compressor, 8.86%
PCT, 3.23%
HWS, 0.01%
HYD, 2.32%
Final Finishing, 3.45%
FIXED LOAD, 0
VAM, 4.06%
AHU, 9.34%
Light, 3.01%
ETP/STP, 1.26%Canteen/MHE/Los
s, 2.72%VARIABLE LOAD
Mixer 38.28%Extruder 15.91%
TBM 1.89%Stock 1.95%
Curing 1.73%
SEMI FIXED LOAD
Boiler 1.95%Compressor 8.86%
PCT 3.23%HWS 0.01%
HYD 2.32%Final Finishing 3.45%
FIXED LOADVAM 4.06%AHU 9.34%Light 3.01%
ETP/STP 1.26%Canteen/MHE/Lo
ss2.72%
Electrical Power consumption – Continuous monitoring done daily in standard formats and the reasons for variations analyzed
Energy Monitoring for Equipment
43.4%
35.6%
20.0%
0.9%
TBR Curing PCR Curing
VAM Chiller 4Roll Calandar
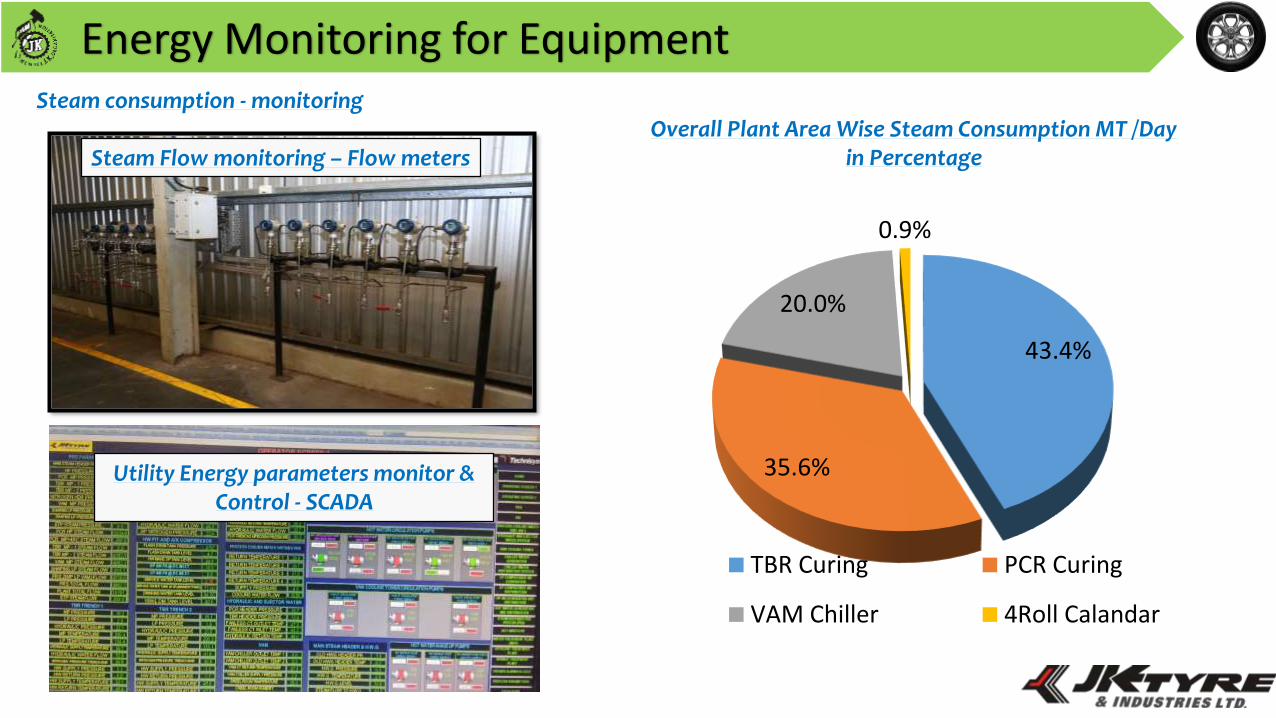
Overall Plant Area Wise Steam Consumption MT /Day in PercentageSteam Flow monitoring – Flow meters
Utility Energy parameters monitor & Control - SCADA
Steam consumption - monitoring
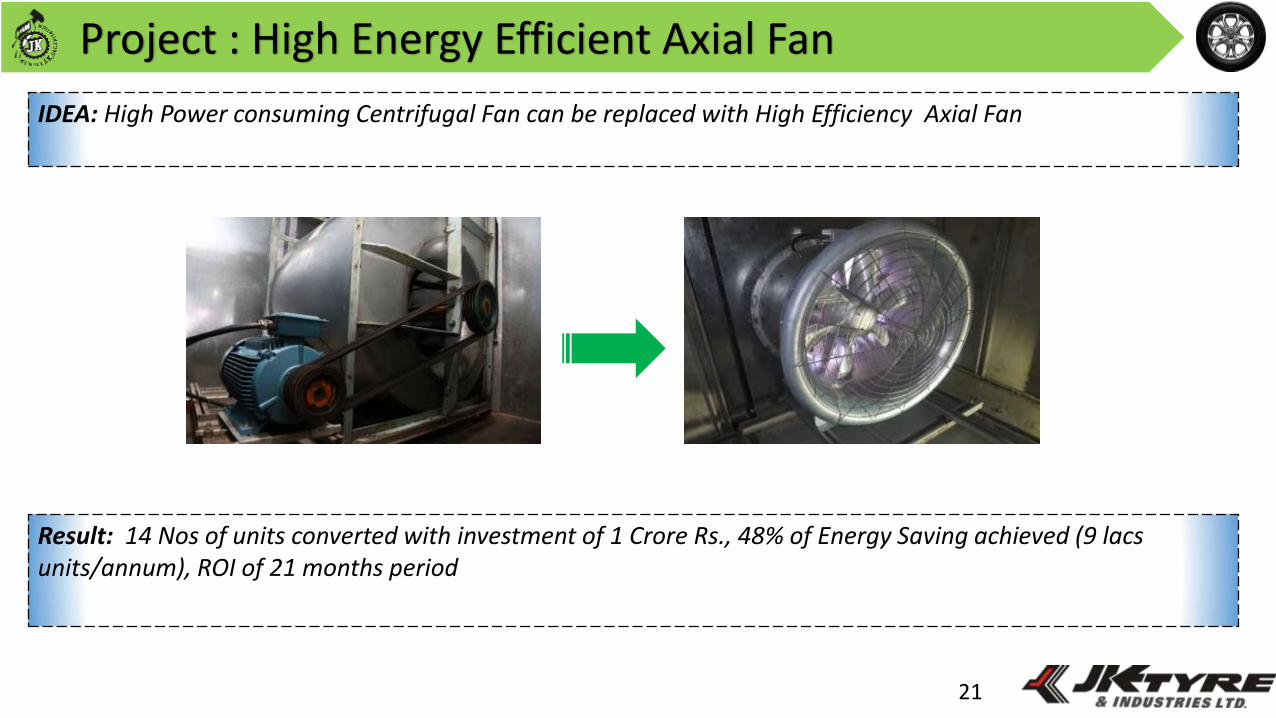
Project : High Energy Efficient Axial Fan
21
IDEA: High Power consuming Centrifugal Fan can be replaced with High Efficiency Axial Fan
Result: 14 Nos of units converted with investment of 1 Crore Rs., 48% of Energy Saving achieved (9 lacs units/annum), ROI of 21 months period
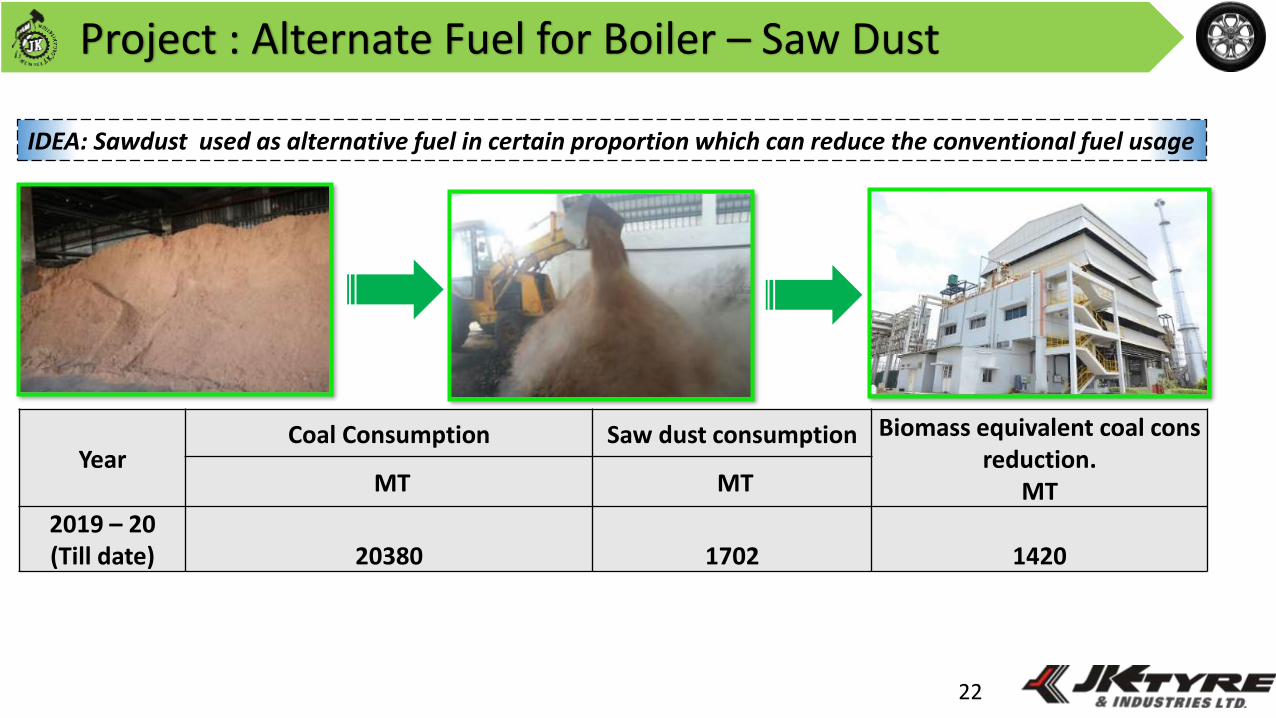
Project : Alternate Fuel for Boiler – Saw Dust
22
IDEA: Sawdust used as alternative fuel in certain proportion which can reduce the conventional fuel usage
YearCoal Consumption Saw dust consumption Biomass equivalent coal cons
reduction. MTMT MT
2019 – 20(Till date) 20380 1702 1420
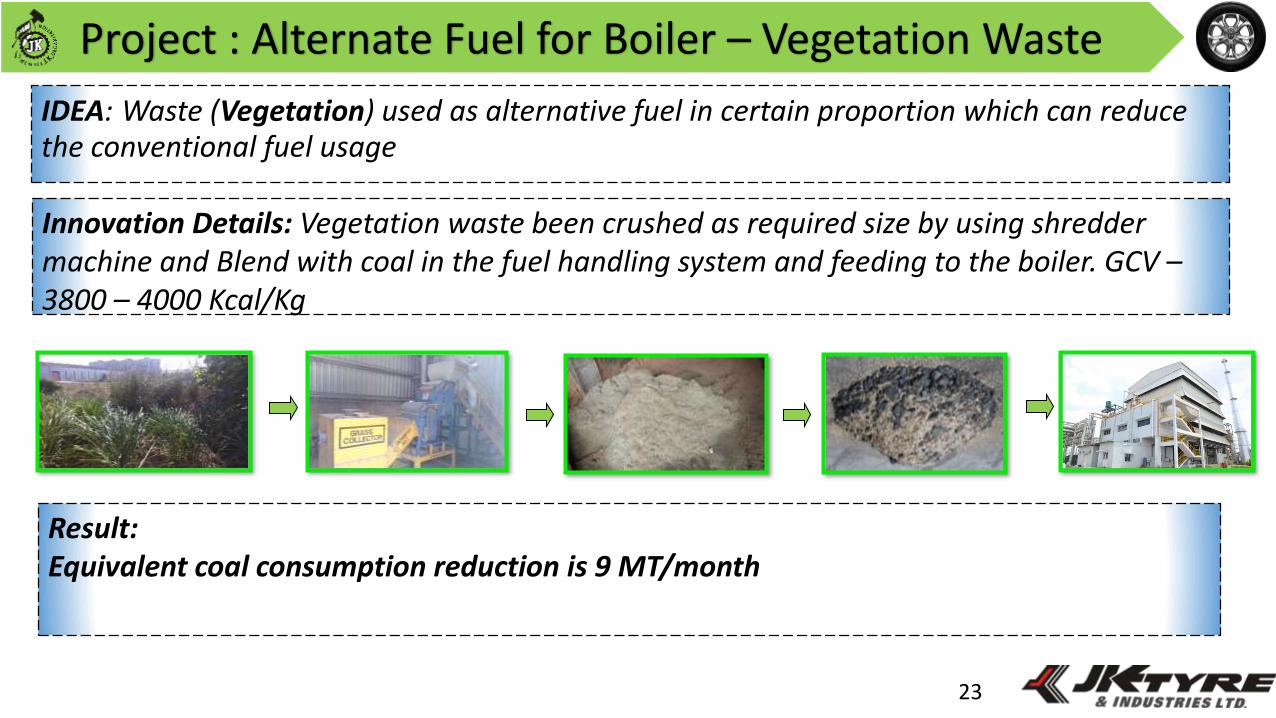
Project : Alternate Fuel for Boiler – Vegetation Waste
23
IDEA: Waste (Vegetation) used as alternative fuel in certain proportion which can reduce the conventional fuel usage
Innovation Details: Vegetation waste been crushed as required size by using shredder machine and Blend with coal in the fuel handling system and feeding to the boiler. GCV –3800 – 4000 Kcal/Kg
Result: Equivalent coal consumption reduction is 9 MT/month
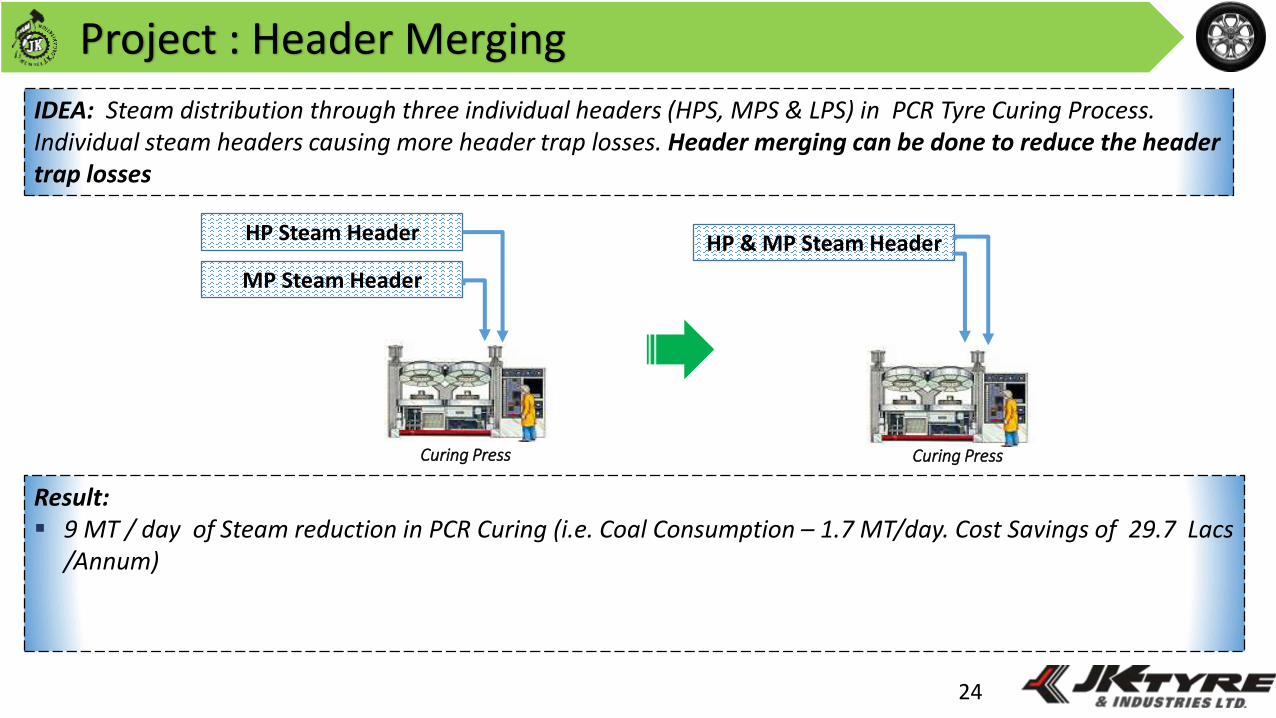
Project : Header Merging
24
IDEA: Steam distribution through three individual headers (HPS, MPS & LPS) in PCR Tyre Curing Process. Individual steam headers causing more header trap losses. Header merging can be done to reduce the header trap losses
HP Steam Header
MP Steam Header
HP & MP Steam Header
Curing Press Curing Press
Result: 9 MT / day of Steam reduction in PCR Curing (i.e. Coal Consumption – 1.7 MT/day. Cost Savings of 29.7 Lacs
/Annum)
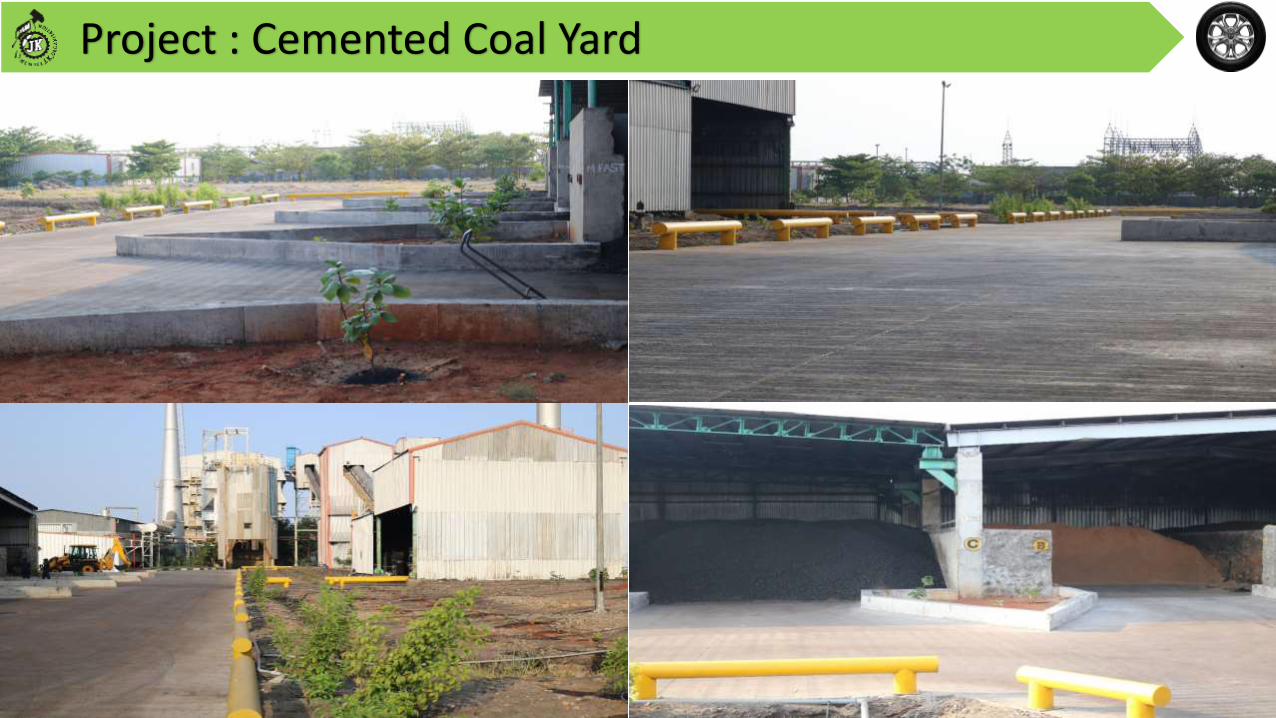
Project : Cemented Coal Yard
25
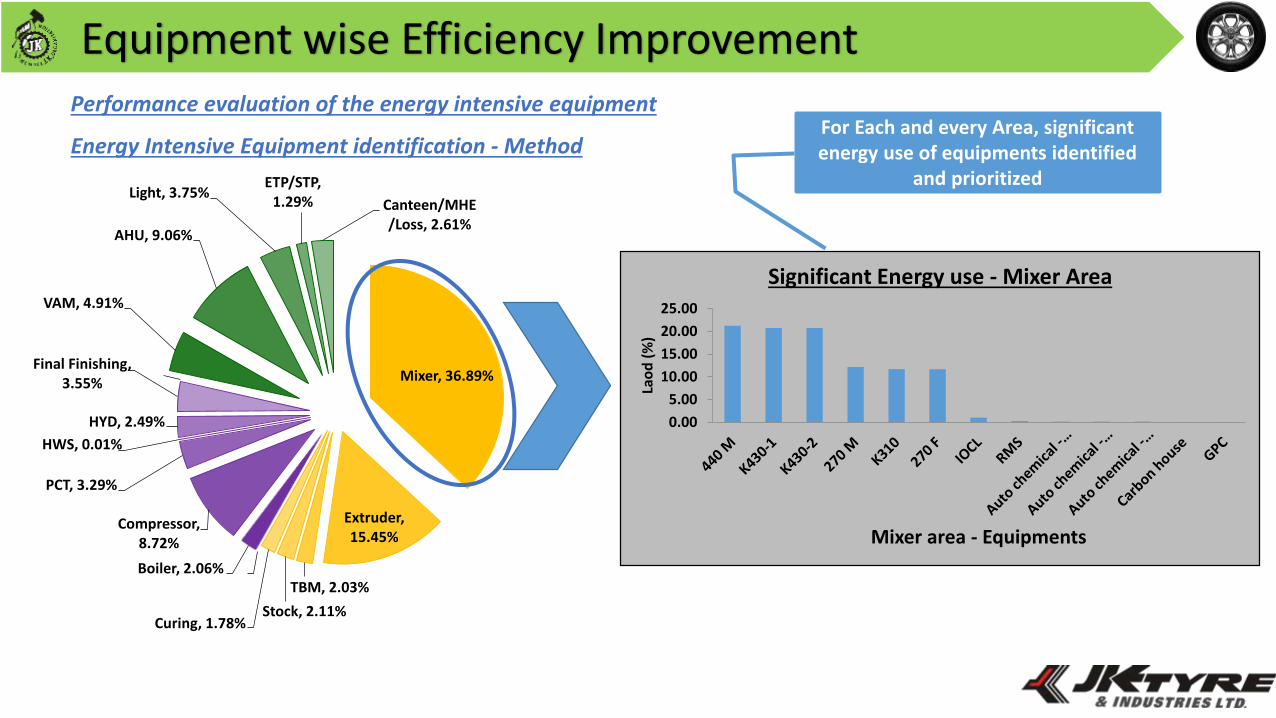
Equipment wise Efficiency Improvement
Mixer, 36.89%
Extruder, 15.45%
TBM, 2.03%
Stock, 2.11%Curing, 1.78%
Boiler, 2.06%
Compressor, 8.72%
PCT, 3.29%
HWS, 0.01%
HYD, 2.49%
Final Finishing, 3.55%
VAM, 4.91%
AHU, 9.06%
Light, 3.75%ETP/STP,
1.29% Canteen/MHE/Loss, 2.61%
Energy Intensive Equipment identification - Method
0.00
5.00
10.00
15.00
20.00
25.00
Lao
d (
%)
Mixer area - Equipments
Significant Energy use - Mixer Area
For Each and every Area, significant energy use of equipments identified
and prioritized
Performance evaluation of the energy intensive equipment
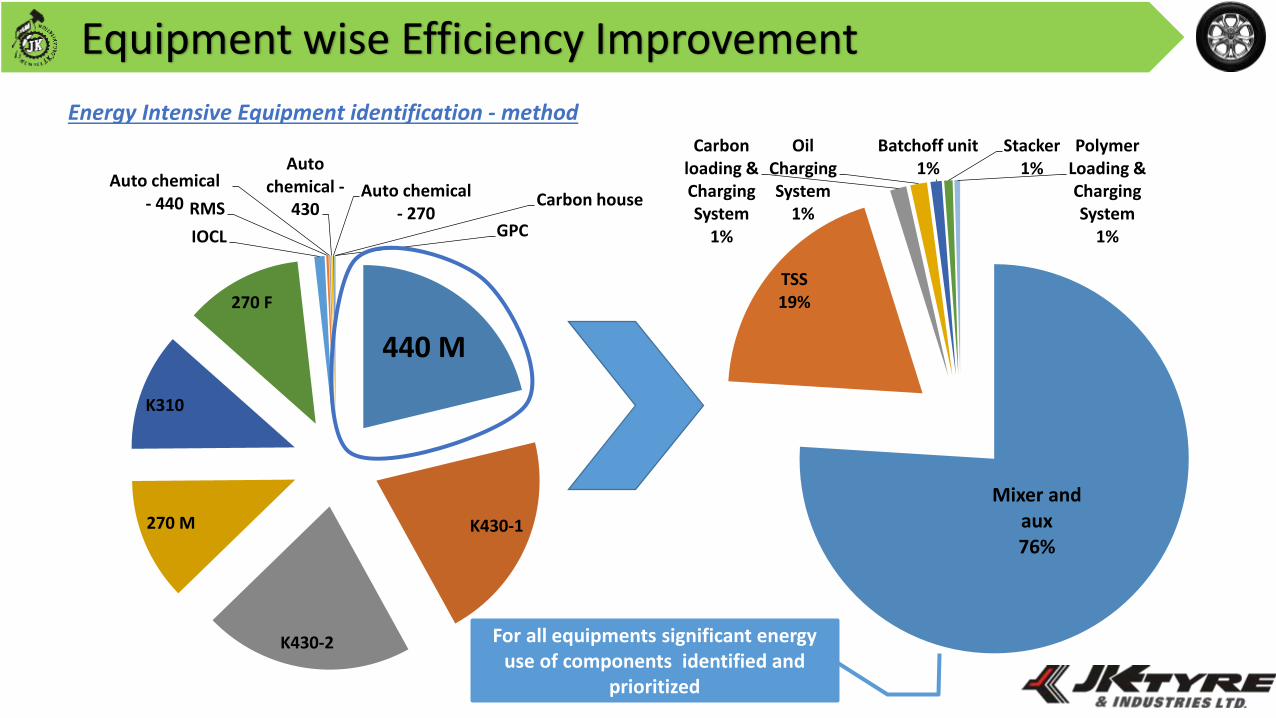
Equipment wise Efficiency Improvement
Energy Intensive Equipment identification - method
440 M
K430-1
K430-2
270 M
K310
270 F
IOCL
RMS
Auto chemical - 440
Auto chemical -
430Auto chemical
- 270Carbon house
GPC
Mixer and aux76%
TSS19%
Carbon loading & Charging System
1%
Oil Charging System
1%
Batchoff unit1%
Stacker1%
Polymer Loading & Charging System
1%
For all equipments significant energy use of components identified and
prioritized
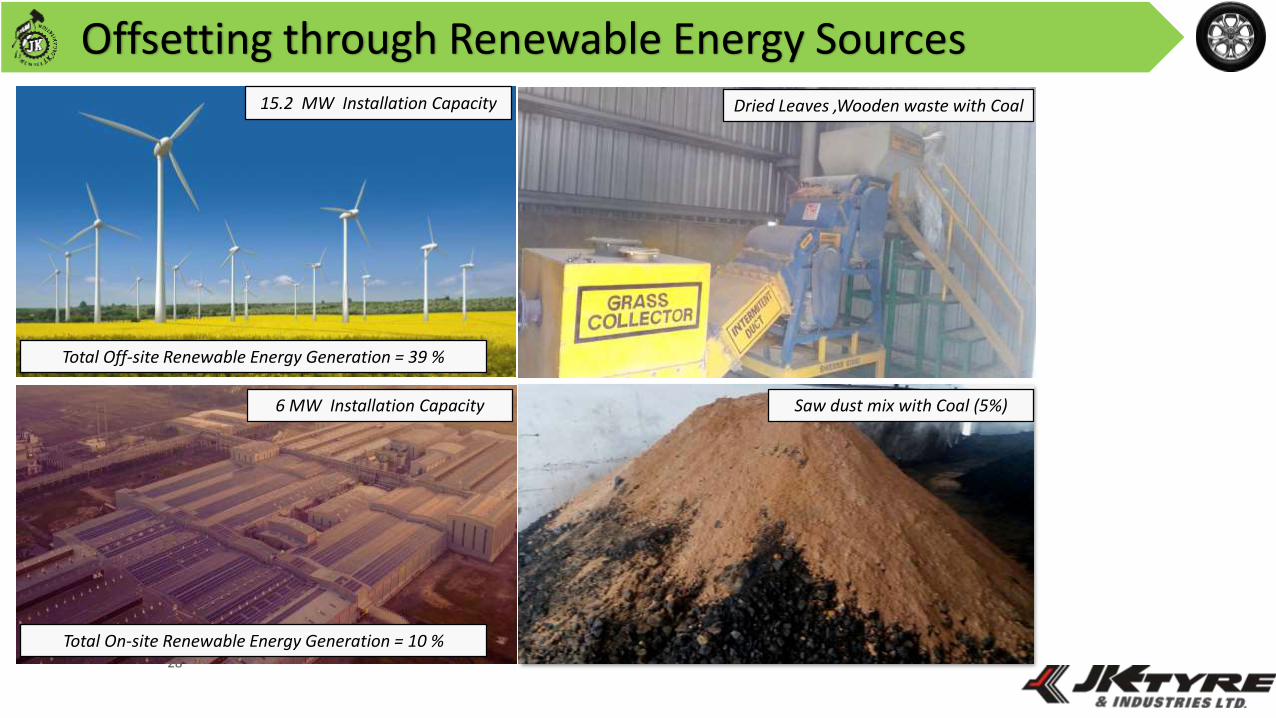
Offsetting through Renewable Energy Sources
28
Total On-site Renewable Energy Generation = 10 %
Total Off-site Renewable Energy Generation = 39 %
15.2 MW Installation Capacity
6 MW Installation Capacity Saw dust mix with Coal (5%)
Dried Leaves ,Wooden waste with Coal
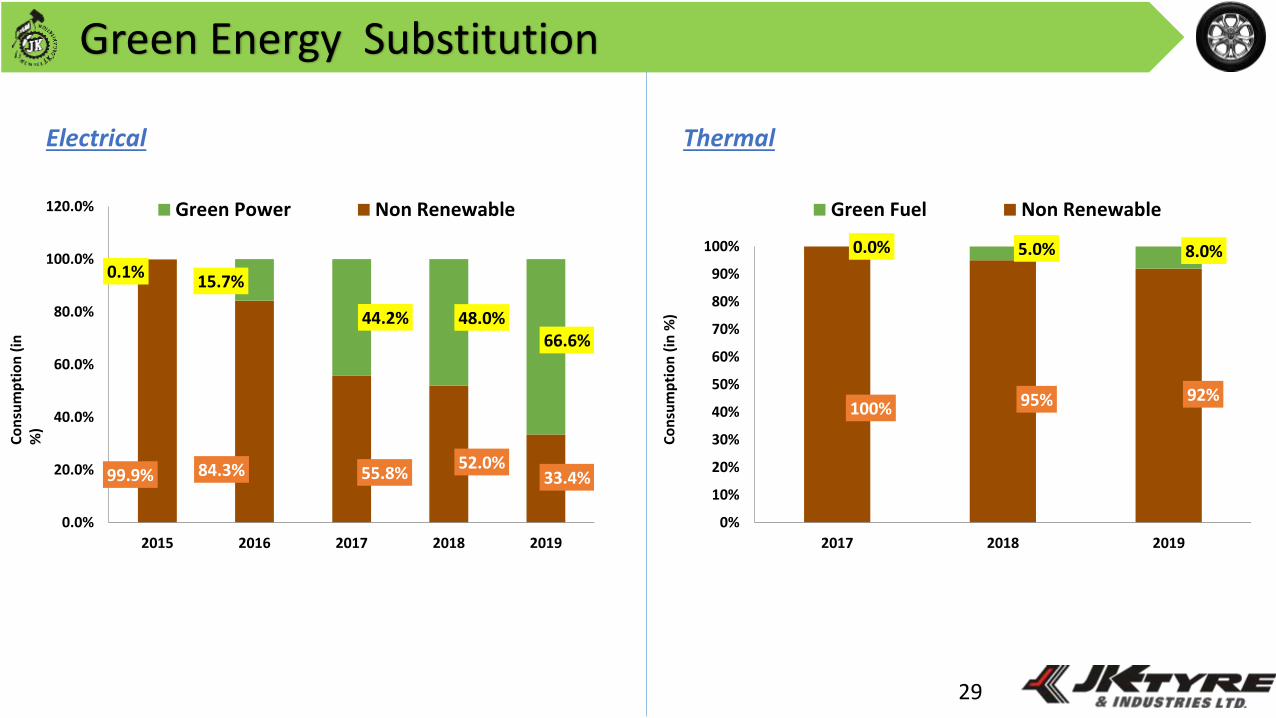
Green Energy Substitution
29
99.9% 84.3% 55.8%52.0%
33.4%
0.1%15.7%
44.2% 48.0%66.6%
0.0%
20.0%
40.0%
60.0%
80.0%
100.0%
120.0%
2015 2016 2017 2018 2019
Green Power Non Renewable
Co
nsu
mp
tio
n (
in
%)
100% 95% 92%
0.0% 5.0% 8.0%
0%
10%
20%
30%
40%
50%
60%
70%
80%
90%
100%
2017 2018 2019
Green Fuel Non Renewable
Co
nsu
mp
tio
n (
in %
)
Electrical Thermal
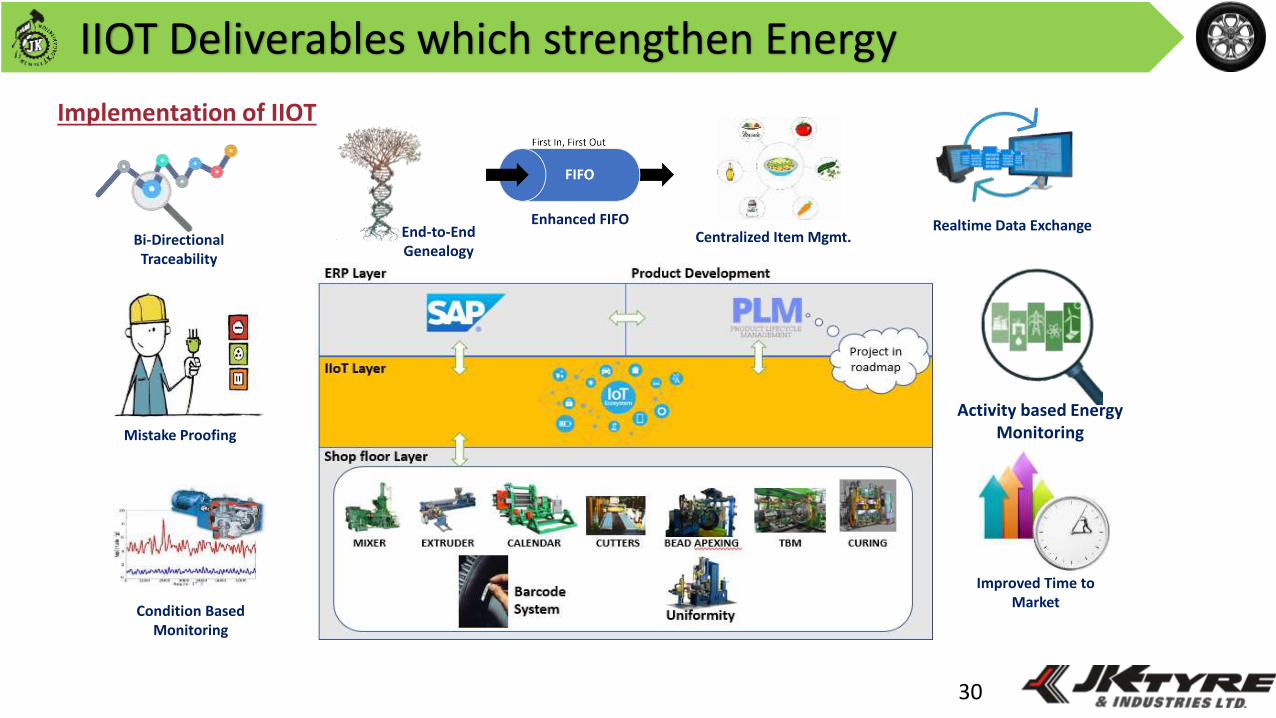
IIOT Deliverables which strengthen Energy
30
Bi-Directional Traceability
End-to-End Genealogy
Enhanced FIFOCentralized Item Mgmt.
Realtime Data Exchange
Mistake Proofing
Condition Based Monitoring
Activity based Energy Monitoring
Improved Time to Market
Implementation of IIOT
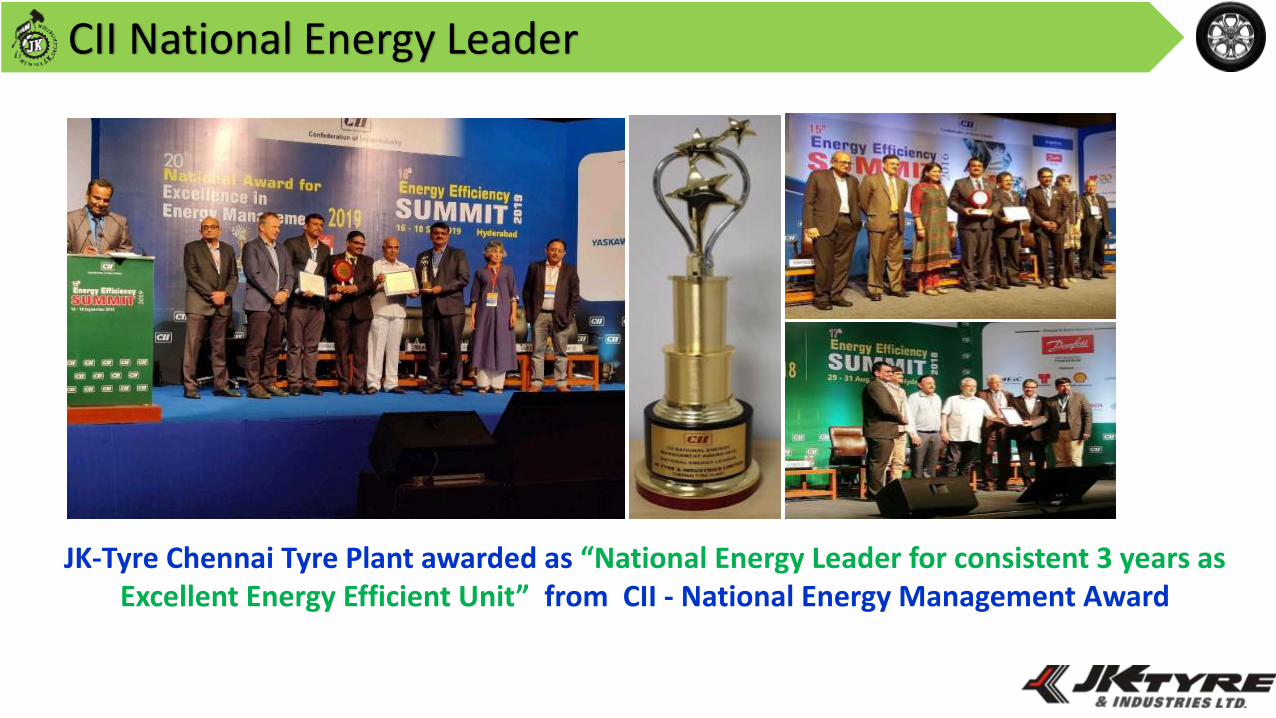
CII National Energy Leader
JK-Tyre Chennai Tyre Plant awarded as “National Energy Leader for consistent 3 years as Excellent Energy Efficient Unit” from CII - National Energy Management Award
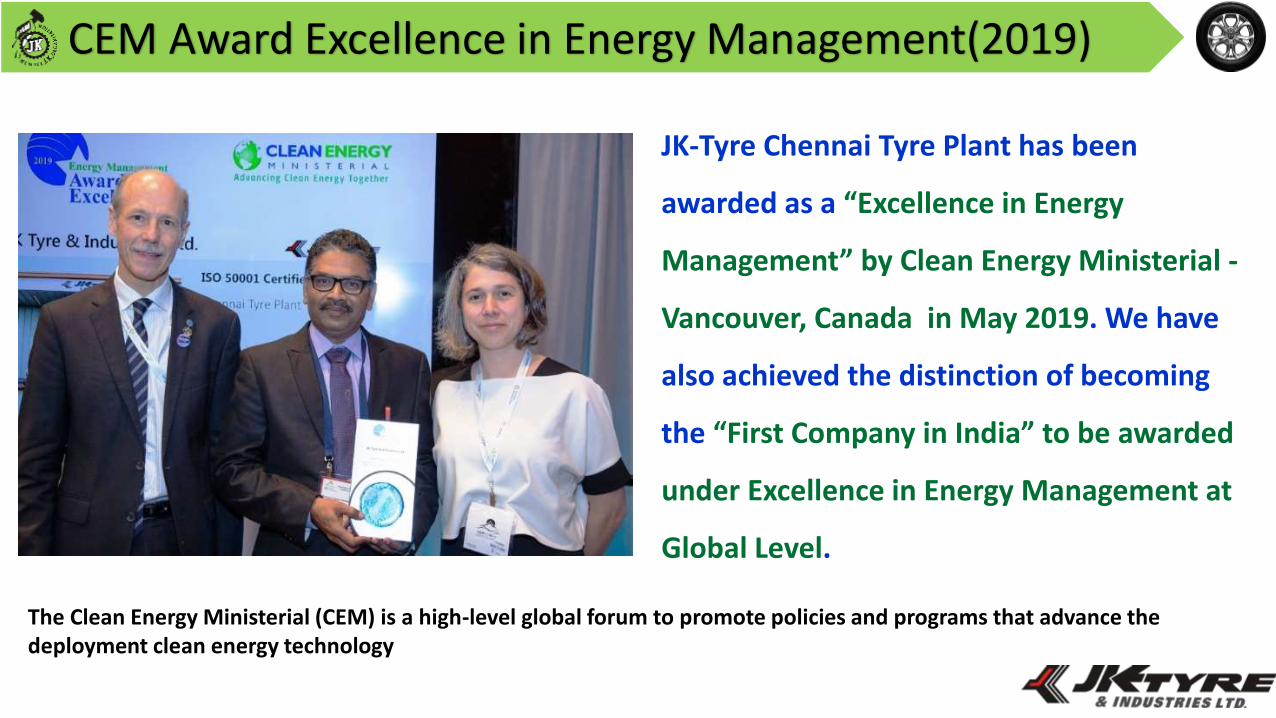
CEM Award Excellence in Energy Management(2019)
JK-Tyre Chennai Tyre Plant has been
awarded as a “Excellence in Energy
Management” by Clean Energy Ministerial -
Vancouver, Canada in May 2019. We have
also achieved the distinction of becoming
the “First Company in India” to be awarded
under Excellence in Energy Management at
Global Level.
The Clean Energy Ministerial (CEM) is a high-level global forum to promote policies and programs that advance the deployment clean energy technology
33
Water Conservation
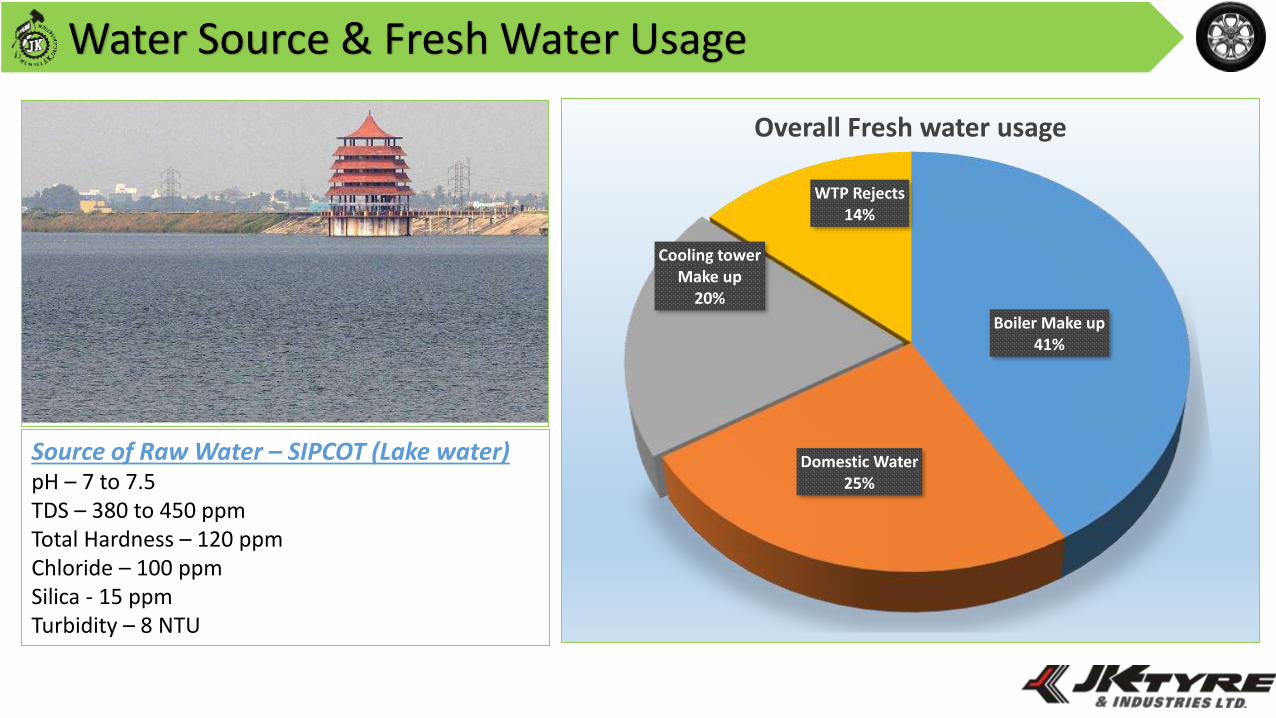
Water Source & Fresh Water Usage
Boiler Make up41%
Domestic Water25%
Cooling tower Make up
20%
WTP Rejects 14%
Overall Fresh water usage
Source of Raw Water – SIPCOT (Lake water) pH – 7 to 7.5TDS – 380 to 450 ppmTotal Hardness – 120 ppmChloride – 100 ppmSilica - 15 ppmTurbidity – 8 NTU
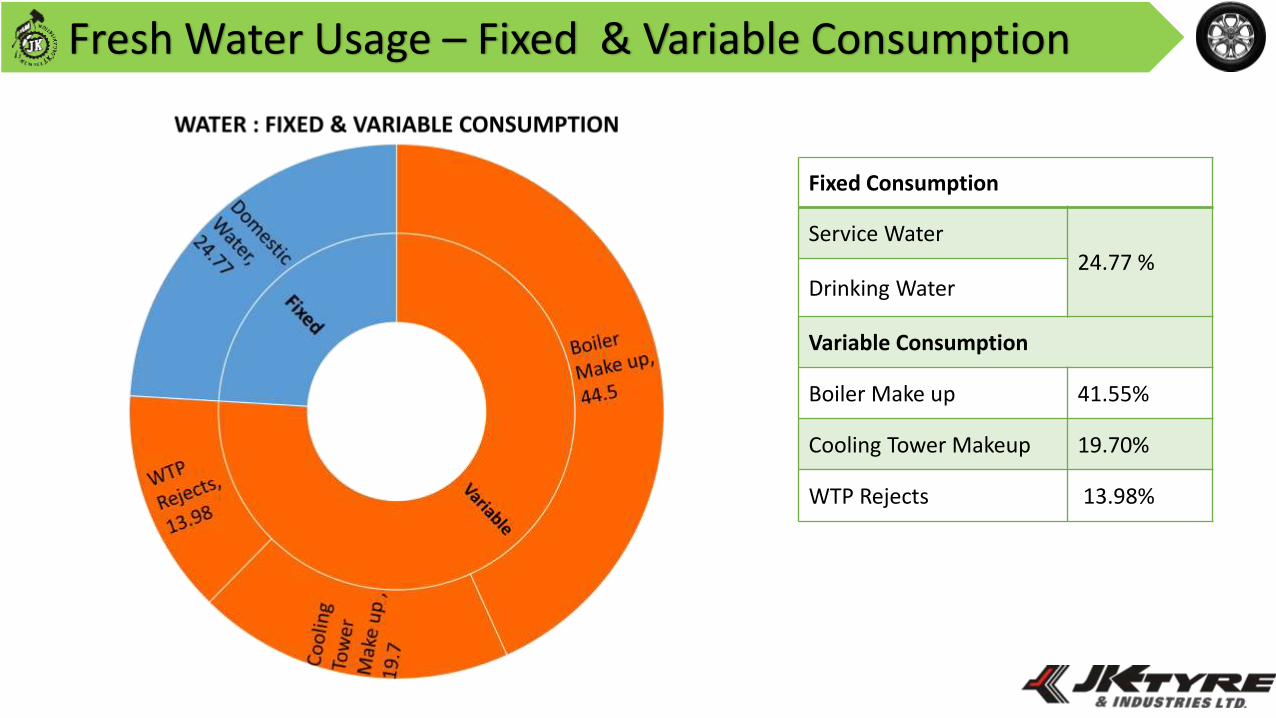
Fresh Water Usage – Fixed & Variable Consumption
Fixed Consumption
Service Water24.77 %
Drinking Water
Variable Consumption
Boiler Make up 41.55%
Cooling Tower Makeup 19.70%
WTP Rejects 13.98%
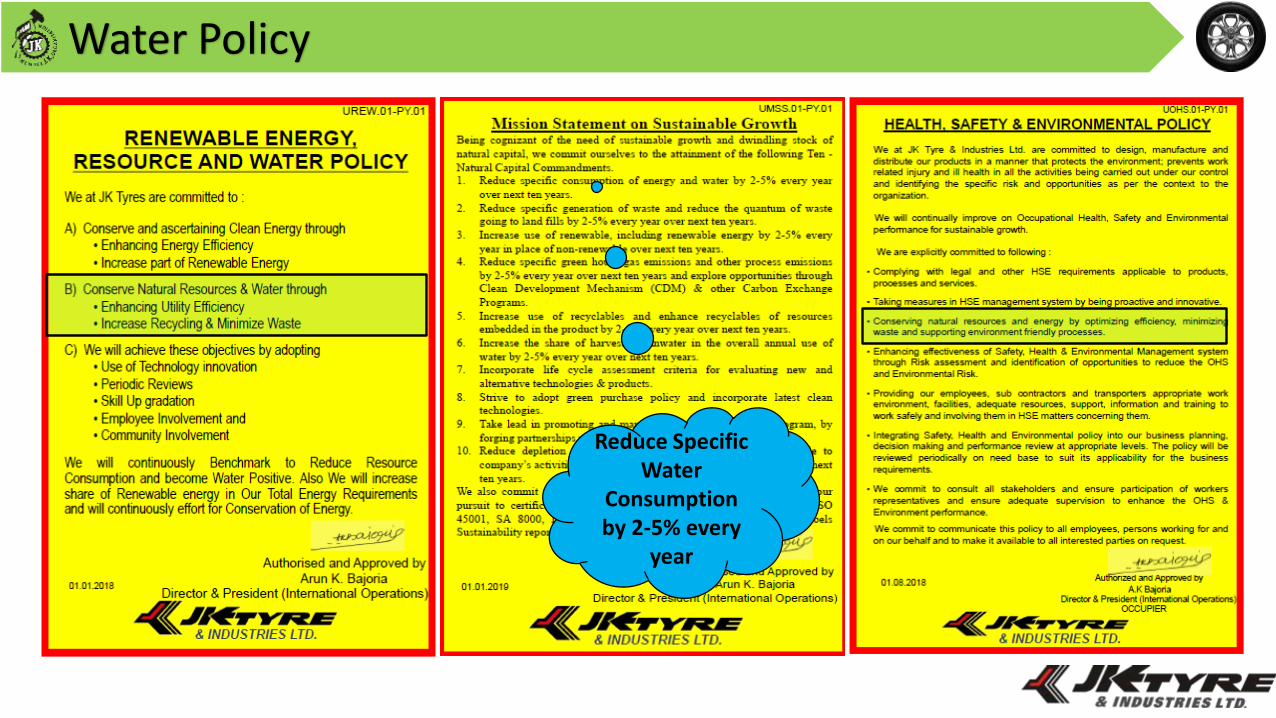
Water Policy
Reduce Specific Water
Consumption by 2-5% every
year
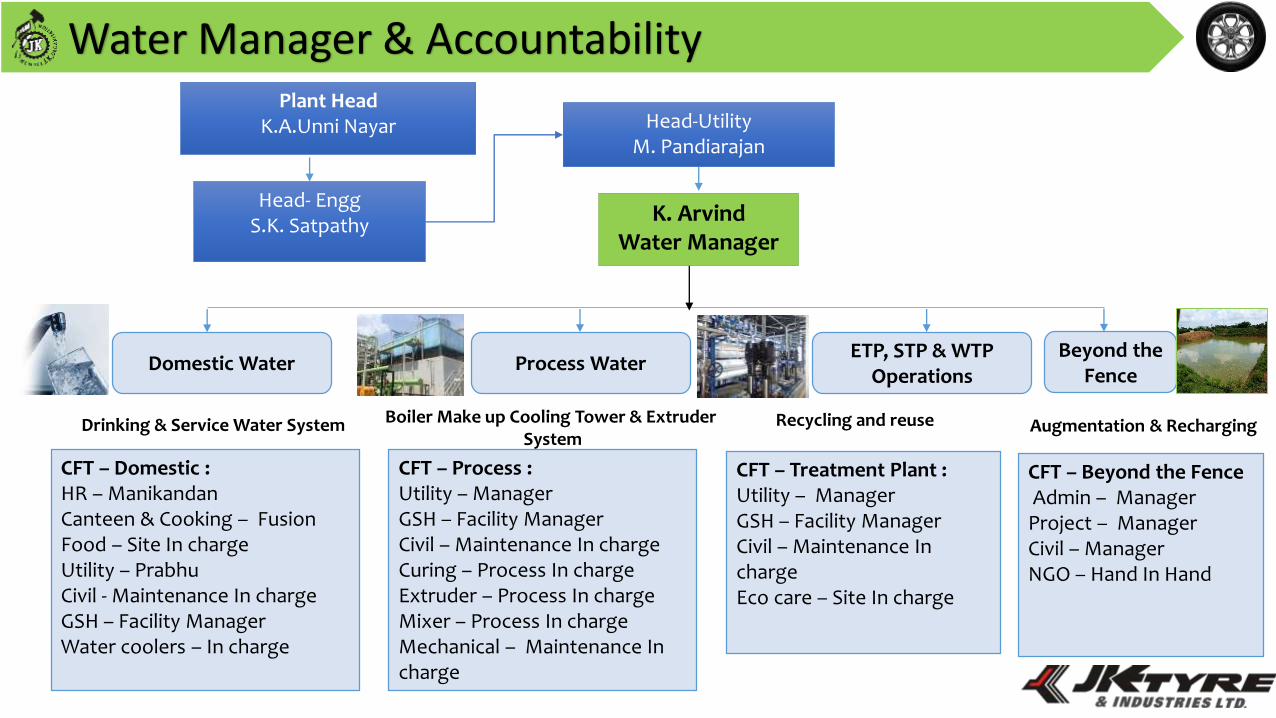
Water Manager & Accountability
Drinking & Service Water System
Domestic Water
CFT – Domestic : HR – ManikandanCanteen & Cooking – Fusion Food – Site In chargeUtility – PrabhuCivil - Maintenance In chargeGSH – Facility ManagerWater coolers – In charge
Boiler Make up Cooling Tower & Extruder System
Process Water
CFT – Process : Utility – ManagerGSH – Facility ManagerCivil – Maintenance In chargeCuring – Process In chargeExtruder – Process In chargeMixer – Process In chargeMechanical – Maintenance In charge
ETP, STP & WTP Operations
CFT – Treatment Plant : Utility – ManagerGSH – Facility ManagerCivil – Maintenance In chargeEco care – Site In charge
Recycling and reuse
Beyond the Fence
CFT – Beyond the Fence Admin – Manager
Project – ManagerCivil – ManagerNGO – Hand In Hand
Augmentation & Recharging
Head-UtilityM. Pandiarajan
K. ArvindWater Manager
Head- EnggS.K. Satpathy
Plant HeadK.A.Unni Nayar
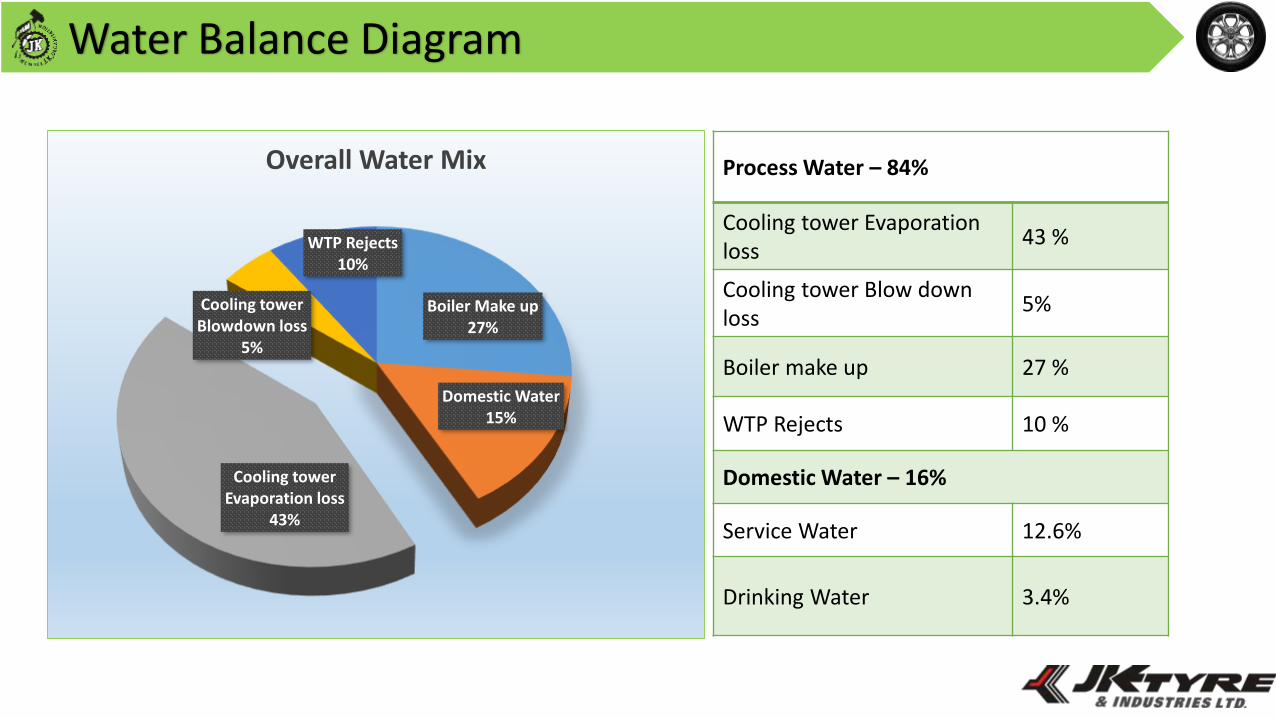
Water Balance Diagram
Boiler Make up27%
Domestic Water15%
Cooling tower Evaporation loss
43%
Cooling tower Blowdown loss
5%
WTP Rejects 10%
Overall Water Mix Process Water – 84%
Cooling tower Evaporation loss
43 %
Cooling tower Blow down loss
5%
Boiler make up 27 %
WTP Rejects 10 %
Domestic Water – 16%
Service Water 12.6%
Drinking Water 3.4%
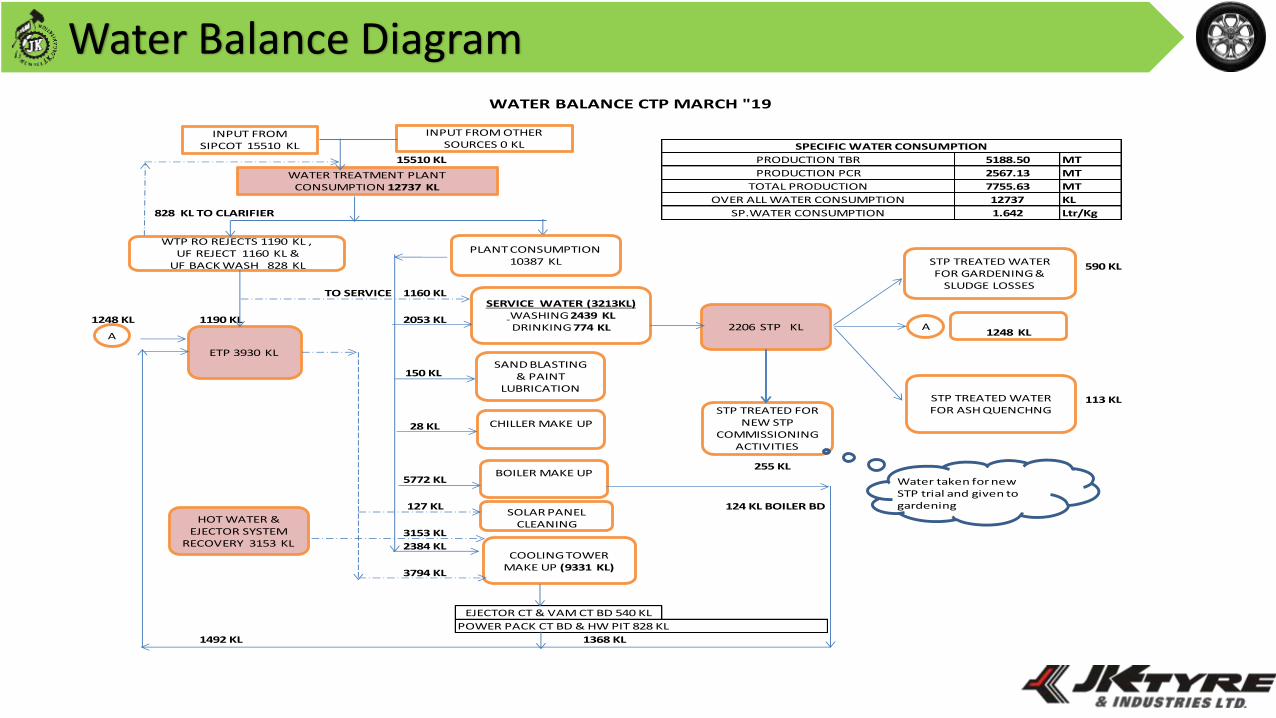
Water Balance Diagram
15510 KL 5188.50 MT
2567.13 MT
7755.63 MT
12737 KL
828 KL TO CLARIFIER 1.642 Ltr/Kg
590 KL
TO SERVICE 1160 KL
1248 KL 1190 KL 2053 KL
150 KL
113 KL
28 KL
255 KL
5772 KL
127 KL
3153 KL
2384 KL
3794 KL
1492 KL 1368 KL
POWER PACK CT BD & HW PIT 828 KL
WATER BALANCE CTP MARCH "19
SPECIFIC WATER CONSUMPTION
124 KL BOILER BD
EJECTOR CT & VAM CT BD 540 KL
PRODUCTION TBR
PRODUCTION PCR
TOTAL PRODUCTION
OVER ALL WATER CONSUMPTION
SP.WATER CONSUMPTION
INPUT FROM SIPCOT 15510 KL
WATER TREATMENT PLANT CONSUMPTION 12737 KL
PLANT CONSUMPTION 10387 KL
SERVICE WATER (3213KL) WASHING 2439 KLDRINKING 774 KL
BOILER MAKE UP
INPUT FROM OTHER SOURCES 0 KL
2206 STP KL
COOLING TOWER MAKE UP (9331 KL)
WTP RO REJECTS 1190 KL , UF REJECT 1160 KL &
UF BACK WASH 828 KL
ETP 3930 KL
HOT WATER & EJECTOR SYSTEM
RECOVERY 3153 KL
STP TREATED WATER FOR GARDENING &
SLUDGE LOSSES
SOLAR PANEL CLEANING
AA
CHILLER MAKE UP
STP TREATED WATER FOR ASH QUENCHNG
1248 KL
STP TREATED FORNEW STP
COMMISSIONING ACTIVITIES
SAND BLASTING & PAINT
LUBRICATION
Water taken for new STP trial and given to gardening
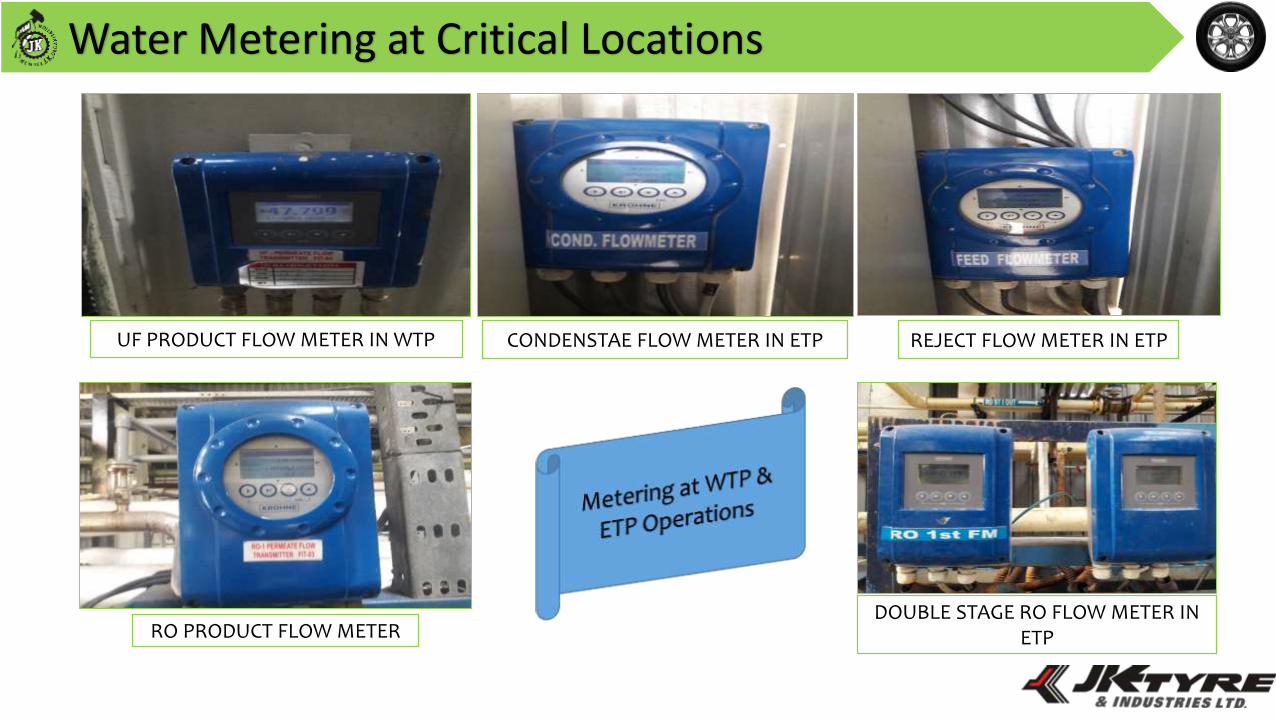
Water Metering at Critical Locations
UF PRODUCT FLOW METER IN WTP
RO PRODUCT FLOW METERDOUBLE STAGE RO FLOW METER IN
ETP
REJECT FLOW METER IN ETPCONDENSTAE FLOW METER IN ETP
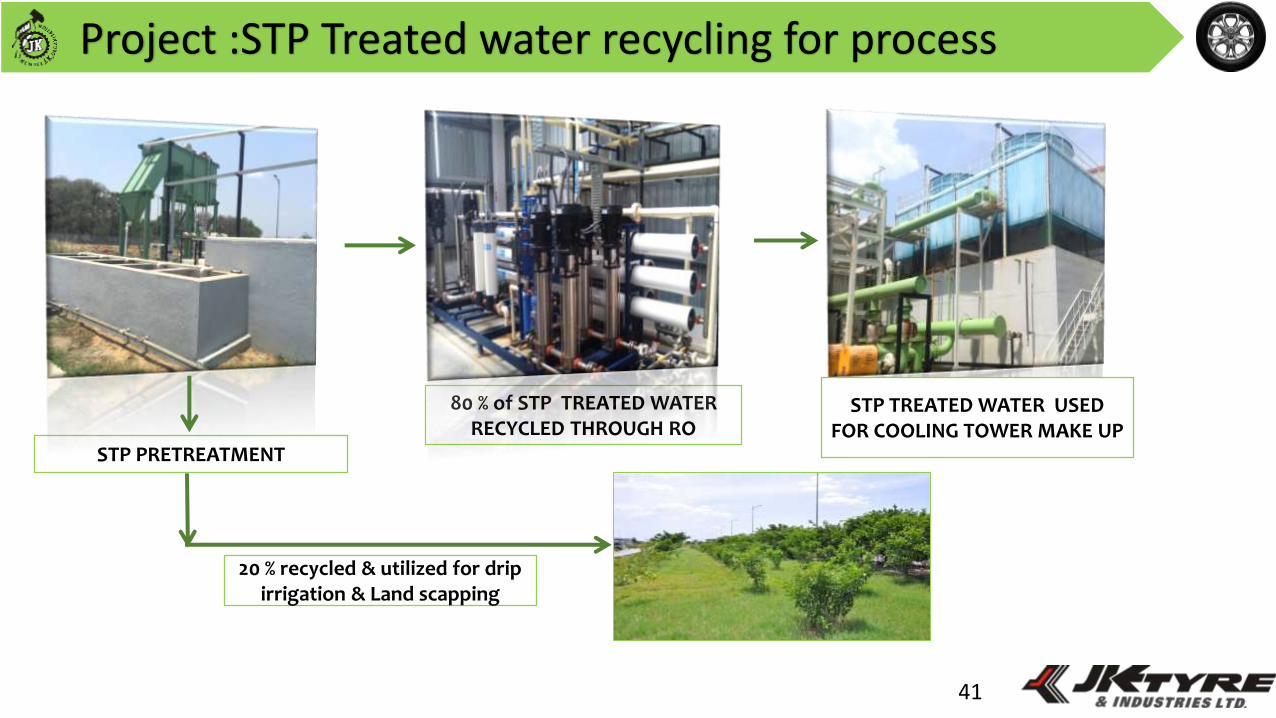
Project :STP Treated water recycling for process
41
STP PRETREATMENT
80 % of STP TREATED WATER RECYCLED THROUGH RO
STP TREATED WATER USED FOR COOLING TOWER MAKE UP
20 % recycled & utilized for drip irrigation & Land scapping
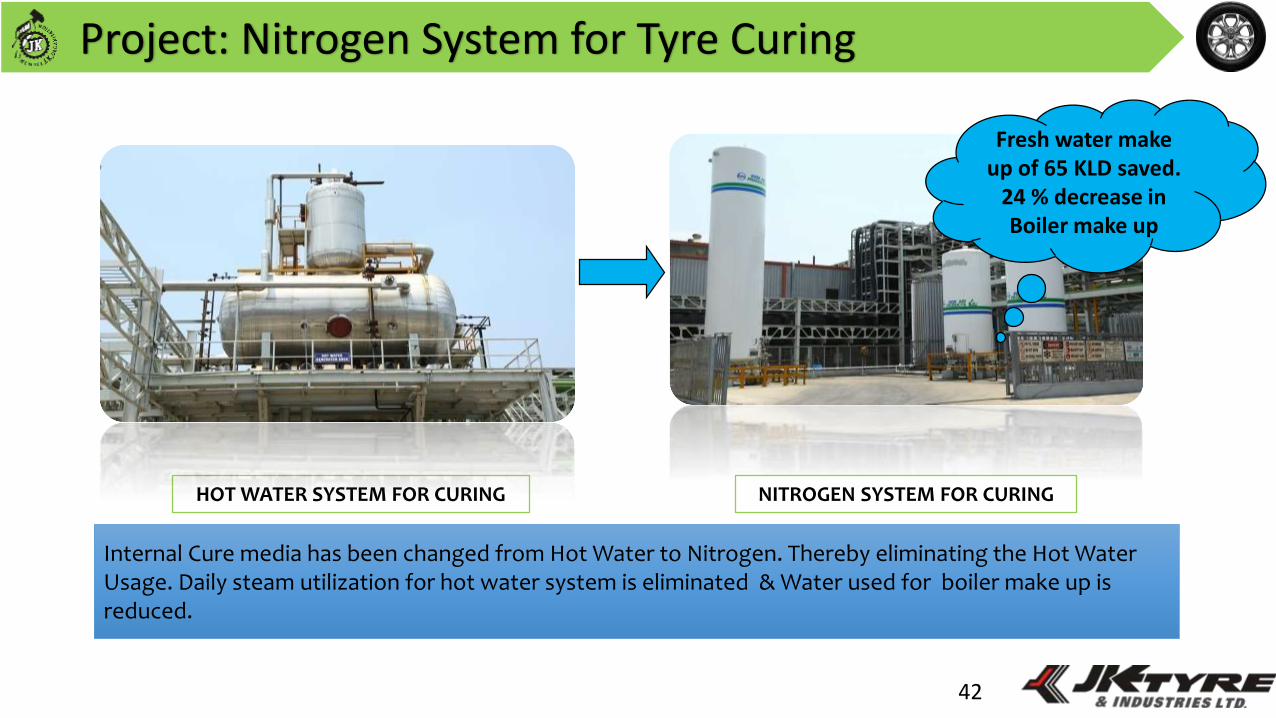
Project: Nitrogen System for Tyre Curing
42
Internal Cure media has been changed from Hot Water to Nitrogen. Thereby eliminating the Hot Water Usage. Daily steam utilization for hot water system is eliminated & Water used for boiler make up is reduced.
HOT WATER SYSTEM FOR CURING NITROGEN SYSTEM FOR CURING
Fresh water make up of 65 KLD saved.
24 % decrease in Boiler make up
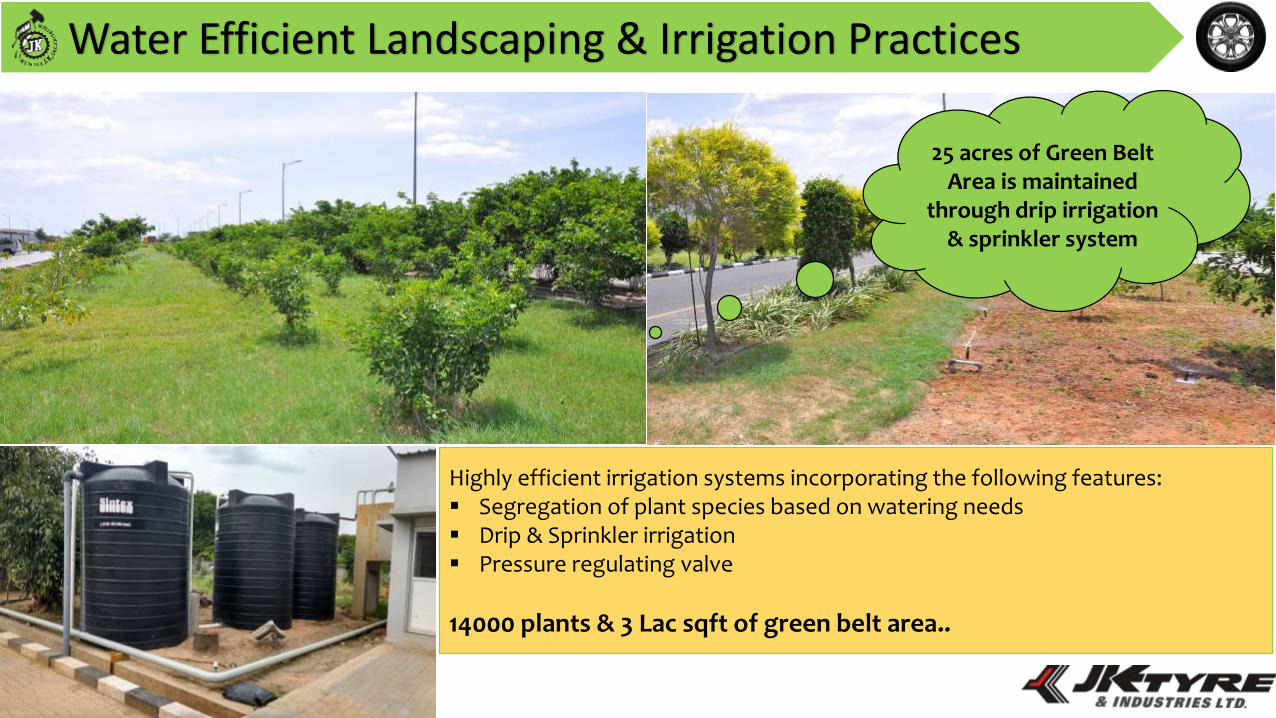
Water Efficient Landscaping & Irrigation Practices
Highly efficient irrigation systems incorporating the following features: Segregation of plant species based on watering needs Drip & Sprinkler irrigation Pressure regulating valve
14000 plants & 3 Lac sqft of green belt area..
25 acres of Green Belt Area is maintained
through drip irrigation & sprinkler system
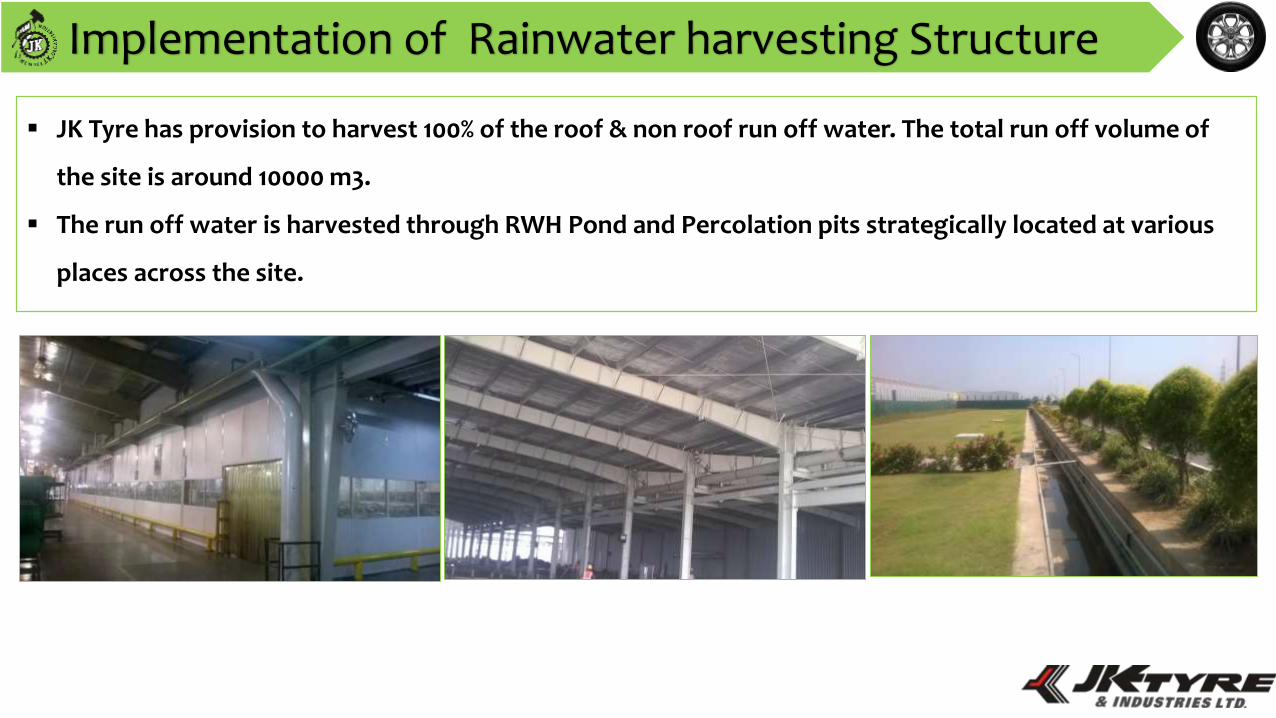
Implementation of Rainwater harvesting Structure
JK Tyre has provision to harvest 100% of the roof & non roof run off water. The total run off volume of
the site is around 10000 m3.
The run off water is harvested through RWH Pond and Percolation pits strategically located at various
places across the site.
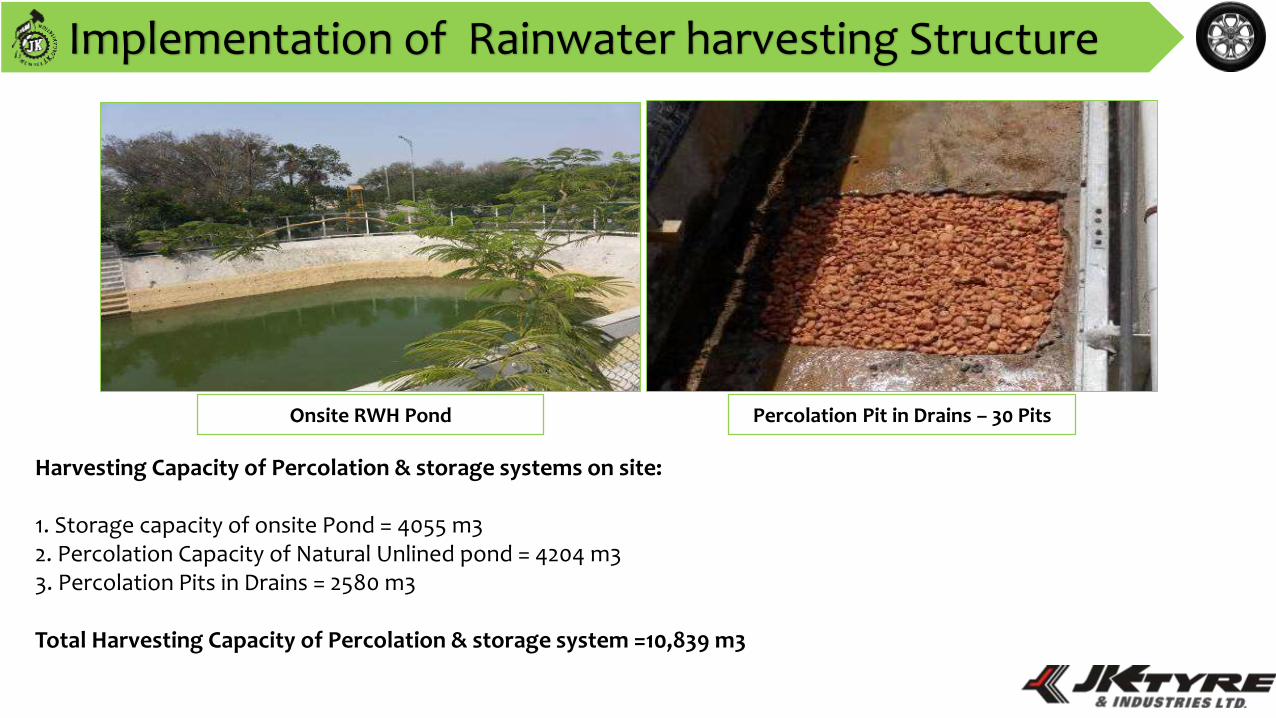
Implementation of Rainwater harvesting Structure
Percolation Pit in Drains – 30 PitsOnsite RWH Pond
Harvesting Capacity of Percolation & storage systems on site:
1. Storage capacity of onsite Pond = 4055 m3 2. Percolation Capacity of Natural Unlined pond = 4204 m3 3. Percolation Pits in Drains = 2580 m3
Total Harvesting Capacity of Percolation & storage system =10,839 m3
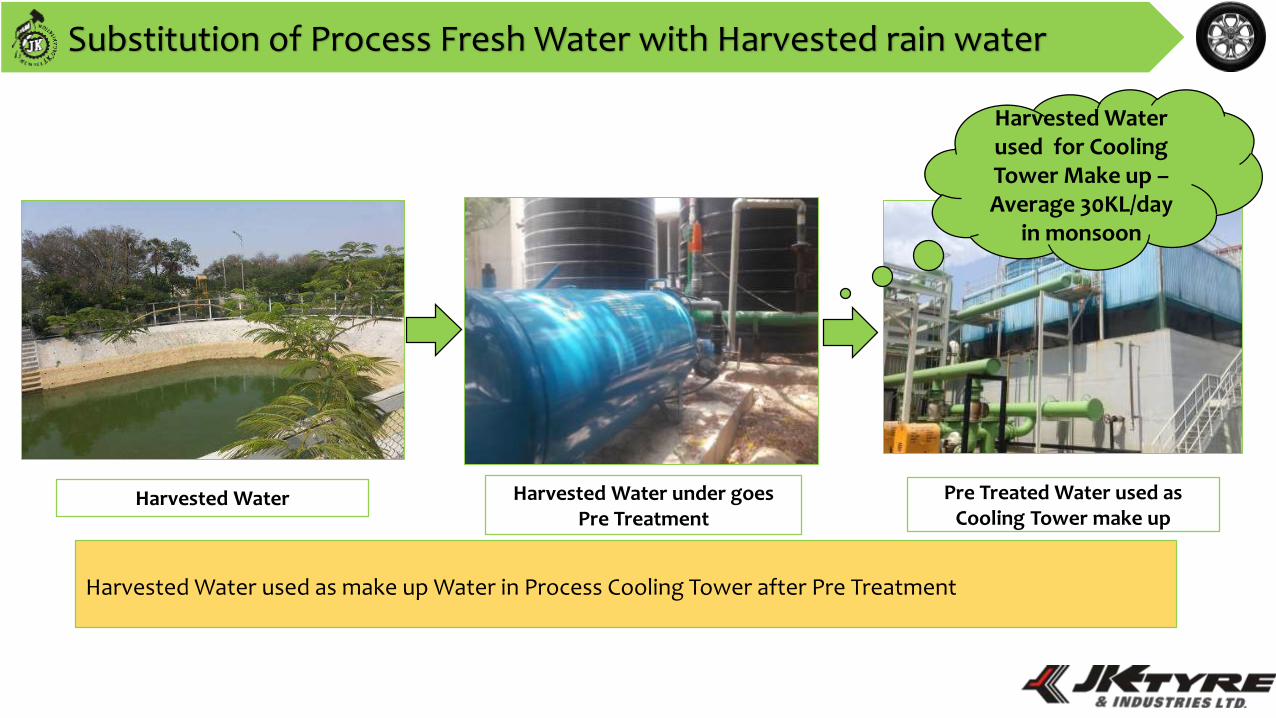
Substitution of Process Fresh Water with Harvested rain water
Harvested Water Harvested Water under goes Pre Treatment
Pre Treated Water used as Cooling Tower make up
Harvested Water used as make up Water in Process Cooling Tower after Pre Treatment
Harvested Water used for Cooling Tower Make up –Average 30KL/day
in monsoon
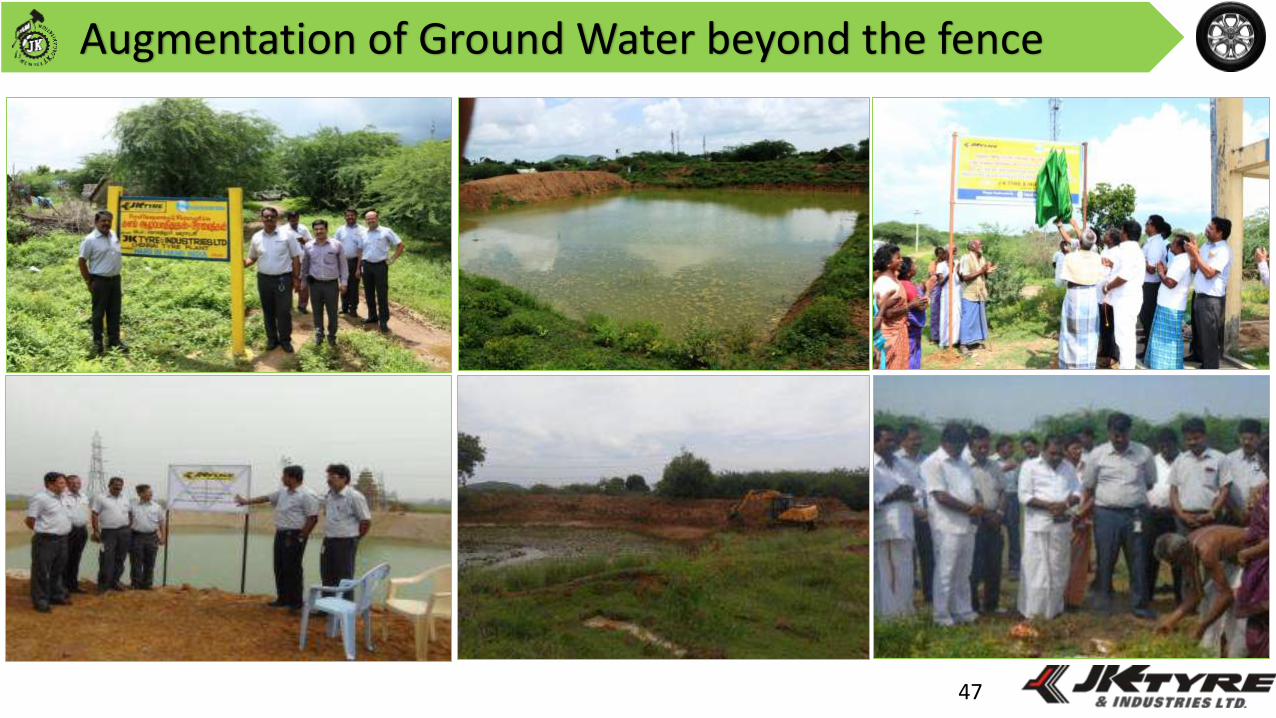
Augmentation of Ground Water beyond the fence
47
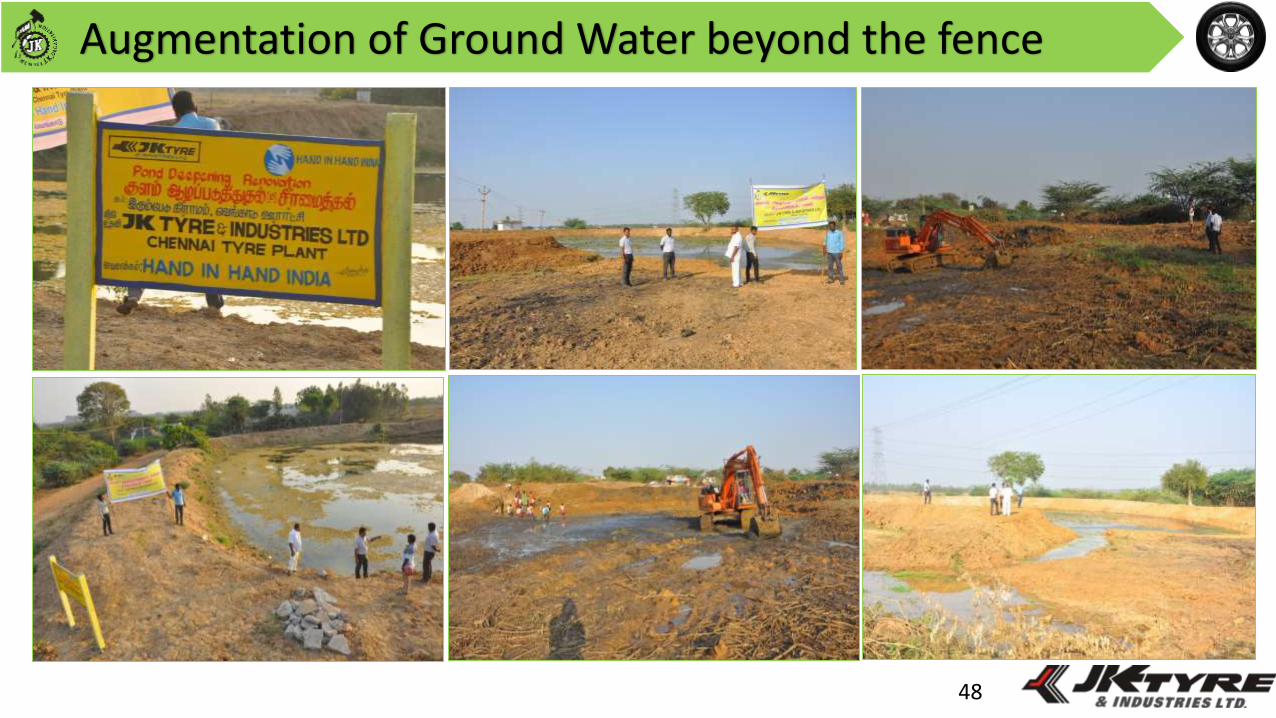
Augmentation of Ground Water beyond the fence
48
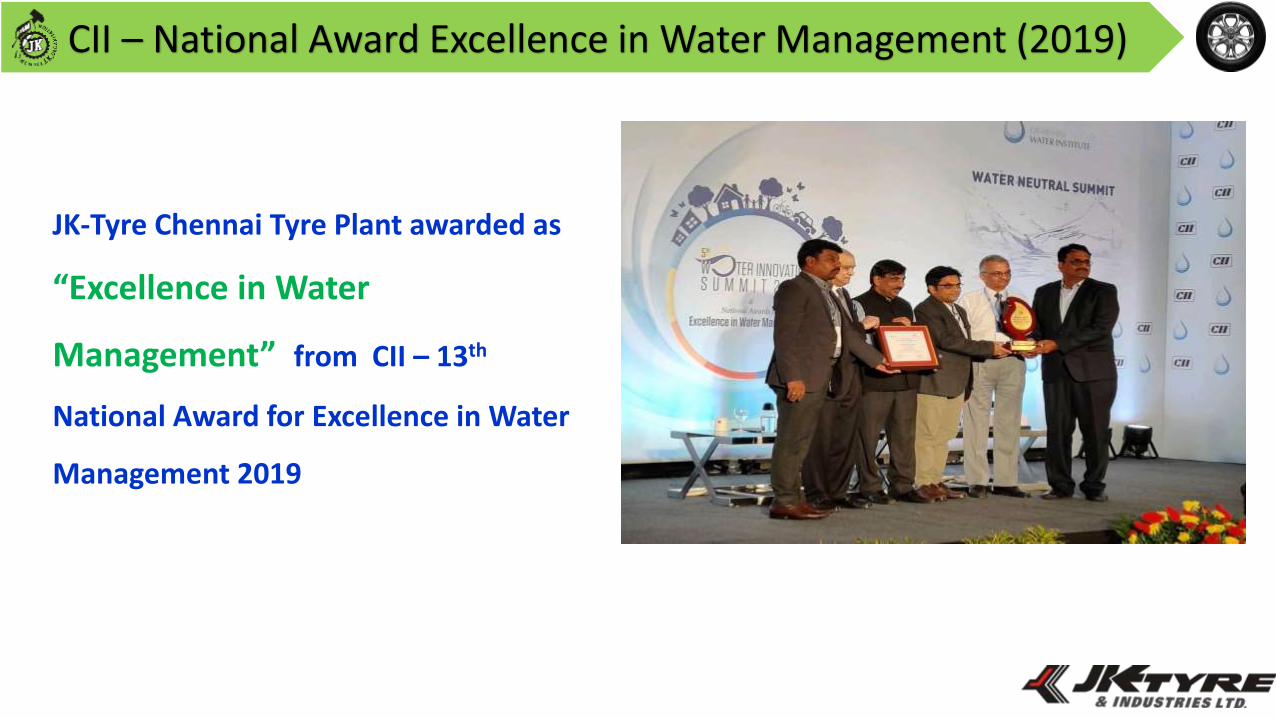
CII – National Award Excellence in Water Management (2019)
JK-Tyre Chennai Tyre Plant awarded as
“Excellence in Water
Management” from CII – 13th
National Award for Excellence in Water
Management 2019
50
Green House Gases
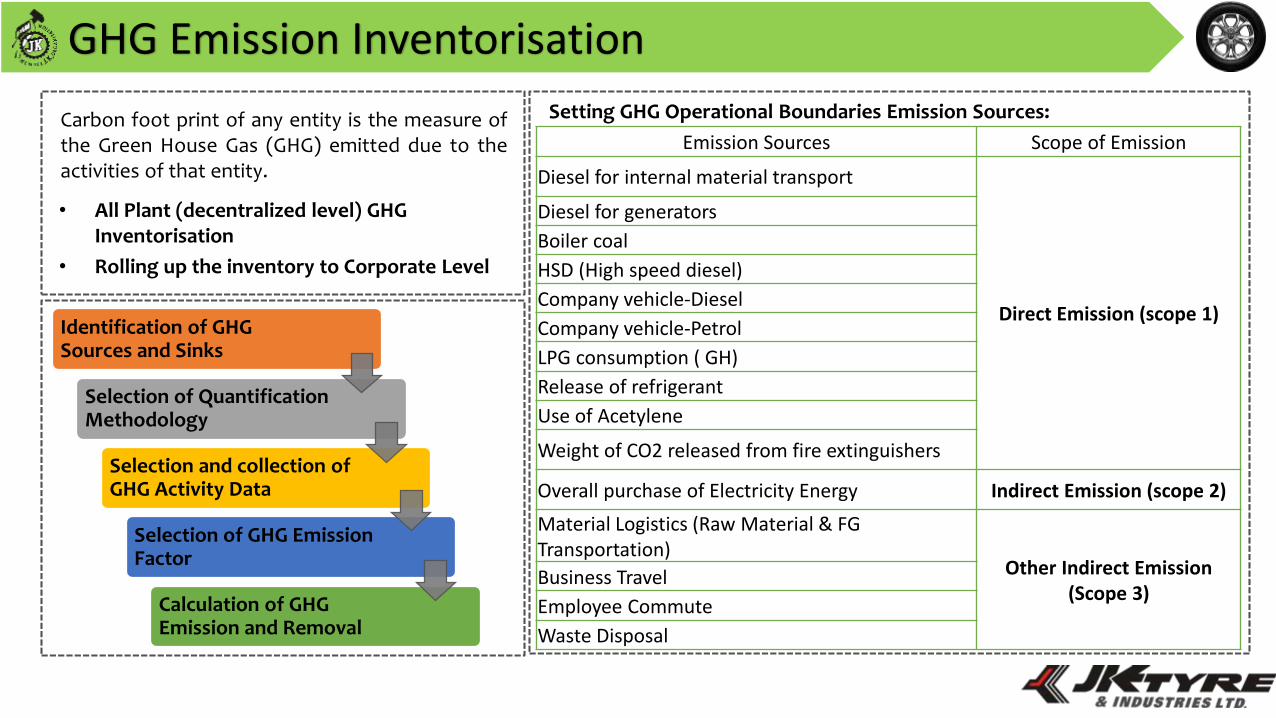
GHG Emission Inventorisation
Carbon foot print of any entity is the measure ofthe Green House Gas (GHG) emitted due to theactivities of that entity.
• All Plant (decentralized level) GHG Inventorisation
• Rolling up the inventory to Corporate Level
Identification of GHG Sources and Sinks
Selection of Quantification Methodology
Selection and collection of GHG Activity Data
Selection of GHG Emission Factor
Calculation of GHG Emission and Removal
Setting GHG Operational Boundaries Emission Sources:
Emission Sources Scope of Emission
Diesel for internal material transport
Direct Emission (scope 1)
Diesel for generators
Boiler coal
HSD (High speed diesel)
Company vehicle‐Diesel
Company vehicle‐Petrol
LPG consumption ( GH)
Release of refrigerant
Use of Acetylene
Weight of CO2 released from fire extinguishers
Overall purchase of Electricity Energy Indirect Emission (scope 2)
Material Logistics (Raw Material & FGTransportation)
Other Indirect Emission (Scope 3)
Business Travel
Employee Commute
Waste Disposal
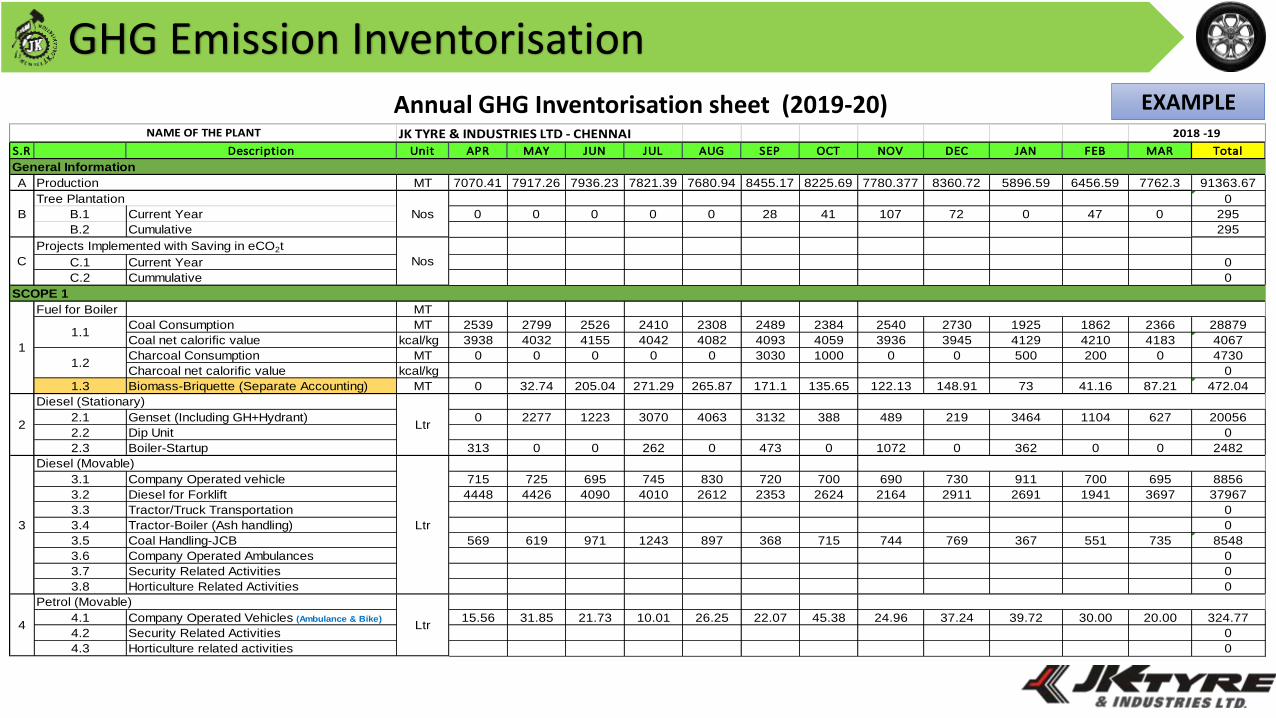
GHG Emission InventorisationAnnual GHG Inventorisation sheet (2019-20)JK TYRE & INDUSTRIES LTD - CHENNAI
S.R Description Unit APR MAY JUN JUL AUG SEP OCT NOV DEC JAN FEB MAR Total
A MT 7070.41 7917.26 7936.23 7821.39 7680.94 8455.17 8225.69 7780.377 8360.72 5896.59 6456.59 7762.3 91363.67
0
B.1 Current Year 0 0 0 0 0 28 41 107 72 0 47 0 295
B.2 Cumulative 295
C.1 Current Year 0
C.2 Cummulative 0
Fuel for Boiler MT
Coal Consumption MT 2539 2799 2526 2410 2308 2489 2384 2540 2730 1925 1862 2366 28879
Coal net calorific value kcal/kg 3938 4032 4155 4042 4082 4093 4059 3936 3945 4129 4210 4183 4067
Charcoal Consumption MT 0 0 0 0 0 3030 1000 0 0 500 200 0 4730
Charcoal net calorific value kcal/kg 0
1.3 Biomass-Briquette (Separate Accounting) MT 0 32.74 205.04 271.29 265.87 171.1 135.65 122.13 148.91 73 41.16 87.21 472.04
2.1 Genset (Including GH+Hydrant) 0 2277 1223 3070 4063 3132 388 489 219 3464 1104 627 20056
2.2 Dip Unit 0
2.3 Boiler-Startup 313 0 0 262 0 473 0 1072 0 362 0 0 2482
3.1 Company Operated vehicle 715 725 695 745 830 720 700 690 730 911 700 695 8856
3.2 Diesel for Forklift 4448 4426 4090 4010 2612 2353 2624 2164 2911 2691 1941 3697 37967
3.3 Tractor/Truck Transportation 0
3.4 Tractor-Boiler (Ash handling) 0
3.5 Coal Handling-JCB 569 619 971 1243 897 368 715 744 769 367 551 735 8548
3.6 Company Operated Ambulances 0
3.7 Security Related Activities 0
3.8 Horticulture Related Activities 0
4.1 Company Operated Vehicles (Ambulance & Bike) 15.56 31.85 21.73 10.01 26.25 22.07 45.38 24.96 37.24 39.72 30.00 20.00 324.77
4.2 Security Related Activities 0
4.3 Horticulture related activities 0
NAME OF THE PLANT
General Information
Production
B
Tree Plantation
Nos
2018 -19
C
Projects Implemented with Saving in eCO2t
Nos
SCOPE 1
1
1.1
1.2
2
Diesel (Stationary)
Ltr
3
Diesel (Movable)
Ltr
4
Petrol (Movable)
Ltr
EXAMPLE
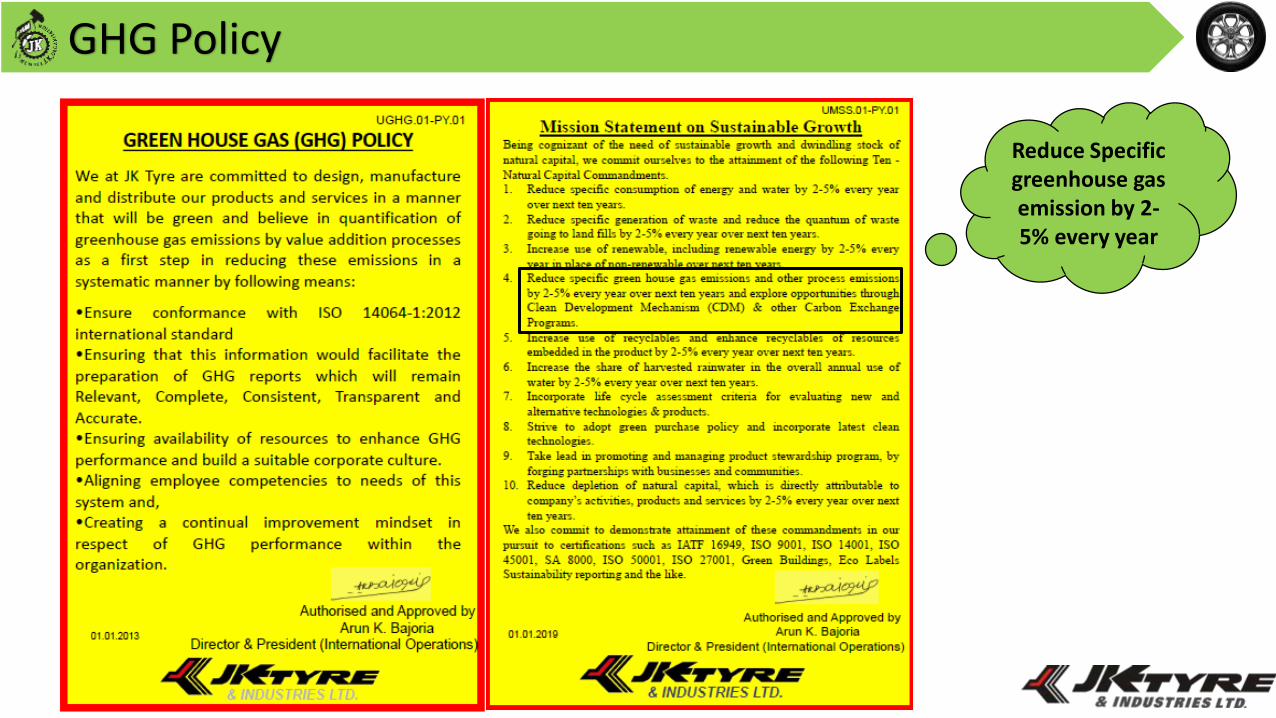
GHG Policy
Reduce Specific greenhouse gas emission by 2-5% every year
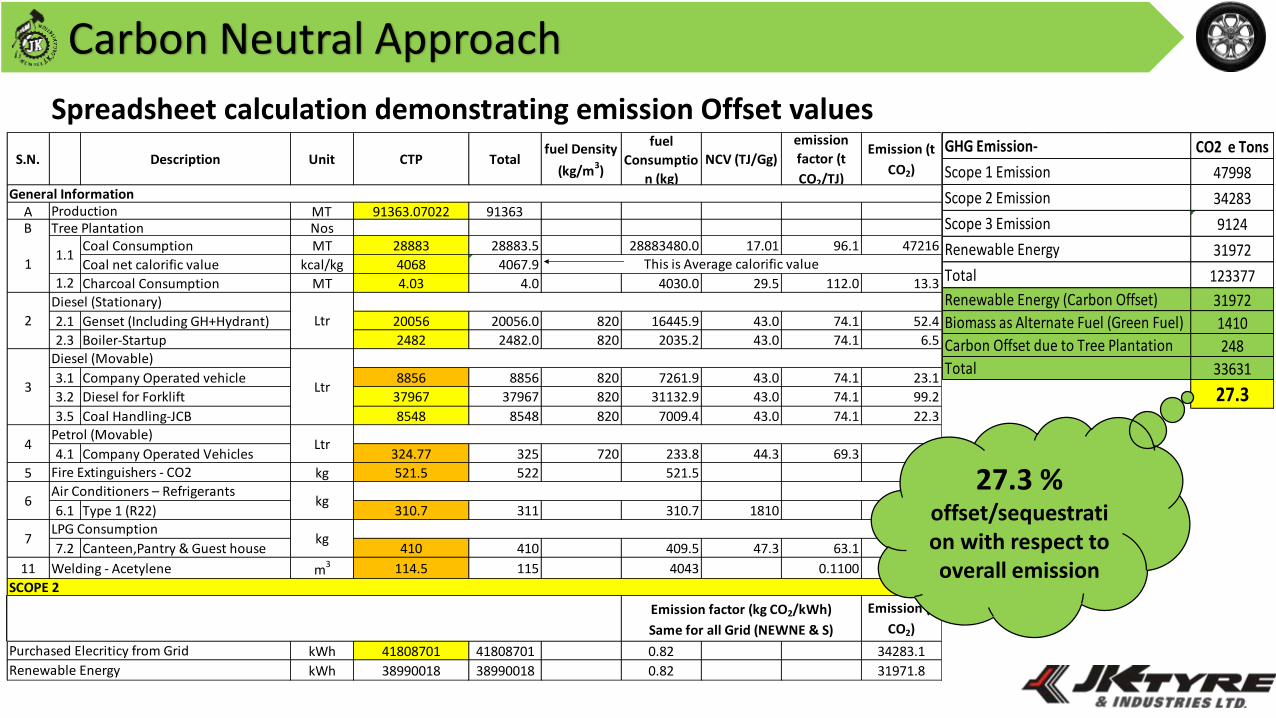
Carbon Neutral Approach
CO2 e Tons
47998
34283
9124
31972
123377
31972
1410
248
33631
27.3
Scope 3 Emission
Total
Scope 2 Emission
GHG Emission-
Scope 1 Emission
Renewable Energy
Renewable Energy (Carbon Offset)
Carbon Offset due to Tree Plantation
Total
Biomass as Alternate Fuel (Green Fuel)
Spreadsheet calculation demonstrating emission Offset values
S.N. Description Unit CTP Totalfuel Density
(kg/m3)
fuel
Consumptio
n (kg)
NCV (TJ/Gg)
emission
factor (t
CO2/TJ)
Emission (t
CO2)
A MT 91363.07022 91363
Coal Consumption MT 28883 28883.5 28883480.0 17.01 96.1 47216
Coal net calorific value kcal/kg 4068 4067.9
Charcoal Consumption MT 4.03 4.0 4030.0 29.5 112.0 13.3
2.1 Genset (Including GH+Hydrant) 20056 20056.0 820 16445.9 43.0 74.1 52.4
2.3 Boiler-Startup 2482 2482.0 820 2035.2 43.0 74.1 6.5
3.1 Company Operated vehicle 8856 8856 820 7261.9 43.0 74.1 23.1
3.2 Diesel for Forklift 37967 37967 820 31132.9 43.0 74.1 99.2
3.5 Coal Handling-JCB 8548 8548 820 7009.4 43.0 74.1 22.3
4.1 Company Operated Vehicles 324.77 325 720 233.8 44.3 69.3 0.7
5 kg 521.5 522 521.5 0.5
6.1 Type 1 (R22) 310.7 311 310.7 1810 562.4
7.2 Canteen,Pantry & Guest house 410 410 409.5 47.3 63.1 1.2
11 Welding - Acetylene m3 114.5 115 4043 0.1100 0.4
Emission (t
CO2)
kWh 41808701 41808701 0.82 34283.1
kWh 38990018 38990018 0.82 31971.8
General InformationProduction
B Tree Plantation Nos
11.1
This is Average calorific value
1.2
kg
2
Diesel (Stationary)
Ltr
3
Diesel (Movable)
Ltr
Renewable Energy
4Petrol (Movable)
Ltr
Fire Extinguishers - CO2
6Air Conditioners – Refrigerants
kg
7LPG Consumption
SCOPE 2
Purchased Elecriticy from Grid
Emission factor (kg CO2/kWh)
Same for all Grid (NEWNE & S)
27.3 % offset/sequestration with respect to overall emission
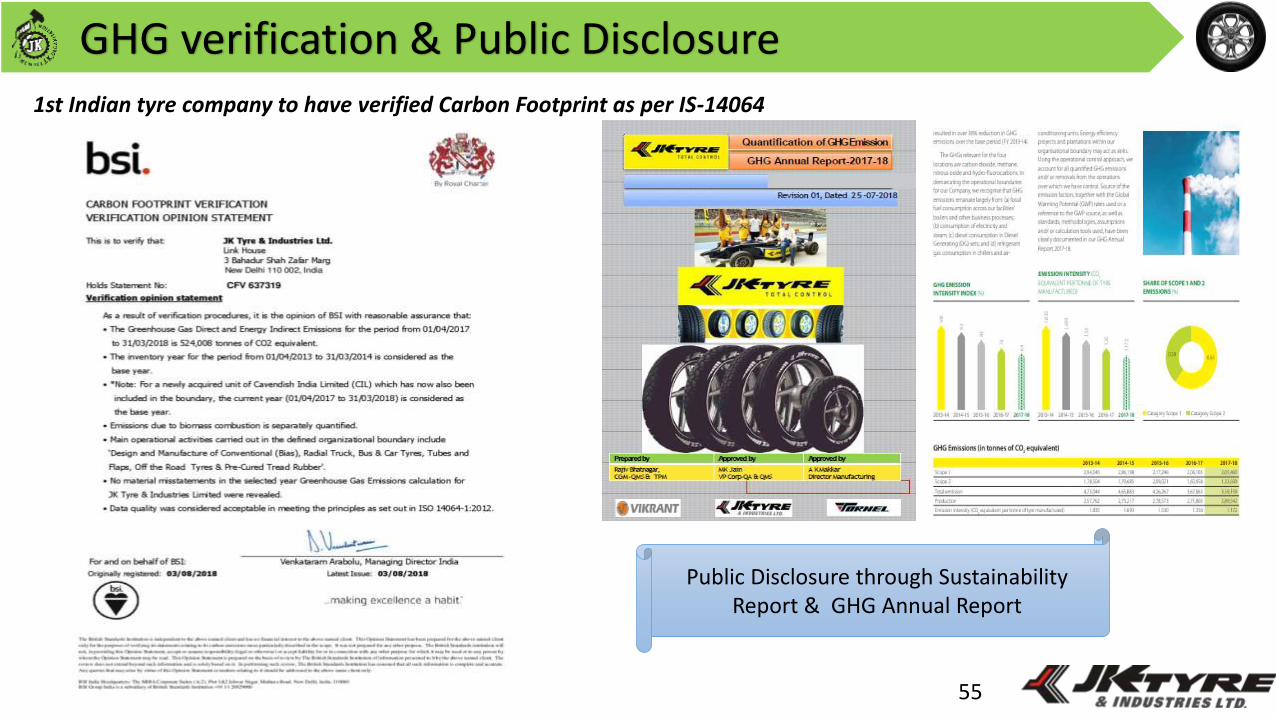
GHG verification & Public Disclosure
55
1st Indian tyre company to have verified Carbon Footprint as per IS-14064
Public Disclosure through Sustainability Report & GHG Annual Report

56
Waste Management
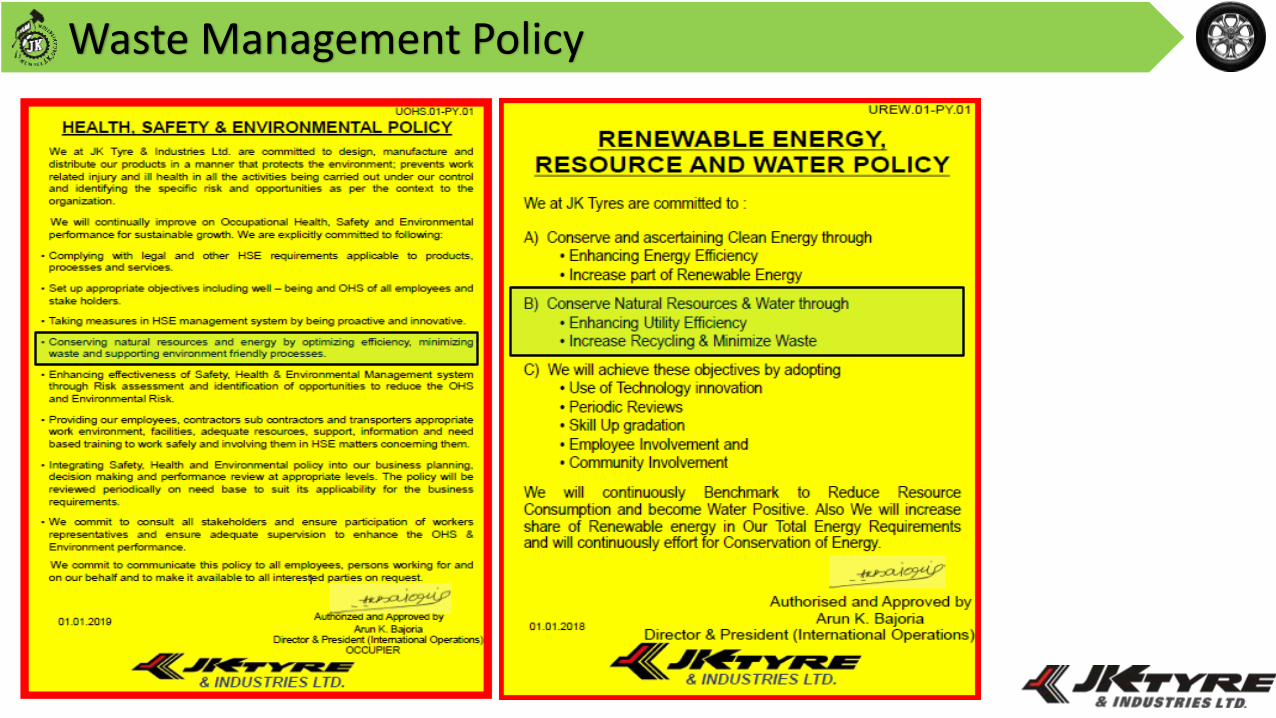
Waste Management Policy
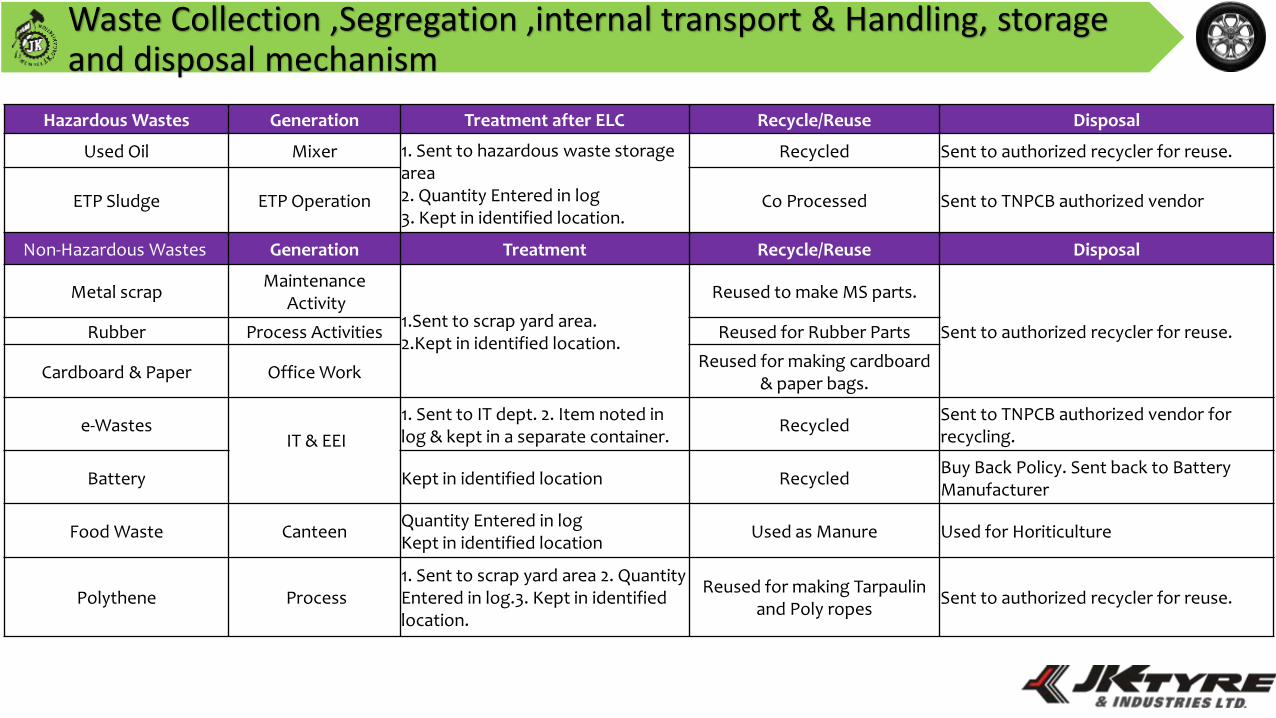
Waste Collection ,Segregation ,internal transport & Handling, storage and disposal mechanism
Hazardous Wastes Generation Treatment after ELC Recycle/Reuse Disposal
Used Oil Mixer 1. Sent to hazardous waste storage area 2. Quantity Entered in log3. Kept in identified location.
Recycled Sent to authorized recycler for reuse.
ETP Sludge ETP Operation Co Processed Sent to TNPCB authorized vendor
Non-Hazardous Wastes Generation Treatment Recycle/Reuse Disposal
Metal scrapMaintenance
Activity1.Sent to scrap yard area. 2.Kept in identified location.
Reused to make MS parts.
Sent to authorized recycler for reuse.Rubber Process Activities Reused for Rubber Parts
Cardboard & Paper Office WorkReused for making cardboard
& paper bags.
e-WastesIT & EEI
1. Sent to IT dept. 2. Item noted in log & kept in a separate container.
RecycledSent to TNPCB authorized vendor for recycling.
Battery Kept in identified location RecycledBuy Back Policy. Sent back to Battery Manufacturer
Food Waste CanteenQuantity Entered in logKept in identified location
Used as Manure Used for Horiticulture
Polythene Process 1. Sent to scrap yard area 2. Quantity Entered in log.3. Kept in identified location.
Reused for making Tarpaulin and Poly ropes
Sent to authorized recycler for reuse.
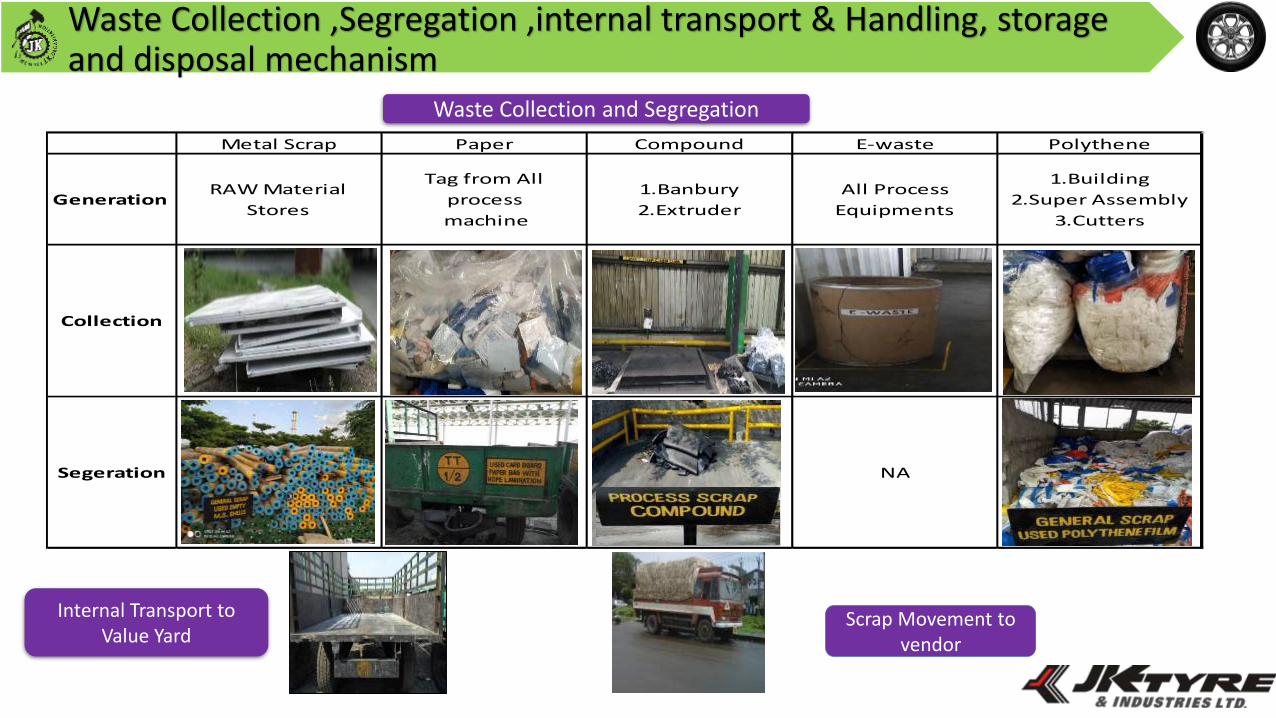
Waste Collection ,Segregation ,internal transport & Handling, storage and disposal mechanism
Waste Collection and Segregation
Internal Transport to Value Yard
Scrap Movement to vendor
Metal Scrap Paper Compound E-waste Polythene
NASegeration
All Process
Equipments
1.Building
2.Super Assembly
3.Cutters
Collection
Generation RAW Material
Stores
Tag from All
process
machine
1.Banbury
2.Extruder
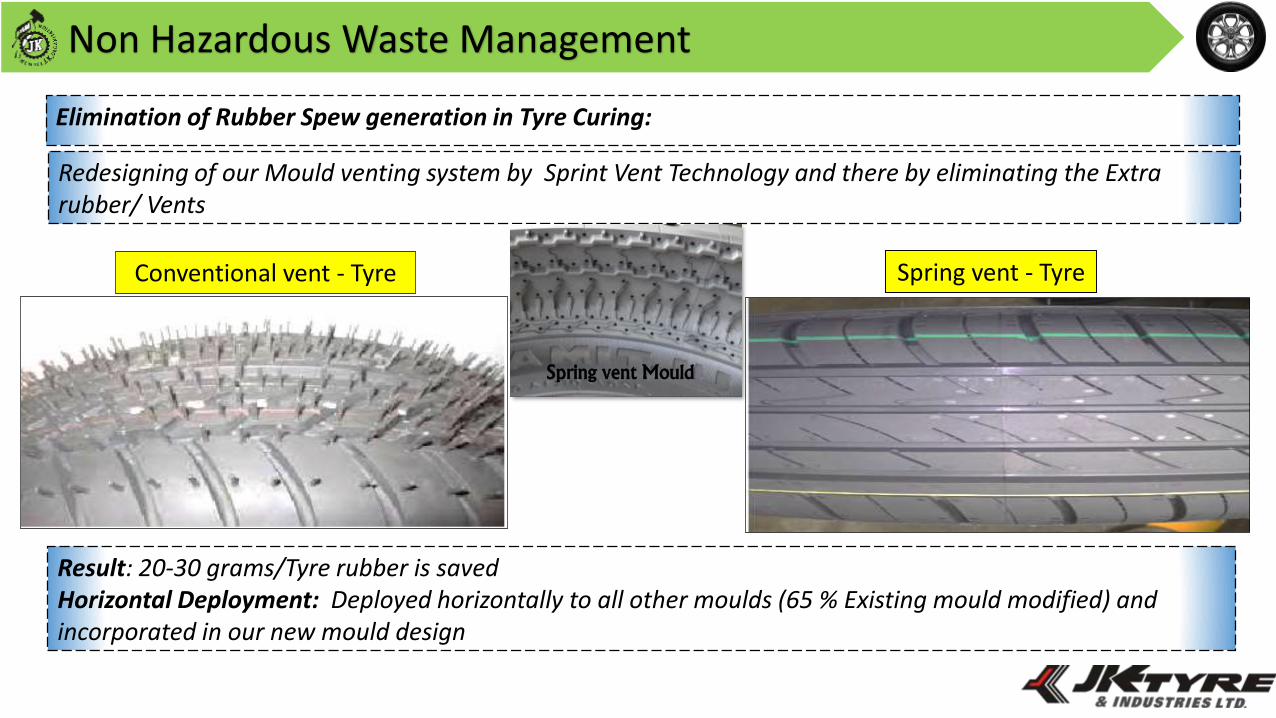
Non Hazardous Waste Management
Elimination of Rubber Spew generation in Tyre Curing:
Conventional vent - Tyre
Redesigning of our Mould venting system by Sprint Vent Technology and there by eliminating the Extra rubber/ Vents
Spring vent - Tyre
Result: 20-30 grams/Tyre rubber is savedHorizontal Deployment: Deployed horizontally to all other moulds (65 % Existing mould modified) and incorporated in our new mould design
Spring vent Mould
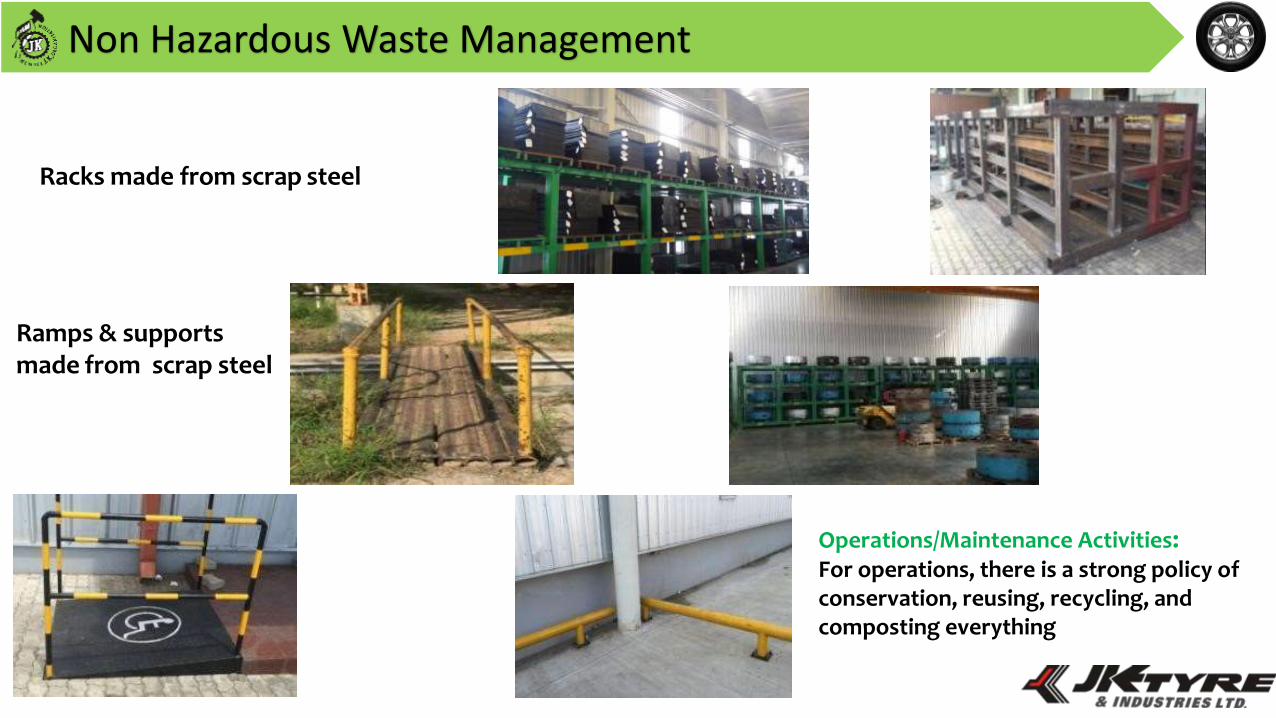
Non Hazardous Waste Management
Ramps & supports made from scrap steel
Racks made from scrap steel
Operations/Maintenance Activities:For operations, there is a strong policy of conservation, reusing, recycling, and composting everything
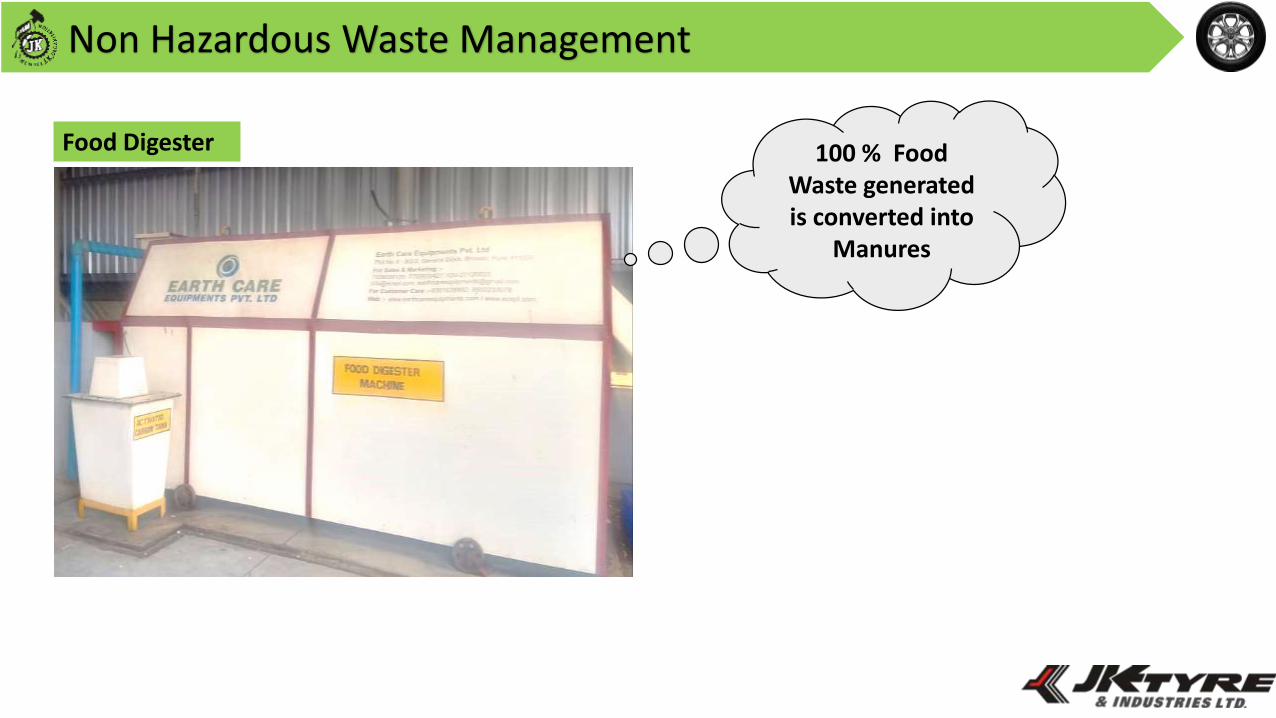
Non Hazardous Waste Management
Food Digester 100 % Food Waste generated is converted into
Manures
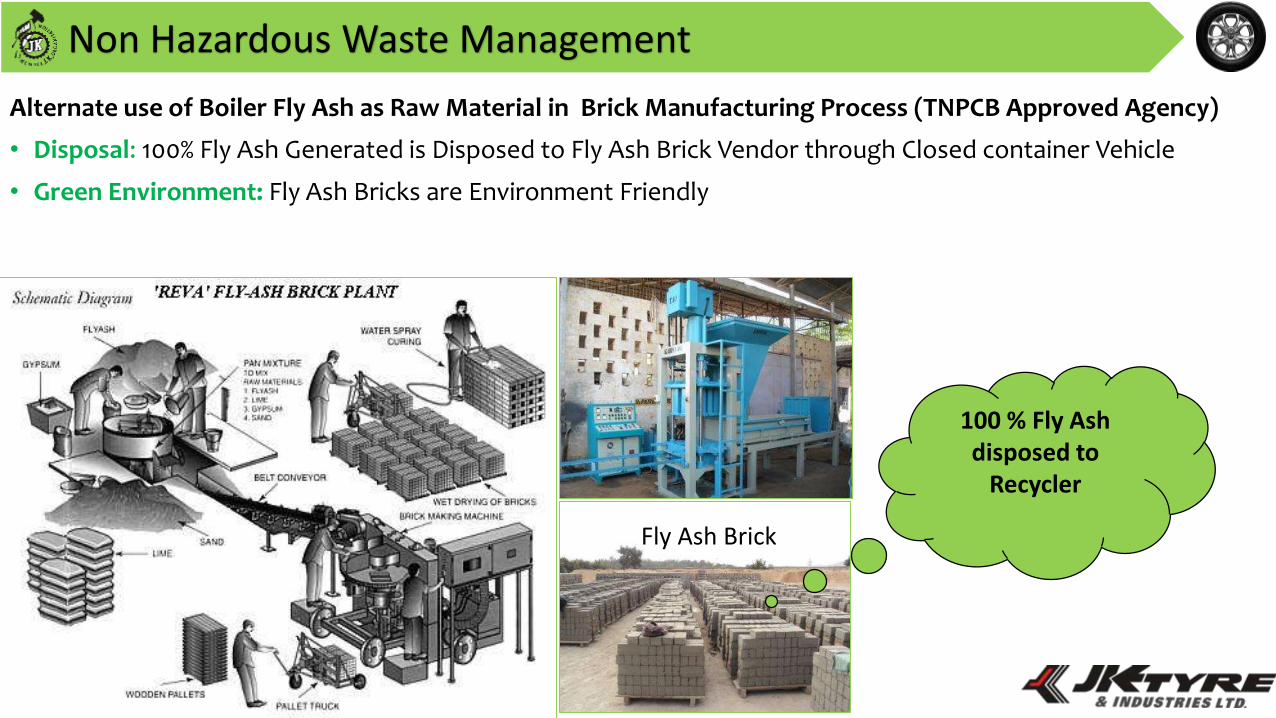
Non Hazardous Waste Management
Fly Ash Brick
Alternate use of Boiler Fly Ash as Raw Material in Brick Manufacturing Process (TNPCB Approved Agency)
• Disposal: 100% Fly Ash Generated is Disposed to Fly Ash Brick Vendor through Closed container Vehicle
• Green Environment: Fly Ash Bricks are Environment Friendly
100 % Fly Ash disposed to
Recycler
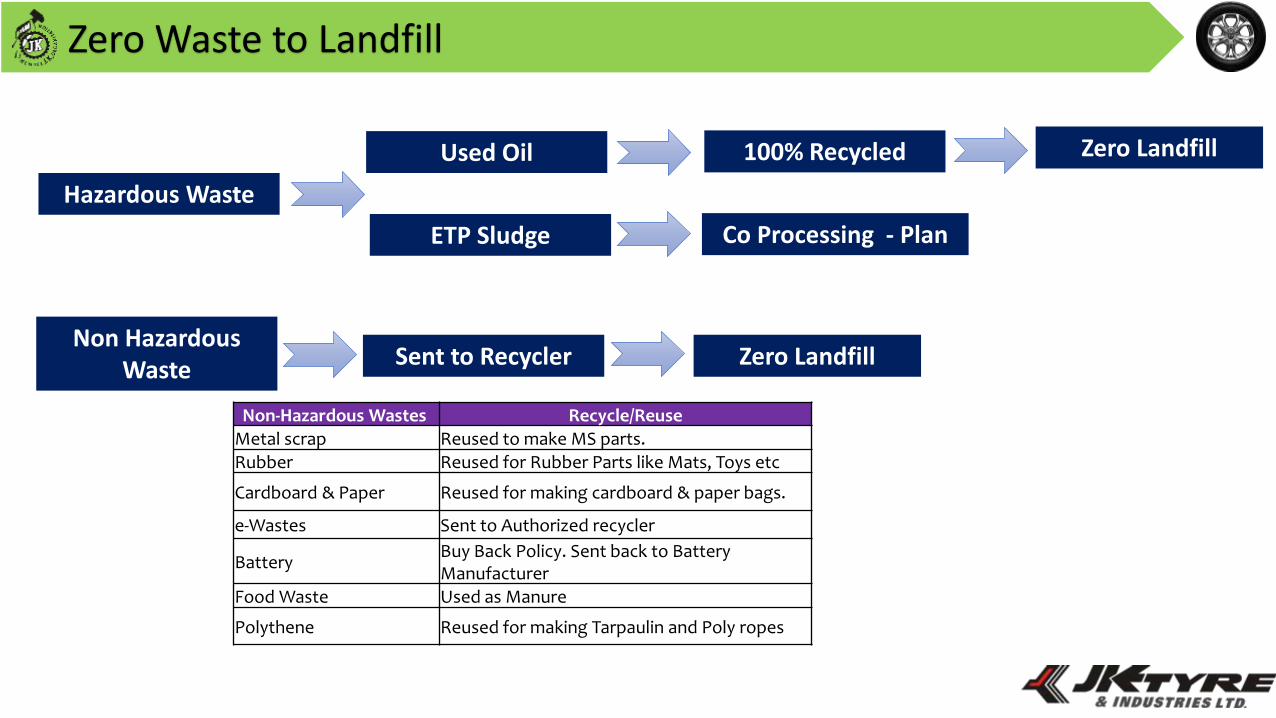
Zero Waste to Landfill
Hazardous Waste
Used Oil
ETP Sludge
100% Recycled Zero Landfill
Non Hazardous Waste
Sent to Recycler
Co Processing - Plan
Zero Landfill
Non-Hazardous Wastes Recycle/Reuse
Metal scrap Reused to make MS parts.Rubber Reused for Rubber Parts like Mats, Toys etc
Cardboard & Paper Reused for making cardboard & paper bags.
e-Wastes Sent to Authorized recycler
BatteryBuy Back Policy. Sent back to Battery Manufacturer
Food Waste Used as Manure
Polythene Reused for making Tarpaulin and Poly ropes
65
Material Conservation
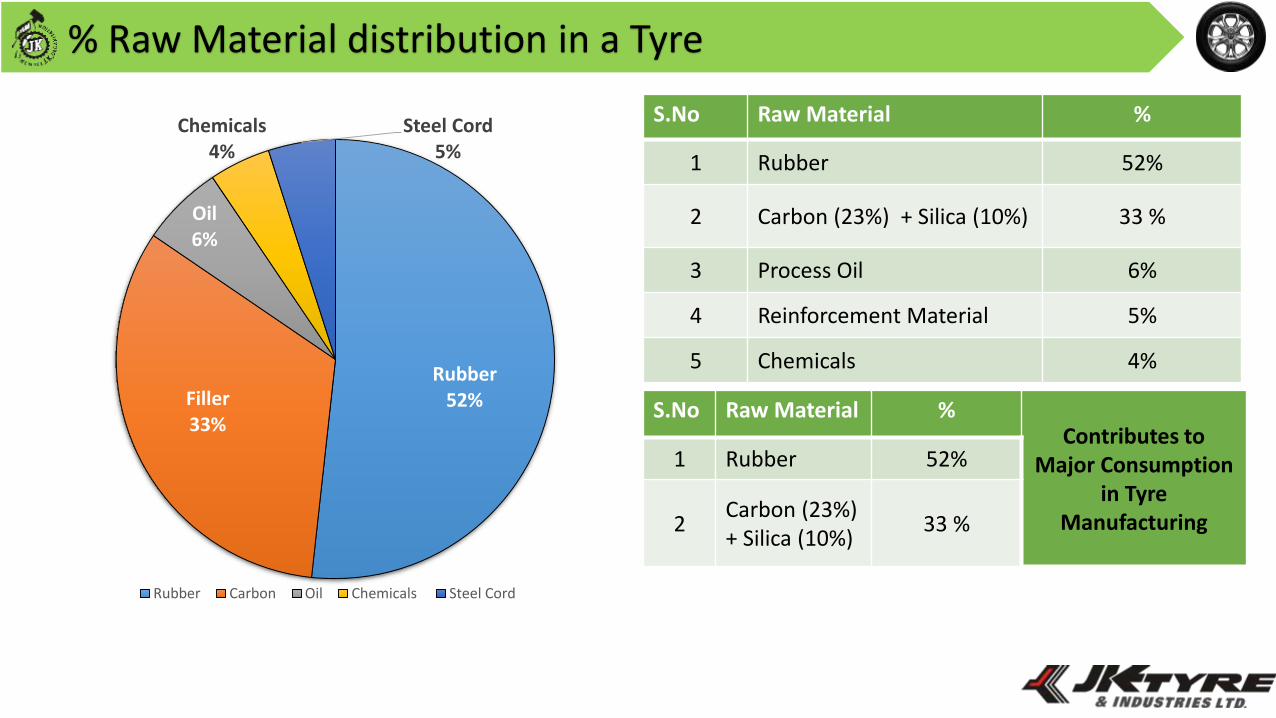
% Raw Material distribution in a Tyre
Rubber52%Filler
33%
Oil6%
Chemicals 4%
Steel Cord 5%
Rubber Carbon Oil Chemicals Steel Cord
S.No Raw Material %
1 Rubber 52%
2 Carbon (23%) + Silica (10%) 33 %
3 Process Oil 6%
4 Reinforcement Material 5%
5 Chemicals 4%
S.No Raw Material %Contributes to
Major Consumption in Tyre
Manufacturing
1 Rubber 52%
2Carbon (23%) + Silica (10%)
33 %
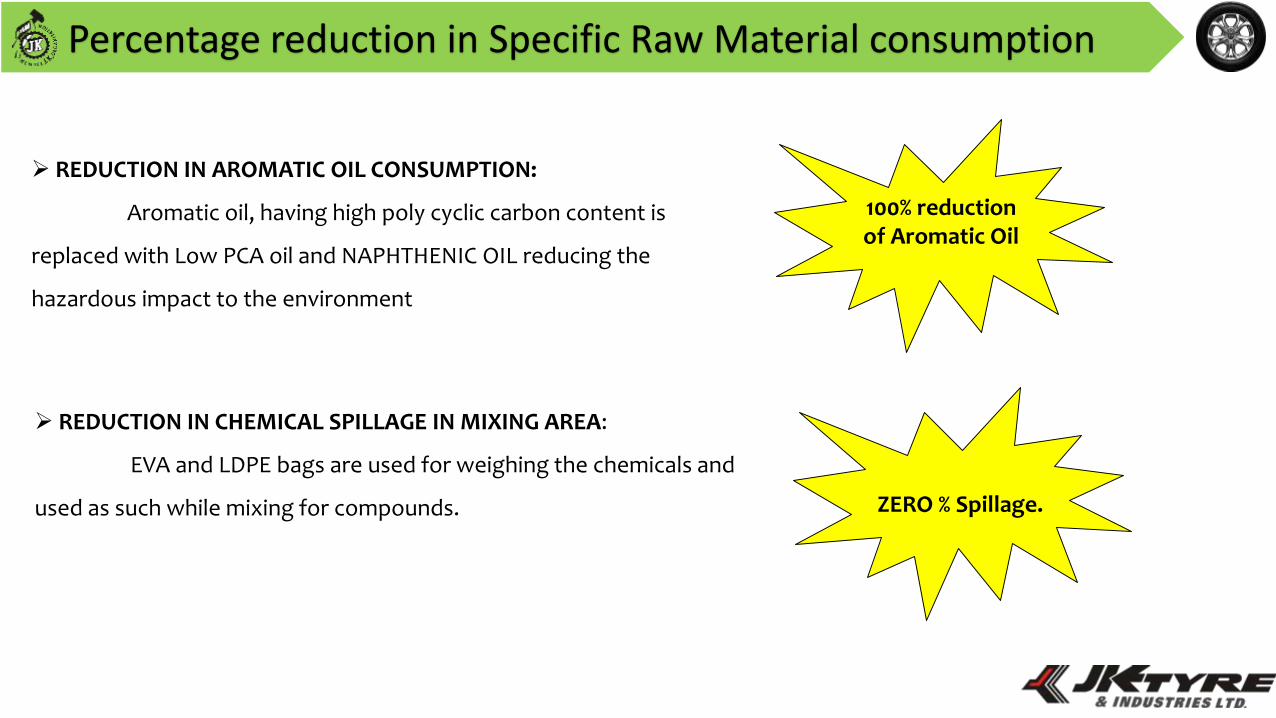
Percentage reduction in Specific Raw Material consumption
REDUCTION IN CHEMICAL SPILLAGE IN MIXING AREA:
EVA and LDPE bags are used for weighing the chemicals and
used as such while mixing for compounds.
REDUCTION IN AROMATIC OIL CONSUMPTION:
Aromatic oil, having high poly cyclic carbon content is
replaced with Low PCA oil and NAPHTHENIC OIL reducing the
hazardous impact to the environment
100% reduction of Aromatic Oil
ZERO % Spillage.
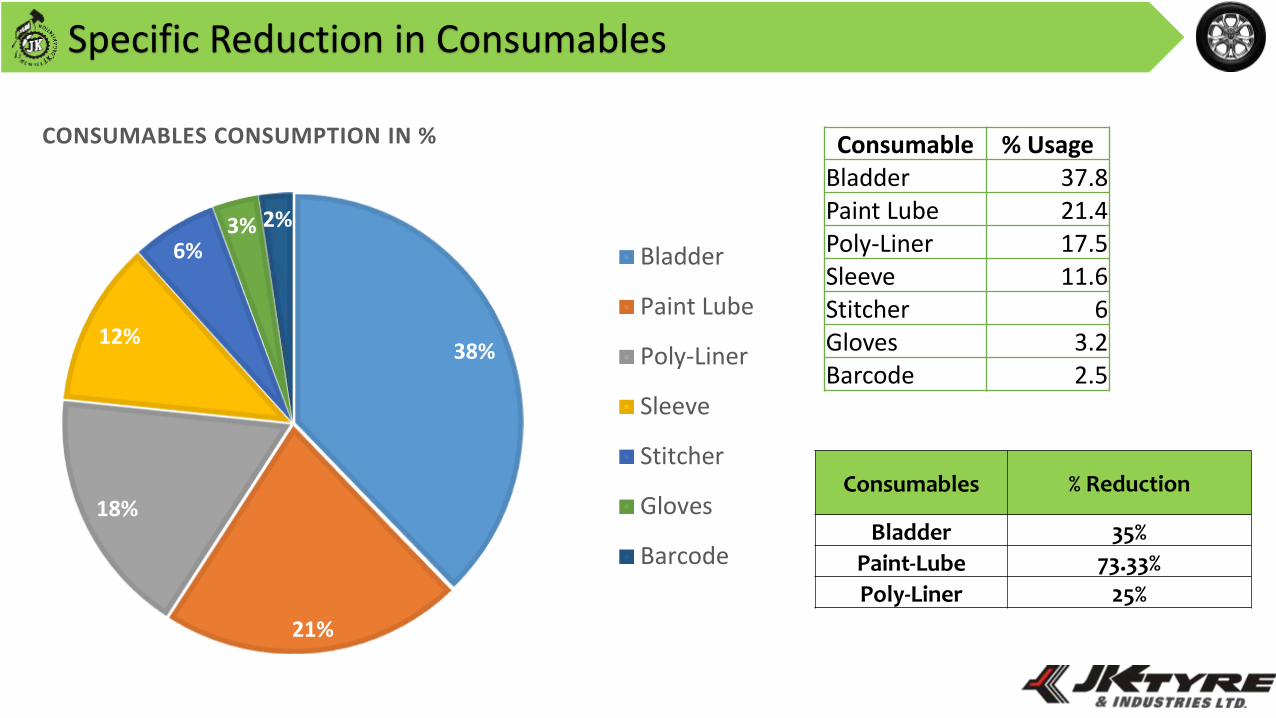
Specific Reduction in Consumables
38%
21%
18%
12%
6%3% 2%
CONSUMABLES CONSUMPTION IN %
Bladder
Paint Lube
Poly-Liner
Sleeve
Stitcher
Gloves
Barcode
Consumable % UsageBladder 37.8Paint Lube 21.4Poly-Liner 17.5Sleeve 11.6Stitcher 6Gloves 3.2Barcode 2.5
Consumables % Reduction
Bladder 35%
Paint-Lube 73.33%
Poly-Liner 25%
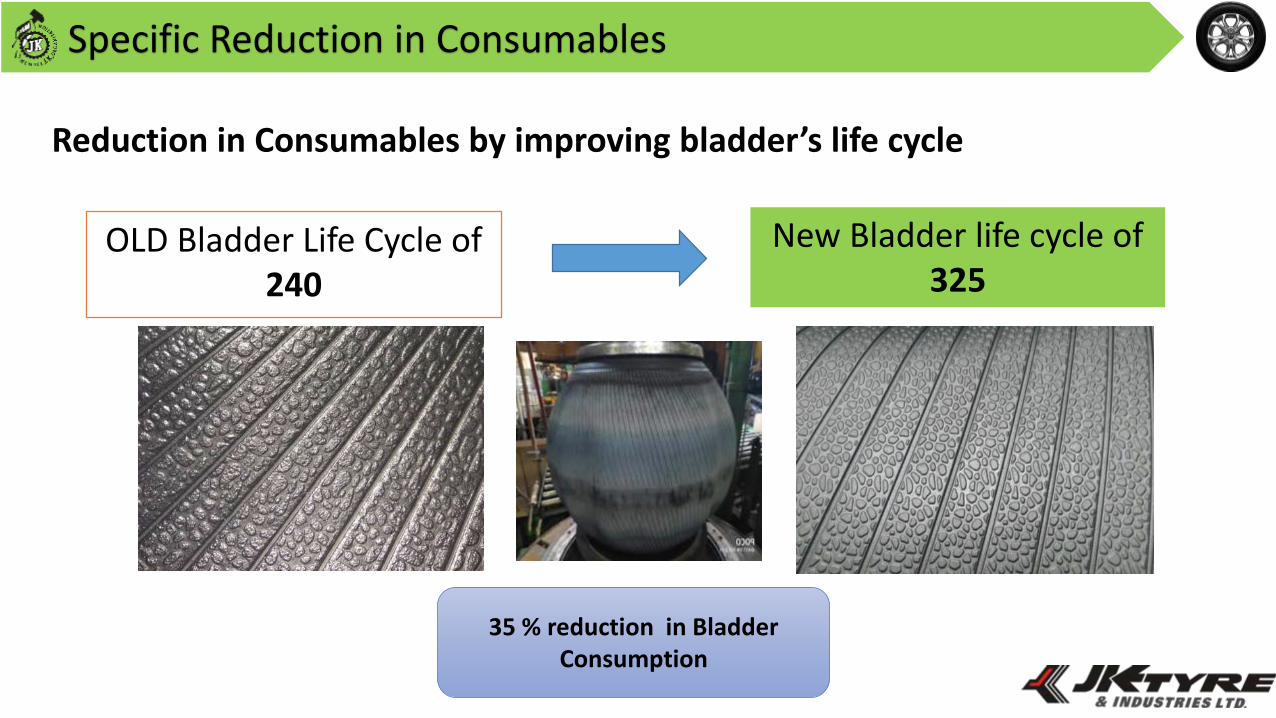
Specific Reduction in Consumables
Reduction in Consumables by improving bladder’s life cycle
OLD Bladder Life Cycle of 240
New Bladder life cycle of 325
35 % reduction in Bladder Consumption
Specific Reduction in Consumables
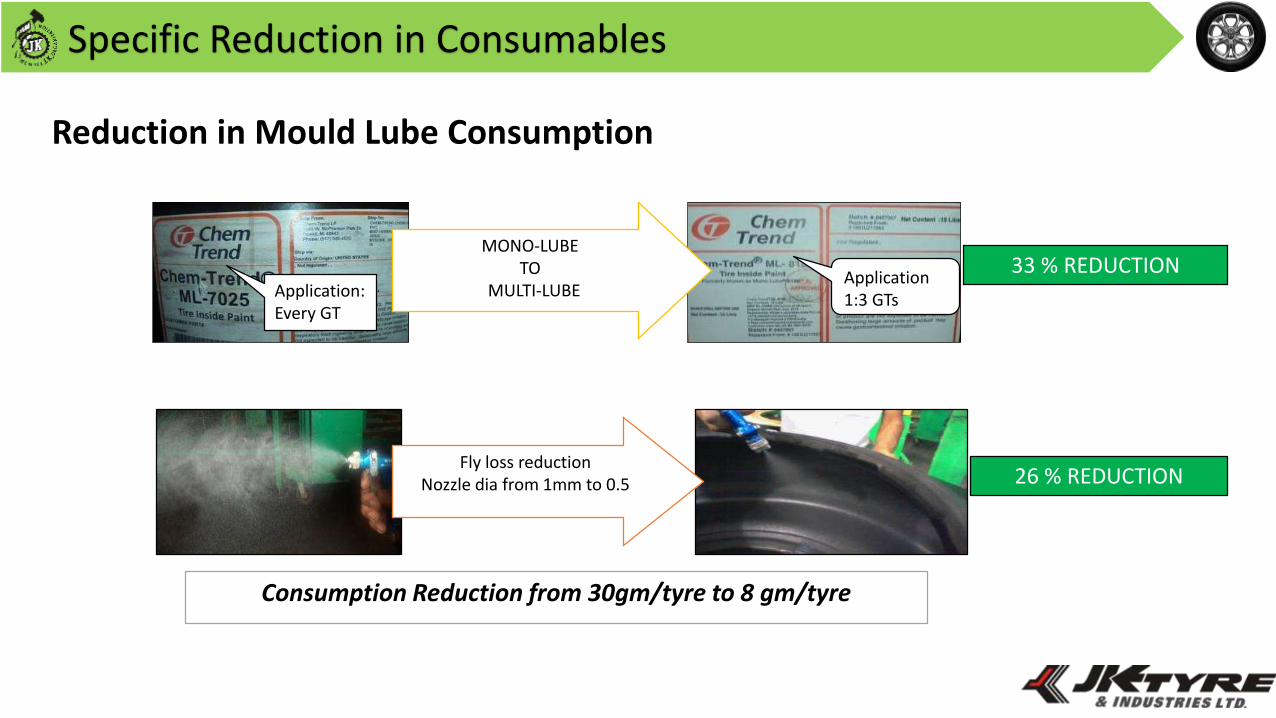
Reduction in Mould Lube Consumption
Fly loss reductionNozzle dia from 1mm to 0.5
Consumption Reduction from 30gm/tyre to 8 gm/tyre
Application 1:3 GTs
MONO-LUBE TO
MULTI-LUBEApplication: Every GT
33 % REDUCTION
26 % REDUCTION
Specific Reduction in Consumables
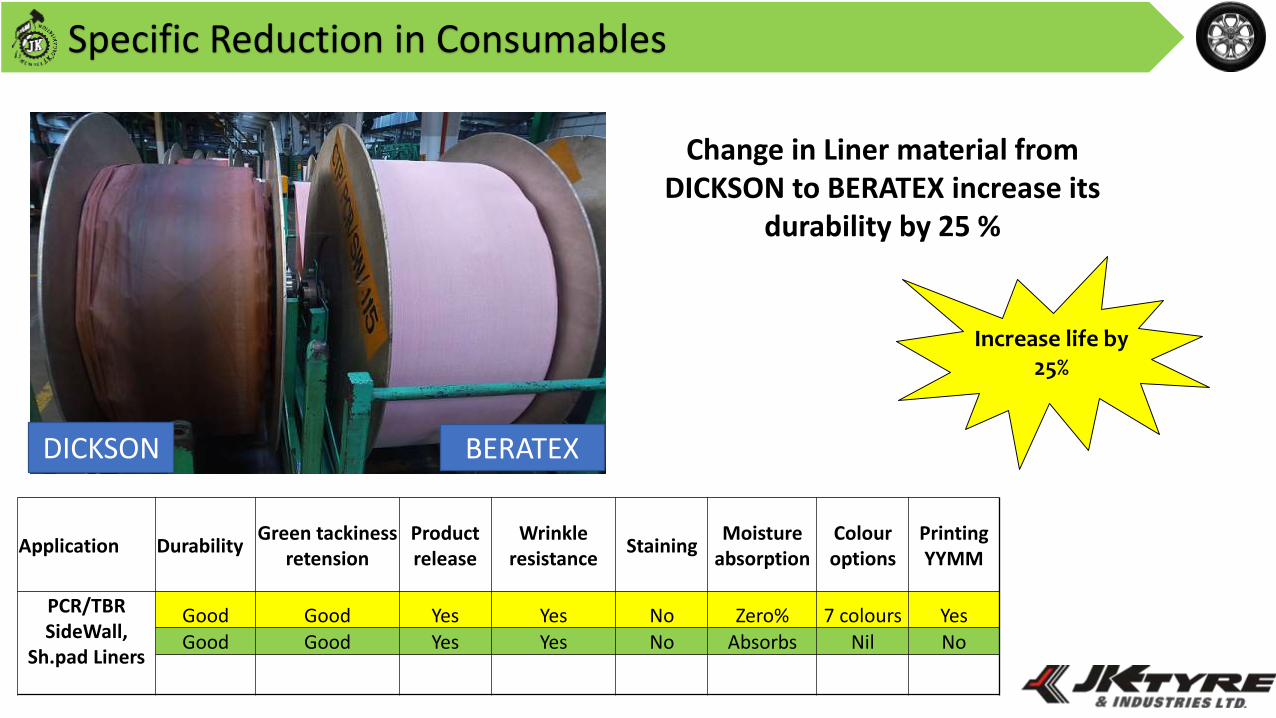
DICKSON BERATEX
Change in Liner material from DICKSON to BERATEX increase its
durability by 25 %
Application DurabilityGreen tackiness
retensionProduct release
Wrinkle resistance
StainingMoisture
absorptionColour options
Printing YYMM
PCR/TBR SideWall,
Sh.pad Liners
Good Good Yes Yes No Zero% 7 colours YesGood Good Yes Yes No Absorbs Nil No
Increase life by 25%
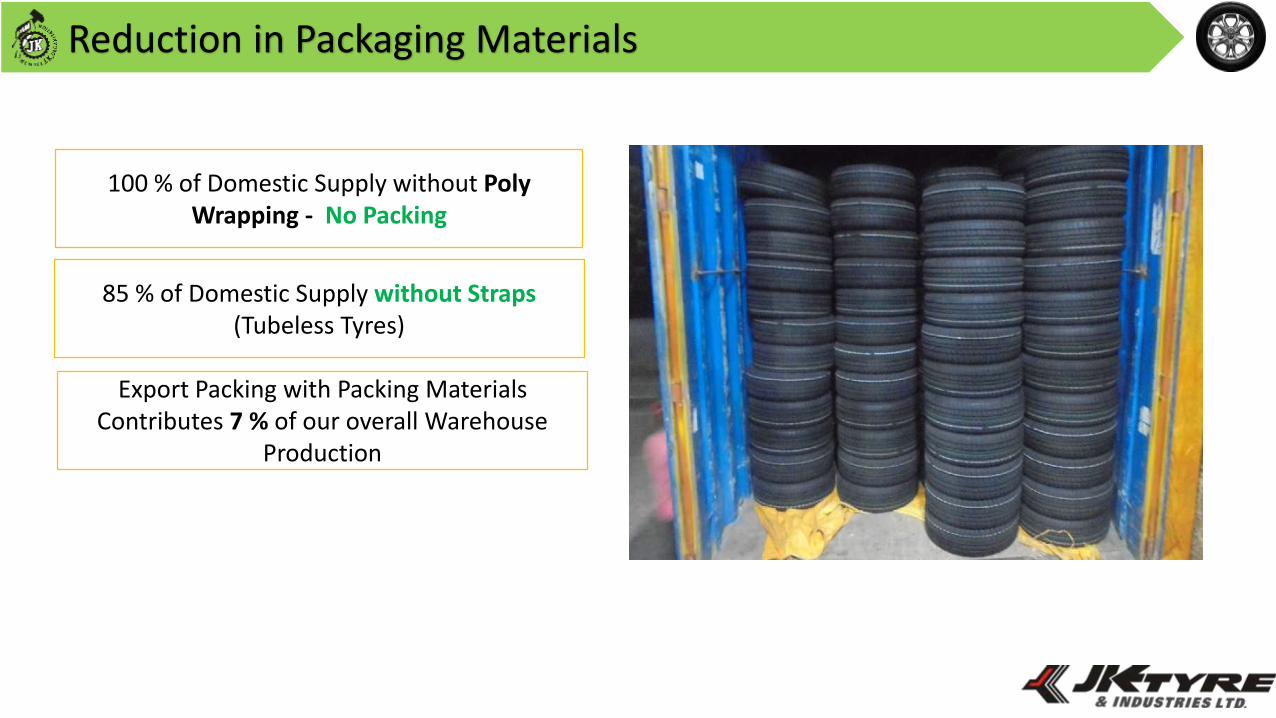
Reduction in Packaging Materials
100 % of Domestic Supply without Poly Wrapping - No Packing
85 % of Domestic Supply without Straps (Tubeless Tyres)
Export Packing with Packing Materials Contributes 7 % of our overall Warehouse
Production
Green Supply Chain
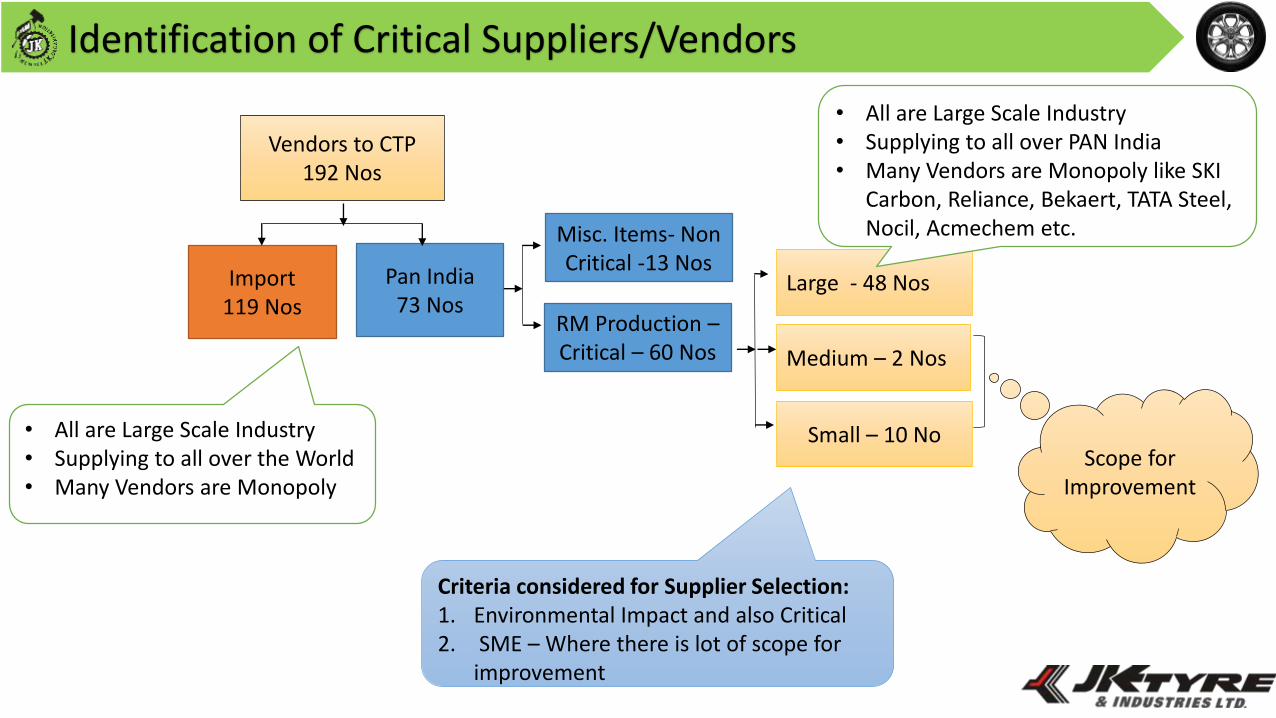
Identification of Critical Suppliers/Vendors
Vendors to CTP 192 Nos
Import 119 Nos
Pan India73 Nos
• All are Large Scale Industry• Supplying to all over the World• Many Vendors are Monopoly
Large - 48 Nos
Medium – 2 Nos
Small – 10 No
• All are Large Scale Industry• Supplying to all over PAN India• Many Vendors are Monopoly like SKI
Carbon, Reliance, Bekaert, TATA Steel, Nocil, Acmechem etc.
RM Production –Critical – 60 Nos
Misc. Items- Non Critical -13 Nos
Scope for Improvement
Criteria considered for Supplier Selection:1. Environmental Impact and also Critical2. SME – Where there is lot of scope for
improvement
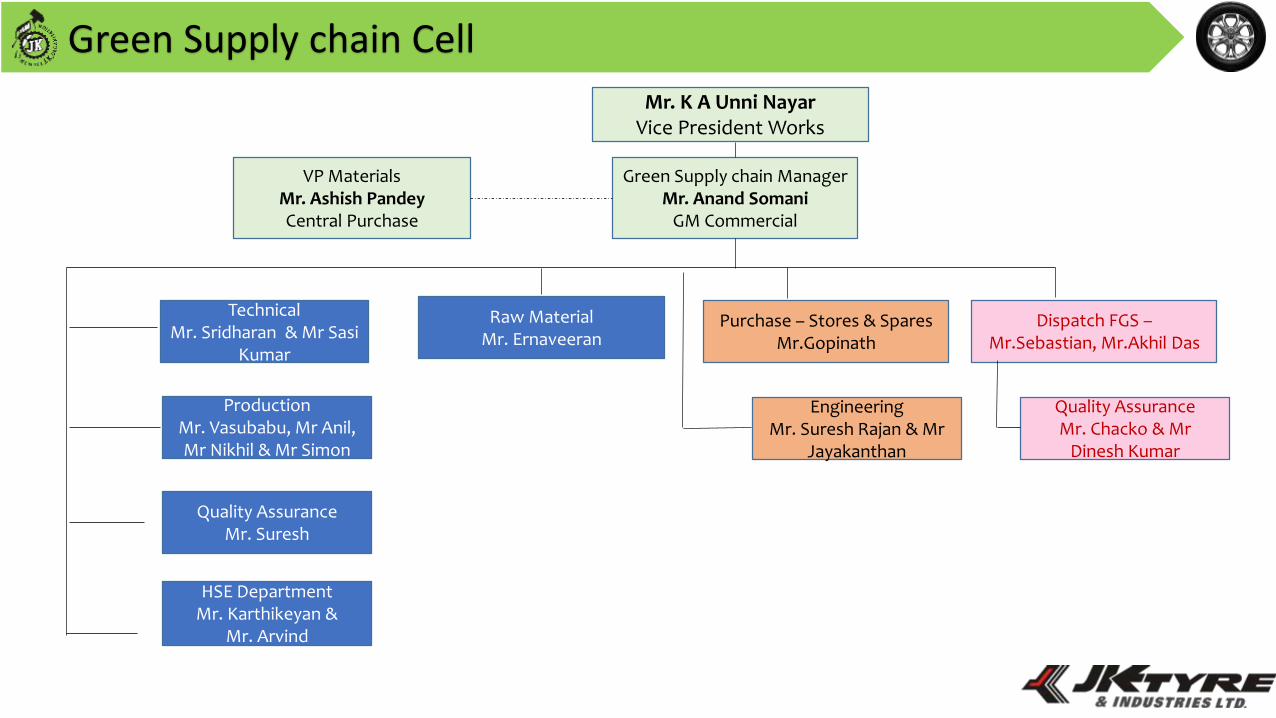
Green Supply chain Cell
Green Supply chain ManagerMr. Anand Somani
GM Commercial
VP MaterialsMr. Ashish PandeyCentral Purchase
Raw MaterialMr. Ernaveeran
Purchase – Stores & SparesMr.Gopinath
TechnicalMr. Sridharan & Mr Sasi
Kumar
ProductionMr. Vasubabu, Mr Anil, Mr Nikhil & Mr Simon
Quality AssuranceMr. Suresh
HSE DepartmentMr. Karthikeyan &
Mr. Arvind
EngineeringMr. Suresh Rajan & Mr
Jayakanthan
Mr. K A Unni NayarVice President Works
Dispatch FGS –Mr.Sebastian, Mr.Akhil Das
Quality AssuranceMr. Chacko & Mr
Dinesh Kumar
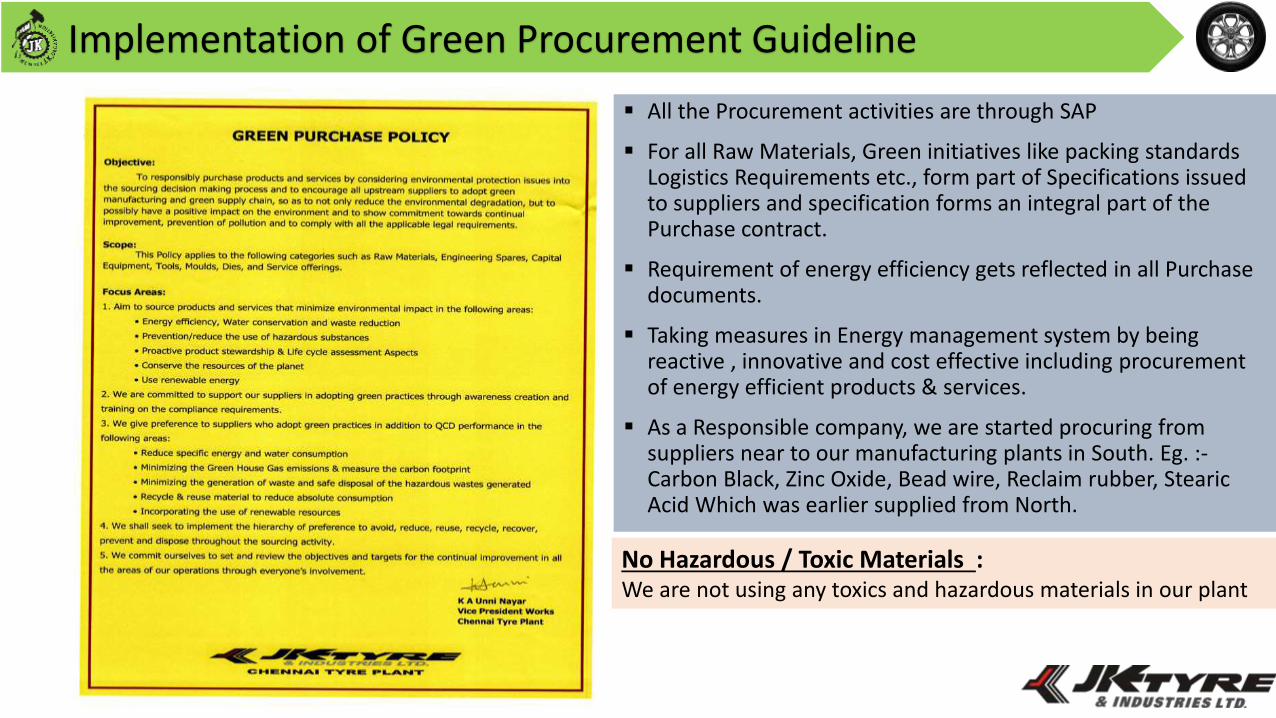
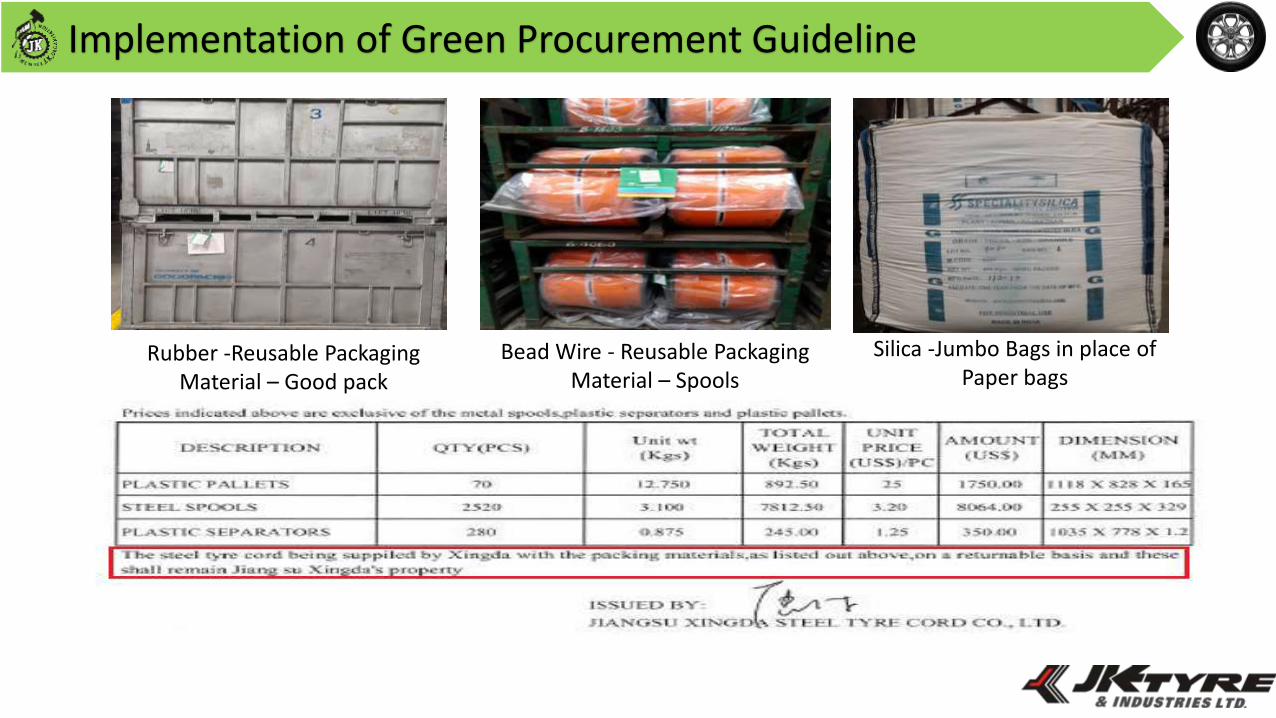
Implementation of Green Procurement Guideline
All the Procurement activities are through SAP
For all Raw Materials, Green initiatives like packing standards Logistics Requirements etc., form part of Specifications issued to suppliers and specification forms an integral part of the Purchase contract.
Requirement of energy efficiency gets reflected in all Purchase documents.
Taking measures in Energy management system by being reactive , innovative and cost effective including procurement of energy efficient products & services.
As a Responsible company, we are started procuring from suppliers near to our manufacturing plants in South. Eg. :-Carbon Black, Zinc Oxide, Bead wire, Reclaim rubber, Stearic Acid Which was earlier supplied from North.
No Hazardous / Toxic Materials :We are not using any toxics and hazardous materials in our plant
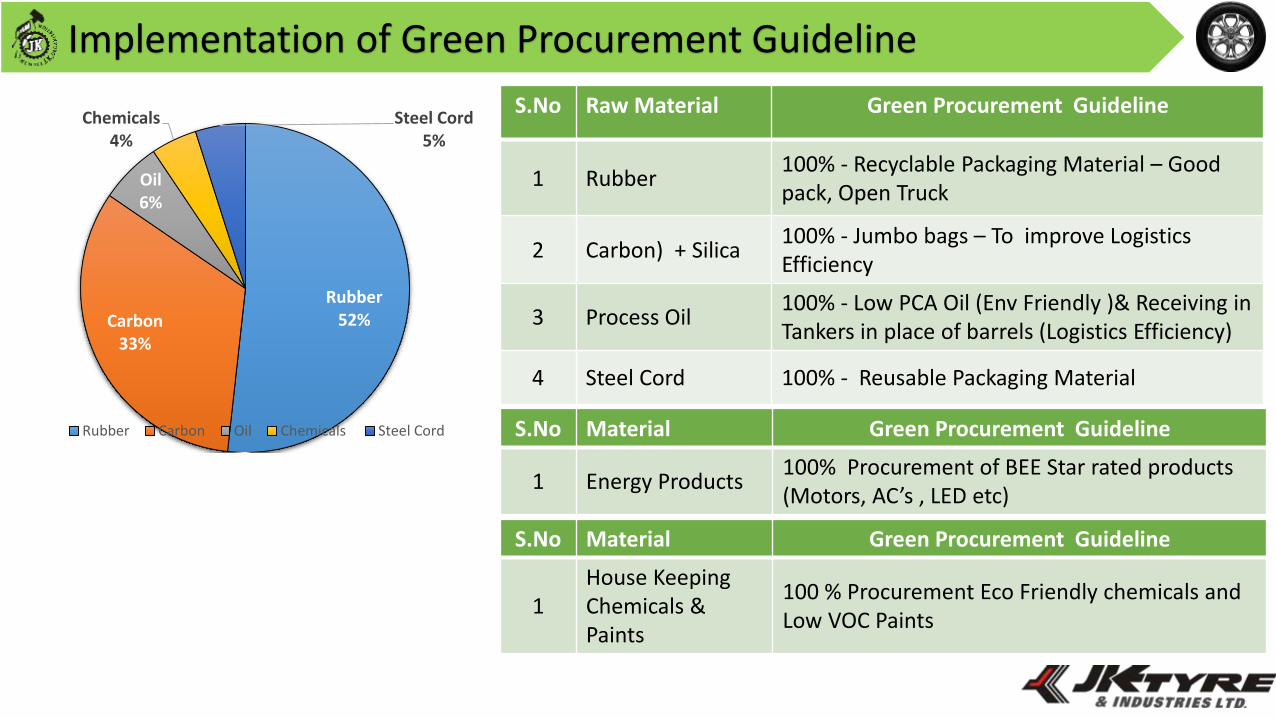
Implementation of Green Procurement Guideline
Rubber52%Carbon
33%
Oil6%
Chemicals 4%
Steel Cord 5%
Rubber Carbon Oil Chemicals Steel Cord
S.No Raw Material Green Procurement Guideline
1 Rubber100% - Recyclable Packaging Material – Goodpack, Open Truck
2 Carbon) + Silica 100% - Jumbo bags – To improve Logistics Efficiency
3 Process Oil100% - Low PCA Oil (Env Friendly )& Receiving in Tankers in place of barrels (Logistics Efficiency)
4 Steel Cord 100% - Reusable Packaging Material
S.No Material Green Procurement Guideline
1 Energy Products100% Procurement of BEE Star rated products (Motors, AC’s , LED etc)
S.No Material Green Procurement Guideline
1House Keeping Chemicals & Paints
100 % Procurement Eco Friendly chemicals and Low VOC Paints
Implementation of Green Procurement Guideline
Bead Wire - Reusable Packaging Material – Spools
Rubber -Reusable Packaging Material – Good pack
Silica -Jumbo Bags in place of Paper bags
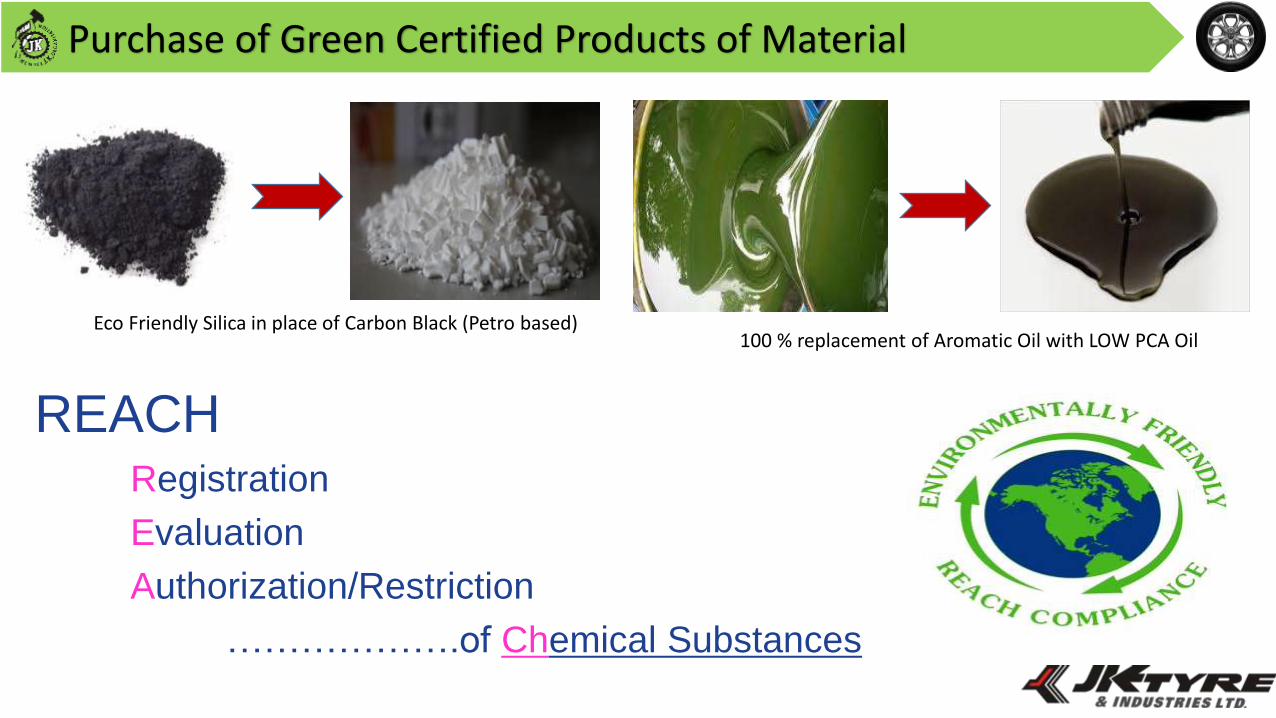
Purchase of Green Certified Products of Material
Eco Friendly Silica in place of Carbon Black (Petro based)100 % replacement of Aromatic Oil with LOW PCA Oil
REACHRegistration
Evaluation
Authorization/Restriction
……………….of Chemical Substances
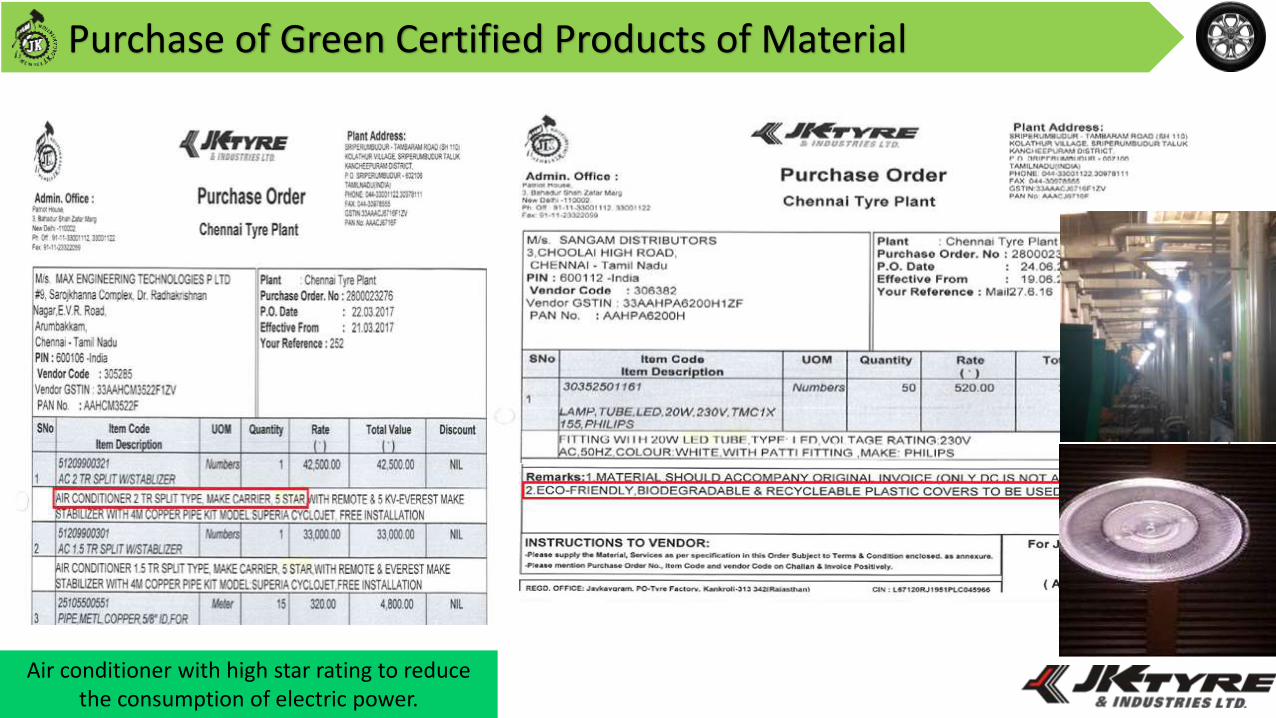
Purchase of Green Certified Products of Material
Air conditioner with high star rating to reduce the consumption of electric power.
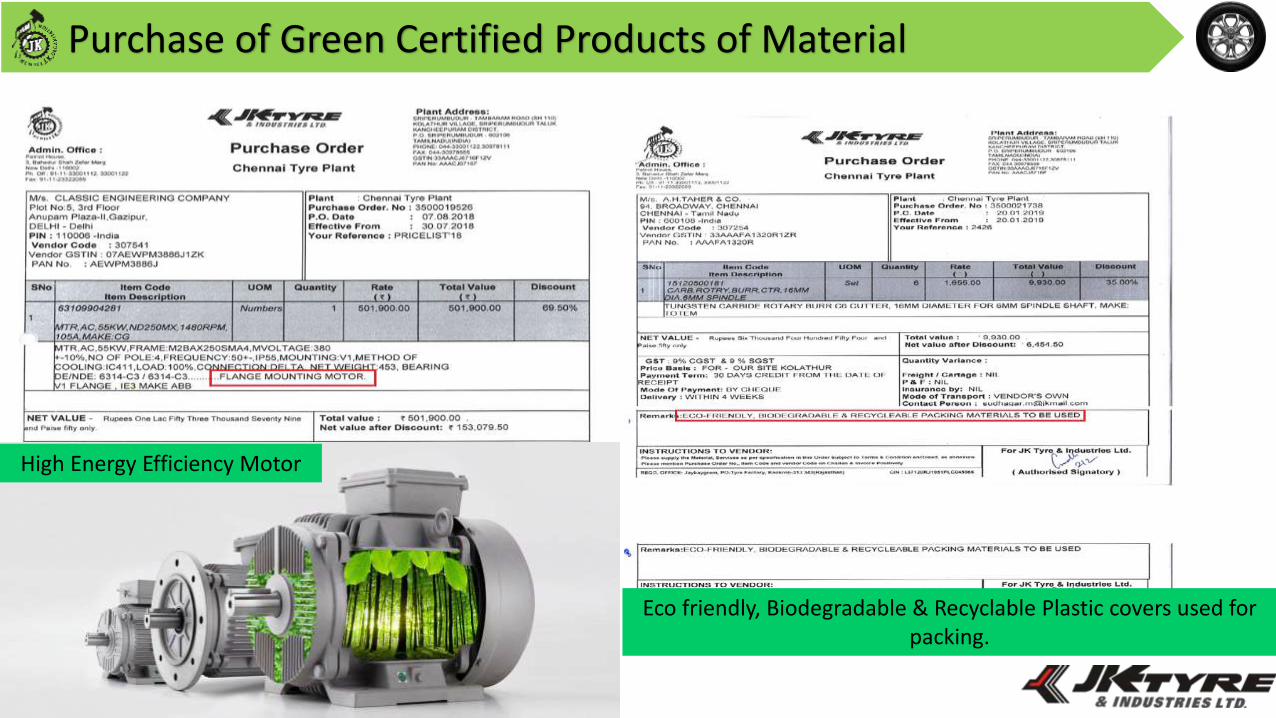
Purchase of Green Certified Products of Material
High Energy Efficiency Motor
Eco friendly, Biodegradable & Recyclable Plastic covers used for packing.
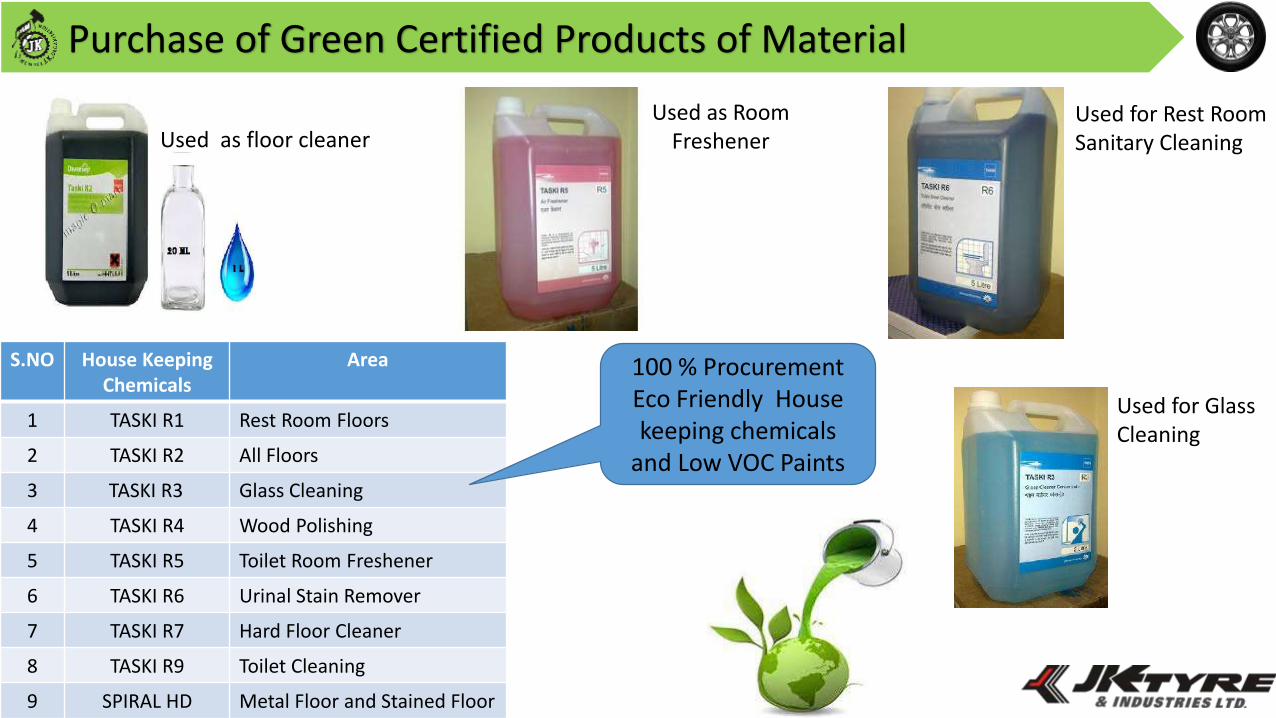
Purchase of Green Certified Products of Material
Used as floor cleanerUsed as Room
FreshenerUsed for Rest Room Sanitary Cleaning
Used for Glass Cleaning
S.NO House Keeping Chemicals
Area
1 TASKI R1 Rest Room Floors
2 TASKI R2 All Floors
3 TASKI R3 Glass Cleaning
4 TASKI R4 Wood Polishing
5 TASKI R5 Toilet Room Freshener
6 TASKI R6 Urinal Stain Remover
7 TASKI R7 Hard Floor Cleaner
8 TASKI R9 Toilet Cleaning
9 SPIRAL HD Metal Floor and Stained Floor
100 % Procurement Eco Friendly House keeping chemicals
and Low VOC Paints
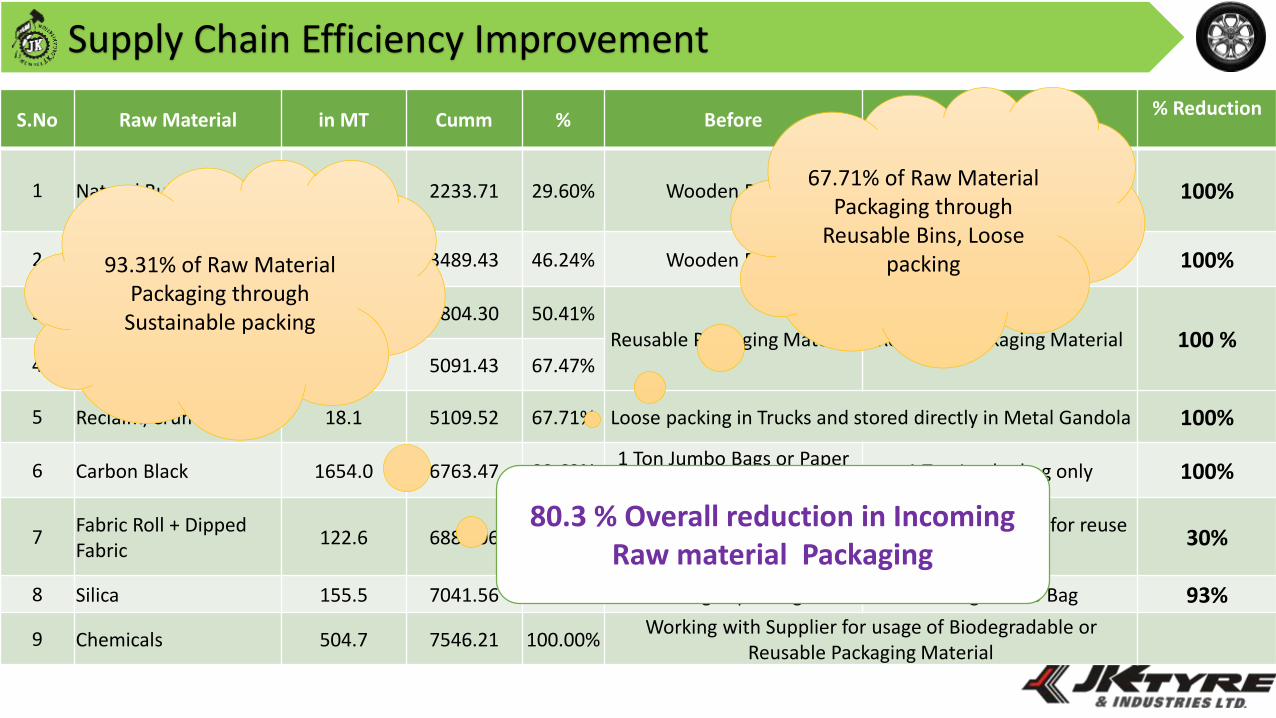
Supply Chain Efficiency Improvement
S.No Raw Material in MT Cumm % Before After% Reduction
1 Natural Rubber 2233.7 2233.71 29.60% Wooden Pallets Loose packing in Trucks and
stored directly in Metal Gandola
100%
2 Synthetic Rubber 1255.7 3489.43 46.24% Wooden PalletsReusable Bins like Good pack
or GPS100%
3 Bead Wire 314.9 3804.30 50.41%Reusable Packaging Material Reusable Packaging Material 100 %
4 Steel Tyre Cord 1287.1 5091.43 67.47%
5 Reclaim/Crumb Rubber 18.1 5109.52 67.71% Loose packing in Trucks and stored directly in Metal Gandola 100%
6 Carbon Black 1654.0 6763.47 89.63%1 Ton Jumbo Bags or Paper
bags1 Ton Jumbo bag only 100%
7Fabric Roll + Dipped Fabric
122.6 6886.06 91.25%Empty Shells return back to the Domestic supplier for reuse
Working with Import supplier for reuse30%
8 Silica 155.5 7041.56 93.31% 25 Kg Paper bag 400 Kg Jumbo Bag 93%
9 Chemicals 504.7 7546.21 100.00%Working with Supplier for usage of Biodegradable or
Reusable Packaging Material
67.71% of Raw Material Packaging through
Reusable Bins, Loose packing93.31% of Raw Material
Packaging through Sustainable packing
80.3 % Overall reduction in Incoming Raw material Packaging
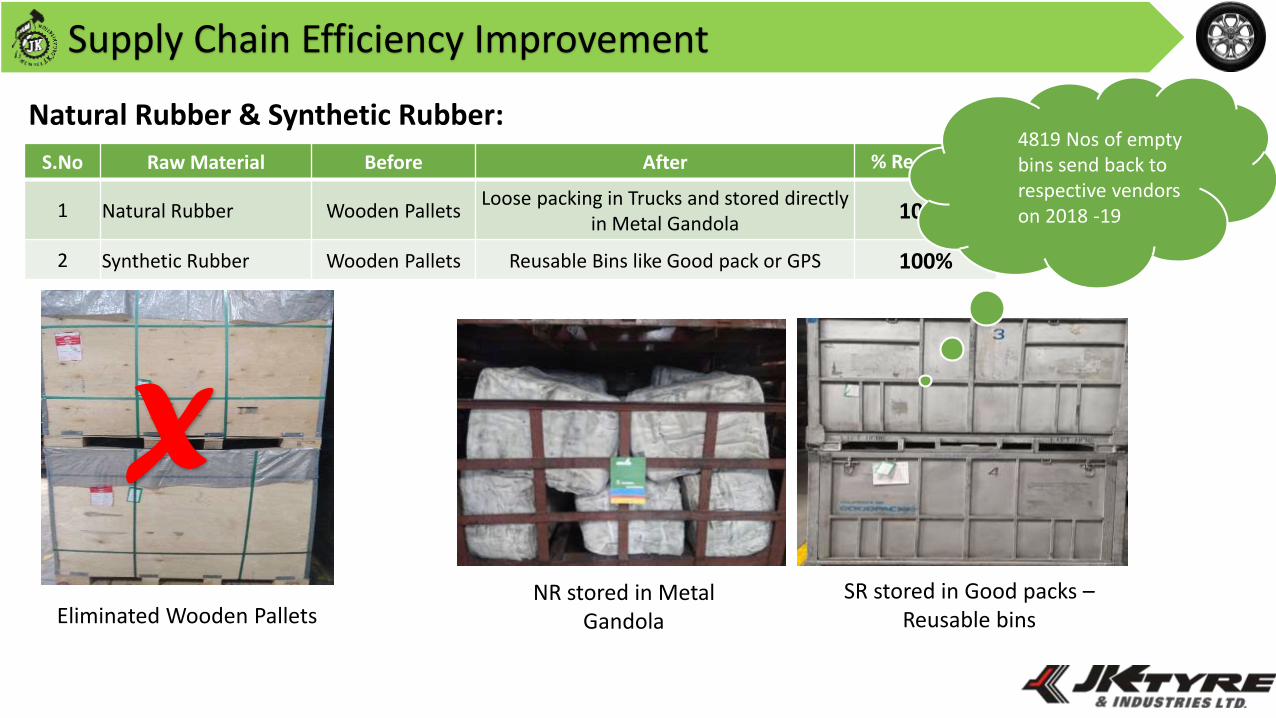
Supply Chain Efficiency Improvement
Natural Rubber & Synthetic Rubber:
S.No Raw Material Before After % Reduction
1 Natural Rubber Wooden Pallets Loose packing in Trucks and stored directly
in Metal Gandola100%
2 Synthetic Rubber Wooden Pallets Reusable Bins like Good pack or GPS 100%
4819 Nos of empty bins send back to respective vendors on 2018 -19
Eliminated Wooden PalletsNR stored in Metal
Gandola
SR stored in Good packs –Reusable bins
X
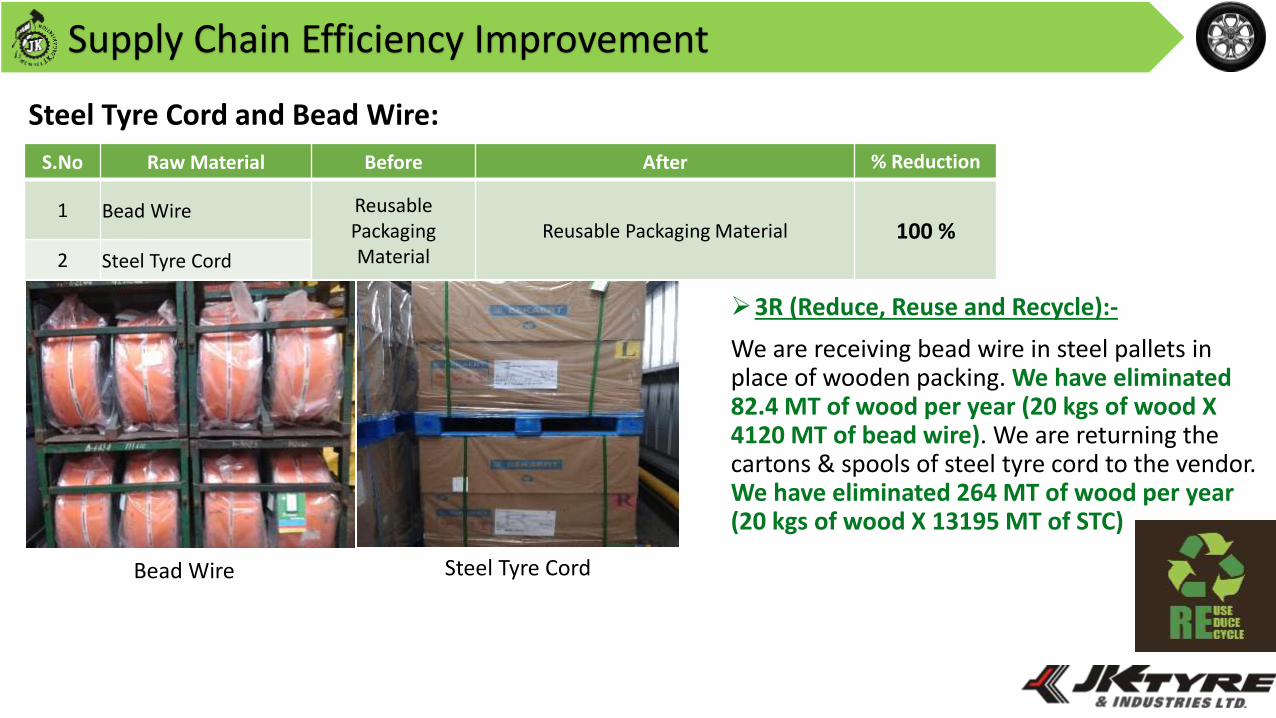
Supply Chain Efficiency Improvement
Steel Tyre Cord and Bead Wire:
S.No Raw Material Before After % Reduction
1 Bead Wire Reusable Packaging Material
Reusable Packaging Material 100 %2 Steel Tyre Cord
3R (Reduce, Reuse and Recycle):-
We are receiving bead wire in steel pallets in place of wooden packing. We have eliminated 82.4 MT of wood per year (20 kgs of wood X 4120 MT of bead wire). We are returning the cartons & spools of steel tyre cord to the vendor. We have eliminated 264 MT of wood per year (20 kgs of wood X 13195 MT of STC)
Bead Wire Steel Tyre Cord
Supply Chain Efficiency Improvement - Logistics
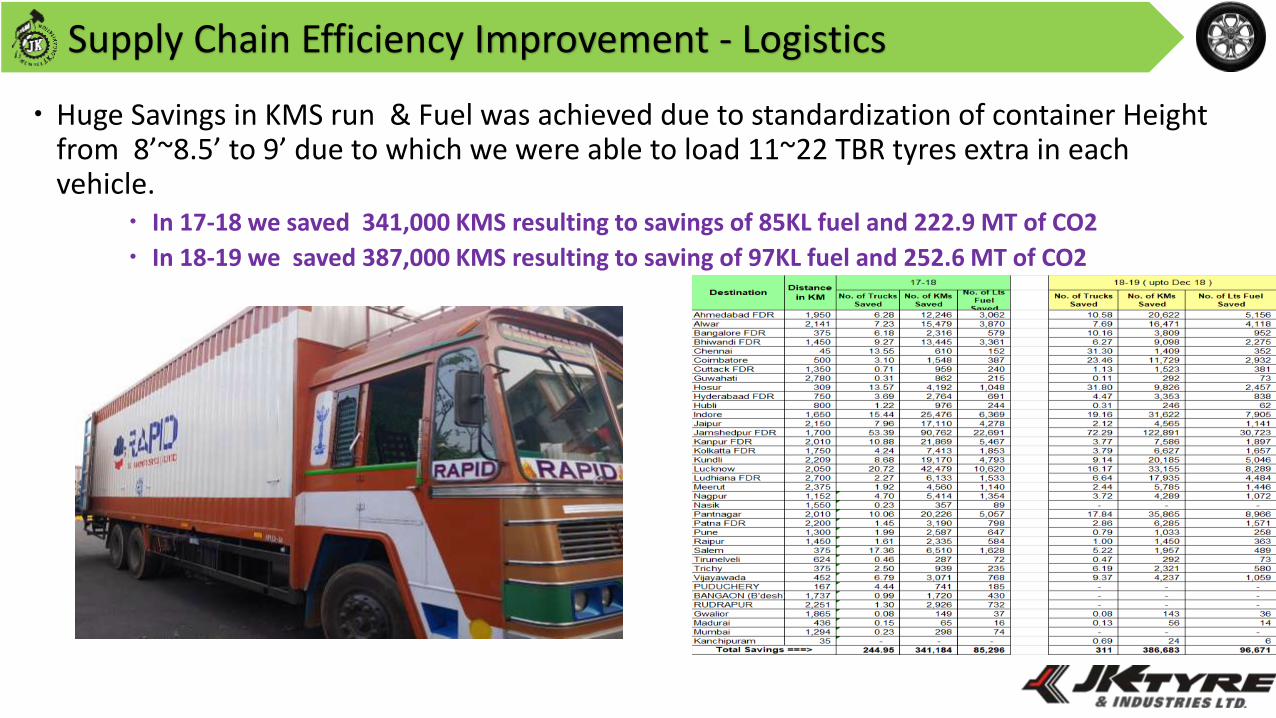
Huge Savings in KMS run & Fuel was achieved due to standardization of container Height from 8’~8.5’ to 9’ due to which we were able to load 11~22 TBR tyres extra in each vehicle.
In 17-18 we saved 341,000 KMS resulting to savings of 85KL fuel and 222.9 MT of CO2
In 18-19 we saved 387,000 KMS resulting to saving of 97KL fuel and 252.6 MT of CO2
Supply Chain Efficiency Improvement - Logistics
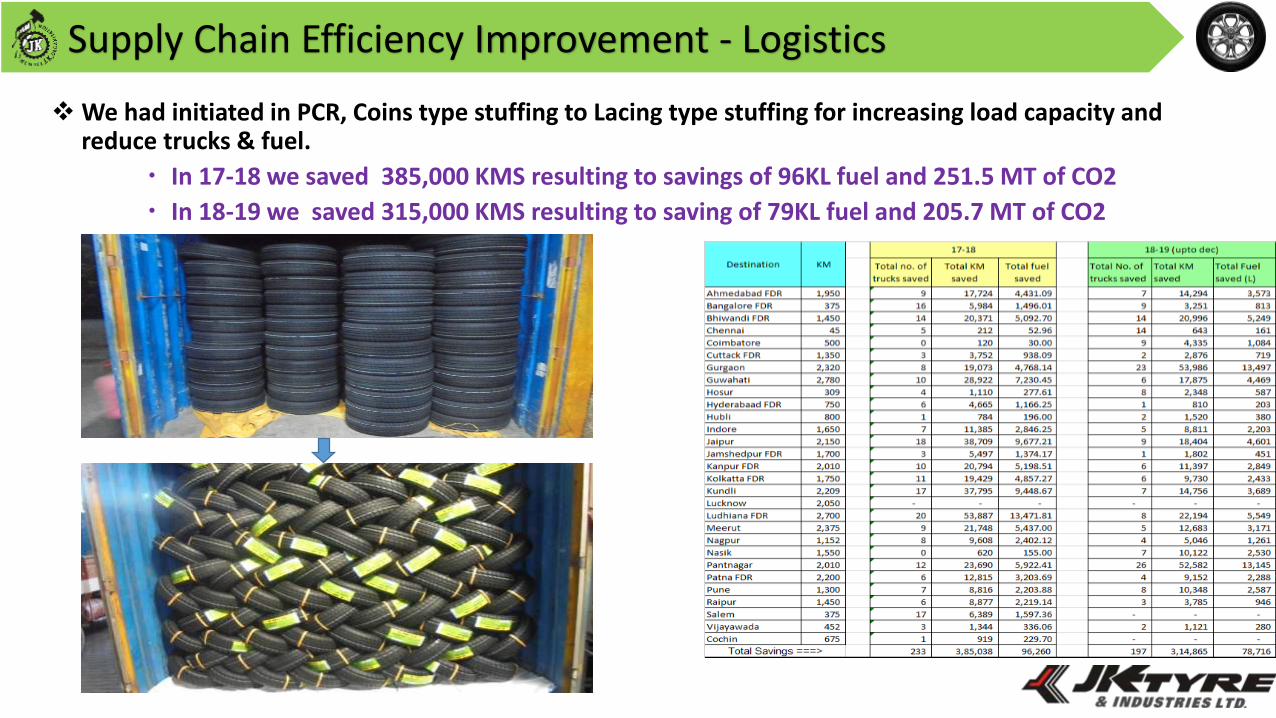
We had initiated in PCR, Coins type stuffing to Lacing type stuffing for increasing load capacity and reduce trucks & fuel.
In 17-18 we saved 385,000 KMS resulting to savings of 96KL fuel and 251.5 MT of CO2
In 18-19 we saved 315,000 KMS resulting to saving of 79KL fuel and 205.7 MT of CO2

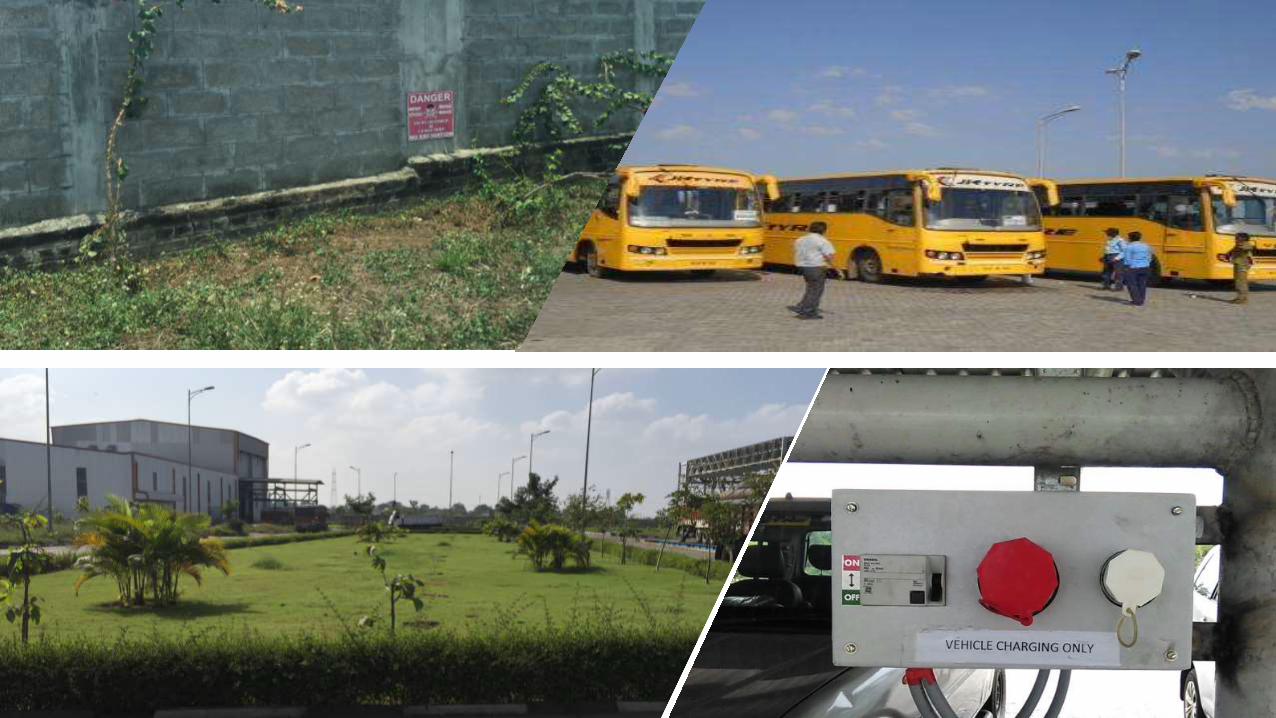
Green Infrastructure & Ecology
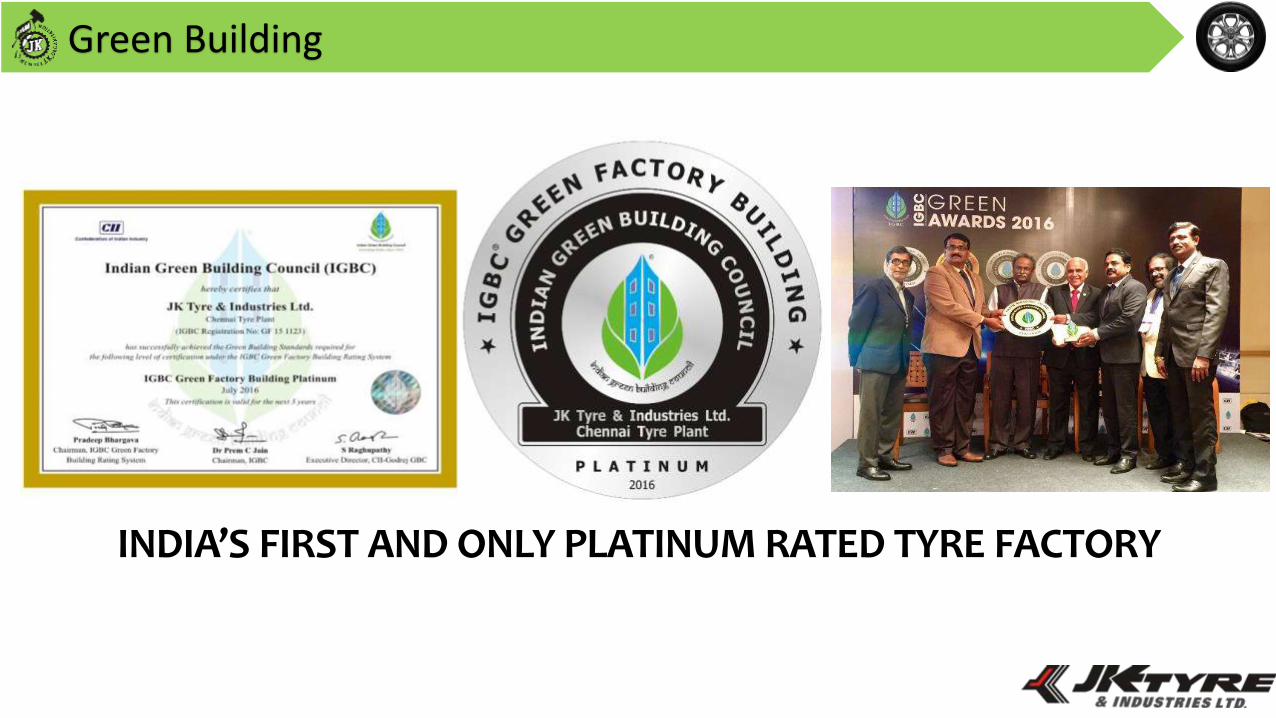
Green Building
INDIA’S FIRST AND ONLY PLATINUM RATED TYRE FACTORY
Green Building
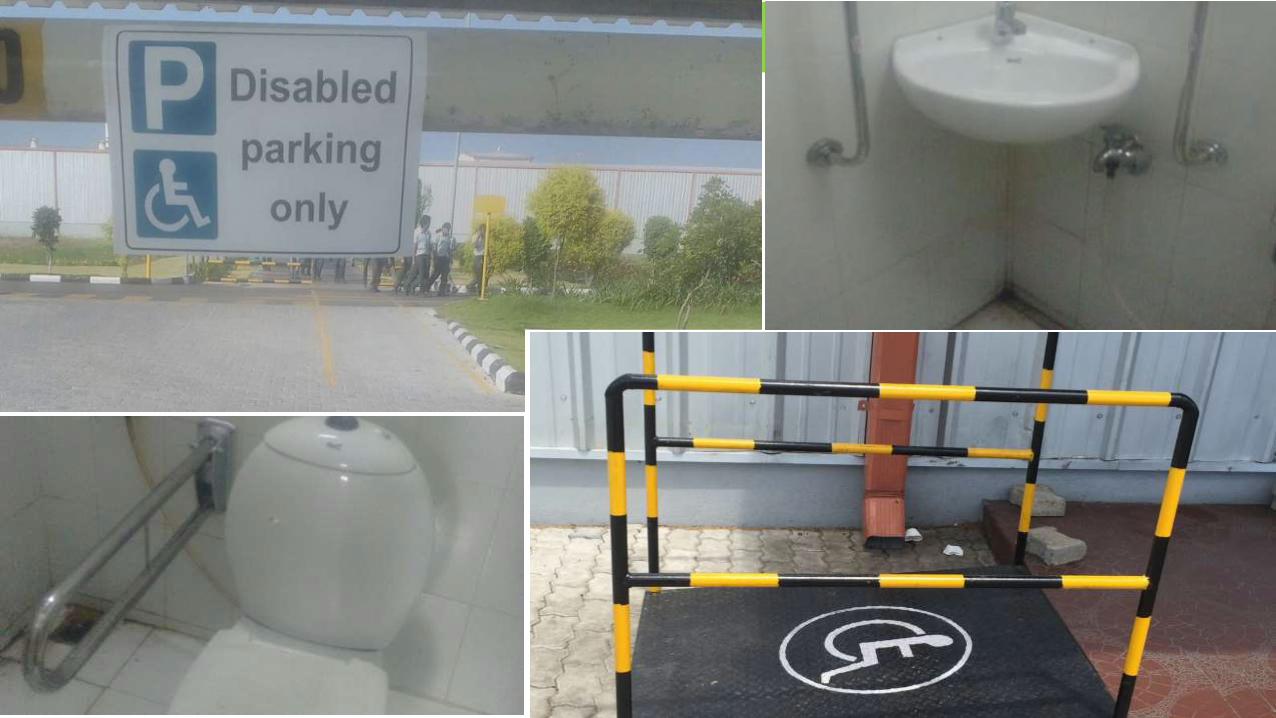
Green Building
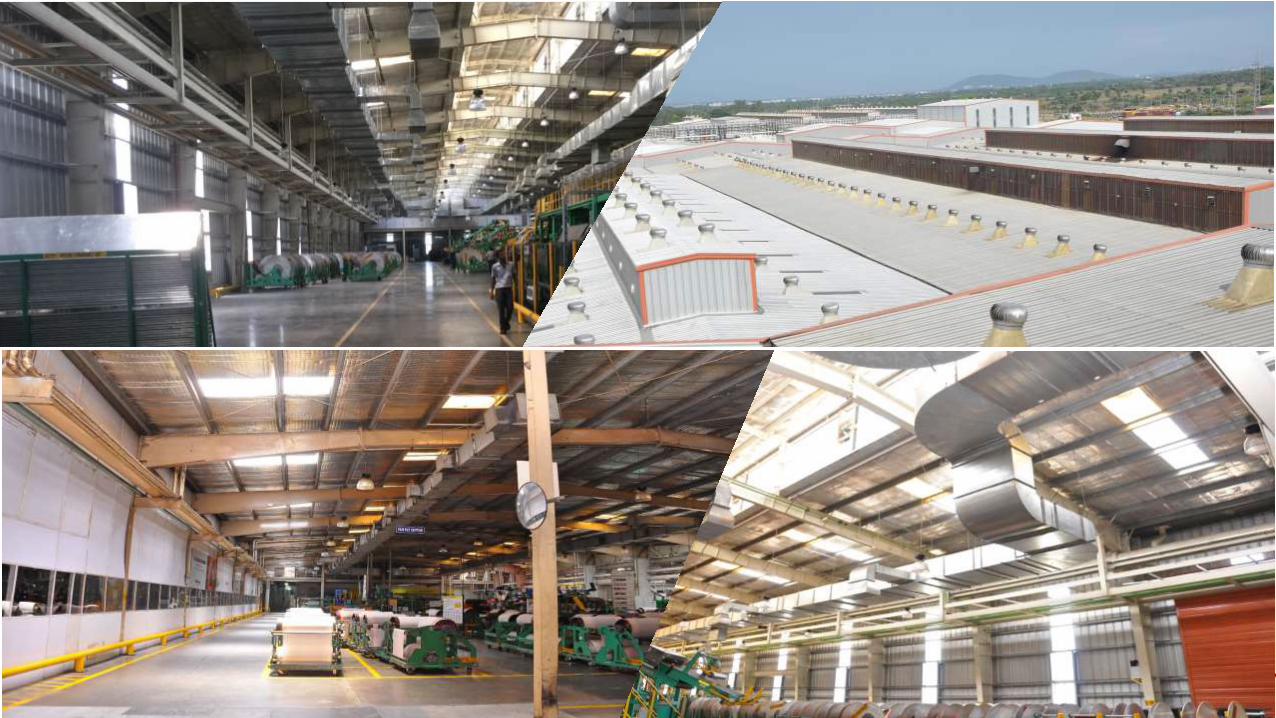
Green Building
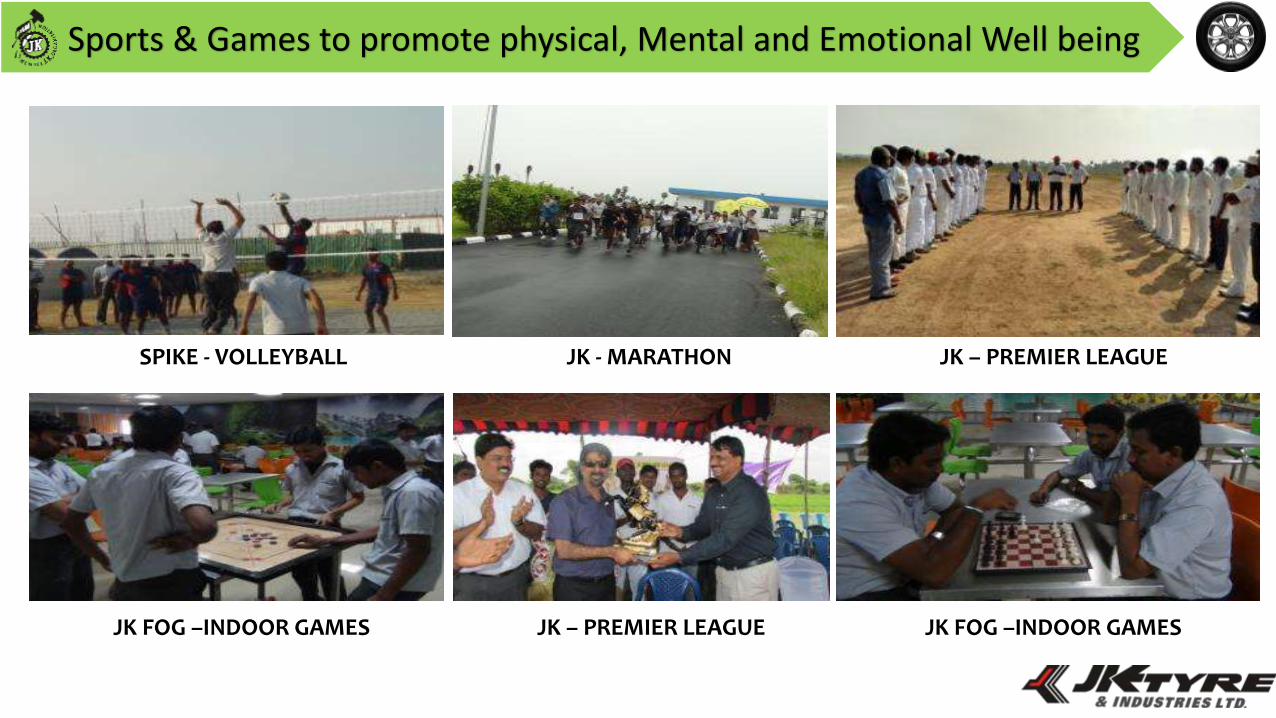
Sports & Games to promote physical, Mental and Emotional Well being
SPIKE - VOLLEYBALL JK - MARATHON JK – PREMIER LEAGUE
JK – PREMIER LEAGUE JK FOG –INDOOR GAMESJK FOG –INDOOR GAMES

94


![QO^ - ATOMKI · Kj]ka\]flaYd >gmf[ad g^ Cmf_Yjq Yegf_ gl`]jk& ) `Yn] hYa\ nakalk lg l`] Dfklalml]( Yf\ k]n]jYd e]eZ]jk g^ l`] Dfklalml] `Yn] Z]]f YoYj\]\ `gfgmjk Yf\ hjar]k g^](https://img.pdfslide.us/doc/110x75/5f7edf2e8806476d6351ba08/qo-atomki-kjkaflayd-gmfad-g-cmfyjq-yegf-gljk-yn-hya-nakalk.jpg)


![Untitled-1 [] & Industries Ltd, Chairman of JK Agri-Genetics Ltd and Director of other Companies. Shri Bharat Hori Singhania is also the Director of the JK Organization; an Industrial](https://img.pdfslide.us/doc/110x75/5a9ff4f87f8b9a84178d819d/pdfuntitled-1-industries-ltd-chairman-of-jk-agri-genetics-ltd-and-director.jpg)