Embed Size (px)
Citation preview
Jordan Journal of Chemistry Vol. 5 No.4, 2010, pp. 389-400
389
JJC
Determination of Ubiquinone,10 in Ten Different Sorts of Iraqi dates "Phoenix dactylefra" at Different Stages of Fruit Maturation
Ghadah Al-Faraji and Muthana Shanshal*
Department of Chemistry, College of Science, University of Baghdad, Jadiriya, Baghdad, Iraq.
Received on Feb. 2, 2010 Accepted on Aug. 22, 2010
Abstract The saponification extraction method was applied for the isolation and identification of
CoQ10 in 10 different sorts and at 4 different maturation stages of Iraqi dates. The purification of
the extract was done applying column chromatography (CC) and thin layer chromatography
(TLC) as well as final recrystallization from ethanol. The identification was done applying HPLC,
HPLC/MS, NMR and UV spectroscopy. It was found that, for different sorts different CoQ10
concentrations exist. The highest concentration was found for the Zahdi (most common and
cheapest) sort. The relative CoQ10 content increases from the initial “hababuk- kermi” stage to
the final and ripe date fruit.
Keywords: Ubiquinone; Coenzyme Q10; Iraqi dates; Phoenix dactylefra.
Introduction CoenzymeQ10 (Ubiquinone,10) was first isolated by Morton et al. from beef heart
mitochondria [1]. It was isolated simultaneously by Crane et al.[2] and Folkers et al.[3]
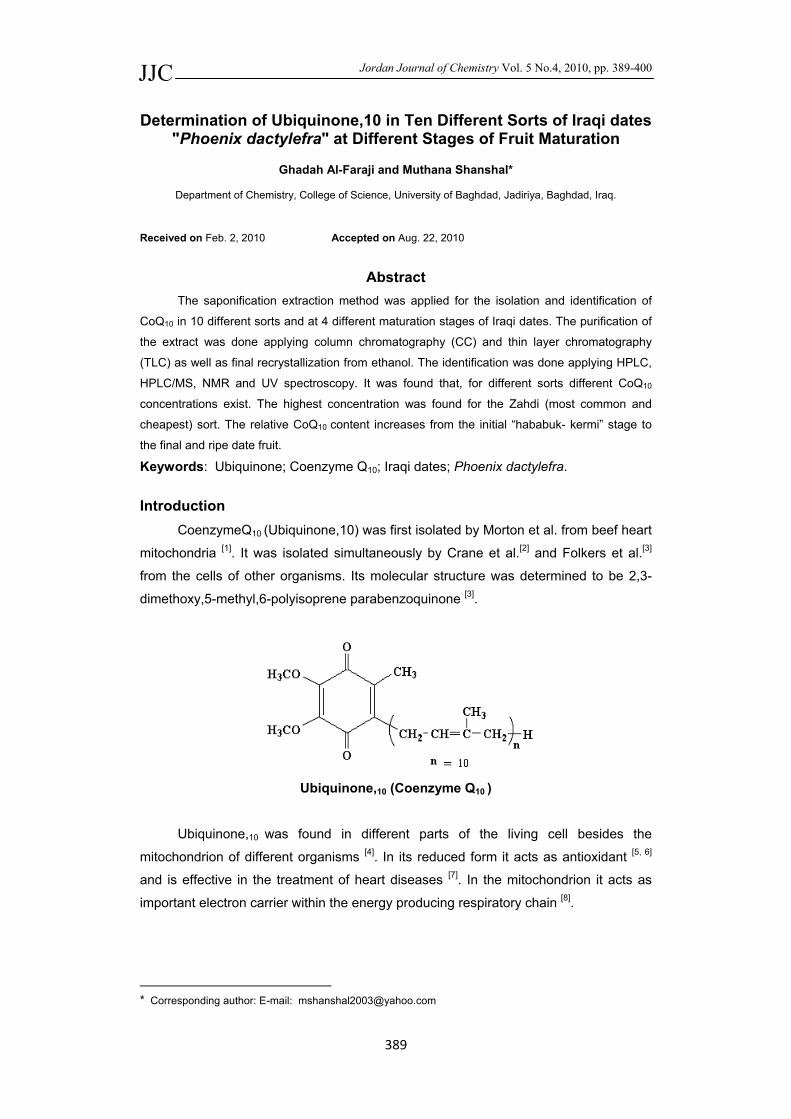
from the cells of other organisms. Its molecular structure was determined to be 2,3-
dimethoxy,5-methyl,6-polyisoprene parabenzoquinone [3].
Ubiquinone,10 (Coenzyme Q10 )
Ubiquinone,10 was found in different parts of the living cell besides the
mitochondrion of different organisms [4]. In its reduced form it acts as antioxidant [5, 6]
and is effective in the treatment of heart diseases [7]. In the mitochondrion it acts as
important electron carrier within the energy producing respiratory chain [8].
* Corresponding author: E-mail: [email protected]
390
The biochemical active part of the CoQn(n= 6, ….10) is the quinone ring, which
undergoes redox reactions faciliating the electron and proton transportation in the
mitochondria, via the so called Mitchells cycle [9]. The reduction process proceeds
through a ubiquinol semiradical leading to CoQH2.
The head-to-tail structure of CoQn is essential for its biological function; it is thus
similar to the vitamins E and K which include electron accepting quinone groups and
hydrophobic polyisoprenoid chain. Among these the CoQ10 possesses the longest side
chain. It is thus very lipophilic. The side chain is responsible for its fixation in the
mitochondrion, both in the plasmic membrane as well as in other phospholipids
containing parts of the cell [10].
CoQ10H2 is an effective antioxidant [14], it protects the mitochondrion membrane
and DNA from destruction. It acts as an activator of Vitamin E. It was found useful for
the treatment of various heart diseases. It helps blood circulation, increases the
immunity and oxygen level in human tissues. Although human body produces CoQ10, a
daily intake of approx. 100mg is required [15]. Different foods show different CoQ10
contents. The content varies from 157 mg/100g in Reindeer to 0.07 mg/100g in low fat
milk [16]. Chemical synthesis of CoQ10 requires highly stereoselective chemical
reactions [17]. More common are the biotechnological production methods. Such
microbiological methods, utilizing cultures of the type, Agrobacterium , Rhodobacter,
Paracoccus, Rhodotorula, Candida, are applied for the efficient industrial production of
the compound [18].
To extract the mitochondrion CoQ10 it is important to destruct the cell wall
through sonication, extract the content with adequate solvents and then remove the
nonsoluble materials [19]. Three prominent methods are known in the literature;
a- saponification method in which the phospholipids are removed through alkaline
hydrolysis followed by solvent extraction;
b- direct extraction with suitable organic solvents.
c- solid phase extraction [20].
Determination and chemical test of CoQ10 proceeds through different chemical
methods depending on the type of reagent used for the test such as Graven’s test,
Dam–Karrers’ test and Sullivan’s test [21]. For the identification various analytical and
spectrometric methods had been applied too [22], among these are the high
performance liquid chromatography, HPLC, and liquid chromatography–mass
spectrometry, LC-MS, combination [23-25]. Both methods gained increasing interest in
the last two decades.
Date is considered in many Afro- Asian countries, as one of the most important
food sources. Iraq (Mesopotamia) is one of the oldest date palm cultivating countries.
Date palms (Phoenix dactylifera) were reported in the old Babylonian lyrics 4000 years
ago [26]. The mature fruit is conformed of a hard kern surrounded by a fleshy mass
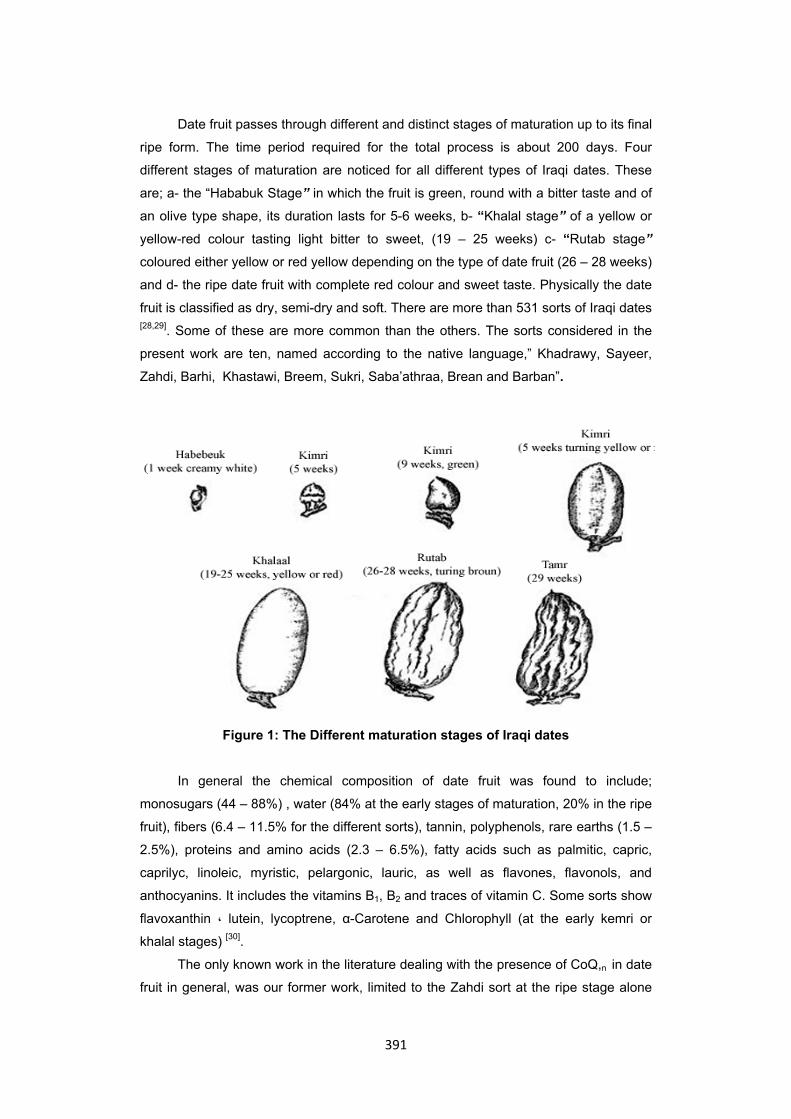
which forms the actual part to be consumed [27], figure 1.
391
Date fruit passes through different and distinct stages of maturation up to its final
ripe form. The time period required for the total process is about 200 days. Four
different stages of maturation are noticed for all different types of Iraqi dates. These
are; a- the “Hababuk Stage” in which the fruit is green, round with a bitter taste and of
an olive type shape, its duration lasts for 5-6 weeks, b- “Khalal stage” of a yellow or
yellow-red colour tasting light bitter to sweet, (19 – 25 weeks) c- “Rutab stage”
coloured either yellow or red yellow depending on the type of date fruit (26 – 28 weeks)
and d- the ripe date fruit with complete red colour and sweet taste. Physically the date
fruit is classified as dry, semi-dry and soft. There are more than 531 sorts of Iraqi dates [28,29]. Some of these are more common than the others. The sorts considered in the
present work are ten, named according to the native language,” Khadrawy, Sayeer,
Zahdi, Barhi, Khastawi, Breem, Sukri, Saba’athraa, Brean and Barban”.
Figure 1: The Different maturation stages of Iraqi dates
In general the chemical composition of date fruit was found to include;
monosugars (44 – 88%) , water (84% at the early stages of maturation, 20% in the ripe
fruit), fibers (6.4 – 11.5% for the different sorts), tannin, polyphenols, rare earths (1.5 –
2.5%), proteins and amino acids (2.3 – 6.5%), fatty acids such as palmitic, capric,
caprilyc, linoleic, myristic, pelargonic, lauric, as well as flavones, flavonols, and
anthocyanins. It includes the vitamins B1, B2 and traces of vitamin C. Some sorts show
flavoxanthin ، lutein, lycoptrene, α-Carotene and Chlorophyll (at the early kemri or
khalal stages) [30].
The only known work in the literature dealing with the presence of CoQ,n in date
fruit in general, was our former work, limited to the Zahdi sort at the ripe stage alone
392
[30a]. It remained open how does the ubiquinone content change from one date sort to
the other and along its maturation path. The present work deals with this problem.
Experimental All HPLC measurements were done with a Shimadzu SPD-10 AVP, LC-10A
type, instrument (Tokyo, Japan). The UV–VIS spectra were recorded with a Shimadzu
SPD-6AO (UV-VIS) spectrophotometer. The mass spectra were recorded with a
Shimadzu GC/ MS-QP 5050A, Japan. For the LC–Mass spectrometry measurements
was used Liquid Chromatography Tandam Mass Spectrometry, Agilent 1100, Series,
LC/ MSD Trap, USA. The NMR measurements were recorded applying BRUKER
AVANCE/ DPX 300 of Brucker AG, Karlsruhe, BRD. TLC was performed on Silica gel
F254 glass plates (20×20cm) (Merck); Coenzyme Q10 (HPLC grade was bought from
Fluka), Alumina (Acidic Brokman activity I), (BDH.) and Silica gel 60 (63-200µm)
(Sorbent), were used for column chromatography.
The date samples were collected from palm trees in the directorate of Baghdad
and Salah-Eldin, Iraq. For each sort of date, samples of all four stages of maturation
were taken from the same tree. The ten chosen sorts of date were classified according
to the Iraqi standards of date fruits, 1981, vs the market demanded sorts, Zahdi, Sayer,
Khadhrawi, Breem and Sukri and the locally consumed sorts; Berhi, Khastawi,
Barban, Tabarzel and Sabe’athraa. The collection of the date samples to be analyzed
started at the end of June when the first stage (hababuk) begins. The dates were
washed, the kern depleted and the fleshy mass used for digestion immediately. Similar
treatment was applied, at the end of July, for the second, yellow, maturation stage,
khelal. The third maturation stage, rutab, was collected at the mid of August till the
beginning of September. After washing the fruit and depleting the kern, the fleshy
mass was kept in the refrigerator at –20o C for further digestion and extraction
purposes. Similar treatment was done for the ripe date fruit that was collected at the
interval; beginning of October- mid November.
50 g of each of the different date species were cut , mixed with 50 g distilled
water and then homogenized using laboratory Waring blender of 17000 rpm for 10
minutes till a homogenized fluid is formed. The dry and ripe fruit, however, was kept
with water for 48 hours before cutting and homogenizing.
The Saponification Process.
The procedure used in this work was similar to that known in the literature to
extract mitochondrion contents [32 –39], with the difference of applying methanol rather
than ethanol as solvent. In a 500 mL, three neck flask, 100 g of the homogenized
mixture were combined with 2.5 g pyrogallol, dissolved in 70 mL methanol and 25 mL
(25% KOH in water) under continuous stirring. The flask was connected to a nitrogen
tube, immersed in the reaction solution, a stirring rode and a thermometer. The
reaction mixture was heated at 80 – 90o C for 20 – 25 minutes. After completion of the
reaction, the flask was coold down to room temperature using an ice bath.
393
The cold reaction mixture was transferred to a separation funnel and mixed with
100 mL petroleum ether (40o – 60o C). The mixture was shaken then for 10 – 15
minutes and left for separation, where a brown organic layer was formed. This was
separated and the remaining yellow aqueous layer extracted with 25 mL petrol ether.
The extraction was repeated three times.
The combined organic extracts were washed with 1/3 of the mixture volume
water. The washing was repeated three times. The separated organic solution was
dried over anhydrous Na2SO4, filtered and the solid sulfate washed with cold petroleum
ether. The filtrate was then evaporated under reduced pressure applying a rotary
evaporator (40oC). 5 mL ethanol were added to the solid residue and the evaporation
repeated to remove any traces of water in the flask. The yellow–orange residue was
dissolved in absolute ethanol and kept in the dark at –20oC for analysis.
The formerly described extraction procedure was repeated for all 4 different
maturation species of 10 different sorts of Iraqi dates. The crude extraction solution
was used for the HPLC study. As standard authentic sample a 10 ppm solution of
CoQ10 (Fluka) in ethanol was applied for comparison purpose.
HPLC Quantitative Analysis
50 µL of CoQ10 solution were injected in the HPLC instrument and the analysis
done using: Waters-Sperisorp S5- ODS2 column (250 x 4.6 mm) with pebble mesh of
0.5 µm (35:65 v/v deionized water: acetonitrile) as mobile phase at a flow rate 1
ml/min. The UV-detector wave length was 275 nm.
Thin Layer Chromatography, TLC
For the separation process 16 different solvent mixtures were tested. The best
separation results were obtained with a 9:1 (v/v) chloroform: ethylacetate mixture.
During the separation the chromatographic jar was wrapped with Al foil.
Column chromatography
The separation and purification of CoQ10 from the saponification extract was
performed by chromatography over silica gel and alumina (50x1cm) columns. The
column was packed in heptane to remove all nonpolar compounds. After introducing
the extraction solution to the top of the column, it was washed successively with
mixtures of heptan + CHCl3 (2-20%) with increasing polarity. The eluted fractions were
tested with UV absorption (275 nm) and TLC plates for the presence of CoQ10.
The Alumina column (50x1cm), was packed with petroleum ether (40 – 60oC) [40-
42]. and eluted with a mixture of petroleum ether and ethylacetate of increasing polarity
in a similar manner as that described before for the silica column. The collected
fractions were tested for CoQ10 applying UV absorption (275nm) and TLC. In some
experiments n-hexane was used instead of petroleum ether.
Results and Discussion.
394
The saponification method had been applied preferrably for the extraction of
hydrophobic natural products such as the carotens, vitamins, A, E, D and ubiquinones [31]. It was used in this work for CoQ10 extraction. The method is ideal for getting rid of
the phospholipids found in the walls of the mitochondria which show strong affinity
towards the CoQ10, and the presence of which hinders the purification of the
ubiquinone and its chromatographic separation.
Generally for each 1 g of the row material one applies 1 ml water, 1.5 ml
methanol, 0.05 g pyrogallol, and 0.5 mL (25%) aqueous KOH solution. Petroleum
ether, hexane or 1- propanol are the best suitable solvents for the extraction. In order
to obtain good separation and identification for CoQn it is important to work under
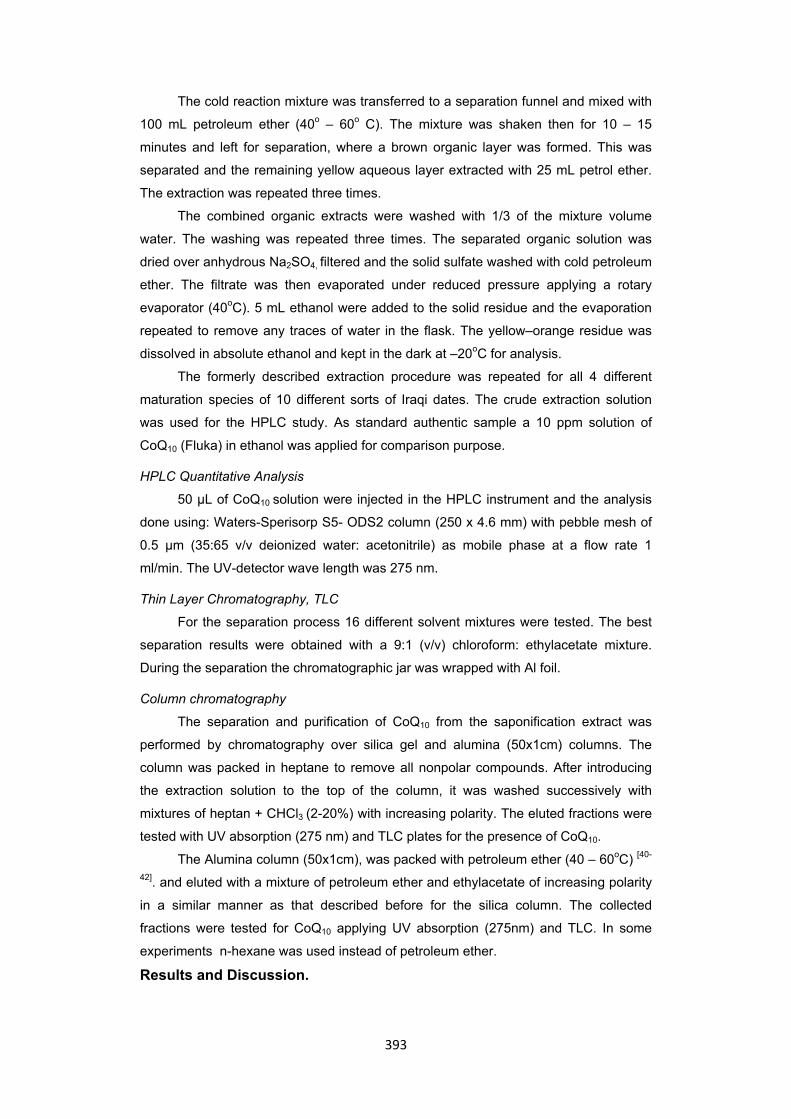
exclusion of light. This fact was indicated by Kishi [32] who showed that exposing the
coenzyme to sun light for 1 hour causes a photochemical degradation and a
considerable change in its UV absorption spectrum, Fig 2. Former work described in
the literature dealing with the CoQ10 separation showed that its reduced form CoQ10H2
gets oxidized during the separation process [32 – 42].
We found that applying ethanol caused a partial exchange of the methoxy
groups in the CoQ10 molecule by the ethoxy group. Both TLC and MS measurements
showed the presence of monoethoxy- and diethoxy- ubiquinones beside the normal
ubiquinone molecule in the reaction solution. To avoid this problem the reaction was
carried out in methanolic solution, as the substitution reaction (with the methoxy group)
does not change the chemical structure of the ubiquinone.
All operations were done under complete exclusion of light through wrapping of
the reaction vessels with aluminum foils.
Figure 2: Change in the UV absorption spectrum of CoQ10 due to exposure to sunlight
for 1 hour [32].
395
HPLC Analysis.
The HPLC method was found efficient for the identification of ubiquinones (Q10,
Q9, Q8) [43– 49]. As separation column, usually ODS column had been used. In the
present study Spherisorb, ODS column was used for the identification of the CoQ10
Under the present measurement conditions, the oxidized CoQ10 (10 ppm), shows an Rt
value of 3.89 minutes and the relative band area 31008. These values were applied for
the quantitative HPLC identification of the coenzyme according to the standard relation [50 – 51].
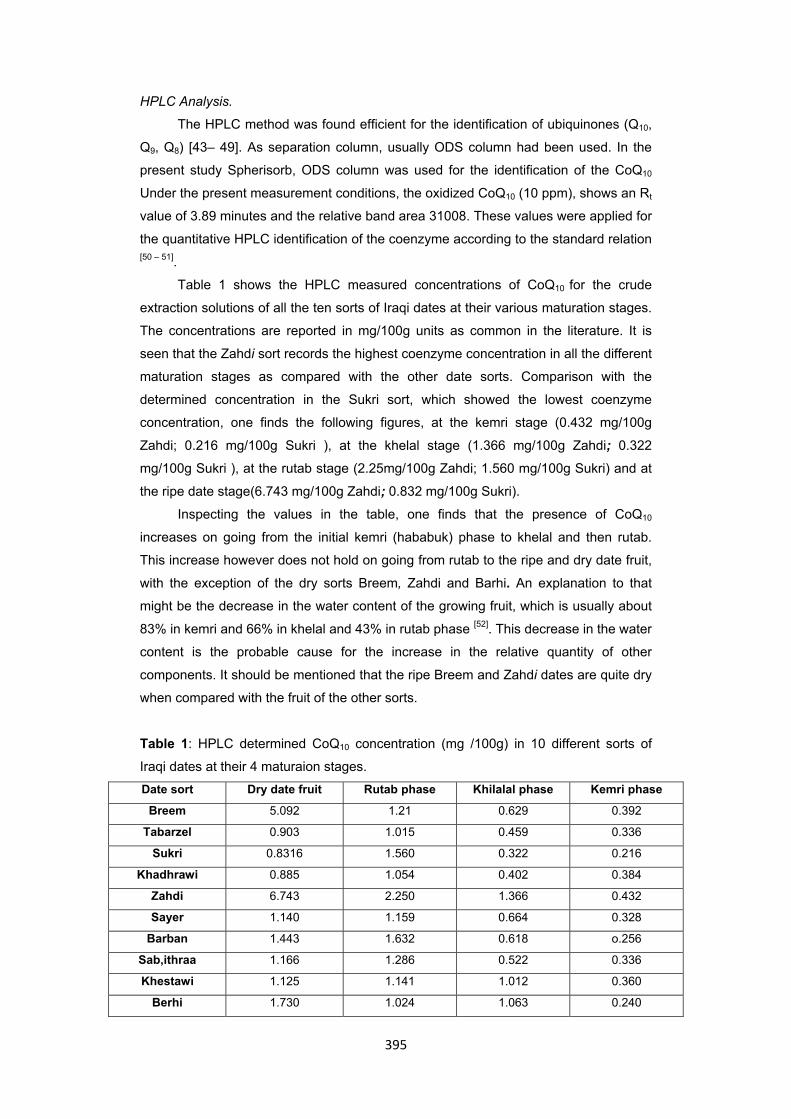
Table 1 shows the HPLC measured concentrations of CoQ10 for the crude
extraction solutions of all the ten sorts of Iraqi dates at their various maturation stages.
The concentrations are reported in mg/100g units as common in the literature. It is
seen that the Zahdi sort records the highest coenzyme concentration in all the different
maturation stages as compared with the other date sorts. Comparison with the
determined concentration in the Sukri sort, which showed the lowest coenzyme
concentration, one finds the following figures, at the kemri stage (0.432 mg/100g
Zahdi; 0.216 mg/100g Sukri ), at the khelal stage (1.366 mg/100g Zahdi; 0.322
mg/100g Sukri ), at the rutab stage (2.25mg/100g Zahdi; 1.560 mg/100g Sukri) and at
the ripe date stage(6.743 mg/100g Zahdi; 0.832 mg/100g Sukri).
Inspecting the values in the table, one finds that the presence of CoQ10
increases on going from the initial kemri (hababuk) phase to khelal and then rutab.
This increase however does not hold on going from rutab to the ripe and dry date fruit,
with the exception of the dry sorts Breem, Zahdi and Barhi. An explanation to that
might be the decrease in the water content of the growing fruit, which is usually about
83% in kemri and 66% in khelal and 43% in rutab phase [52]. This decrease in the water
content is the probable cause for the increase in the relative quantity of other
components. It should be mentioned that the ripe Breem and Zahdi dates are quite dry
when compared with the fruit of the other sorts. Table 1: HPLC determined CoQ10 concentration (mg /100g) in 10 different sorts of
Iraqi dates at their 4 maturaion stages.
Kemri phaseKhilalal phaseRutab phaseDry date fruit Date sort
0.392 0.629 1.21 5.092 Breem
0.336 0.459 1.015 0.903 Tabarzel
0.216 0.322 1.560 0.8316 Sukri
0.384 0.402 1.054 0.885 Khadhrawi
0.432 1.366 2.250 6.743 Zahdi
0.328 0.664 1.159 1.140 Sayer
o.256 0.618 1.632 1.443 Barban
0.336 0.522 1.286 1.166 Sab,ithraa
0.360 1.012 1.141 1.125 Khestawi
0.240 1.063 1.024 1.730 Berhi
396
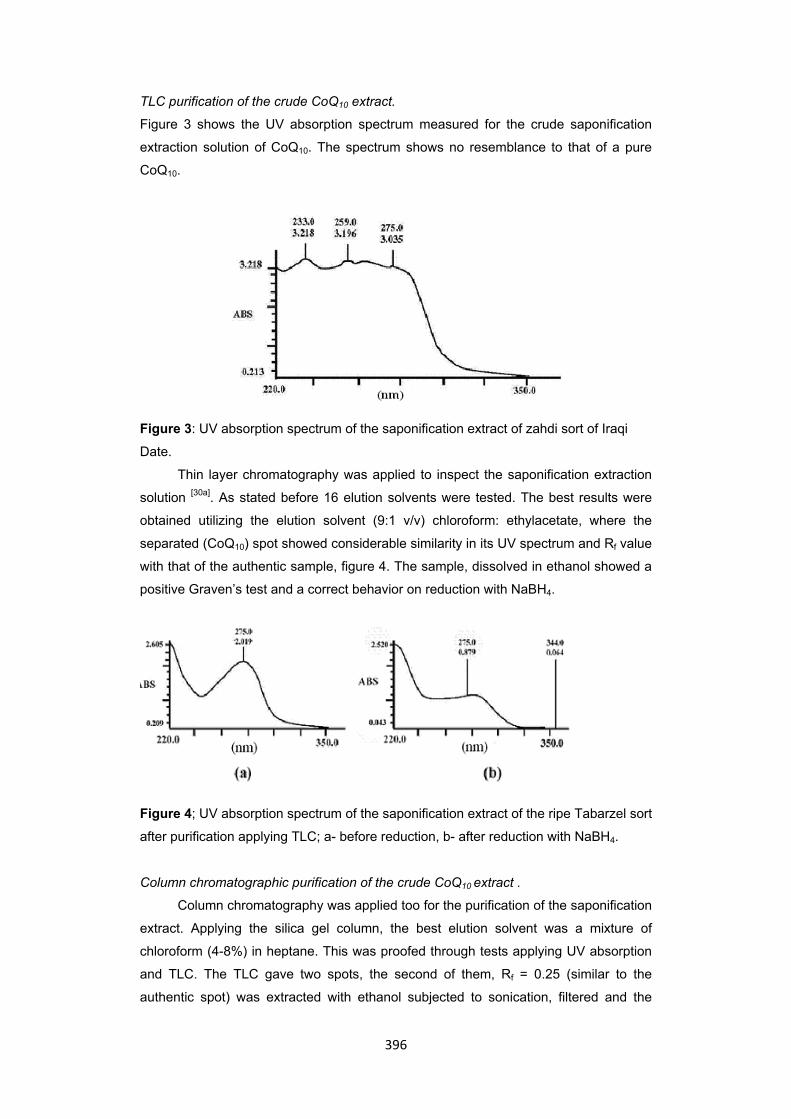
TLC purification of the crude CoQ10 extract.
Figure 3 shows the UV absorption spectrum measured for the crude saponification
extraction solution of CoQ10. The spectrum shows no resemblance to that of a pure
CoQ10.
Figure 3: UV absorption spectrum of the saponification extract of zahdi sort of Iraqi
Date.
Thin layer chromatography was applied to inspect the saponification extraction
solution [30a]. As stated before 16 elution solvents were tested. The best results were
obtained utilizing the elution solvent (9:1 v/v) chloroform: ethylacetate, where the
separated (CoQ10) spot showed considerable similarity in its UV spectrum and Rf value
with that of the authentic sample, figure 4. The sample, dissolved in ethanol showed a
positive Graven’s test and a correct behavior on reduction with NaBH4.
Figure 4; UV absorption spectrum of the saponification extract of the ripe Tabarzel sort
after purification applying TLC; a- before reduction, b- after reduction with NaBH4.
Column chromatographic purification of the crude CoQ10 extract .
Column chromatography was applied too for the purification of the saponification
extract. Applying the silica gel column, the best elution solvent was a mixture of
chloroform (4-8%) in heptane. This was proofed through tests applying UV absorption
and TLC. The TLC gave two spots, the second of them, Rf = 0.25 (similar to the
authentic spot) was extracted with ethanol subjected to sonication, filtered and the
397
solution tested with UV absorption, in the oxidized and reduced forms. It behaved
similar to authentic CoQ10. In the mass spectrometric measurement of the same
solution, the mother peak of 863.7 appeared as well as the other signals specific for
the coenzyme. LC/MS measurement yielded, among others a signal, the mass
spectrum of which was identical to that of the coenzyme too.
Applying the alumina, Brockman-activity 1, column, the elution liquid was a
mixture of petroleum ether and ethyl acetate. The most effective separation was
obtained with 4-8% ethylacetate in petroleum ether. It gave the highest detectable
concentration of the coenzyme, according to the UV measurements and TLC tests.
The resulting solution was dried with a rotary evaporator then dissolved in ethanol.
LC/MS measurements showed a presence of CoQ10 in the solution which corresponds
to 60% of the extracted material
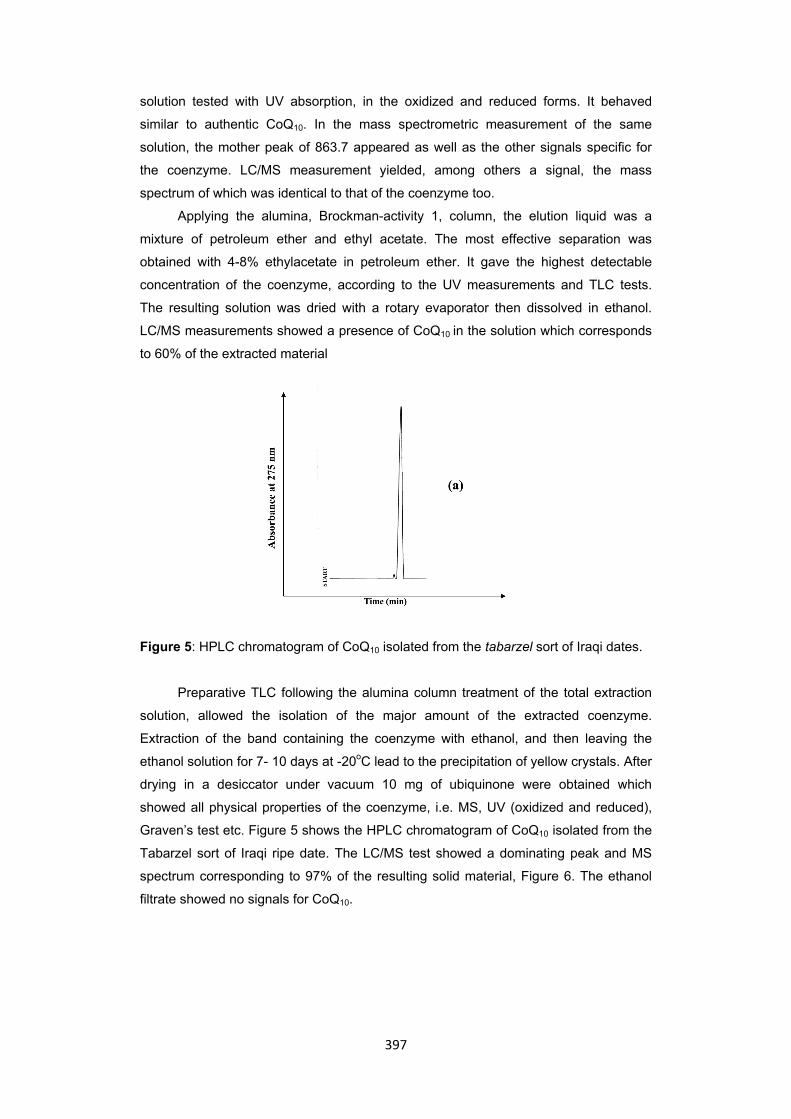
Figure 5: HPLC chromatogram of CoQ10 isolated from the tabarzel sort of Iraqi dates.
Preparative TLC following the alumina column treatment of the total extraction
solution, allowed the isolation of the major amount of the extracted coenzyme.
Extraction of the band containing the coenzyme with ethanol, and then leaving the
ethanol solution for 7- 10 days at -20oC lead to the precipitation of yellow crystals. After
drying in a desiccator under vacuum 10 mg of ubiquinone were obtained which
showed all physical properties of the coenzyme, i.e. MS, UV (oxidized and reduced),
Graven’s test etc. Figure 5 shows the HPLC chromatogram of CoQ10 isolated from the
Tabarzel sort of Iraqi ripe date. The LC/MS test showed a dominating peak and MS
spectrum corresponding to 97% of the resulting solid material, Figure 6. The ethanol
filtrate showed no signals for CoQ10.

398
Figure 6: LC/MS spectrum of the alumina column and TLC purified CoQ10 extracted
from Zahdi ripe fruit. Peak No 2 in the LC belongs to the coenzyme.
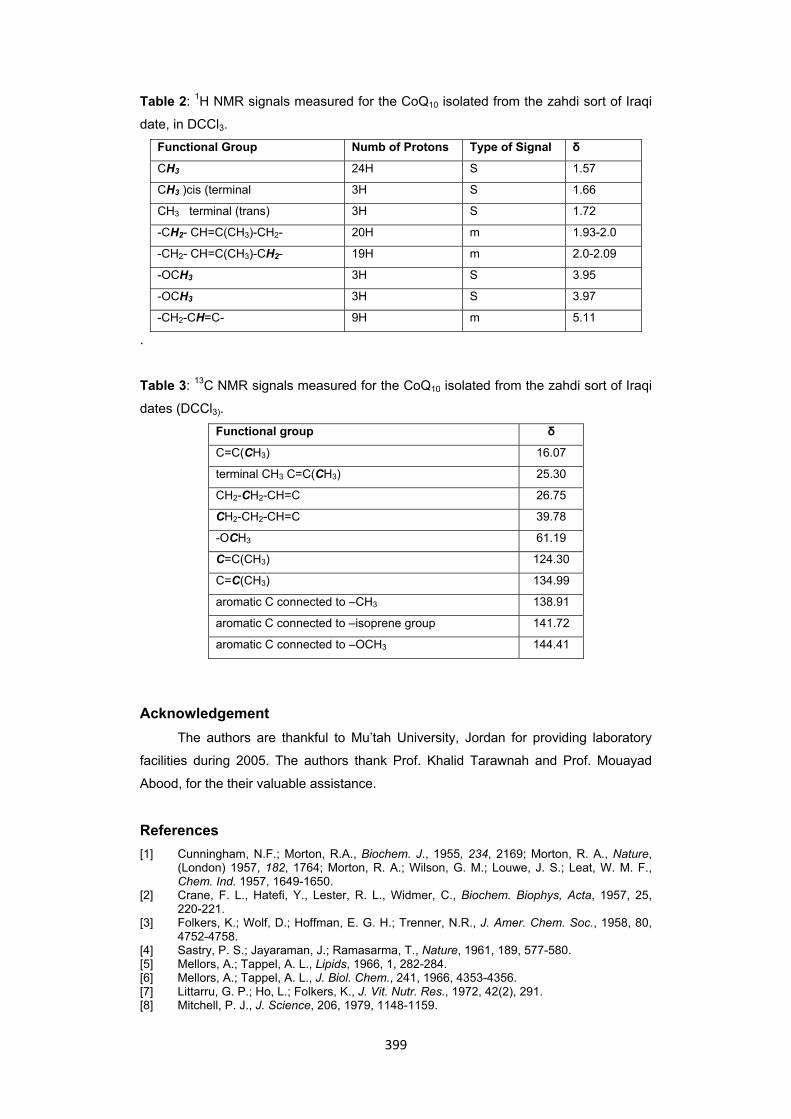
To conclude the physical identification of the isolated CoQ10, 1H- and 13C- NMR
spectra were recorded for the sample. In both spectra the signals of all expected nuclei
appeared correctly, and similar to those of an authentic sample. The assignments are
listed in Tables 2 and 3, confirming the structure of the isolated ubiquinone.
399
Table 2: 1H NMR signals measured for the CoQ10 isolated from the zahdi sort of Iraqi
date, in DCCl3.
δ Type of SignalNumb of ProtonsFunctional Group
1.57 S 24H CH3
1.66 S 3H CH3 )cis (terminal
1.72 S 3H CH3 terminal (trans)
1.93-2.0 m 20H -CH2- CH=C(CH3)-CH2-
2.0-2.09 m 19H -CH2- CH=C(CH3)-CH2-
3.95 S 3H -OCH3
3.97 S 3H -OCH3
5.11 m 9H -CH2-CH=C-
.
Table 3: 13C NMR signals measured for the CoQ10 isolated from the zahdi sort of Iraqi
dates (DCCl3).
δ Functional group
16.07 C=C(CH3)
25.30 C=C(CH3) terminal CH3
26.75 CH2-CH2-CH=C
39.78 CH2-CH2-CH=C
61.19 -OCH3
124.30 C=C(CH3)
134.99 C=C(CH3)
138.91 aromatic C connected to –CH3
141.72 aromatic C connected to –isoprene group
144.41 aromatic C connected to –OCH3
Acknowledgement The authors are thankful to Mu’tah University, Jordan for providing laboratory
facilities during 2005. The authors thank Prof. Khalid Tarawnah and Prof. Mouayad
Abood, for the their valuable assistance.
References [1] Cunningham, N.F.; Morton, R.A., Biochem. J., 1955, 234, 2169; Morton, R. A., Nature,
(London) 1957, 182, 1764; Morton, R. A.; Wilson, G. M.; Louwe, J. S.; Leat, W. M. F., Chem. Ind. 1957, 1649-1650.
[2] Crane, F. L., Hatefi, Y., Lester, R. L., Widmer, C., Biochem. Biophys, Acta, 1957, 25, 220-221.
[3] Folkers, K.; Wolf, D.; Hoffman, E. G. H.; Trenner, N.R., J. Amer. Chem. Soc., 1958, 80, 4752-4758.
[4] Sastry, P. S.; Jayaraman, J.; Ramasarma, T., Nature, 1961, 189, 577-580. [5] Mellors, A.; Tappel, A. L., Lipids, 1966, 1, 282-284. [6] Mellors, A.; Tappel, A. L., J. Biol. Chem., 241, 1966, 4353-4356. [7] Littarru, G. P.; Ho, L.; Folkers, K., J. Vit. Nutr. Res., 1972, 42(2), 291. [8] Mitchell, P. J., J. Science, 206, 1979, 1148-1159.
400
[9] Lenaz, G., "Coenzyme Qn”, Chichester, Wiley (1985). [10] Remy, A.; Boers, R. B.; Egorova-Zachernyuk, T. A.; Gast, T. E., Eur. J. Biochem, 2003,
270, 3603-3609. [11] Morton, R. A., "Biochemistry of Quinones" Academic Press Inc. London (1965). [12] Threlfall, D.; Whistance, G. R., "Aspects of Terpenoid Chemistry and Biochemistry",
Academic Press Inc. London (1971). [13] Ernster, L.; Dallner, G., Biochem. Biophys. Acta, 1995, 1271, 195-204. [14] Stocker, R.; Bowry, R. V.; Frei, B., Proc. Natl. Acad., USA, 1991, 88, 1646-1650. [15] Crane, F. L., J. American College of Nutrition, 20(6), 2001, 591-598. [16] Kamei, M.; Fujita, T.; Kanbe, T., Int. J. Vitam Nutr. Res., 1986, 56(1), 57-63. [17] Negishi, E.; Lion, S. Y.; Huo, C. Xu.; Huo, S., Org. Lett., 2002, 4, 261-264. [18] Yoshida, H.; Kotani Y.; Ochiai, K.; Araki, K., J., Gen. Appl. Microbio., 1998, 44, 19-26. [19] Reed, G., "Enzymes in Food Processing", Academic Press Inc. San Diego USA, 1975. [20] Mosca, F.; Fattorini, D.; Bompade, S.; Littaru, G. P., Anal. Biochem., 2002, 305, 49-54. [21] Crane, F. L.; Barr, P., Meth. Enz. XVIII Part C, 1976, 137, 181. [22] Karpilska, J.; Frankowska, R., Instrum. Sci. Technol., 2004, 32, 281-290. [23] Kommuru, T. R.; Khan, M. A.; Ashraf, M.; Kattenacker, R. J.; Reddy, T. D., J. Pharm.
Biomed. Anal., 1998, 16, 1037-1040. [24] David, I.G.; Liescu, S. C.; David, I.; Radu, G. L.; Aboul-Enien, H., Instrum. Sci. Technol.,
2001, 29, 109-116. [25] Wang, Q.; Lee, B. L.; Ong, C. N., J. Chromatography B., 1999, 726, 279-302. [26] Al-Bakir, A., "The Date Palm", Al-Dar Al-Arabiya Publisher, Beirut, 2nd edit (2001). [27] Barreveled, W. H., "Date Palm Products", Food and Agriculture, Organization of the
United Nations (FAO), Rome (1993). [28] 1st Arab Conference on Dates and Palms, Baghdad, 1981. [29] Lund, E., Smoot, J. M.; Hall, N. T., J. Arg. and Food Chem., 1983, 31(5), 1013-1011. [30] Kikuchi, N.; Miki, T. A., J. Agric. Chem. Soc. of Japan, 1974, 48, 2, 64-69; a- Salman, H.
A.; Shanshal, M., Deutsche Lebensmittel Rundschau, 2007, 102,10. [31] Ashmawi, H., Hussein, A. A.; Shaker, N. H., "Bulletin of the Faculty of Agriculture", Cairo
University, Egypt (1955). [32] Kishi, H., Nishii, S., “Clinical Application of Coenzyme Q10 and the Quality Control of its
Preparations in Japan”, in Biomedical and Clinical Aspects of Coenzyme Q, Vol. 3, p. 45, Elsevier/North-Holland Biomedical Press, Amsterdam (1981).
[33] Crane, F. L., Dilley, R. A., Methods of Biochm Anal., 1963, 11, 280. [34] Crane, F. L.; Barr, R., "Methods in Enzymology" (McCormick, D.B.; Wright, L. D., Eds.),
Academic Press, New York, London, 1971, 18C, 137-164. [35] Hatefi, Y., Advances in Enzymology, Interscience Publishers, New York, London,
Sydney, 1966, 25, 276–295. [36] Crane, F. L.; Lester, R. L., Widmer, C.; Hatefi, Y., Biochem. Biophys. Acta, 1959, 32, 73-
79. [37] Morimoto, H.; Imada, I., Methodium Chemium, 1977, 11, 117. [38] Winrow, M. J.; Rudney, H., cit in “Methods in Enzymology”, Academic Press, New York
and London, 1971, 8C, 214-215. [39] Maamarbashi, G. S.; Rassam, M. B.; Shanshal, M., Molecular and Biochemical
Parasitology, 1988, 19. [40] Snyder, L. R., "Principles of Adsorption Chromatography", Dekker, New York, 1968. [41] Snyder, L. R., J. Chromatogr. Sci., 1972, 8, 692. [42] Nazir, D. J.; Nagar, N. G., J. Biochem., 1963, 90, 268-272. [43] Tang, P. H.; Miles, M. V.; Steele, P.; Davidson, B. S.; Geraghty, S. R.; Marrow, A. L.,
Biomed. Chromatogr., 2006, 20(12), 1336-1343. [44] Molieuz, S. L.; Lever, M., Clinica Chimica Acta, 2005, 358, 198-200. [45] Tang, H., "Electrochemical Analysis of Coenzyme Q10 and Reduced Coenzyme Q", US.
Patent 6.984.308 B2 (2002). [46] Li, K.; Shi, Y.; Chen, S.; Li, W.; Shang, X.; Huang, Y., Biomed. Chromotagr., 2006, 20(10)
1082-1086. [47] Larsen, T., Janssen, P. L.; Clarke, C. F., PNAS, 2002, 98(2), 421-426. [48] Tang, P. H.; Miles, M. V.; DeGraw, A., Clinical Chemistry, 2001, 47, 256-265. [49] Mattila, P., Lehtonen, M., Kumpulainen, J., J. Agric. Food Chem., 2000, 48, 1229-1223. [50] Weston, A.; Brown, P., "HPLC and CE Principles and Practice", Academic Press, San
Diego, USA (1997). [51] Settle, F. A., "Handbook of Instrumental Techniques for Analytical Chemistry", Prentice-
Hall, Inc. New Jersey (1997). [52] Al-Shahib, W.; Marshall, R. J., Int. J. Food Sci. Nutr., 2003, 54(4), 247-259.