Embed Size (px)
Citation preview
1
1
Information Visualization
Jing YangSpring 2007
2
What is Information Visualization (InfoVis)
Class 1
2
3
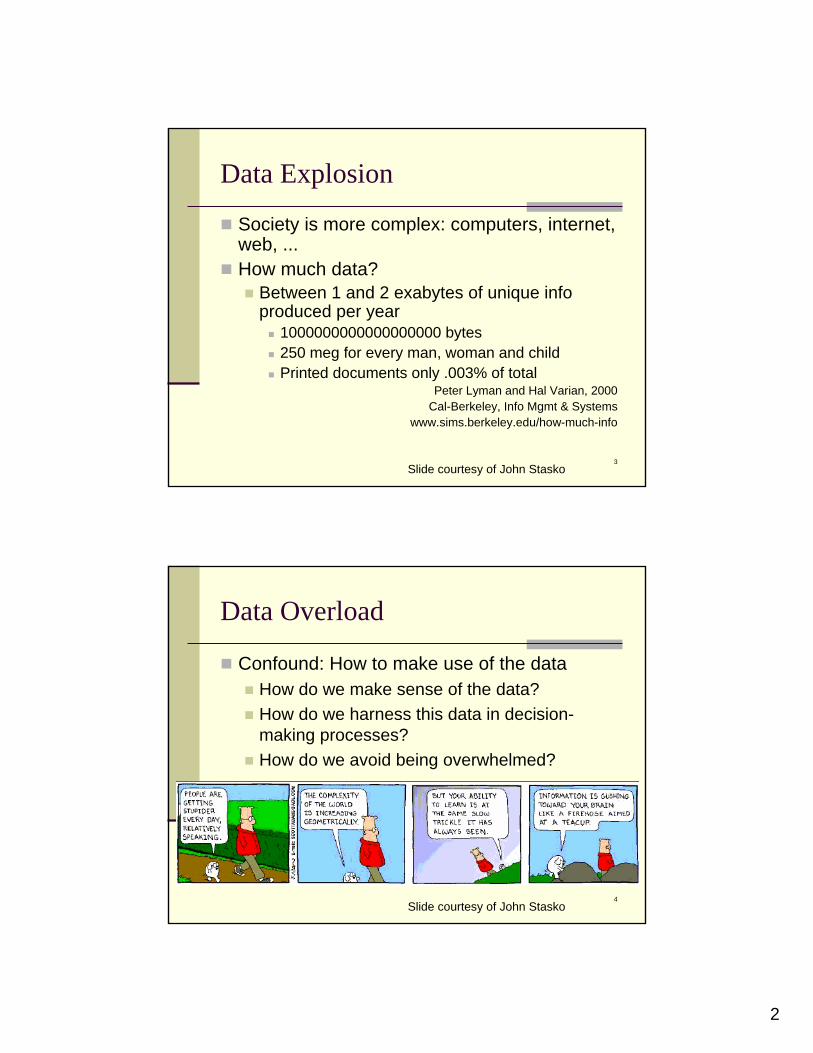
Data Explosion
Society is more complex: computers, internet, web, ...How much data?
Between 1 and 2 exabytes of unique info produced per year
1000000000000000000 bytes250 meg for every man, woman and childPrinted documents only .003% of total
Peter Lyman and Hal Varian, 2000Cal-Berkeley, Info Mgmt & Systems
www.sims.berkeley.edu/how-much-info
Slide courtesy of John Stasko
4
Data Overload
Confound: How to make use of the dataHow do we make sense of the data?How do we harness this data in decision-making processes?How do we avoid being overwhelmed?
Slide courtesy of John Stasko
3
5
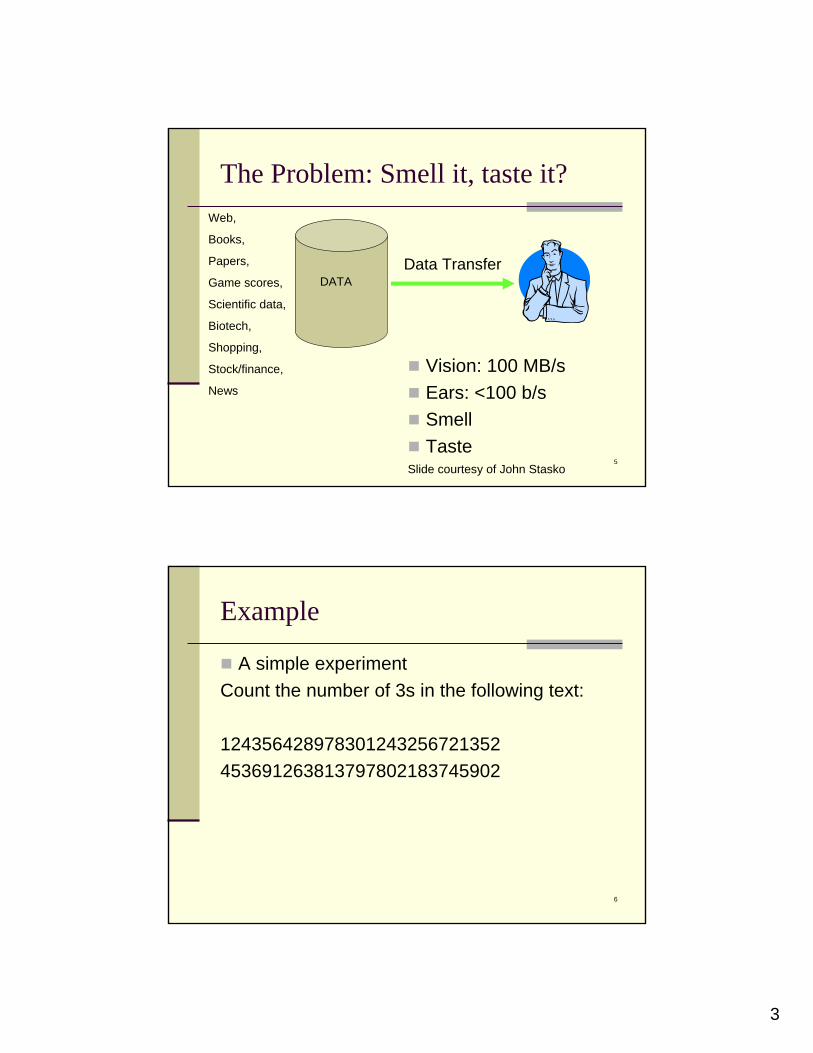
The Problem: Smell it, taste it?
Vision: 100 MB/s Ears: <100 b/sSmellTaste
DATAData Transfer
Web,
Books,
Papers,
Game scores,
Scientific data,
Biotech,
Shopping,
Stock/finance,
News
Slide courtesy of John Stasko
6
Example
A simple experimentCount the number of 3s in the following text:
124356428978301243256721352453691263813797802183745902
4
7
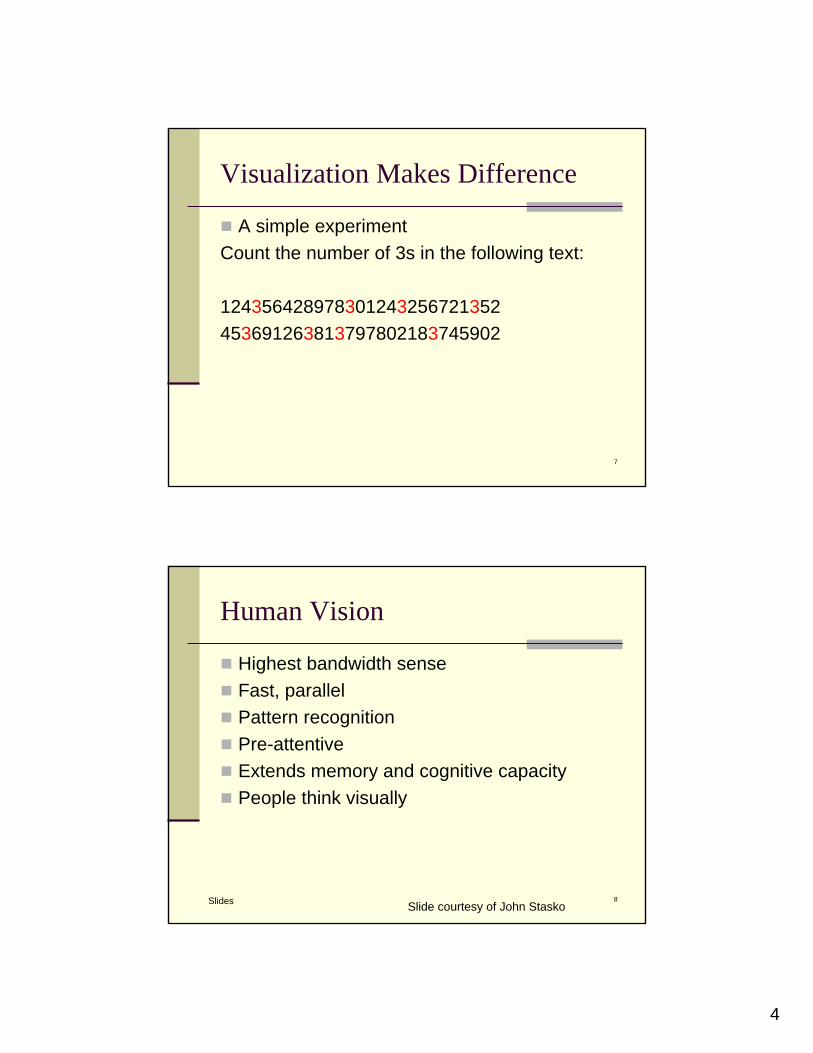
Visualization Makes Difference
A simple experimentCount the number of 3s in the following text:
124356428978301243256721352453691263813797802183745902
8
Human Vision
Highest bandwidth senseFast, parallelPattern recognitionPre-attentiveExtends memory and cognitive capacityPeople think visually
Slides Slide courtesy of John Stasko
5
9
The Challenge
Transform the data into information (understanding, insight) thus making it useful to people
Slide courtesy of John Stasko
10
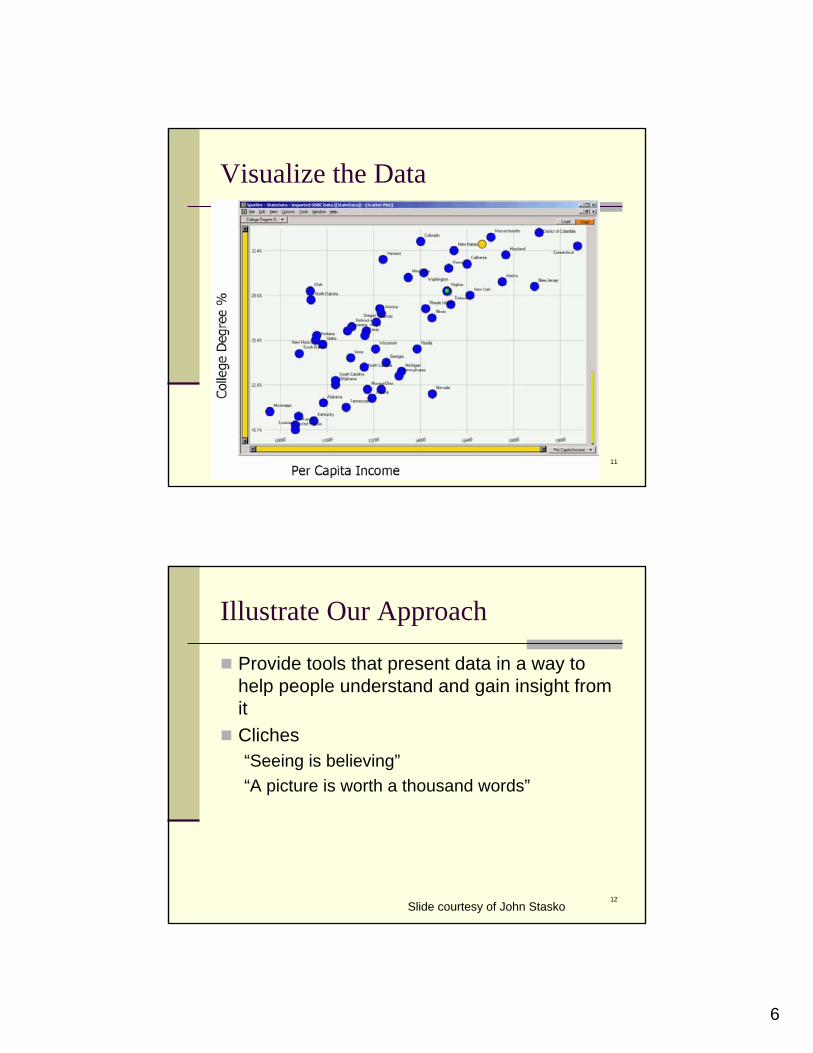
ExampleWhich state has the highest income? Is there a relationship between income and education?Are there any outliers?
Questions:
Example courtesy of Chris North
6
11
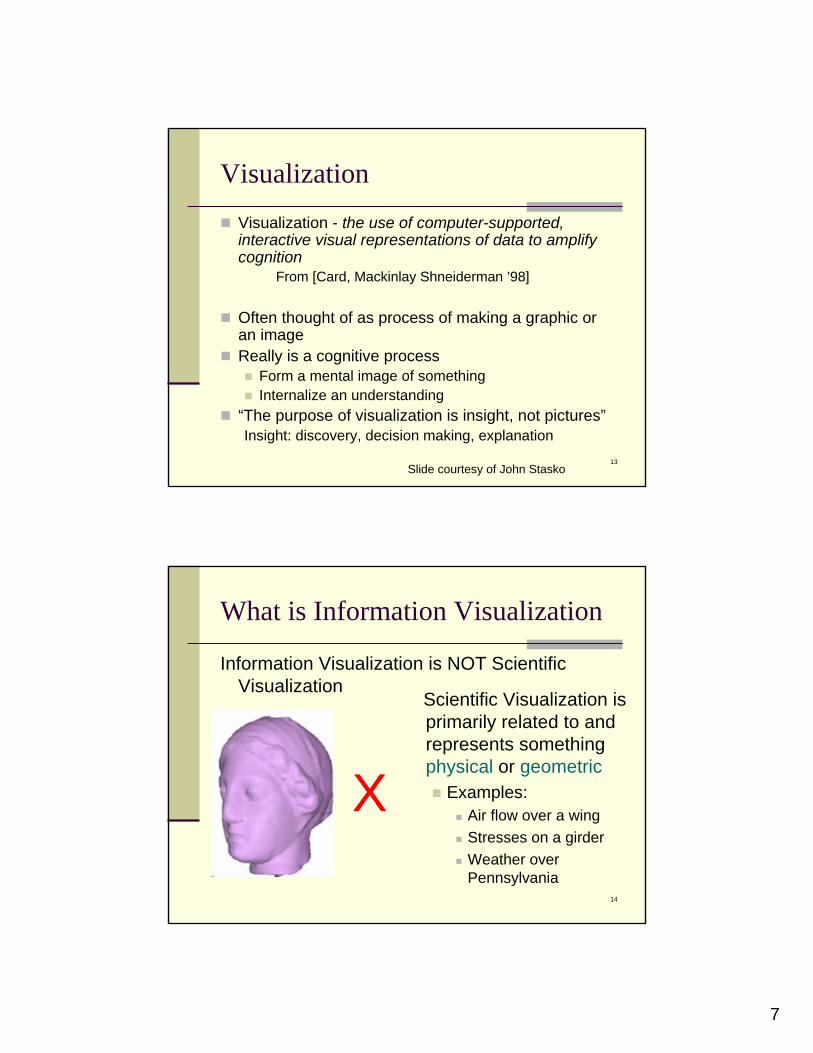
Visualize the Data
12
Illustrate Our Approach
Provide tools that present data in a way to help people understand and gain insight from itCliches“Seeing is believing”“A picture is worth a thousand words”
Slide courtesy of John Stasko
7
13
VisualizationVisualization - the use of computer-supported, interactive visual representations of data to amplify cognition
From [Card, Mackinlay Shneiderman ’98]
Often thought of as process of making a graphic or an imageReally is a cognitive process
Form a mental image of somethingInternalize an understanding
“The purpose of visualization is insight, not pictures”Insight: discovery, decision making, explanation
Slide courtesy of John Stasko
14
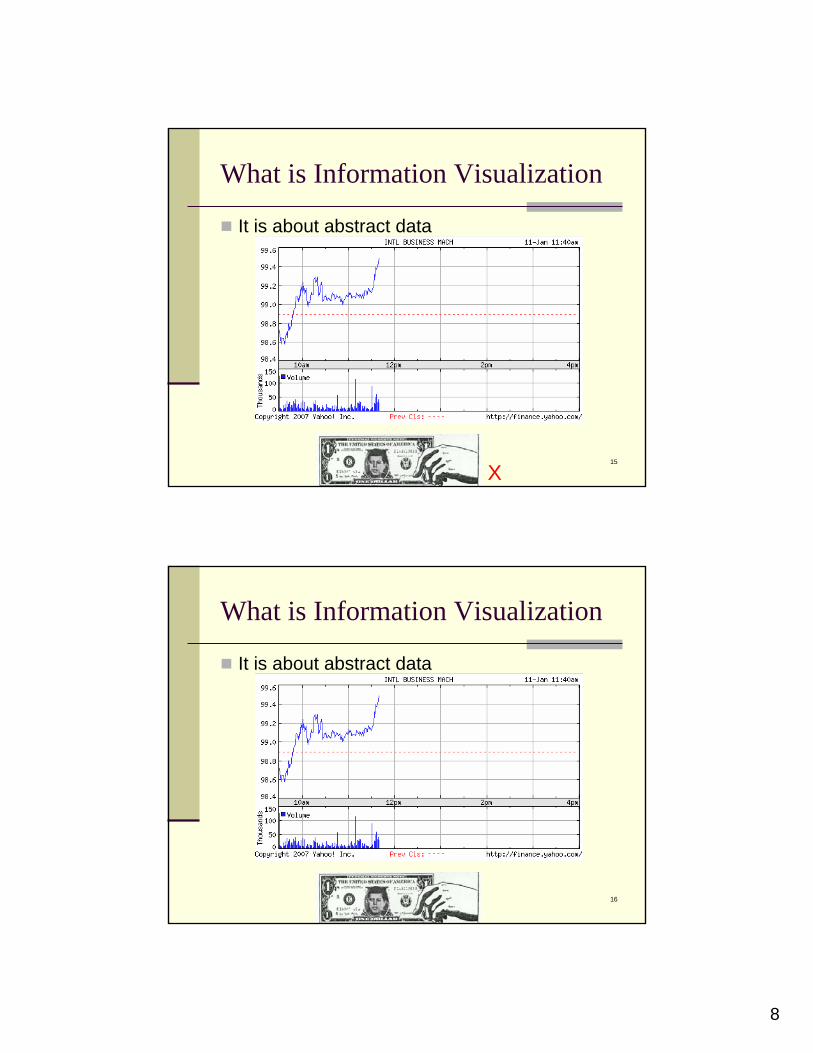
What is Information Visualization
Information Visualization is NOT Scientific Visualization
X
Scientific Visualization is primarily related to and represents something physical or geometric
Examples:Air flow over a wingStresses on a girderWeather over Pennsylvania
8
15
What is Information Visualization
It is about abstract data
X
16
What is Information Visualization
It is about abstract data
9
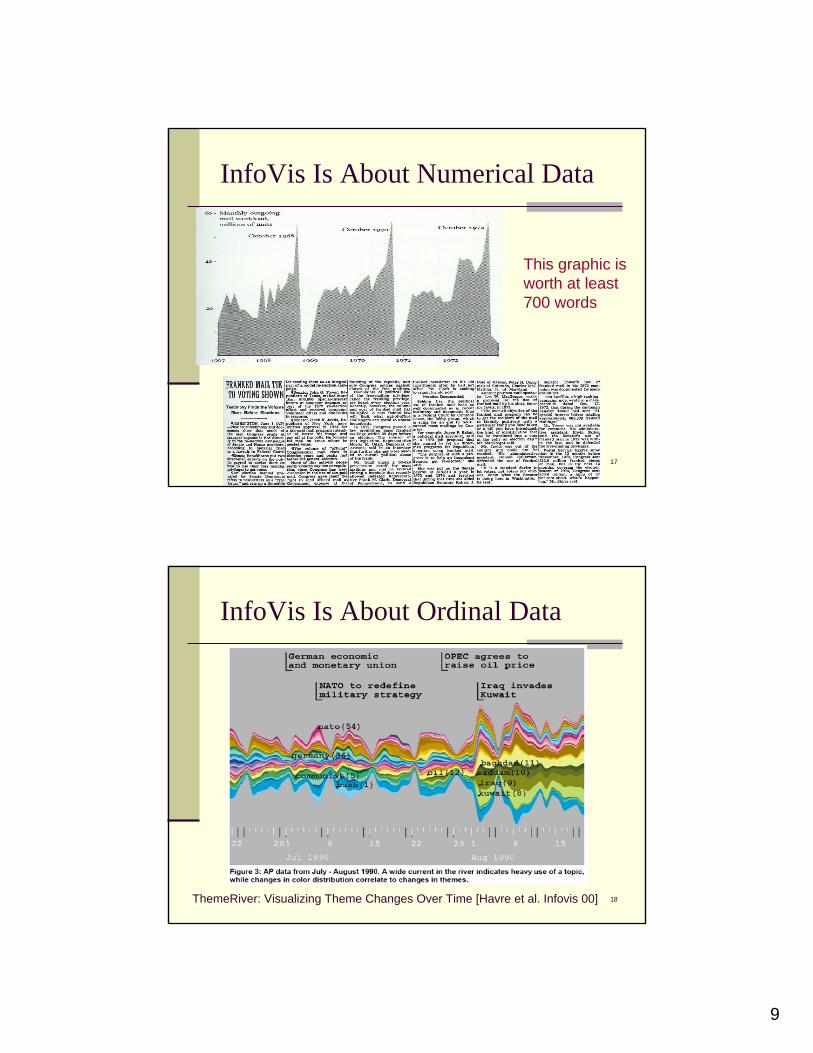
17
InfoVis Is About Numerical Data
This graphic is worth at least 700 words
18
InfoVis Is About Ordinal Data
ThemeRiver: Visualizing Theme Changes Over Time [Havre et al. Infovis 00]
10
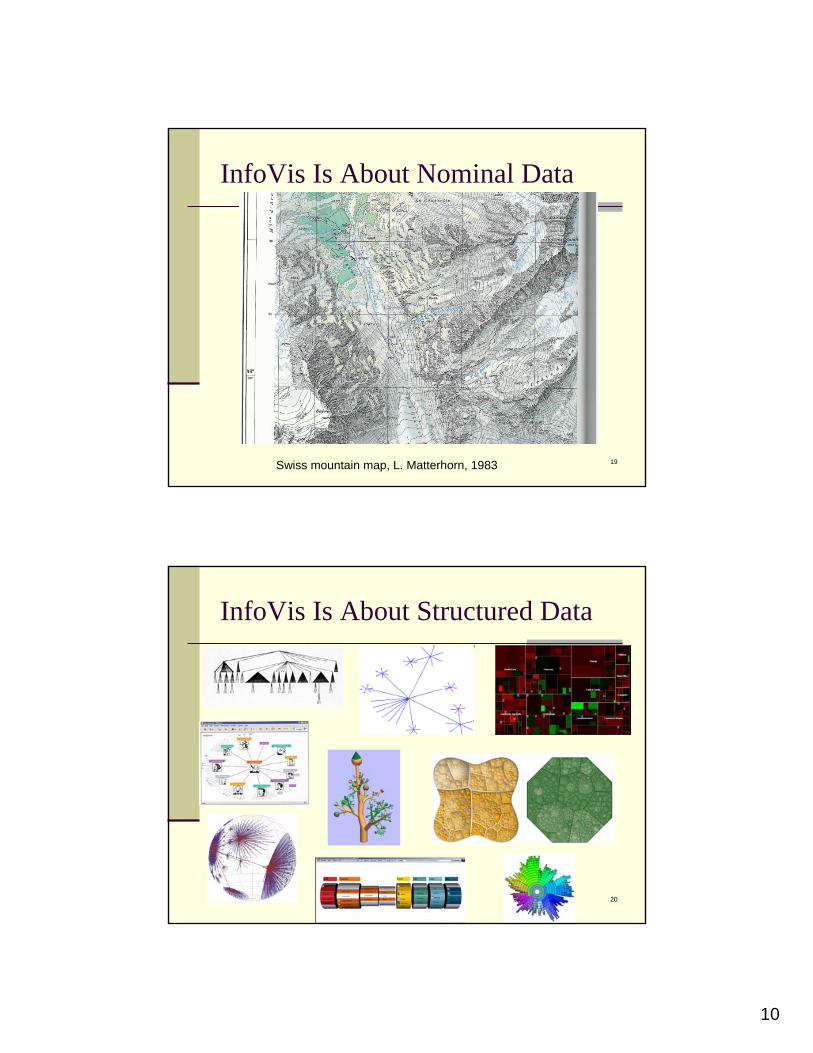
19
InfoVis Is About Nominal Data
Swiss mountain map, L. Matterhorn, 1983
20
InfoVis Is About Structured Data
11
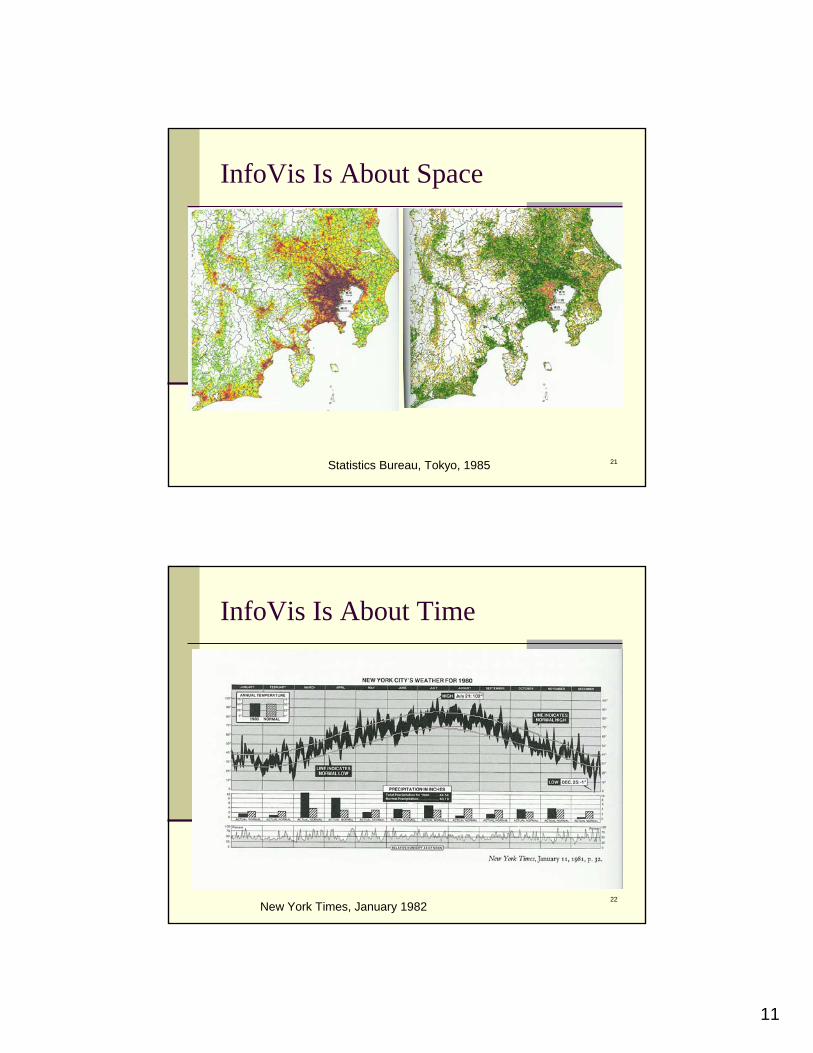
21
InfoVis Is About Space
Statistics Bureau, Tokyo, 1985
22
InfoVis Is About Time
New York Times, January 1982
12
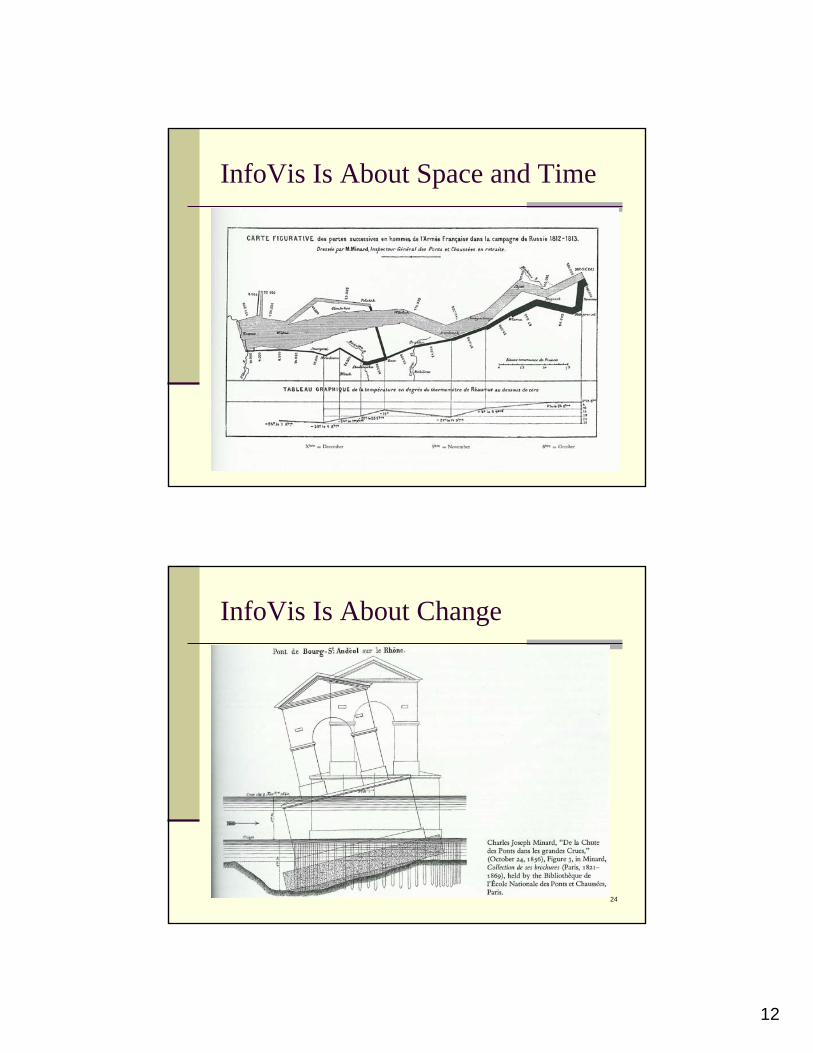
23
InfoVis Is About Space and Time
24
InfoVis Is About Change
13
25
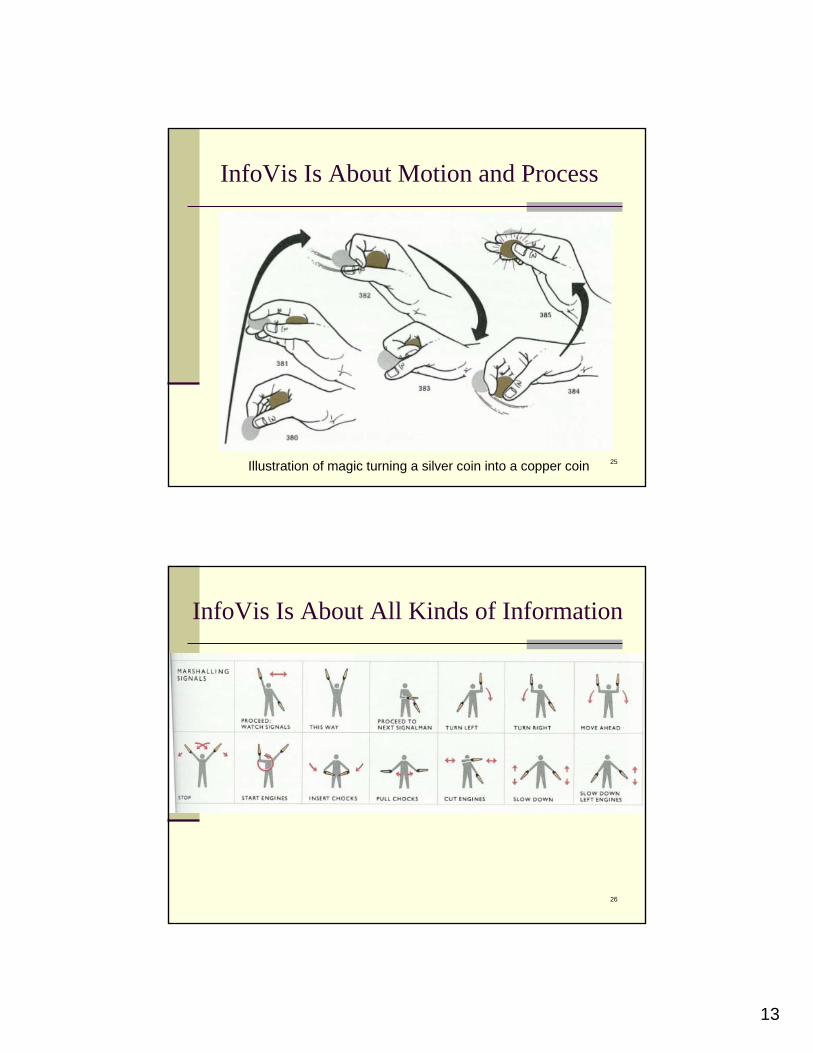
InfoVis Is About Motion and Process
Illustration of magic turning a silver coin into a copper coin
26
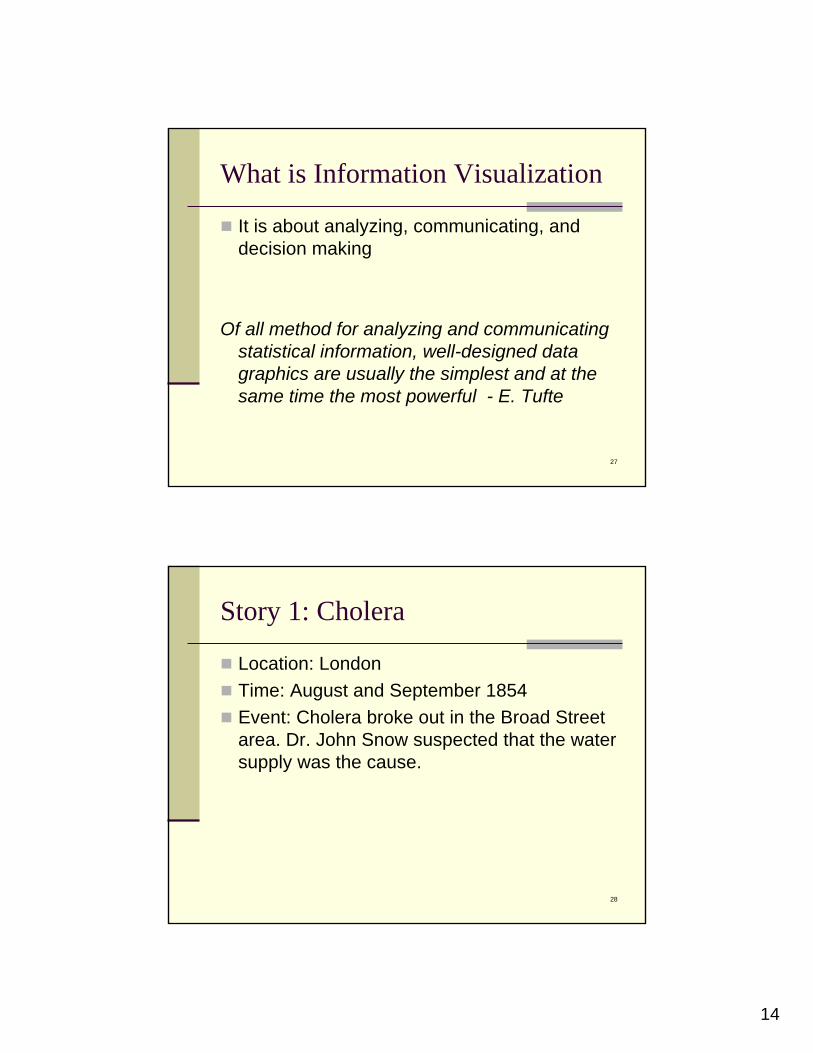
InfoVis Is About All Kinds of Information
14
27
What is Information Visualization
It is about analyzing, communicating, and decision making
Of all method for analyzing and communicating statistical information, well-designed data graphics are usually the simplest and at the same time the most powerful - E. Tufte
28
Story 1: Cholera
Location: LondonTime: August and September 1854Event: Cholera broke out in the Broad Street area. Dr. John Snow suspected that the water supply was the cause.
15
29
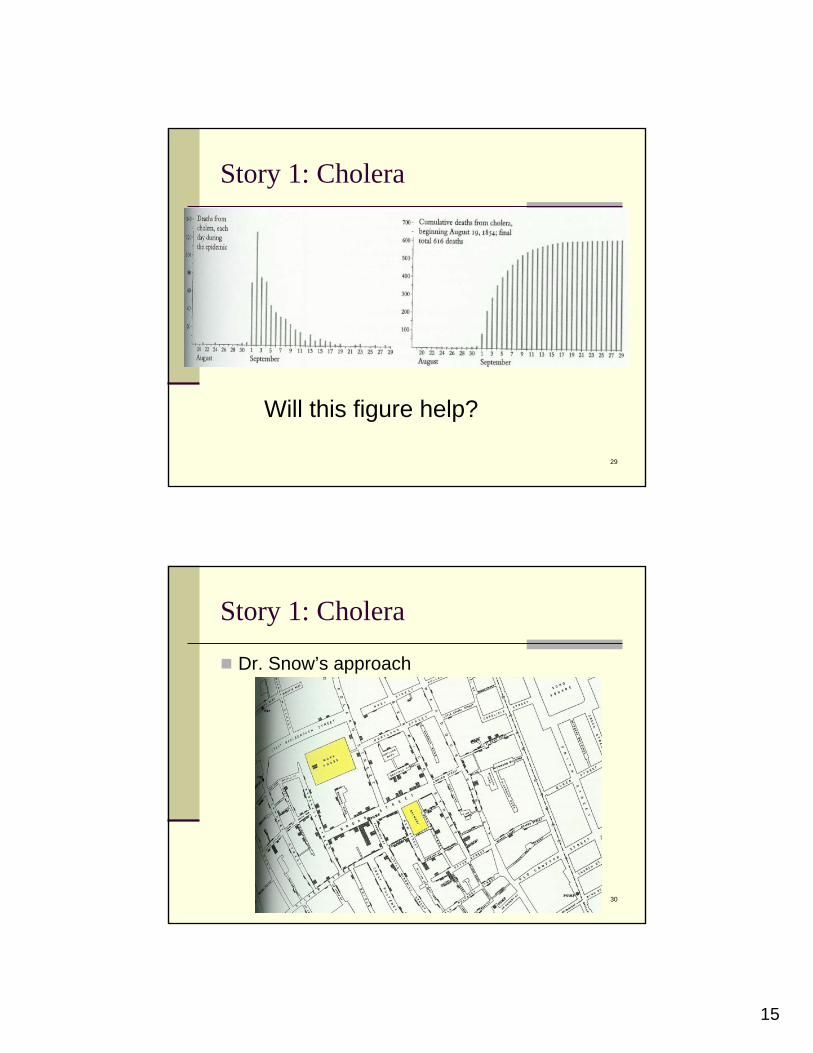
Story 1: Cholera
Will this figure help?
30
Story 1: Cholera
Dr. Snow’s approach
16
31
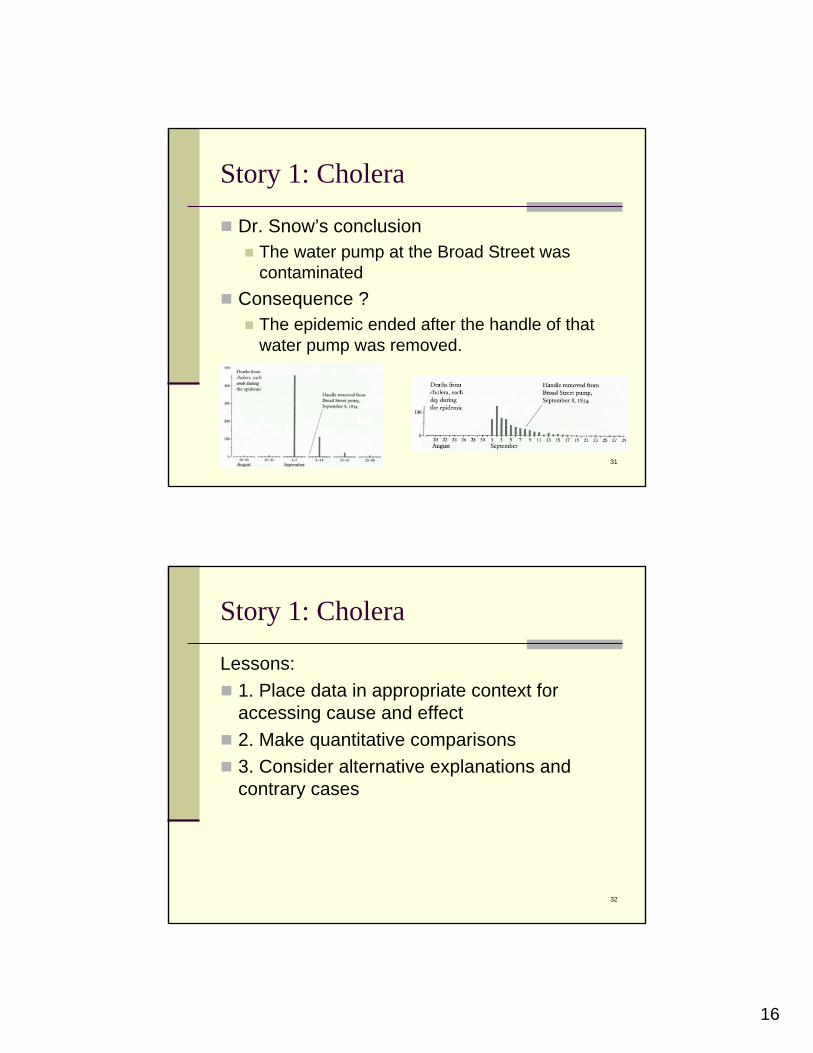
Story 1: Cholera
Dr. Snow’s conclusionThe water pump at the Broad Street was contaminated
Consequence ?The epidemic ended after the handle of that water pump was removed.
32
Story 1: Cholera
Lessons:1. Place data in appropriate context for accessing cause and effect2. Make quantitative comparisons3. Consider alternative explanations and contrary cases
17
33
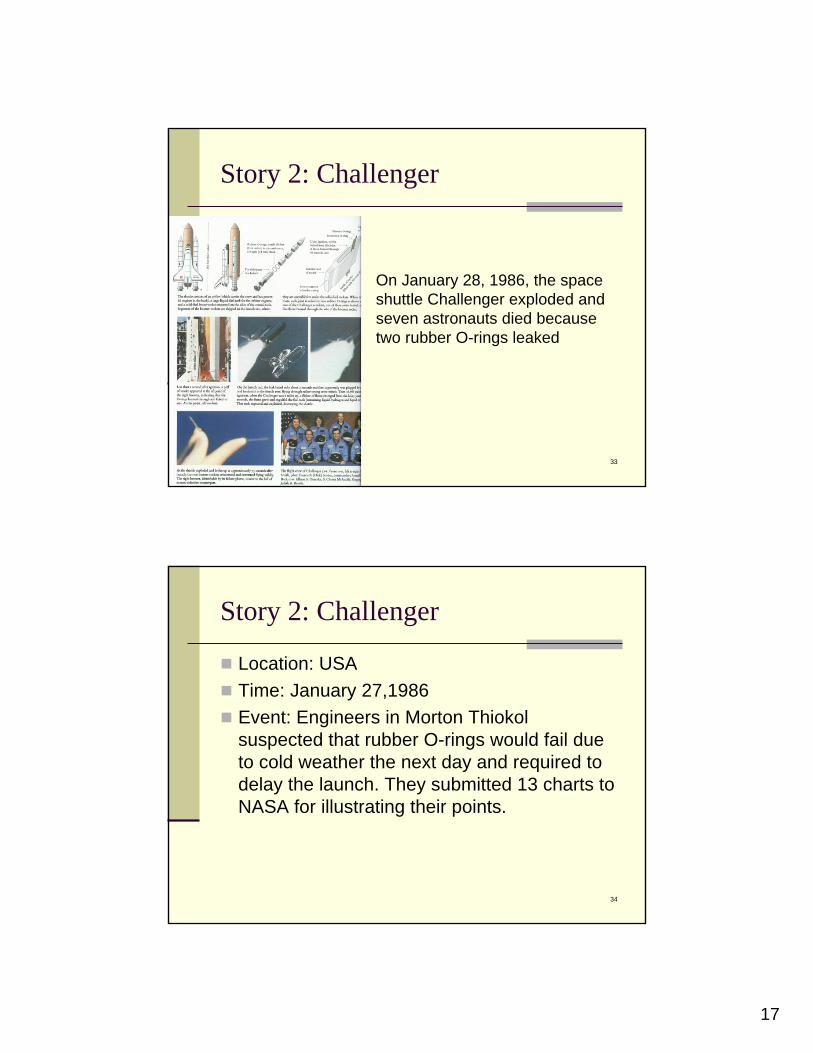
Story 2: Challenger
On January 28, 1986, the space shuttle Challenger exploded and seven astronauts died because two rubber O-rings leaked
34
Story 2: Challenger
Location: USATime: January 27,1986Event: Engineers in Morton Thiokol suspected that rubber O-rings would fail due to cold weather the next day and required to delay the launch. They submitted 13 charts to NASA for illustrating their points.
18
35
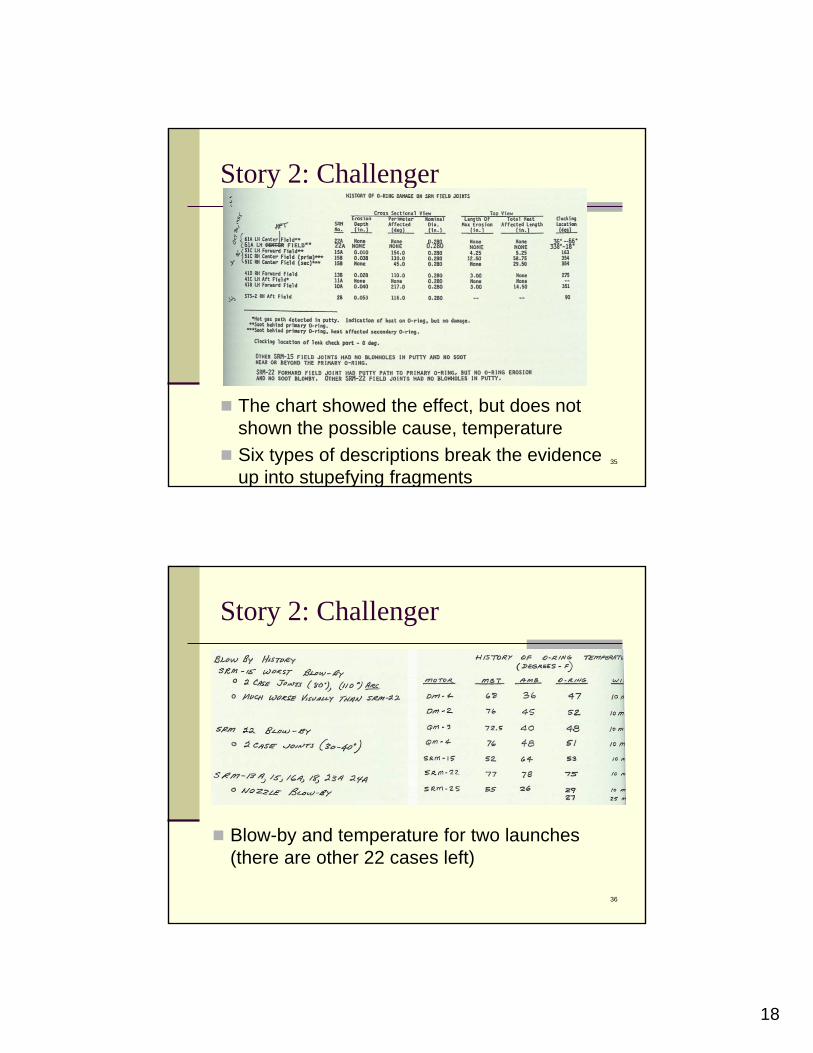
Story 2: Challenger
The chart showed the effect, but does not shown the possible cause, temperature Six types of descriptions break the evidence up into stupefying fragments
36
Story 2: Challenger
Blow-by and temperature for two launches (there are other 22 cases left)
19
37
Story 2: Challenger
Engineers’ conclusionO-rings would fail due to cold weather the next day Consequence ?
NASA officers’ conclusionThey wouldn’t fail.
Consequence: Challenger was launched the next day. O-rings failed. ...
38
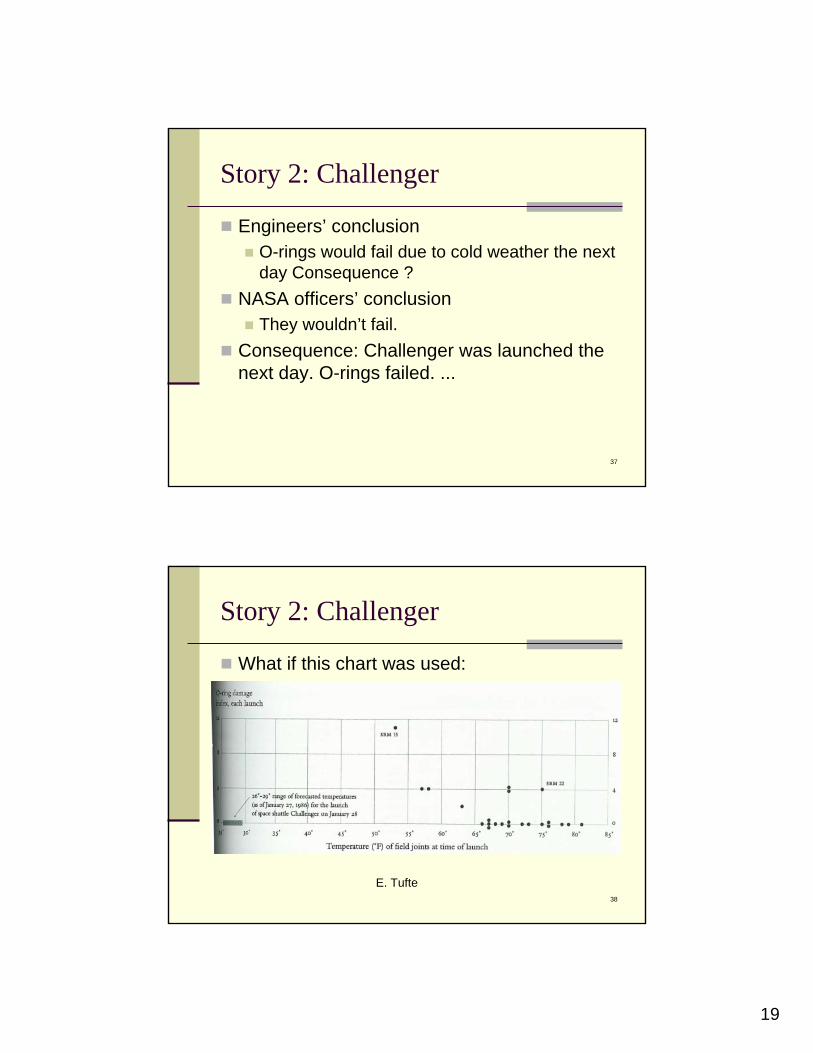
Story 2: Challenger
What if this chart was used:
E. Tufte
20
39
What is Information Visualization
It is about scale and dimensionalityScale
Essential problem in reasoning is comparisonComparisons must be enforced within scope of eyespan
DimensionalityThe world is multi-dimensionalThe paper and computer is 2 dimensionalEscape from the flatland
40
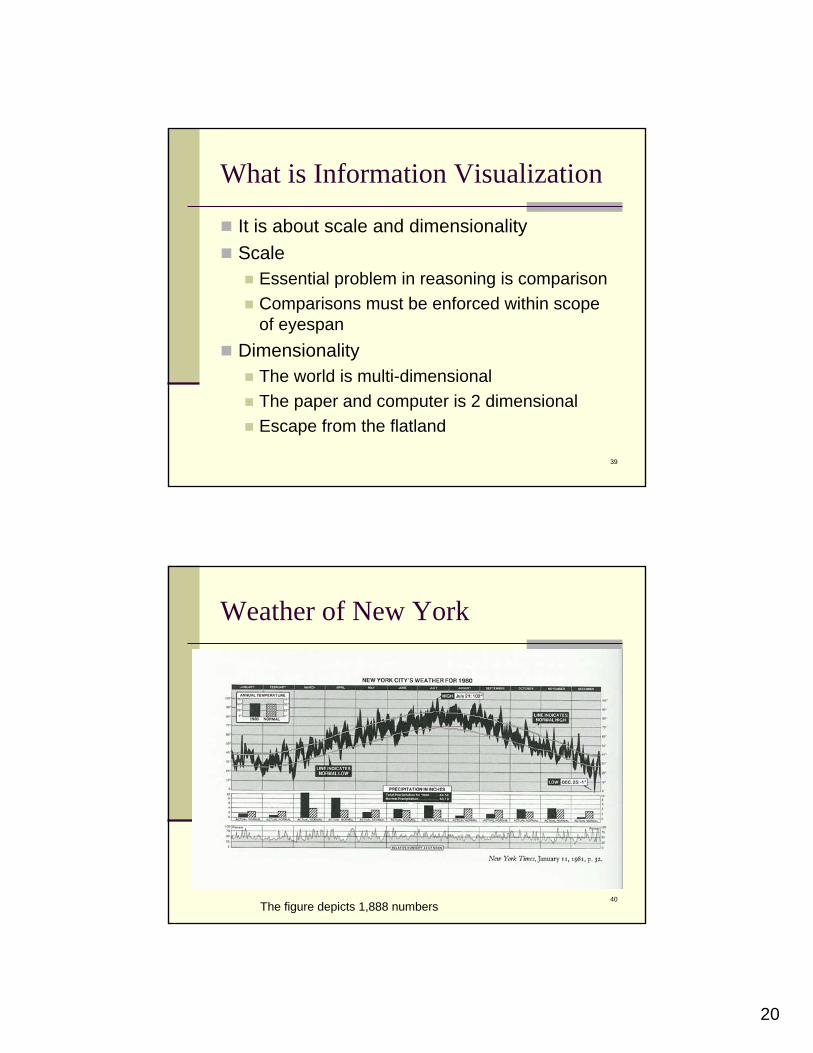
Weather of New York
The figure depicts 1,888 numbers
21
41
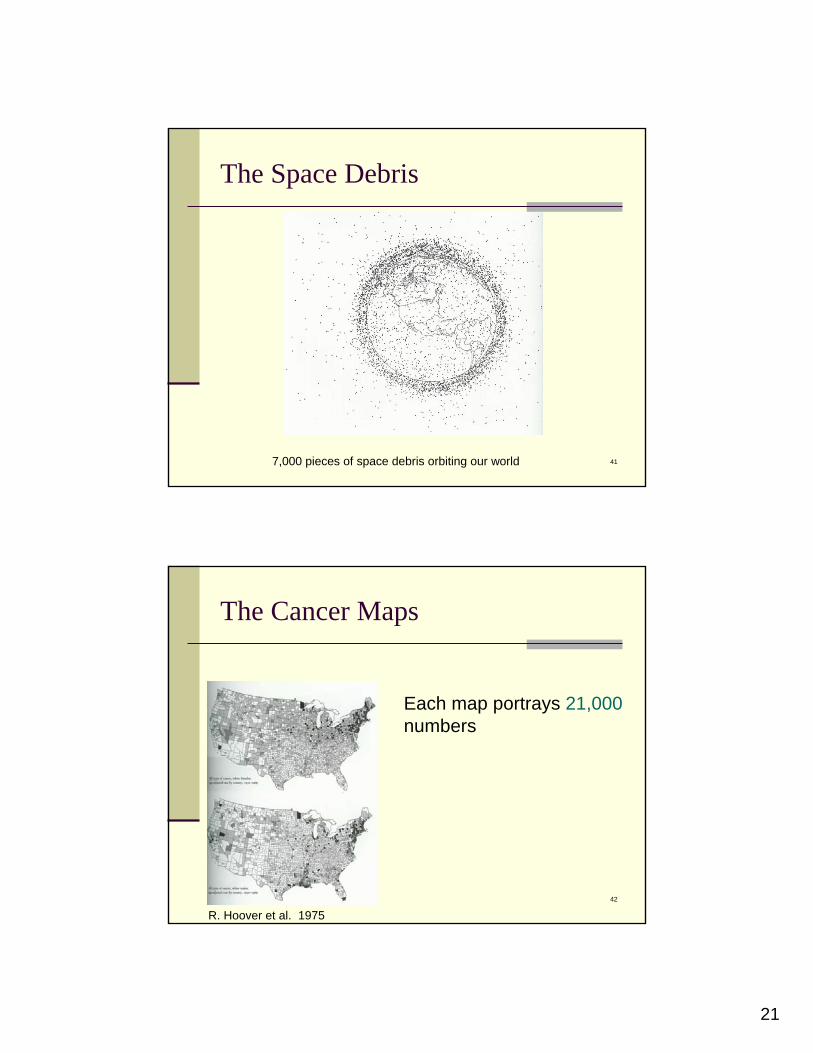
The Space Debris
7,000 pieces of space debris orbiting our world
42
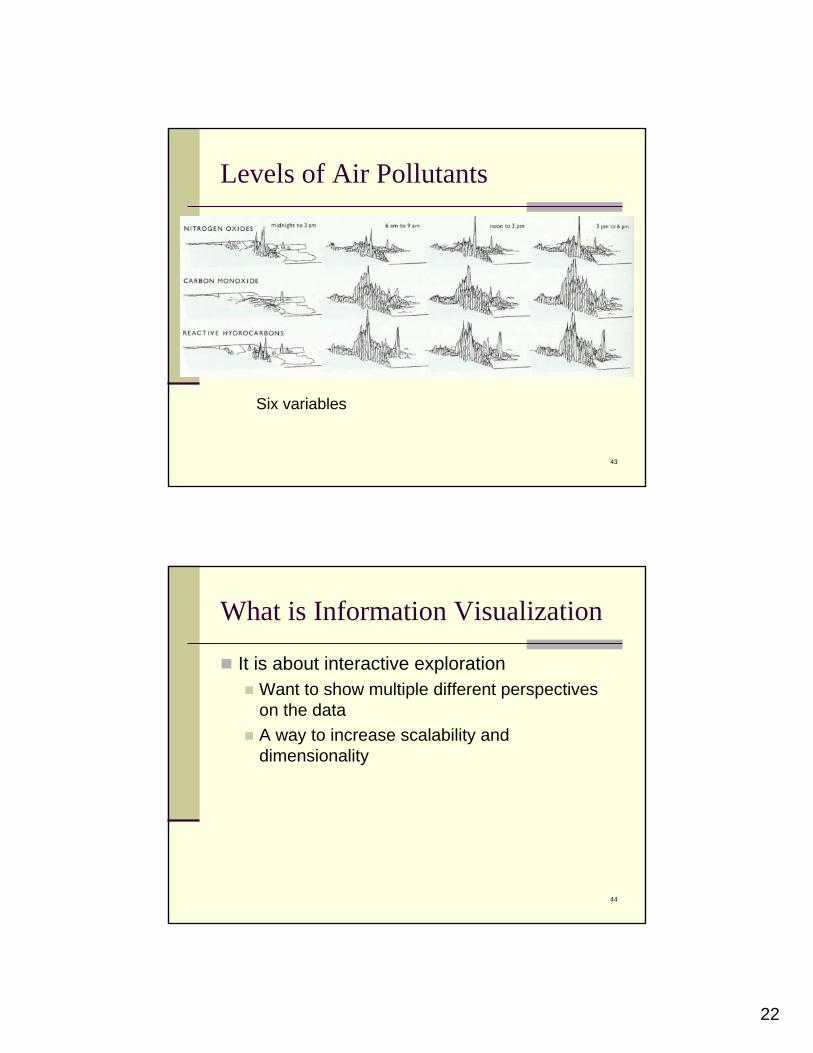
The Cancer Maps
R. Hoover et al. 1975
Each map portrays 21,000numbers
22
43
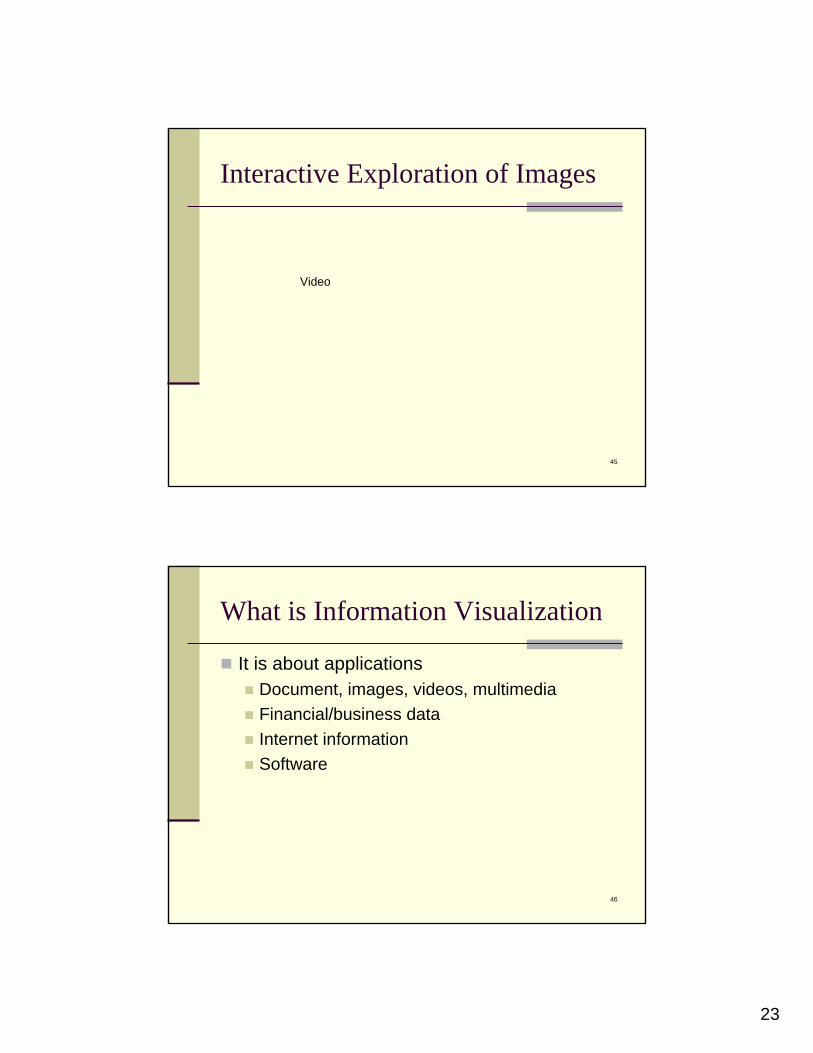
Levels of Air Pollutants
Six variables
44
What is Information Visualization
It is about interactive explorationWant to show multiple different perspectives on the dataA way to increase scalability and dimensionality
23
45
Interactive Exploration of Images
Video
46
What is Information Visualization
It is about applicationsDocument, images, videos, multimediaFinancial/business dataInternet informationSoftware
24
47
Example 1 - Infocanvas
The Infocanvas project Team Members: John Stasko, Dave McColgin, Todd Miller, Chris
Plaue, Zach Pousman
http://www.cc.gatech.edu/gvu/ii/infoart/
48
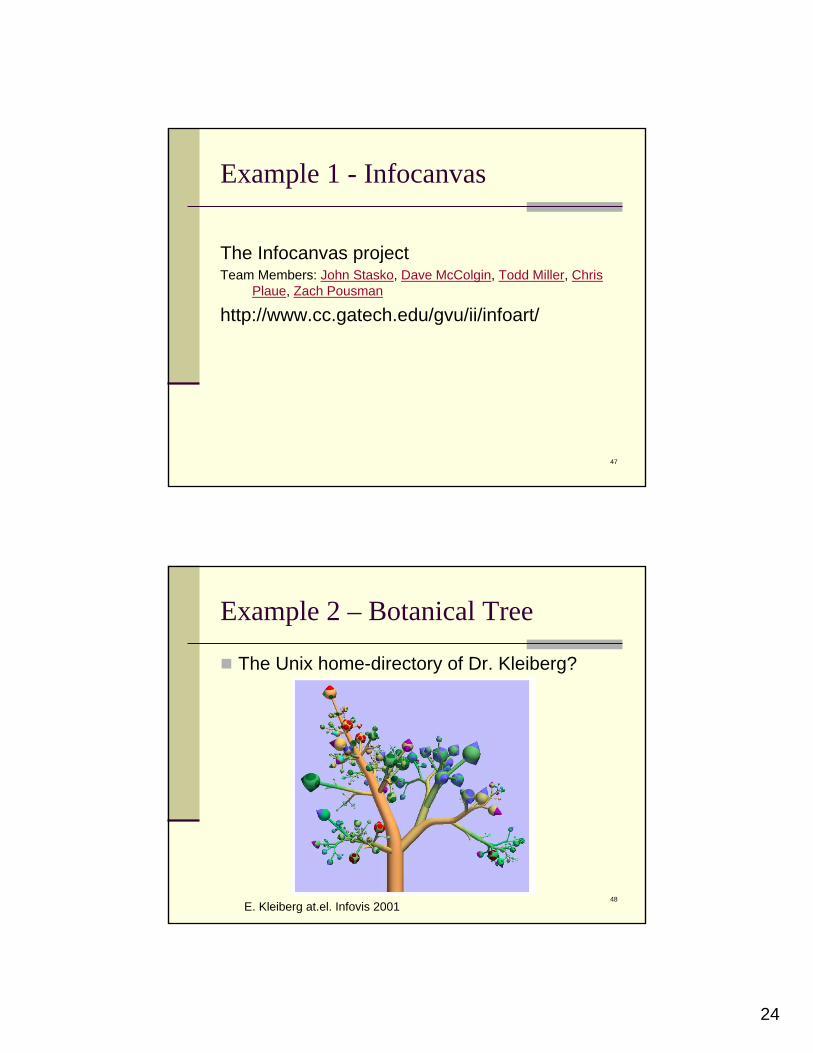
Example 2 – Botanical Tree
The Unix home-directory of Dr. Kleiberg?
E. Kleiberg at.el. Infovis 2001
25
49
Example 3 – Stock Visualization
Visualization 1:Yahoo stock quotes for one stockhttp://finance.yahoo.com/
Visualization 2:Smartmoney Map of Markethttp://www.smartmoney.com/marketmap/
50
Example 4 – Home Finder
Dynamic home finder Human-Computer Interaction Lab / Univ. of Marylandhttp://www.cs.umd.edu/hcil/pubs/products.shtml
26
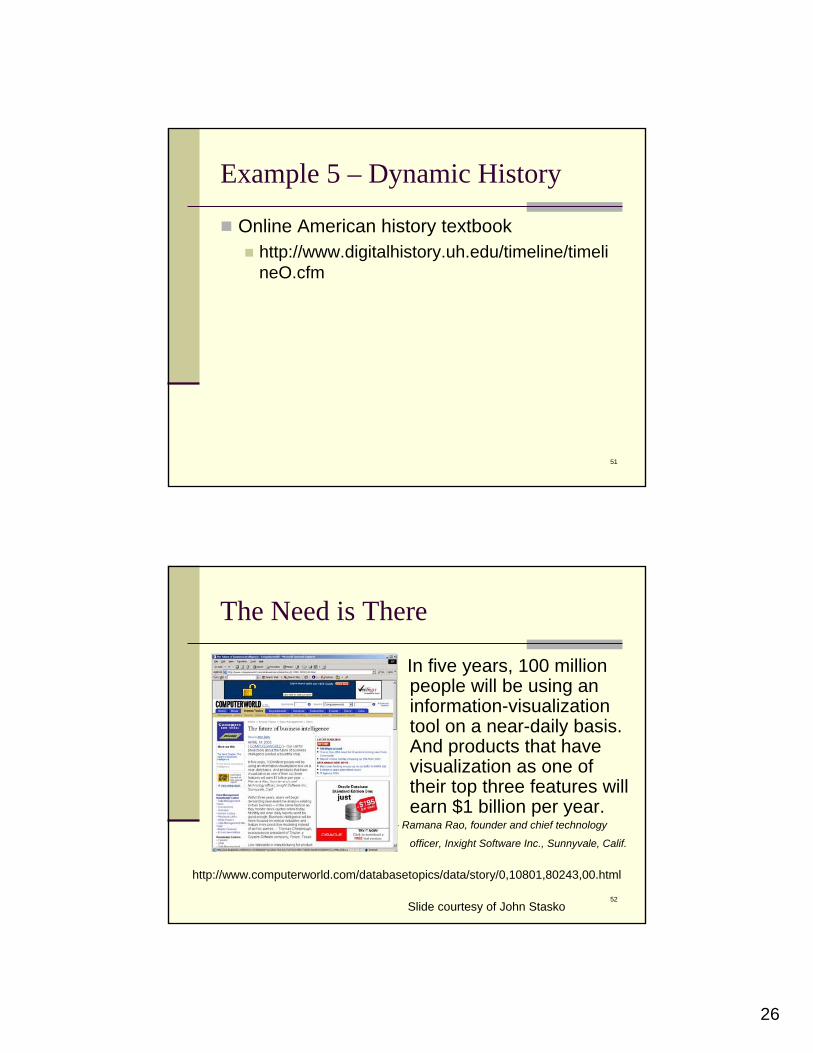
51
Example 5 – Dynamic History
Online American history textbookhttp://www.digitalhistory.uh.edu/timeline/timelineO.cfm
52
The Need is There
In five years, 100 million people will be using an information-visualization tool on a near-daily basis. And products that have visualization as one of their top three features will earn $1 billion per year.
-- Ramana Rao, founder and chief technology
officer, Inxight Software Inc., Sunnyvale, Calif.
http://www.computerworld.com/databasetopics/data/story/0,10801,80243,00.html
Slide courtesy of John Stasko
27
53
References:
Edward Tufte:The Visual Display of Quantitative InformationEnvisioning InformationVisual Explanation
Dr. John Stasko’s Information Visualization class slides
54
Assignment
1. Read chapter 1 and 6 of Spence book2. Prepare the discussion for next class:
Find two examples of Information Visualization and share them with all of us
28
55
Thumbnails
56
Smallest Effective Difference
Design strategyMake all visual distinctions as subtle as possible, but still clear and effective
WhenDesign secondary and structural elements in information displays
Why? Small differences allow more differencesReduce visual clutterProduce visual hierarchy: inactive background, calm secondary structure, and notable content
29
57
Smallest Effective Difference
Example: p73, 74, 76, 77
58