Embed Size (px)
Citation preview

Copyright @ 2014 Jindal Steel & Power Limited 1
1Q FY15 (June’ 14)
Jindal Steel and Power Ltd
Investor Presentation

Copyright @ 2014 Jindal Steel & Power Limited 2
Index
S. No Particulars Slide No
1 JSPL at a Glance 3-5
2 Group Executive Committee - JSPL 6-9
3 Shareholding Pattern - JSPL 10-11
4 Operational Capacity at a Glance 13-15
5 Indian Economy at Glance 16-20
6 Industry Development - Steel 21-26
7 Industry Development - Power 27-38
8 Operations 39-65
9 JPL 66-70
10 Global Ventures 71-80
11 Financials 81-91
12 Way Forward 92-99
13 Projects 100-112
Copyright @ 2014 Jindal Steel & Power Limited 3
Jindal Steel & Power Limited Face of Youthful Dynamism
Aerial View of Raigarh Plant

Copyright @ 2014 Jindal Steel & Power Limited 4
O P Jindal Group
Jindal Saw Mr. P.R. Jindal
JSL Limited Mr. Ratan Jindal
JSW Steel/JSW Energy Mr. Sajjan Jindal
Jindal Steel & Power (JSPL) Mr. Naveen Jindal
Copyright @ 2014 Jindal Steel & Power Limited 4
Ownership Structure - O P Jindal Group

Copyright @ 2014 Jindal Steel & Power Limited 5
Annual turnover of JSPL
US$ 3.3 bn+
Future investments committed across continents
US$ 30 bn
Steel making capacity Mining capacity
22.56 MTPA
Power capacity
4,532 MW
Pellet making capacity
9 MTPA 29 Countries
Ensuring pan-India presence, covering 400 districts for retail
business
People strengths
16000+
Lives impacted by JSPL’s social endeavours
9 Lakh+
Saplings planted
7.4 mn+
7.50 MTPA
Export presence
1,472 Dealers
JSPL at a Glance - Part of US$ 18 bn OP Jindal Group

Copyright @ 2014 Jindal Steel & Power Limited 6 Copyright @ 2014 Jindal Steel & Power Limited 6
Mr. Naveen Jindal – Chairman
• Ranked amongst the Asia’s 25 Hottest People in Business by the Fortune Asia magazine for turning a struggling steel company into one of Asia’s blue-chip giants
• India’s Best CEO by the BT-INSEAD-HBR Study of the top value creators for the period 1995 to 2011 by the Business Today
• Featured among the top ten of India Inc's Most Powerful CEOs 2011 by IMRB survey for Economic Times-Corporate Dossier
• Conferred with the Ernst and Young Entrepreneur of the Year Award 2010 in the field of Energy and Infrastructure
Mr. Ravi Uppal – Managing Director & Group CEO
• Over 37 years of experience in engineering and infrastructure
• Previously whole-time Director and President & CEO – L&T Group. Also held senior positions at ABB and Volvo
• Advanced MBA from Wharton, MBA from IIM Ahmedabad, and B.Tech. from IIT Delhi
Mr. Anand Goel – Chief Advisor
• Over 37 years of experience with the O.P. Jindal Group
• Master's Degree in Business Administration from BITS, Pilani
• Member of the National Steel & National Mining committees of FICCI and National Mining Committee of CII
Mr. K Raja Gopal – Director & Group CFO
• Over 32 years of experience out of which about 21 years has been with ABB
• Chartered Account from the Institute of Chartered Accountants of India
Group Executive Committee - JSPL

Copyright @ 2014 Jindal Steel & Power Limited 7 Copyright @ 2014 Jindal Steel & Power Limited 7
Mr. Rajesh Bhatia – CEO Global Ventures
• Over 21 years of experience in the field of Finance, Accounts, Taxation, Administration and Commercial
• Played an important role in JSPL's overseas acquisitions in Australia, Indonesia, South Africa, Mozambique, Madagascar, Mongolia & Oman, apart from arranging financing for greenfield expansion in Orissa and Jharkhand in India.
Mr. Subrat Ratho – MD, CTL & Head of Odisha operations
• Previously Managing Director of Maharashtra State Power Generation Company Ltd. and Mahaguj Collieries Ltd.
• Managing Director of the Maharashtra State Electricity Transmission Company Ltd. and MSEB Holding Company Ltd.
• Joined IAS in 1986
Mr. R S Sharma – Managing Director & CEO, JPL
• Over 40 years of experience in the power sector
• Previously he was the Chairman and Managing Director, NTPC Ltd.
• He has been honoured with several awards including honorary fellowship from International Project Management Association, fellowship of World Academy of Productivity Science
Group Executive Committee - JSPL
Copyright @ 2014 Jindal Steel & Power Limited 8
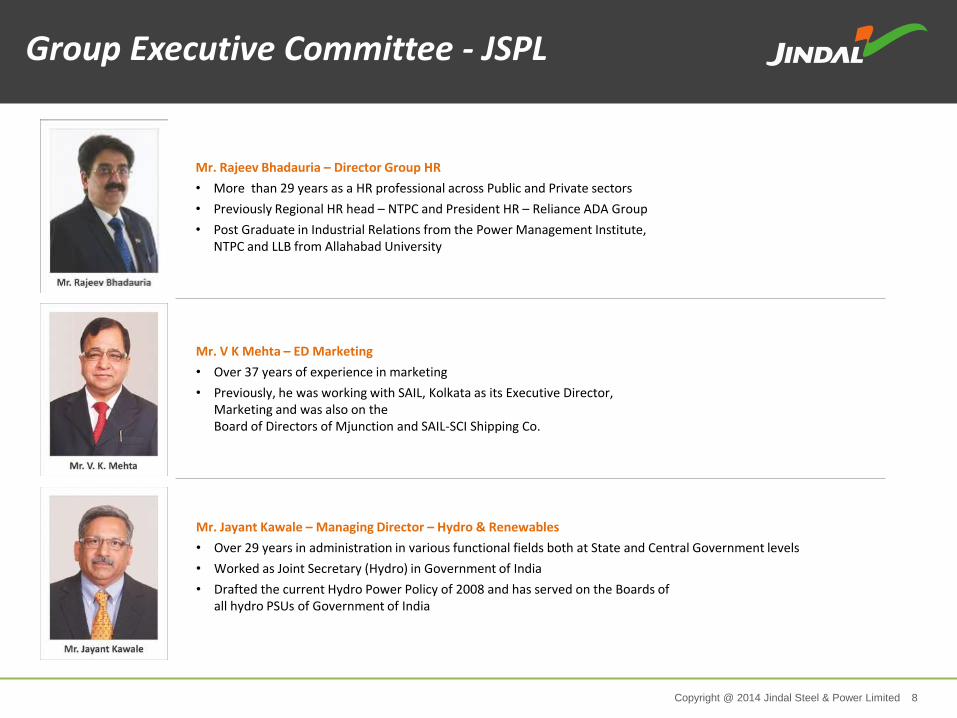
Mr. V K Mehta – ED Marketing
• Over 37 years of experience in marketing
• Previously, he was working with SAIL, Kolkata as its Executive Director, Marketing and was also on the Board of Directors of Mjunction and SAIL-SCI Shipping Co.
Mr. Jayant Kawale – Managing Director – Hydro & Renewables
• Over 29 years in administration in various functional fields both at State and Central Government levels
• Worked as Joint Secretary (Hydro) in Government of India
• Drafted the current Hydro Power Policy of 2008 and has served on the Boards of all hydro PSUs of Government of India
Mr. Rajeev Bhadauria – Director Group HR
• More than 29 years as a HR professional across Public and Private sectors
• Previously Regional HR head – NTPC and President HR – Reliance ADA Group
• Post Graduate in Industrial Relations from the Power Management Institute, NTPC and LLB from Allahabad University
Group Executive Committee - JSPL

Copyright @ 2014 Jindal Steel & Power Limited 9
Group Executive
Committee
Senior Management Committee
Core Management
Team
UniCo
For each Location
ManCo
For each Business
Business Segments
Global Ventures
Mines & Minerals
Power
Steel & Cement
Strategic Governance Structure Operational Governance Structure
Moving Towards Plural Leadership
Implementation of Strategic & Operational Governance Structure

Copyright @ 2014 Jindal Steel & Power Limited 10
March, 2011
March, 2012
March, 2013
March, 2014
June, 2014
Promoters 58.41% 58.91% 59.13% 60.41% 60.41%
Institutional Investors 29.54% 28.96% 27.45% 26.45% 27.15%
Public and other share holding
12.05% 12.13% 13.42% 13.14% 12.44%
Total 100.00% 100.00% 100.00% 100.00% 100.00%
Number of share holders 1,23,842 1,26,678 1,32,311 1,35,593 1,35,237
123842
126678
132311
135593 135237
115000
120000
125000
130000
135000
140000
31.03.11 31.03.12 31.03.13 31.03.14 30.06.14
Number of share holders
Number of share holders
Shareholding Pattern - JSPL

Copyright @ 2014 Jindal Steel & Power Limited 11
March, 2011
March, 2012
March, 2013
March, 2014
June, 2014
Foreign Inst’ Investors 23.44% 22.14% 20.76% 22.32% 22.38%
Insurance 4.06% 4.09% 3.23% 2.47% 3.17%
Mutual funds 2.00% 2.71% 3.41% 1.61% 1.49%
Others -financial institutions
0.04% 0.02% 0.05% 0.05% 0.11%
Total Inst’ share holding 29.54% 28.96% 27.45% 26.45% 27.15%
FII’s Continues to Keep Faith in JSPL
Institutional Shareholding - JSPL

Copyright @ 2014 Jindal Steel & Power Limited 12
Steel & Cement Power
Mines & Minerals
Business segments
Global Ventures
JSPL
Steel 7.50 MTPA
Mining 22.56 MTPA
Power 4532 MW
Business segments
Current Capacities – Domestic & Global
Business Segments

Copyright @ 2014 Jindal Steel & Power Limited 13
Capacity in deail
Raigarh
SMS 3 MTPA
BF 1.67 MTPA
DRI 1.37 MTPA
Plate Mill 1 MTPS
RUBM 0.75 MTPA
MLSM 0.60 MTPA
CPP 851 MW
Angul
SMS 2.5 MTPA
DRI 1.8 MTPA
CGP 225,000 Nm3/Hr
Plate Mill 1.2 MTPA
CPP 810 MW
Barbil
Pellet Plant
9 MTPA
Patratu
WRM 0.6 MTPA
Rebar Mill 1.0 MTPA
Oman
SMS 2.0 MTPA
HBI 1.5 MTPA
JPL
Tamnar 2800 MW
Mining
Iron Ore 3.11 MTPA
Coal Domestic
12.25 MTPA
Coal Overseas
7.20 MTPA
Operational Capacity at a Glance

Copyright @ 2014 Jindal Steel & Power Limited 14
Raigarh
3 MTPA Steel Plant
Thermal Coal 6MTPA: Gare IV / 1
Iron Ore: 3.11 MTPA Tensa Mine & Pellet from Barbil
Coking Coal: Import
Angul
2.5 MTPA Steel Plant
Thermal Coal: Either Utkal B1 / e-auction
Iron Ore: Pellet from Barbil
Coking Coal: Not Required
Barbil
9 MTPA Pellet Plant
Thermal Coal: NA
Iron Ore: External
Coking Coal: NA
Oman
2 MTPA Steel Plant
Natural Gas: MoU with Govt of Oman
Pellet: Local sources
Coking Coal: Not Required
Raw Material Sourcing - Steel

Copyright @ 2014 Jindal Steel & Power Limited 15
Tensa Orissa 3.11MT Raigarh Steel
Jeraldaburu Jharkand - Asanboni Steel
Gare IV / 1 Chhattisgarh 6.00 MT Raigarh DRI & Captive Power PlantGare IV / 2 & 3 (JPL) Chhattisgarh 6.25MT JPL Power
Utkal B 1 Orissa 5.5MT DRI at Angul & Captive Power PlantGare IV / 6 Chhattisgarh 4 MT Raigarh Steel & CPPJitpur Jharkand 2.5MT JSPL's CPP at GoddaUrtan North* M.P. 0.6 MT Raigarh Steel Amarkonda* Jharkhand - Power plant at Patratu and DumkaRamchandi (CTL)* Orissa - Coal to Liquid & CPP based on Middlings
For Existing Operations
For Future Expansion
For Existing Operations
For Future Expansion
Wollongong coal Limited, Australia
Domestic Coal
* Stay obtained from HC against De-allocation by MOC .
Overseas Coal
South Africa Under OperationMozambique Under Operation
Indonesia Under DevelopmentBotswana Under Development
Under Operation
Mine State
Annual extraction
(Approved capacity as
per mine plan)
End Use
Domestic Iron Ore
Overview of Mines

Copyright @ 2014 Jindal Steel & Power Limited 16

Copyright @ 2014 Jindal Steel & Power Limited 17
Economic Growth – Top of the Agenda (5.5% to 6% during FY14-15)
Indian Economy – Dawn of a NEW ERA (14-15)
Likely new Policy trends (1/2)
Enhanced participation and ownership of foreign companies
Increased E - Governance
Empowerment & accountability of Bureaucracy
Simplification of Tax Regime & introduction of GST
Larger role and delegation for State Government
De - Regulation of Economy

Copyright @ 2014 Jindal Steel & Power Limited 18
Indian Economy – Dawn of a NEW ERA (14-15)
Likely new Policy trends (2/2)
Dilution of “Land Bill” for Infrastructure & Housing
Speedier “Environmental & Forest Clearances”
Reduction of Subsidies
Focus on Inflation Control
Focus on Infrastructure & Manufacturing
Divestment of Public Sector
Transparency in allocation of Mines & Minerals

Copyright @ 2014 Jindal Steel & Power Limited 19
IIP

Copyright @ 2014 Jindal Steel & Power Limited 20
Index of 8 core industries grows at 7.3% in June, fastest since October last year
Electricity Sector: Latest estimates show growth at 15.7% in June, compared with 6.3% in May
Steel Sector: Growth of 4.2% in June as compared to 2% in May
Cement Sector: Grew at 13.6% in Jun against 8.7% in May
Economic Survey expects India's economy to expand by 5.4 - 5.9% this fiscal
Positive Indications

Copyright @ 2014 Jindal Steel & Power Limited 21
Copyright @ 2014 Jindal Steel & Power Limited 22
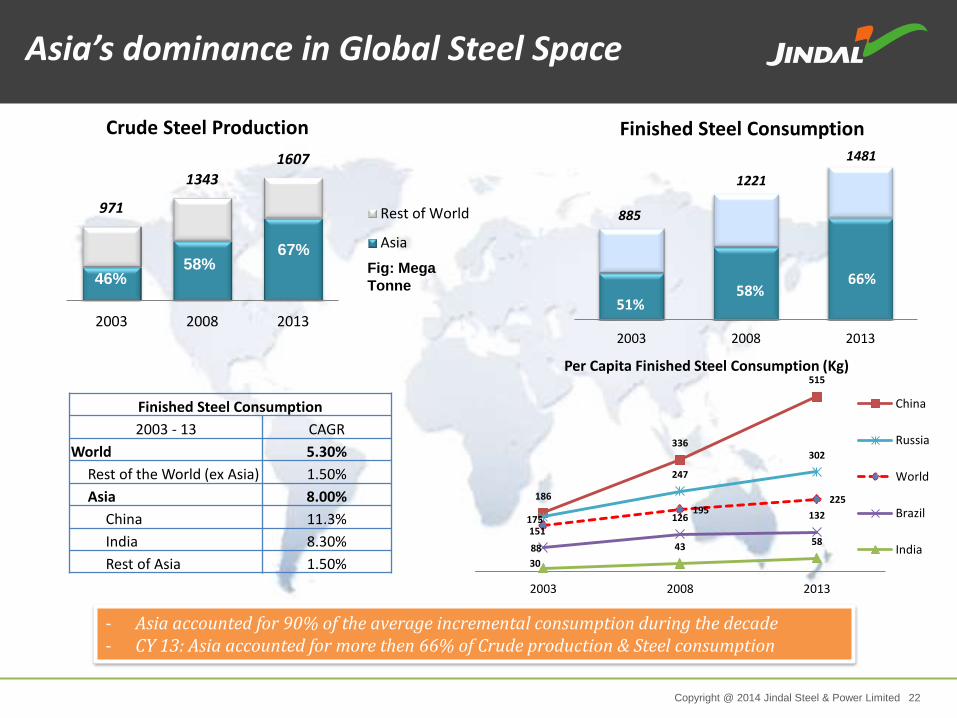
971
1343
1607
2003 2008 2013
Crude Steel Production
Rest of World
Asia67%
58% 46%
Fig: Mega
Tonne
186
336
515
175
247
302
151
195 225
88
126 132
30
43 58
2003 2008 2013
Per Capita Finished Steel Consumption (Kg)
China
Russia
World
Brazil
India
885
1221
1481
2003 2008 2013
Finished Steel Consumption
66% 58%
51%
Finished Steel Consumption
2003 - 13 CAGR
World 5.30%
Rest of the World (ex Asia) 1.50%
Asia 8.00%
China 11.3%
India 8.30%
Rest of Asia 1.50%
- Asia accounted for 90% of the average incremental consumption during the decade - CY 13: Asia accounted for more then 66% of Crude production & Steel consumption
Asia’s dominance in Global Steel Space

Copyright @ 2014 Jindal Steel & Power Limited 23
801
540
84
54.4 59
23 13 8
821
555
87
53.9 60
22 14 8
World Asia EU CIS North America South America Middle East Africa
MillionTonne
Jan - June '13 Jan - June '14
2.5%
2.9%
3.8% 1.7
% 9.3%
1.2%
1 %
2.6%
Production
Jan – June 2014 - Global Steel production

Copyright @ 2014 Jindal Steel & Power Limited 24
77
20 20
81
21 21
CY (12 Vs 13) Jan-March (13 Vs 14) April-June (13 Vs 14)
India
India: - Steel production (Jan- April’14) up by 1.6% (y-o-y) - Steel production (April- June’14) up by 1.1% (y-o-y)
5.0%
1.6% 1.1%
Production trend of Indian Steel Industry

Copyright @ 2014 Jindal Steel & Power Limited 25
April ‘14 – July ‘14: Price movement: Domestic Prices: - TMT & WR prices on
uptrend. International Prices: - ~ 9% decrease in TMT
(FOB China) - ~ 5% decrease in Wire
rod (FOB China)
440
460
480
500
520
540
560
30000
32000
34000
36000
38000
40000
42000
Jan-14 Feb-14 Mar-14 Apr-14 May-14 Jun-14 Last week Latest
Pri
ces
( R
s/M
T-B
asic
)
Price Movement : TMT & Wire Rod Domestic (Delhi-Rs/MT) Vs International ($/MT)
TMT Rebar-Delhi
Wire Rod-Delhi
TMT Rebar-FOB China
Wire Rod -FOB China
Price trend – Long products
Domestic
International
Copyright @ 2014 Jindal Steel & Power Limited 26
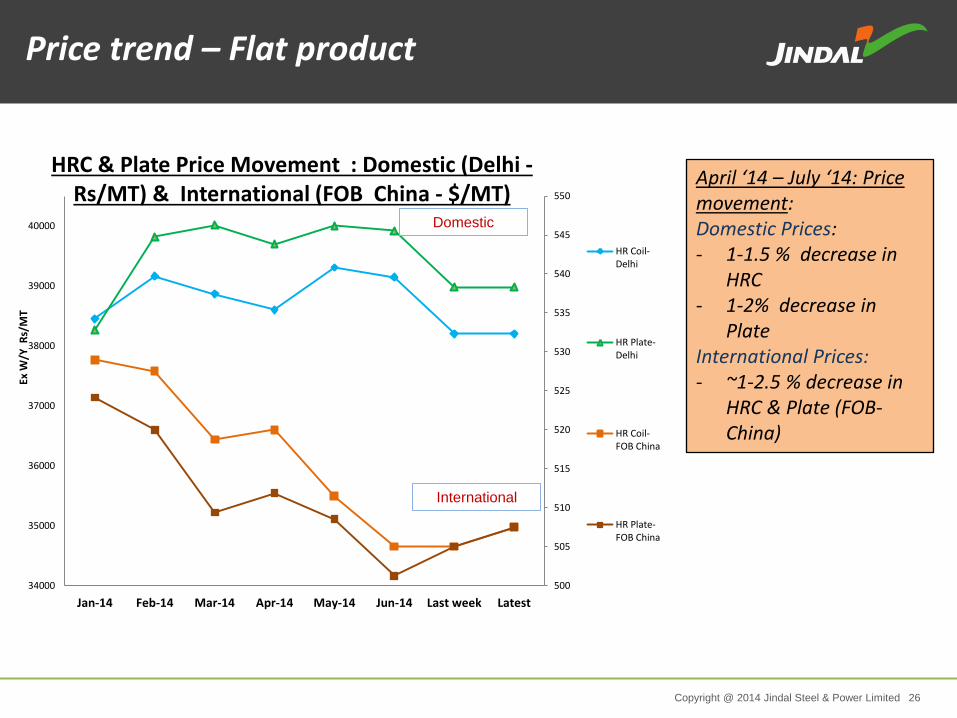
April ‘14 – July ‘14: Price movement: Domestic Prices: - 1-1.5 % decrease in
HRC - 1-2% decrease in
Plate International Prices: - ~1-2.5 % decrease in
HRC & Plate (FOB-China)
500
505
510
515
520
525
530
535
540
545
550
34000
35000
36000
37000
38000
39000
40000
Jan-14 Feb-14 Mar-14 Apr-14 May-14 Jun-14 Last week Latest
Ex W
/Y R
s/M
T
HRC & Plate Price Movement : Domestic (Delhi -Rs/MT) & International (FOB China - $/MT)
HR Coil-Delhi
HR Plate-Delhi
HR Coil-FOB China
HR Plate-FOB China
International
Domestic
Price trend – Flat product

Copyright @ 2014 Jindal Steel & Power Limited 27

Copyright @ 2014 Jindal Steel & Power Limited 28
Power Scenario – Installed Capacity
(As on 30th June 2014)
172,286
4,780
40,730 31,692
249,488
-
50,000
100,000
150,000
200,000
250,000
300,000
3,804
21,136
4,014
107
2,632
Small Hydro Wind BM/Cogen Waste to Energy Solar
(in MW)
Source: CEA
(in GW)
59.5%
9.1%
0.5%
1.9%
16.3%
12.7%
Coal Gas Diesel Nuclear Hydro RES
148 159
174
200
223
243
0
50
100
150
200
250
300
FY09 FY10 FY11 FY12 FY13 FY14
All India – Installed Capacity
Renewable Sources All India –
Installed Capacity (in MW)

Copyright @ 2014 Jindal Steel & Power Limited 29
Growth in Thermal Capacity vs PLF
Source: CEA
94 102
112
132
152
168 172 77.20% 77.50%
75.07%
73.32%
69.95% 65.55%
68.54%
50.00%
55.00%
60.00%
65.00%
70.00%
75.00%
80.00%
0
20
40
60
80
100
120
140
160
180
200
FY09 FY10 FY11 FY12 FY13 FY14 Q1FY15
Inst.Cap (in GW) PLF (in %age)

Copyright @ 2014 Jindal Steel & Power Limited 30
Effective Power Capacity
Gross Capacity (MW) Max PLF Effective Capacity @100%
availability (MW)
Thermal
1,72,286 85%
1,46,443
Hydro / Small hydro
44,534 40%
17,814
Wind
21,136 25%
5,284
Solar
2,632 15%
395
Nuclear
4,780 60%
2,868
Other Renewable
4,120 40%
1,648
Total
2,49,488
1,74,452

Copyright @ 2014 Jindal Steel & Power Limited 31
Private Sector Contribution in Generation
11 12 13 14 15 18 20 27 31 34 35
89 88 87 86 85 82 80 73 69 66 65
0%
20%
40%
60%
80%
100%133 125 113 160 149 174 200 144 224
Private Government
Source: CEA; Planning commission; Infraline; Analyst report; Company Web sites
243 249
Increasing share of private sector
In GW

Copyright @ 2014 Jindal Steel & Power Limited 32
Demand Supply scenario Q1 FY15
83 82 73
30
3
271
78 81 69
30
3
260
-5%
-1%
-6%
-1%
-8%
-4%
-9%
-8%
-7%
-6%
-5%
-4%
-3%
-2%
-1%
0%
-
50
100
150
200
250
300
Northern Western Southern Eastern North Eastern All India
Demand Supply Deficit
Power Demand Supply Position (BU)
Demand Supply gap of 10.8 billion units in 1QFY15

Copyright @ 2014 Jindal Steel & Power Limited 33
India’s per capita consumption of Electricity
631 672
717 734 779
819
884 917
0
100
200
300
400
500
600
700
800
900
1000
2005-06 2006-07 2007-08 2008-09 2009-10 2010-11 2011-12 2012-13
Annual Per Capita Consumption (Kwh)
Source: CEA

Copyright @ 2014 Jindal Steel & Power Limited 34
Comparison of Per-capita consumption
13394
10177
6452 5736
2944 2384
884
0
2000
4000
6000
8000
10000
12000
14000
16000
US Australia Russia UK China Brazil India
2011-12 Annual Per Capita Energy Consumption (kWh)

Copyright @ 2014 Jindal Steel & Power Limited 35
Country wise generation of Electricity
5362
4260
3260
1103 1088 1061
634 627 568 557
0
1000
2000
3000
4000
5000
6000
Country-wise Electricity Generation - 2013 (in TWh)

Copyright @ 2014 Jindal Steel & Power Limited 36
Power deficit states
4.8% 5.0% 5.5% 5.9% 6.2% 7.0% 8.4% 10.5%
13.4%
20.0%
24.6%
0.0%
5.0%
10.0%
15.0%
20.0%
25.0%
30.0%
4.1% 4.8% 4.9% 5.6% 5.8% 6.9% 8.1% 10.0%
12.9% 15.9%
20.0%
Source: CEA
Peak Deficit
All India Avg. 3.7%
(Apr’14 to Jun’14)
All India Avg. 4.0%
(Apr’14 to Jun’14)
Base Deficit

Copyright @ 2014 Jindal Steel & Power Limited 37
Challenges faced by Indian Power Industry
•Lack of sufficient growth in domestic coal Production • Regulatory changes in markets such as Indonesia • Shortage of gas supply
Fu
el
Ge
ne
rati
on
• Inordinate delays in environmental clearances • Tightening of norms from financial institutions
Copyright @ 2014 Jindal Steel & Power Limited 38
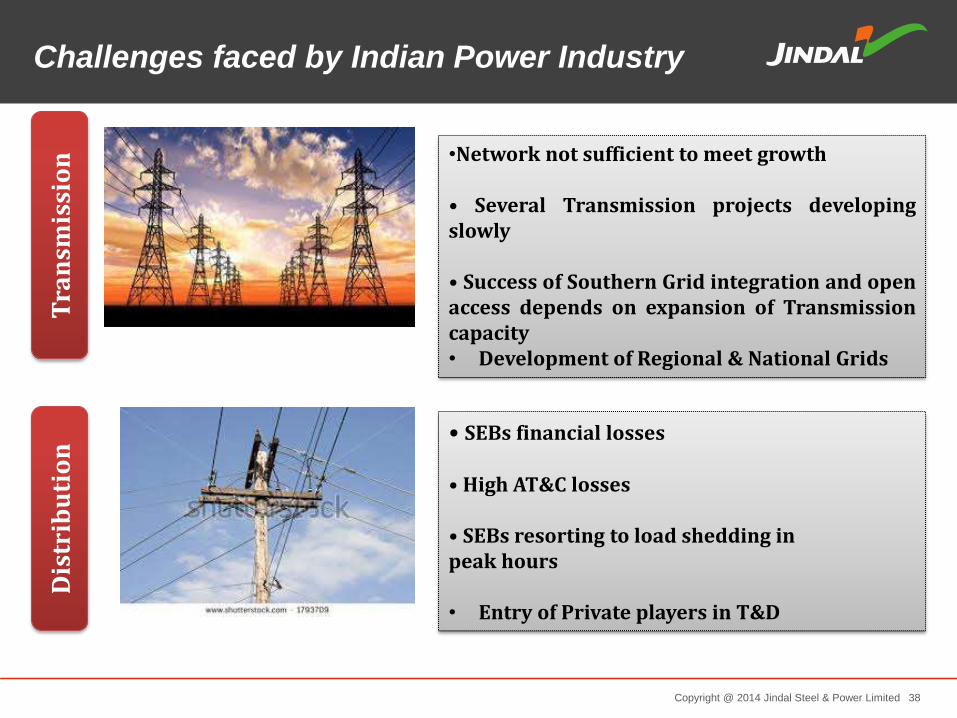
Challenges faced by Indian Power Industry
•Network not sufficient to meet growth • Several Transmission projects developing slowly • Success of Southern Grid integration and open access depends on expansion of Transmission capacity • Development of Regional & National Grids
Tra
nsm
issi
on
D
istr
ibu
tio
n • SEBs financial losses
• High AT&C losses • SEBs resorting to load shedding in peak hours • Entry of Private players in T&D

Copyright @ 2014 Jindal Steel & Power Limited 39

Copyright @ 2014 Jindal Steel & Power Limited 40
In FY14 In FY 15
5 MTPA
2800 MW
~2x
~2.8x
2 MTPA add
Steel - India 3 MTPA
Power 1000 MW
Oman 0 MTPA
Pellet 4.5 MTPA 9 MTPA ~2x
Business Achievements…
In terms of Capacity addition ..another JSPL is added to JSPL

Copyright @ 2014 Jindal Steel & Power Limited 41
12,100 Cr. 3.5 MTPA Liquid Steel 2.35 MTPA Finished Steel 851 MW 5200 Investment Capacity Steel Power Workforce
JSPL at Raigarh

Copyright @ 2014 Jindal Steel & Power Limited 42
Flow Diagram of Process in Raigarh

Copyright @ 2014 Jindal Steel & Power Limited 43
18500 Cr. + 1.5 MTPA Steel 1.2 MTPA Finished Steel 810 MW 2723 Investment Capacity Capacity Power Workforce
JSPL at Angul

Copyright @ 2014 Jindal Steel & Power Limited 44
Product usage
Ship Building Line Pipes High End Structural
Boilers Wind Mills Engineering Pressure Vessels
Coal Gasification Gas Based DRI EAF
Plates Plate Mill Slab Caster
Link Link Link
Link Link Link
Flow Diagram of Process in Angul

Copyright @ 2014 Jindal Steel & Power Limited 45
2,388Cr. 9 MTPA Pellet 660 Investment Capacity Workforce
JSPL at Barbil

Copyright @ 2014 Jindal Steel & Power Limited 46
Flow Diagram of Process in Barbil

Copyright @ 2014 Jindal Steel & Power Limited 47
Process of Pelletisation

Copyright @ 2014 Jindal Steel & Power Limited 48
1,764 Cr. 1.6 MTPA Finished Steel 1,373 Investment Capacity Workforce
JSPL at Patratu

Copyright @ 2014 Jindal Steel & Power Limited 49
Bar Mill Processing Panther TMT Rebar
WRM Processing Wire Rod
Rebar Service Centre Processing Taking Shape Cut & Bend
Flow Diagram of Process in Patratu

Copyright @ 2014 Jindal Steel & Power Limited 50
Plant Installed
Capacity (Ton)
Covered area (Sq. Mts)
Angul (Odisa)
84,000 32,000
Plant Installed
Capacity (Ton)
Covered area (Sq. Mts)
Punjipatra (Raigarh)
1,20,000 60,000
Structural Steel Division

Copyright @ 2014 Jindal Steel & Power Limited 51
At Angul
• Widest Plate Mill (5m) in India with 4th generation Heat Reversible Treat Plate Leveler
• Roll Trip-steel/Silicon Steel/DD/EDD/IF grades : opens up opportunity for new and high margin product segments.
• Further processing to address value added markets: Galvanized & Coated Steel
• Largest BF in India (4554 m3), few among the world
Investing in State-of-the-Art Technologies & manufacturing system for high margin products
New Products & Technology Initiatives

Copyright @ 2014 Jindal Steel & Power Limited 52
At Raigarh
• RUBM to be leveraged with Head Hardened Rail Facility: To cater to metro boom in Indian cities.
• Only manufacturer of high margin HH rail in India.
• Galvanizing facility of structures: Catering to high margin TLT segment.
At Patratu
• State-of-the-art Wire-Rod Mill: Forward integrated with wire-drawing
New Products & Technology Initiatives

Copyright @ 2014 Jindal Steel & Power Limited 53
At Oman • Commissioned its 2-MTPA ISP in Oman: Rode into the league of the three biggest steel
makers in the Arab peninsula. • SMS complex : EAF (200MT) largest in Middle East, a Ladle Furnace (200MT), Continuous
Billet Caster and Vacuum Degassing Furnace Facility • The new steel plant is among the most compact and advanced anywhere in the world:
commissioned from scratch in an astounding 23 months flat.
New Products & Technology Initiatives

Copyright @ 2014 Jindal Steel & Power Limited 54
• Expanding Geographical reach of Steel sales – New offices setup in South Africa, Dubai,
Indonesia
• Launch of Channel financing in retail segment and Increasing the turnover by 3 times.
• Revamping "key account managers" concept for steel business
New Initiatives

Copyright @ 2014 Jindal Steel & Power Limited 55
Fabricated Structures Hot Rolled Plates
and Coils Parallel Flange Beams
Wire Rods Power
Angles and Channels
TMT Rebars Rails
JSPL Product Range
Copyright @ 2014 Jindal Steel & Power Limited 56
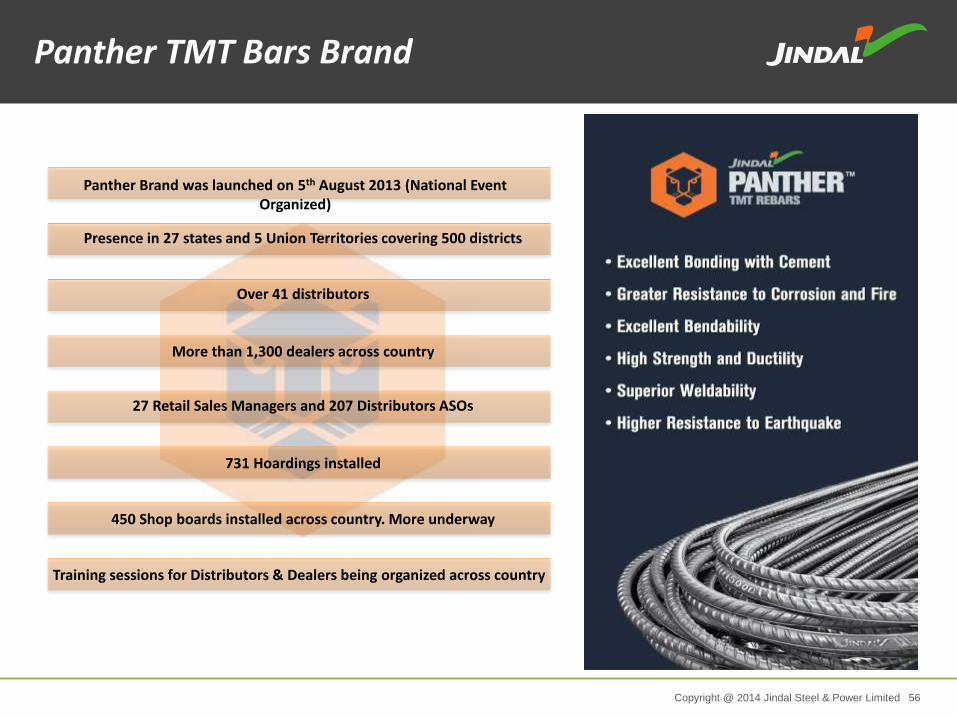
Presence in 27 states and 5 Union Territories covering 500 districts
Over 41 distributors
More than 1,300 dealers across country
27 Retail Sales Managers and 207 Distributors ASOs
731 Hoardings installed
450 Shop boards installed across country. More underway
Panther Brand was launched on 5th August 2013 (National Event Organized)
Training sessions for Distributors & Dealers being organized across country
Panther TMT Bars Brand

Copyright @ 2014 Jindal Steel & Power Limited 57
Performance Highlights – Q1 FY 2014-15

Copyright @ 2014 Jindal Steel & Power Limited 58
Finished goods Inventory Reduction by 27%
Finished Steel sales grew by 11%
Retails sales grew by 284%
Over 25% growth in Retail Dealer network from March 2014
1.24 lakh MT steel exported - increase of 6% over Q1 last year
8% growth in NSR of Steel in Q1 FY 15 vs Q1 FY 14 Captive power generation increased by 29%
Key Highlights: Q1 FY14-15
Copyright @ 2014 Jindal Steel & Power Limited 59
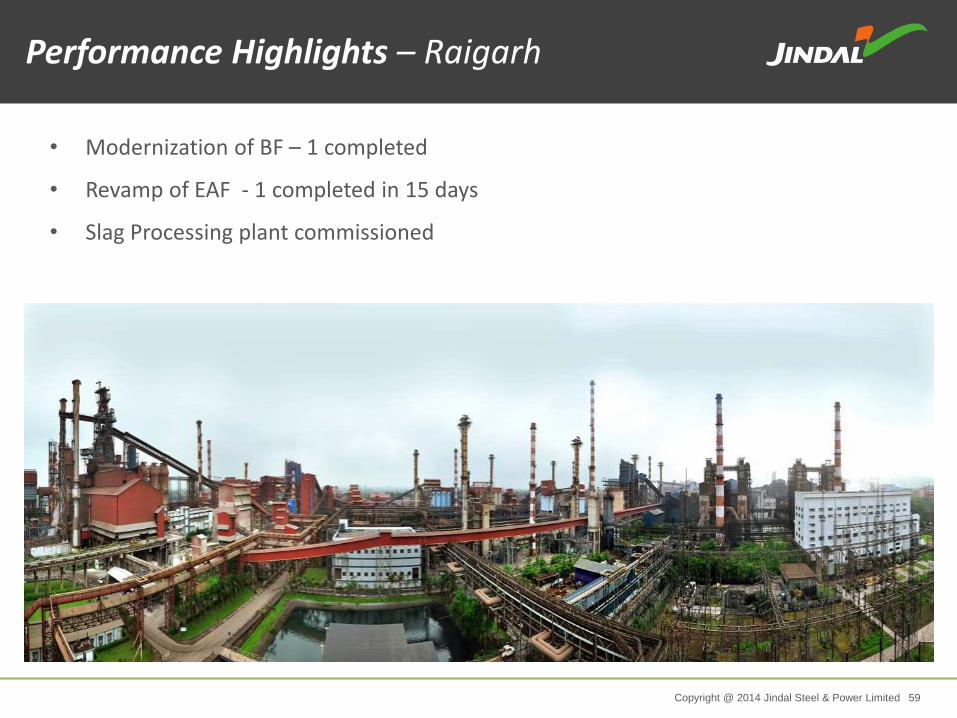
• Modernization of BF – 1 completed
• Revamp of EAF - 1 completed in 15 days
• Slag Processing plant commissioned
Performance Highlights – Raigarh

Copyright @ 2014 Jindal Steel & Power Limited 60
Investing in State-of-the-Art Technologies & manufacturing system for high margin products
• Coal Gasification plant commissioned.
• DRI plant commissioned - Production started
• Use of syn gas in Re heating furnace Plate Mill, Lime and Dolo Kilns & SMS in
place of LDO/HSD.
• Started dispatch of CGP By products in the market
Performance Highlights – Angul

Copyright @ 2014 Jindal Steel & Power Limited 61
• Jindal Shadeed commissioned its state of the art 2 MTPA Steel Melting Shop, first &
largest integrated Steel Plant in Oman, on 23rd April 2014
Performance Highlights – Oman

Copyright @ 2014 Jindal Steel & Power Limited 62
Growth in Distributor Network (from 5 – 41)
Growth in Dealer Network (from 267 to 1472)
5
15 17 20 23 25 25 30
40 41 41 41 41 41 41 41
0
20
40
Apr-13 May-13 Jun-13 Jul-13 Aug-13 Sep-13 Oct-13 Nov-13 Dec-13 Jan-14 Feb-14 Mar-14 Apr-14 May-14 Jun-14 Jul-14
267 357 495 511 532 571 653 721 759
955 1014 1128 1216 1261 1360
0
200
400
600
800
1000
1200
1400
Apr-13 May-13 Jun-13 Jul-13 Aug-13 Sep-13 Oct-13 Nov-13 Dec-13 Jan-14 Feb-14 Mar-14 Apr-14 May-14 Jun-14 Jul-14
1472
JSPL’s Retail – Network growth
Copyright @ 2014 Jindal Steel & Power Limited 63
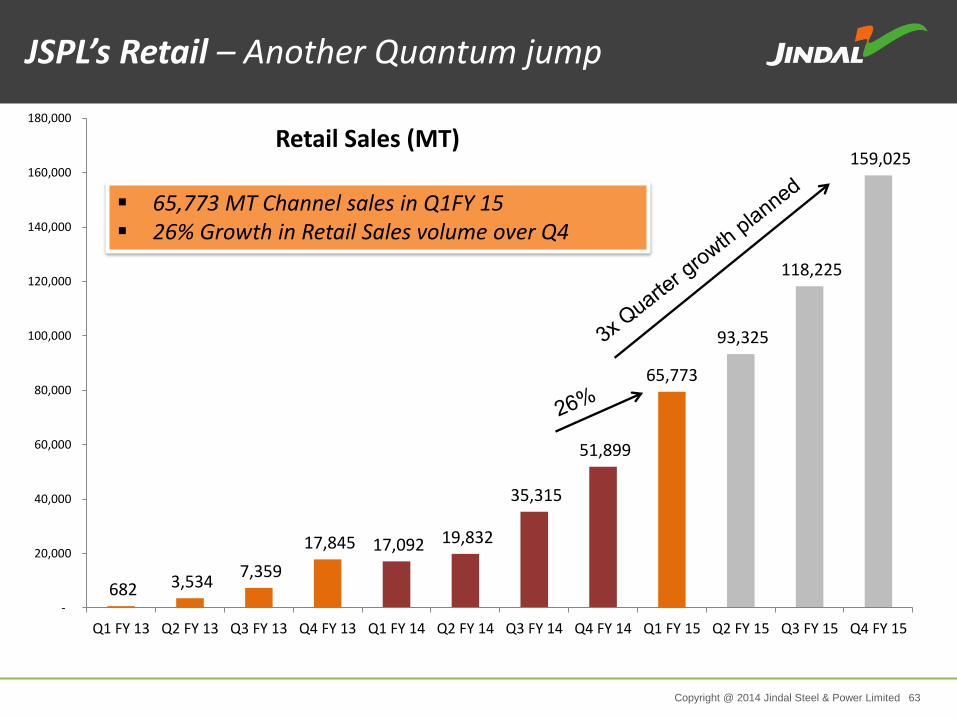
682 3,534 7,359
17,845 17,092 19,832
35,315
51,899
65,773
93,325
118,225
159,025
-
20,000
40,000
60,000
80,000
100,000
120,000
140,000
160,000
180,000
Q1 FY 13 Q2 FY 13 Q3 FY 13 Q4 FY 13 Q1 FY 14 Q2 FY 14 Q3 FY 14 Q4 FY 14 Q1 FY 15 Q2 FY 15 Q3 FY 15 Q4 FY 15
Retail Sales (MT)
65,773 MT Channel sales in Q1FY 15 26% Growth in Retail Sales volume over Q4
JSPL’s Retail – Another Quantum jump

Copyright @ 2014 Jindal Steel & Power Limited 64
19
104
140
170
119
138
150 141
124
-
20
40
60
80
100
120
140
160
180
Q1 FY 13 Q2 FY 13 Q3 FY 13 Q4 FY 13 Q1 FY 14 Q2 FY 14 Q3 FY 14 Q4 FY 14 Q1 FY 15
Export Sales (in MT) 4% growth in Export Sales in Q1 FY 15 (vs Q1 FY 14)
Focus on growth in Exports

Copyright @ 2014 Jindal Steel & Power Limited 65
89
57
13 17
10
142
79
145
147
96
63
6
18 13
143
93
128
166
-
20
40
60
80
100
120
140
160
180
200
Structural MLSM Conv Wld Beam Rail TMT Wire Rod Semis Plates
Q1 FY 14 Q1 FY 15
Growth uniform across products
Product wise Steel Sales
(volume in 000’ MT)

Copyright @ 2014 Jindal Steel & Power Limited 66 Power Plant at Tamnar
POWER

Copyright @ 2014 Jindal Steel & Power Limited 67
96.43% subsidiary of JSPL
Existing Units Phase I - 1000MW (4 X 250) Phase II - 1800MW (3 X 600)
Under Implementation 600MW (1 X 600)
JINDAL POWER LIMITED

Copyright @ 2014 Jindal Steel & Power Limited 68
Particulars Net Sales
(Cr.) PAT (Cr.)
Generation (MU)
PLF
Year 2013-14 2411 1107 8282 92%
Year 2012-13 2420 1113 7973 91%
Year 2011-12 2980 1765 8589 98%
JPL Financials

Copyright @ 2014 Jindal Steel & Power Limited 69
Quarter 1
Growth (%) 2014-15 2013-14
Turnover 702 647 9%
EBITDA 427 423 1%
EBITDA% 61% 65% -
PBT 246 406 (39%)
PBT% 35% 63% -
PAT 195 321 (39%)
PAT% 28% 50% -
Depreciation + Amortization 130 66 97%
Cash Profit 328 394 (17%)
Generation (million units) 2446 2184 12%
JPL Financials – Q1 FY 15
Copyright @ 2014 Jindal Steel & Power Limited 70
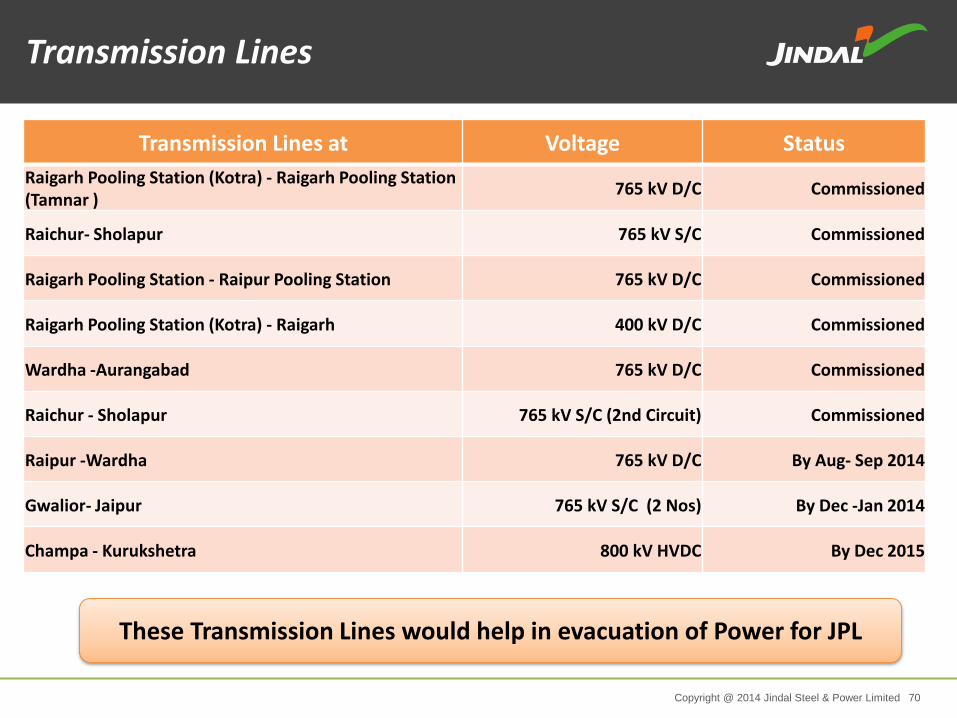
Transmission Lines at Voltage Status
Raigarh Pooling Station (Kotra) - Raigarh Pooling Station (Tamnar )
765 kV D/C Commissioned
Raichur- Sholapur 765 kV S/C Commissioned
Raigarh Pooling Station - Raipur Pooling Station 765 kV D/C Commissioned
Raigarh Pooling Station (Kotra) - Raigarh 400 kV D/C Commissioned
Wardha -Aurangabad 765 kV D/C Commissioned
Raichur - Sholapur 765 kV S/C (2nd Circuit) Commissioned
Raipur -Wardha 765 kV D/C By Aug- Sep 2014
Gwalior- Jaipur 765 kV S/C (2 Nos) By Dec -Jan 2014
Champa - Kurukshetra 800 kV HVDC By Dec 2015
These Transmission Lines would help in evacuation of Power for JPL
Transmission Lines

Copyright @ 2014 Jindal Steel & Power Limited 71 Corporate Office, Jindal Africa
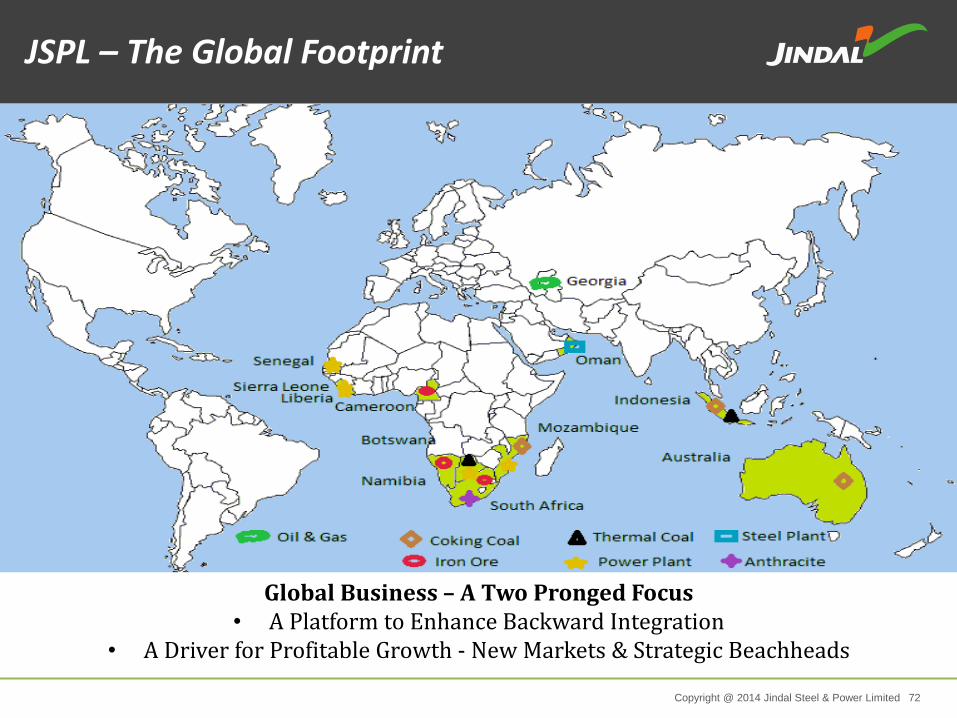
Copyright @ 2014 Jindal Steel & Power Limited 72
Global Business – A Two Pronged Focus • A Platform to Enhance Backward Integration
• A Driver for Profitable Growth - New Markets & Strategic Beachheads
JSPL – The Global Footprint

Copyright @ 2014 Jindal Steel & Power Limited 73
Developing a coal mine
(3 MTPA) in
Mozambique’s coal-rich
Moatize region
Coal resources
estimated at 1.2 bn
tonnes including coking
coal
Mozambique, Africa
JSPL’s Kiepersol Colliery produces about 1.2
MTPA of Anthracite coal, sold domestically and
internationally Plans to ramp up capacity to 2
MTPA
South Africa, Africa
Botswana, Africa Acquired CIC Energy in 2012 for 120 mn USD
Coal Mine with Resource of over 3 bn MT (high
grade thermal coal)
Proposed Cement Plant
Madagascar, Africa
Acquired 74.39% controlling
stake in Wollongong Coal
(Erstwhile Gujarat NRE coking
coal Limited)
Australia
1.5 MT HBI Plant – plan to make
it an Integrated Steel Plant
Shadeed, Oman Medium to large size
deposits of prime hard
coking and low ash – low
sulphur thermal coal for
open-cast operation
Indonesia, Asia
Summary of International Operations

Copyright @ 2014 Jindal Steel & Power Limited 74
Production HBI (MT): 353,727 Sales (MT): 312,046 Sales (Million USD): 111 EBITDA (million USD): 22
OMAN
Production (MT): 69,914 Sales (MT): 59,166 Sales (Million USD): 6 EBITDA (million USD): (1)
SOUTH AFRICA
Production (MT): 111,565 Sales (MT): 99,616 Sales (Million USD): 7.5 EBITDA (million USD): (5)
MOZAMBIQUE
Production (MT): 42,145 Sales (MT): 85,636 Sales (Million USD): 15 EBITDA (million USD): 3
Wollongong Coal Ltd
Global Ventures - Production & Sales – Q1 FY 14-15

Copyright @ 2014 Jindal Steel & Power Limited 75
In July 2010, JSPL acquired Shadeed Iron & Steel Co. LLC, a company incorporated under
the laws of the Sultanate of Oman
• Gas-based 1.5 MTPA HBI plant at Sohar Industrial Port commenced production in January 2011
• Commissioned steelmaking facility of 2 MTPA in CY14
Investment
US$ 525 mn
Capacity
2 MTPA Steel
Jindal Shadeed – Oman

Copyright @ 2014 Jindal Steel & Power Limited 76
• Potential Resource: 2 bn MT
• Grade: Semi Hard coking coal , High Grade Thermal Coal
• Current Mining @ 3 MTPA run rate
• 3 MTPA Coal Washery commissioned
Mozambique, Africa

Copyright @ 2014 Jindal Steel & Power Limited 77
Mining Operations taken over with effect from 1st July 2014
Reverse Freight Contract finalized for carrying 3,00,000 Tonnes of cargo from Beira to Moatize
Floatation Plant to be commissioned in August, 14 which would reduce ash content in Coking coal
Mozambique - Key Operational Highlights

Copyright @ 2014 Jindal Steel & Power Limited 78
Unique unmatched location with significant strategic advantages
Unique Geographic Location • Wollongong (80 kms. South of
Sydney) experienced mining community
available • Port Kembla: < 20 kms. with
sufficient coal handling and Cape size capacity
• Easy and reliable connectivity through Rail and Road
Activities :
Manpower reduced from 590 to 241
Restructuring of Bank Loans
Arrangement made with most of the suppliers for their past liabilities though phased payment plans(About A$ 24 million paid out of A$ 41 million)
Wollongong Coal Limited- Australia

Copyright @ 2014 Jindal Steel & Power Limited 79
• Southern Africa head office is based in Johannesburg, South Africa
• Operations include Kiepersol Colliery outside the town of Piet Retief in Mpumalanga province
• The mine produces high-quality anthracite coal, sold nationally and internationally
• Underground mining with 1.2 MTPA capacity annually
South Africa, Africa

Copyright @ 2014 Jindal Steel & Power Limited 80
Thermal Coal Asset
• Large size deposit of low ash – low sulphur thermal coal for open cast operation
• Coal mining license obtained in 2009 for 10 years till March 2018 for over 35.9 square Kilometres
• Permit received from the Ministry of Forest for the entire concession area
• MoU signed with Bupati Barito to develop road for coal hauling
• 139 hectares acquired for the first phase of mining
• Acquired 17.7 hectares for the development of captive coal terminal for coal handling and
barge loading at Barito River
Coking Coal Asset
Exploration License over 100 square kilometre in Central Kalimantan
Medium to large size deposits of prime hard coking and thermal coal for open-cast operation Pit Sampling
Indonesia, Asia

Copyright @ 2014 Jindal Steel & Power Limited 81
Financial Performance

Copyright @ 2014 Jindal Steel & Power Limited 82
Consolidated Financials at a Glance
(Rupees in Crores) FY04 FY05 FY06 FY07 FY08 FY09 FY10 FY11 FY12 FY13 FY14 Q1 FY 15
INCOME STATEMENT
Revenue 1,273 2,271 2,618 3,549 5,539 10,913 11,152 13,194 18,351 19,807 20,004 4,870
EBITDA 512 908 1,034 1,428 2,253 5,908 5,232 6,398 6,935 6,669 5,776 1,626
PAT 305 516 573 703 1,251 3,007 3,635 3,804 4,002 2,912 1,894 402
Cash Profit 434 766 858 1,170 1,810 4,194 4,760 5,115 5,575 4,593 3,876 1,149
BALANCE SHEET
Gross Block 1,967 2,876 5,198 8,690 10,680 14,928 21,109 29,317 35,802 45,912 63,056 65,181
Net Worth 854 1,317 1,899 2,540 3,824 7,021 10,387 14,088 17,931 21,150 21,191 21,564
Borrowings 1,026 1,495 2,745 3,507 6,996 8,113 8,605 13,987 17,058 24,618 36,368 37,111
Equity 15 15 15 15 15 15 93 93 93 93.48 91.49 91.49
SIGNIFICANT RATIOS
Operating Margin (%) 40% 40% 40% 41% 41% 48% 53% 49% 39% 34% 28% 33%
Net Profit to Sales (%) 24% 23% 22% 20% 23% 28% 33% 29% 22% 15% 9% 8%
Return on Net Worth (%) 36% 39% 31% 28% 34% 43% 35% 27% 22% 14% 9% 7%
Long Term Debt Equity Ratio 1.09 1.11 1.2 1.07 1.74 1.03 0.59 0.7 0.61 0.77 1.29 1.3
EPS (INR/Share) (a) (b) 3.34 5.58 6.31 7.64 13.54 32.44 39.05 40.75 42.42 31.13 20.53 3.35

Copyright @ 2014 Jindal Steel & Power Limited 83
854 1,317 1,899 2,540 3,824
7,021
10,387
14,088
17,931
21,150 21,191
-
5,000
10,000
15,000
20,000
25,000
FY04 FY05 FY06 FY07 FY08 FY09 FY10 FY11 FY12 FY13 FY14
Net Worth
Net worth zooms by 2381% in 10 Years
Net Worth
Rs. In Cr.

Copyright @ 2014 Jindal Steel & Power Limited 84
Capacity Enhancement
1,967 2,876 5,1988,690 10,680
14,928
21,109
29,317
35,802
45,912
63,056
-
10,000
20,000
30,000
40,000
50,000
60,000
70,000
FY04 FY05 FY06 FY07 FY08 FY09 FY10 FY11 FY12 FY13 FY14
Gross Block
Gross Block
Rs. In Cr.

Copyright @ 2014 Jindal Steel & Power Limited 85
1,2732,271 2,618
3,549
5,539
10,913 11,152
13,194
18,35119,807 20,004
0
5,000
10,000
15,000
20,000
25,000
FY04 FY05 FY06 FY07 FY08 FY09 FY10 FY11 FY12 FY13 FY14
Revenue Increased around 15 times over the last 10 years
Revenue
Rs. In Cr.

Copyright @ 2014 Jindal Steel & Power Limited 86
512908 1,034
1,428
2,253
5,908
5,232
6,398
6,9356,669
5,776
0
1,000
2,000
3,000
4,000
5,000
6,000
7,000
8,000
FY04 FY05 FY06 FY07 FY08 FY09 FY10 FY11 FY12 FY13 FY14
Healthy EBITDA margin continues year after year
EBITDA
Rs. In Cr.

Copyright @ 2014 Jindal Steel & Power Limited 87
Financial Results Q1- FY15 – Consolidated
Interest, 268
Depreciation , 422
PBT, 669
PAT, 501
EBITDA, 1,305
Interest, 535
Depreciation , 667
PBT, 517
PAT, 402
EBITDA, 1,626
Q1 FY14 Q1 FY15
Increased Interest & Depreciation cost drops profit
EBITDA continues to Rise

Copyright @ 2014 Jindal Steel & Power Limited 88
Financial Results – Standalone Q1 FY15
Particulars (Rupees in Crores) For the Quarter ending %
30.06.2014 31.03.2014 30.06.2013 Y ON Y Q ON Q
Turnover-Total 3,584 3,813 3,425 4.6% -6.0%
EBITDA 1,192 972 848 40.6% 22.7%
Depreciation 415 316 304 36.8% 31.6%
Finance costs 428 405 232 84.8% 5.8%
PBT 370 385 319 16.2% -3.9%
Profit after Tax 306 431 239 28.2% -28.9%
Cash Profit 786 777 555 41.4% 1.1%
CAPEX 720 1,101 1,228

Copyright @ 2014 Jindal Steel & Power Limited 89
Ratio (%) 2014-15 2013-14 2013-14 2013-14
Q1 Q4 Q1 Annual
Raw Material to turnover 26.7 31.6 34.8 32.5
EBITDA to turnover 33.3 25.5 24.7 27.6
Profit before tax to turnover 10.3 10.1 9.3 11.0
Profit after tax to turnover 8.5 11.3 7.0 8.9
Debt Equity Ratio 1.8 1.8 1.6 1.8
Current Ratio 0.7 0.9 1.0 0.9
Interest Service Coverage Ratio 2.1 2.2 2.4 2.2
Debt Service Coverage Ratio 1.2 1.3 1.8 1.3
Financial Ratios – Standalone Q1 FY15

Copyright @ 2014 Jindal Steel & Power Limited 90
30.06.2014 31.03.2014 30.06.2013 Y ON Y Q ON Q
Turnover-Total 4,978 5,267 4,540 9.6% -5.5%
EBITDA 1,626 1,314 1,305 24.6% 23.8%
Depreciation 667 514 422 58.2% 29.8%
Finance costs 535 423 268 100.1% 26.5%
PBT 517 396 669 -22.8% 30.4%
Profit after Tax 402 378 501 -19.8% 6.2%
Cash Profit 1,149 947 929 23.7% 21.3%
CAPEX 2,172 2,832 2,568
Particulars (Rupees in Crores)For the Quarter ending %
Financial Results – Consolidated Q1 FY15
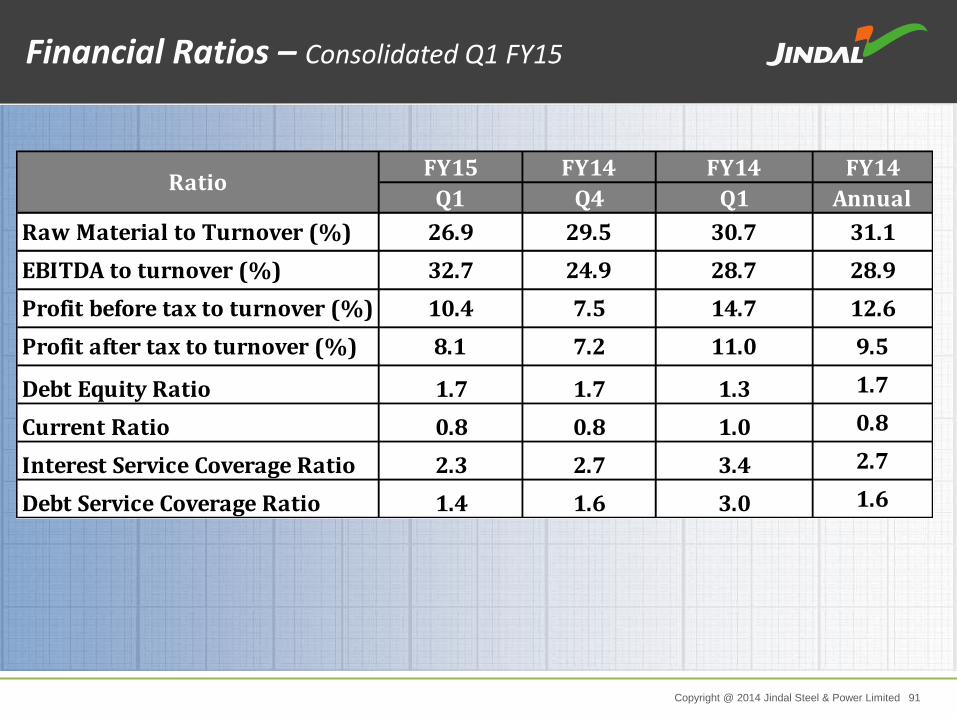
Copyright @ 2014 Jindal Steel & Power Limited 91
FY15 FY14 FY14 FY14
Q1 Q4 Q1 Annual
Raw Material to Turnover (%) 26.9 29.5 30.7 31.1
EBITDA to turnover (%) 32.7 24.9 28.7 28.9
Profit before tax to turnover (%) 10.4 7.5 14.7 12.6
Profit after tax to turnover (%) 8.1 7.2 11.0 9.5
Debt Equity Ratio 1.7 1.7 1.3 1.7
Current Ratio 0.8 0.8 1.0 0.8
Interest Service Coverage Ratio 2.3 2.7 3.4 2.7
Debt Service Coverage Ratio 1.4 1.6 3.0 1.6
Ratio
Financial Ratios – Consolidated Q1 FY15

Copyright @ 2014 Jindal Steel & Power Limited 92
Way Forward

Copyright @ 2014 Jindal Steel & Power Limited 93
Commission the balance one
unit of 600 MW at Tamnar in H2 of FY 15
Target “Break - Even” performance in Mozambique by
FY 15
Stabilize production from CGP and DRI in
Angul.
To target 15% to 20% of total
revenue from exports
To bring down Net
Debt/EBITDA
< 4X
Going Forward: Prime Focus in FY15

Copyright @ 2014 Jindal Steel & Power Limited 94
Making Sustainability a Focus Priority

Copyright @ 2014 Jindal Steel & Power Limited 95
9 PILLARS OF CSR
A Responsible Corporate Citizen

Copyright @ 2014 Jindal Steel & Power Limited 96
A Responsible Corporate Citizen

Copyright @ 2014 Jindal Steel & Power Limited 97
2014 Shrishti Global Award -2014 Global HR Excellence Award-2014
2013 International Safety Award with merit 2014 by British Safety Council, UK. World CSR Congress Award 2013 Greentech CSR Award 2013
2012 Golden Peacock National CSR Award 2012
2011
Ranked No.1 as Wealth Creator in India over a 10- year period (Business World)
Awarded the Dun & Bradstreet- Rolta Corporate Awards 2011
Ranked 3rd in the Metals Category of Business World’s India’s Most Respected Companies Survey
Received the Forbes Asia’s ‘Fabulous 50’ International Award
Golden Peacock Innovation Management Awards
Greentech Award for 1st Position in Metal & Mining Industries
World HRD Congress CSR Award on women empowerment
2010
Rated the World’s 2nd Largest Value Creator by Boston Consulting Group (BCG), based on Total Shareholder Return from 2005-2009, and the largest Value Creator in Mining and Materials category
Received the Forbes Asia’s ‘Fabulous 50’ International Award
Golden Peacock Innovation Management Awards
CSR Excellence Award 2010 by ASSOCHAM for promoting and propagating Corporate Social Responsibility initiatives
2009
Received the CNBC’s Most Promising Entrant into the Big League at IBLA
National Energy Conservation Award
Golden Peacock Innovation Award 2009
Winner of ‘Shrishti Green Cube Award 2009
SAIL HR Excellence Award 2009
Award and Accolades

Copyright @ 2014 Jindal Steel & Power Limited 98
SAFETY INDUCTION ON-THE-JOB SAFETY TRAINING
SAFETY REVIEWS SAFETY AUDITS / INSPECTIONS
Health & Safety Best Practices

Copyright @ 2014 Jindal Steel & Power Limited 99
TOOL BOX MEETINGS SAFETY AWARDS/REWARDS
MEDICAL EXAMINATIONS/ WORLD CLASS PPEs MOCK DRILLS
Health & Safety Best Practices
Copyright @ 2014 Jindal Steel & Power Limited 100

Copyright @ 2014 Jindal Steel & Power Limited 101
Raigarh Blast Furnace - I

Copyright @ 2014 Jindal Steel & Power Limited 102
Angul - Coal Gasification Plant

Copyright @ 2014 Jindal Steel & Power Limited 103
Angul - DRI

Copyright @ 2014 Jindal Steel & Power Limited 104
Angul – Steel Melting Shop (SMS)

Copyright @ 2014 Jindal Steel & Power Limited 105
Angul – Plate Mill

Copyright @ 2014 Jindal Steel & Power Limited 106
Angul – 6 x 135 MW Captive Power Plant

Copyright @ 2014 Jindal Steel & Power Limited 107
Angul – 6 x 135 MW Captive Power Plant

Copyright @ 2014 Jindal Steel & Power Limited 108
SMS - Jindal Shadeed, Oman

Copyright @ 2014 Jindal Steel & Power Limited 109
Jindal Shadeed, Oman

Copyright @ 2014 Jindal Steel & Power Limited 110
Rolling Mill Under Construction : Jindal Shadeed,
Oman

Copyright @ 2014 Jindal Steel & Power Limited 111
Barbil Pellet Plant

Copyright @ 2014 Jindal Steel & Power Limited 112
Marketing Network

Copyright @ 2014 Jindal Steel & Power Limited 113
D.Balasubramanyam Head of Investor Relations Tel: 011-26739109, Mobile: 8130755166 Email: [email protected]
Ms. Pallavi Kumari Investor Relations Tel: 011-26739165, Mobile: 8800094171 Email: [email protected]
For any information please contact : -

Copyright @ 2014 Jindal Steel & Power Limited 114
Thank You