Embed Size (px)
Citation preview
Copyright © 2010 Jindal Steel & Power Ltd.
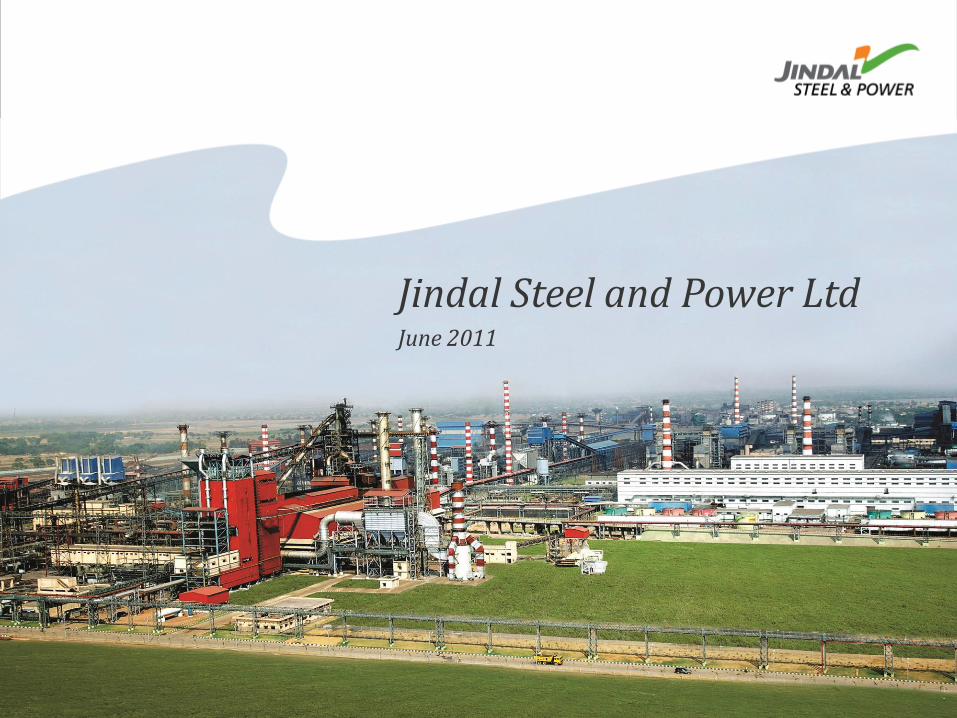
Jindal Steel and Power LtdJune 2011
Disclaimer
Certain statements in the presentations and, if applicable, the subsequent question and answer session and
discussions concerning our future growth prospects, are forward looking statements which involve a number of risks,
uncertainties and other factors that may cause our actual results, performance or achievements to differ materially
from future results, performance or achievements expressed or implied by such forward-looking statements. The
risks and uncertainties relating to these statements include, but are not limited to, general political, social and
economic conditions in India, Bolivia, and elsewhere, accidents, natural disasters or outbreaks of disease,
government policies regarding the steel ,power and diamond industry(ies), including industrial licensing,
environmental regulations, safety regulations, import restrictions and duties, excise duties and sales taxes, our
ability to successfully implement our strategy, our growth and expansion plans and technological changes,
increasing competition in, and the conditions of the global and Indian steel , power and diamond industry, changes
in laws and regulations that apply to the Indian and global steel, power and diamond industry, significant
movements in the prices of key materials, terms on which we finance our working capital and capital and product
requirements affecting our company and our industry and other development expenditure requirements, general
economic conditions factors beyond our control.
2
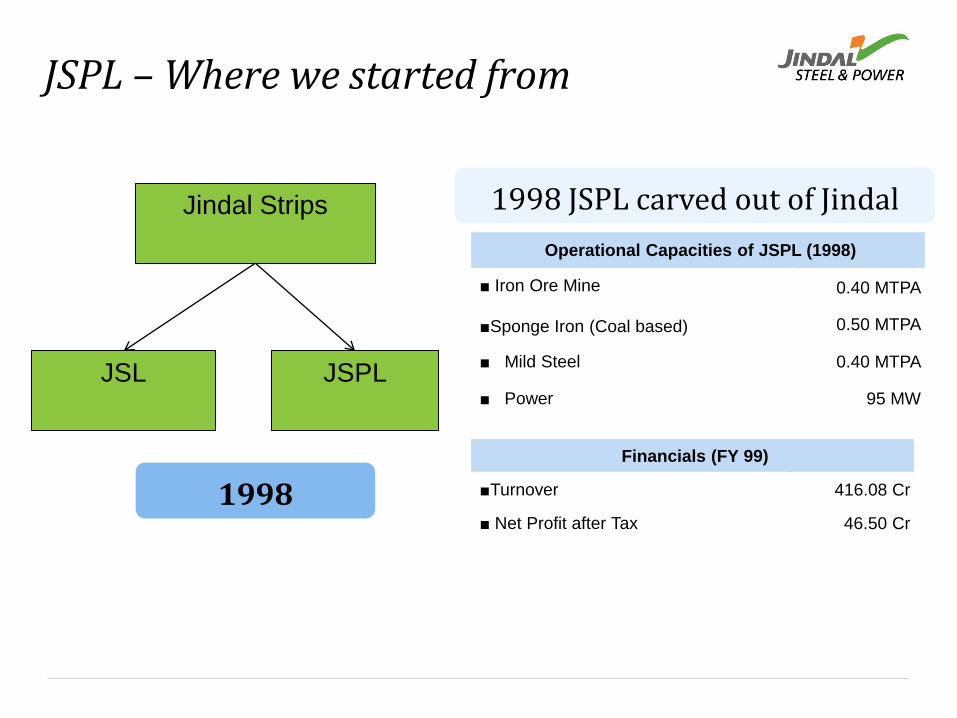
JSPL – Where we started from
1998 JSPL carved out of Jindal
Strips
1998
Financials (FY 99)
■Turnover 416.08 Cr
■ Net Profit after Tax 46.50 Cr
Jindal Strips
JSL JSPL
Operational Capacities of JSPL (1998)
■ Iron Ore Mine
■Sponge Iron (Coal based)
0.40 MTPA
0.50 MTPA
■ Mild Steel 0.40 MTPA
■ Power 95 MW
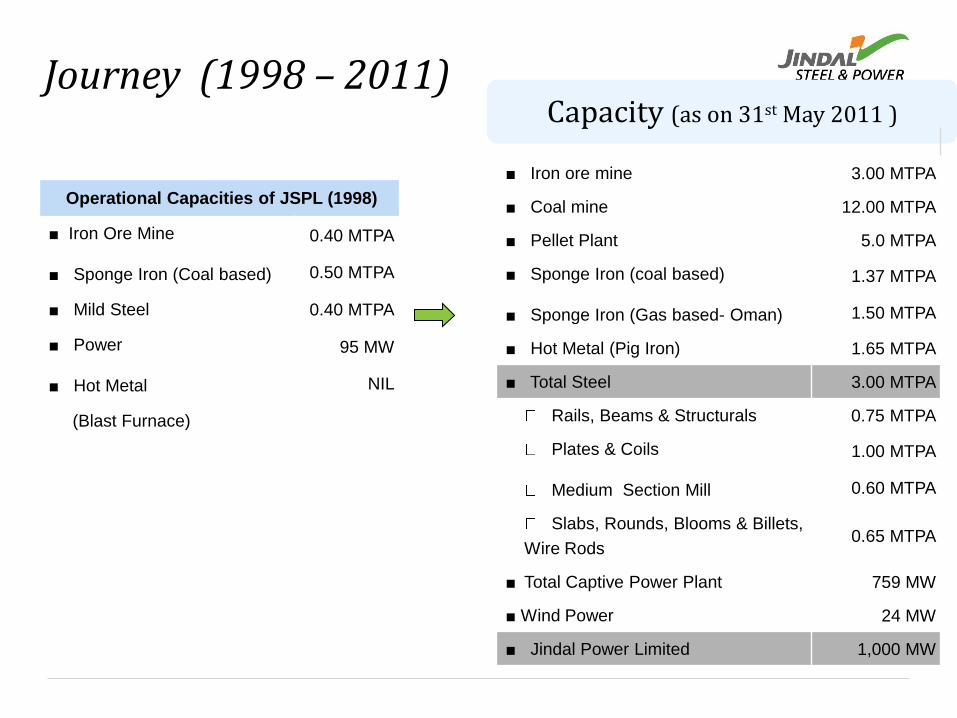
Journey (1998 – 2011)Capacity (as on 31st May 2011 )
Operational Capacities of JSPL (1998)
■ Iron Ore Mine
■ Sponge Iron (Coal based)
0.40 MTPA
0.50 MTPA
■ Mild Steel 0.40 MTPA
■ Power
■ Hot Metal
95 MW
NIL
(Blast Furnace)
■ Iron ore mine 3.00 MTPA
■ Coal mine 12.00 MTPA
■ Pellet Plant 5.0 MTPA
■ Sponge Iron (coal based)
■ Sponge Iron (Gas based- Oman)
1.37 MTPA
1.50 MTPA
■ Hot Metal (Pig Iron) 1.65 MTPA
■ Total Steel 3.00 MTPA
Rails, Beams & Structurals 0.75 MTPA
Plates & Coils
Medium Section Mill
1.00 MTPA
0.60 MTPA
Slabs, Rounds, Blooms & Billets,
Wire Rods0.65 MTPA
■ Total Captive Power Plant 759 MW
■ Wind Power 24 MW
■ Jindal Power Limited 1,000 MW
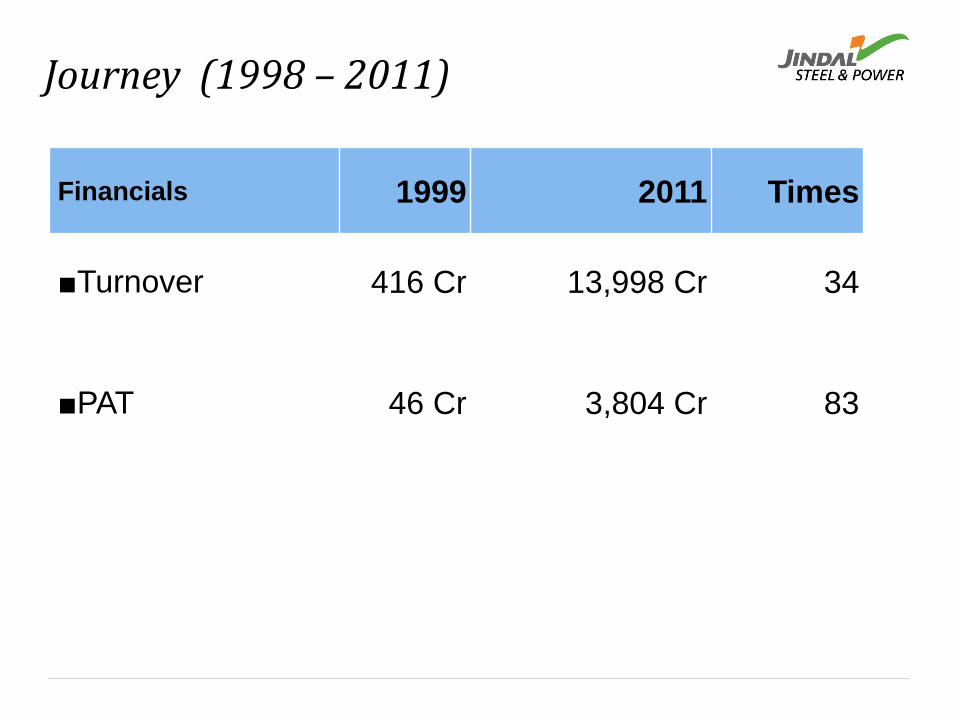
Journey (1998 – 2011)
Financials 1999 2011 Times
■Turnover 416 Cr 13,998 Cr 34
■PAT 46 Cr 3,804 Cr 83
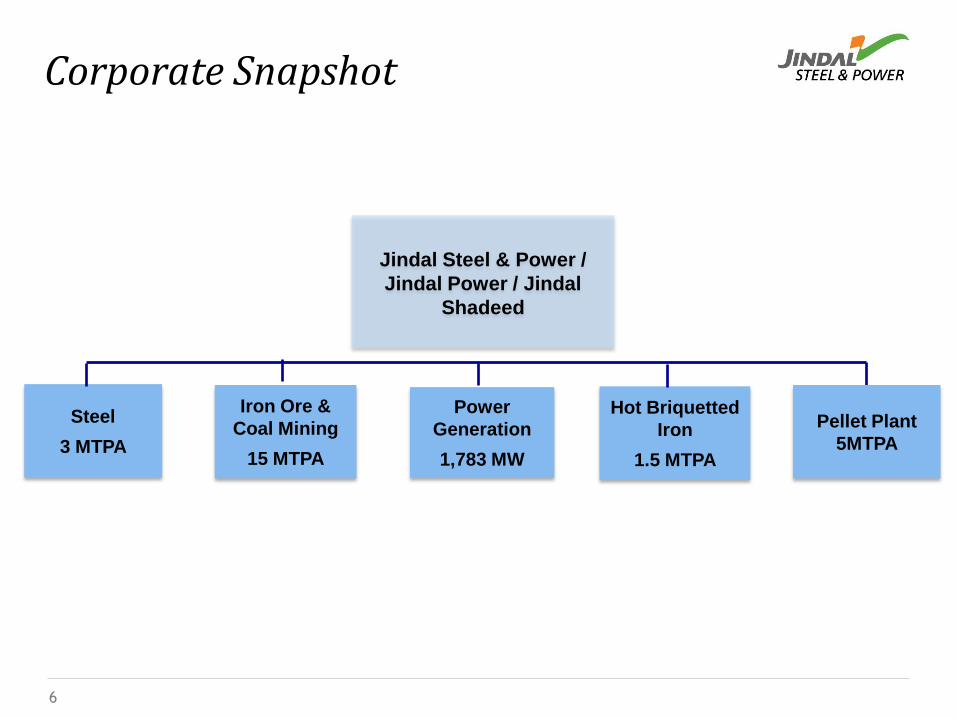
Jindal Steel & Power /
Jindal Power / Jindal
Shadeed
Steel
3 MTPA
Power
Generation
1,783 MW
Pellet Plant
5MTPA
Iron Ore &
Coal Mining
15 MTPA
Hot Briquetted
Iron
1.5 MTPA
Corporate Snapshot
6
7
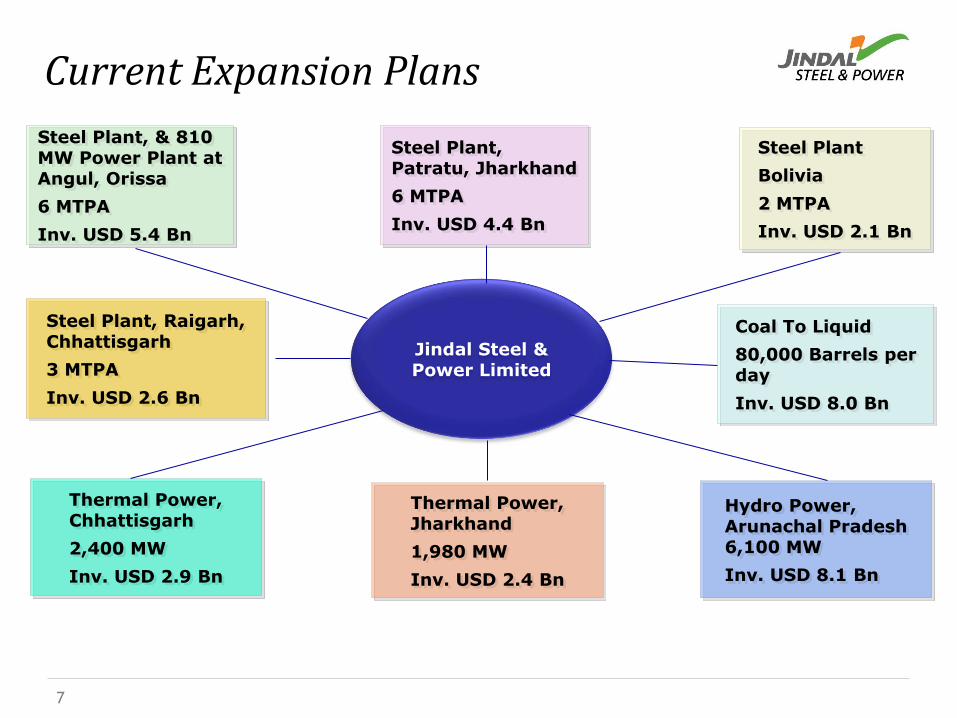
Jindal Steel & Power Limited
Steel Plant, & 810 MW Power Plant at Angul, Orissa
6 MTPA
Inv. USD 5.4 Bn
Steel Plant, Patratu, Jharkhand
6 MTPA
Inv. USD 4.4 Bn
Steel Plant
Bolivia
2 MTPA
Inv. USD 2.1 Bn
Thermal Power, Chhattisgarh
2,400 MW
Inv. USD 2.9 Bn
Thermal Power, Jharkhand
1,980 MW
Inv. USD 2.4 Bn
Hydro Power, Arunachal Pradesh 6,100 MW
Inv. USD 8.1 Bn
Steel Plant, Raigarh, Chhattisgarh
3 MTPA
Inv. USD 2.6 Bn
Coal To Liquid
80,000 Barrels per day
Inv. USD 8.0 Bn
Current Expansion Plans
Steel business overview
Power business overview
Financial overview
Growth drivers
Sustainability Initiatives
8
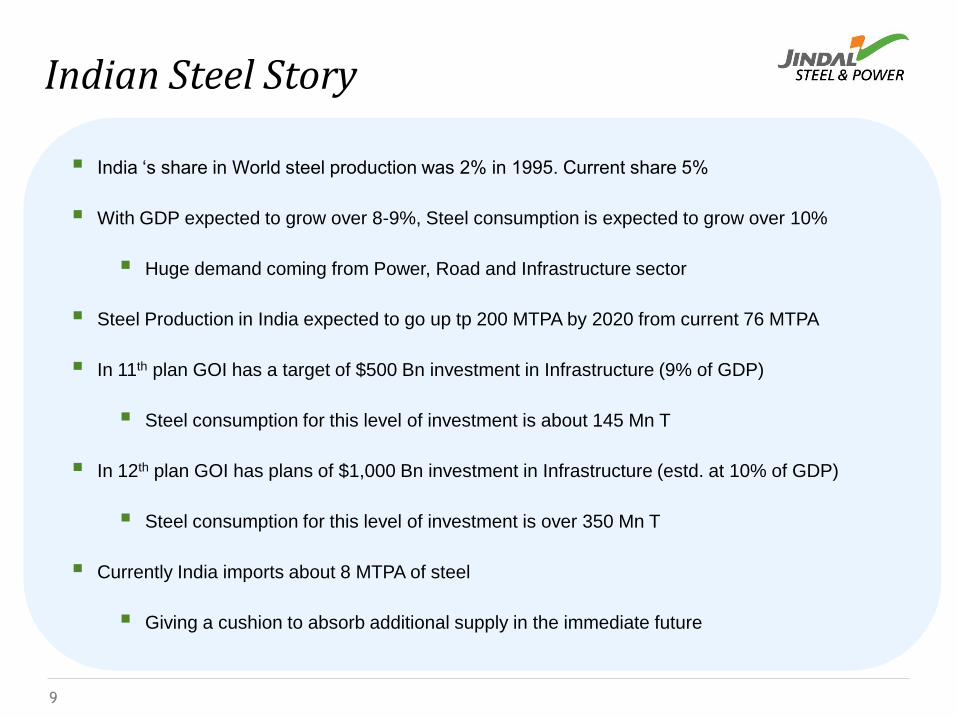
Indian Steel Story
India „s share in World steel production was 2% in 1995. Current share 5%
With GDP expected to grow over 8-9%, Steel consumption is expected to grow over 10%
Huge demand coming from Power, Road and Infrastructure sector
Steel Production in India expected to go up tp 200 MTPA by 2020 from current 76 MTPA
In 11th plan GOI has a target of $500 Bn investment in Infrastructure (9% of GDP)
Steel consumption for this level of investment is about 145 Mn T
In 12th plan GOI has plans of $1,000 Bn investment in Infrastructure (estd. at 10% of GDP)
Steel consumption for this level of investment is over 350 Mn T
Currently India imports about 8 MTPA of steel
Giving a cushion to absorb additional supply in the immediate future
9
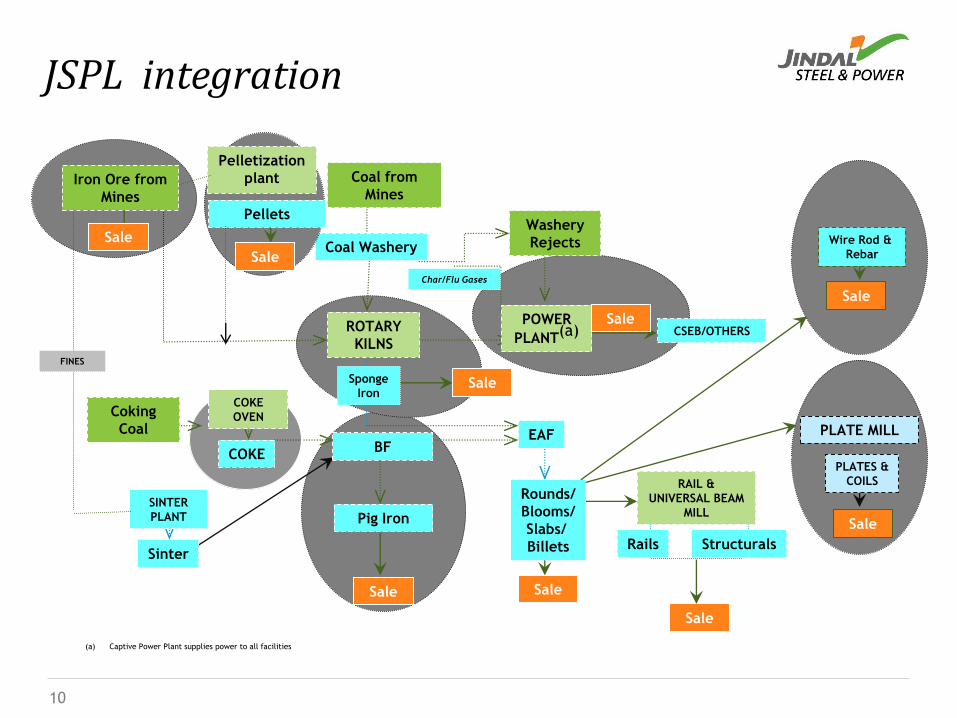
(a) Captive Power Plant supplies power to all facilities
JSPL integration
Sale
FINES
Iron Ore from
Mines
Coal from
Mines
Coal Washery
BF
Coking
Coal
Pig Iron
POWER
PLANT(a) CSEB/OTHERS
EAF
RAIL &
UNIVERSAL BEAM
MILL
ROTARY
KILNS
Rails Structurals
Washery
Rejects
Sponge
Iron
Char/Flu Gases
Rounds/
Blooms/
Slabs/
Billets
Sale
Sale
Sale
Sale
Sale
SINTER
PLANT
PLATE MILL
PLATES &
COILS
Sinter
COKE
OVEN
COKE
Sale
Wire Rod &
Rebar
Pellets
Sale
Pelletization
plant
Sale
10
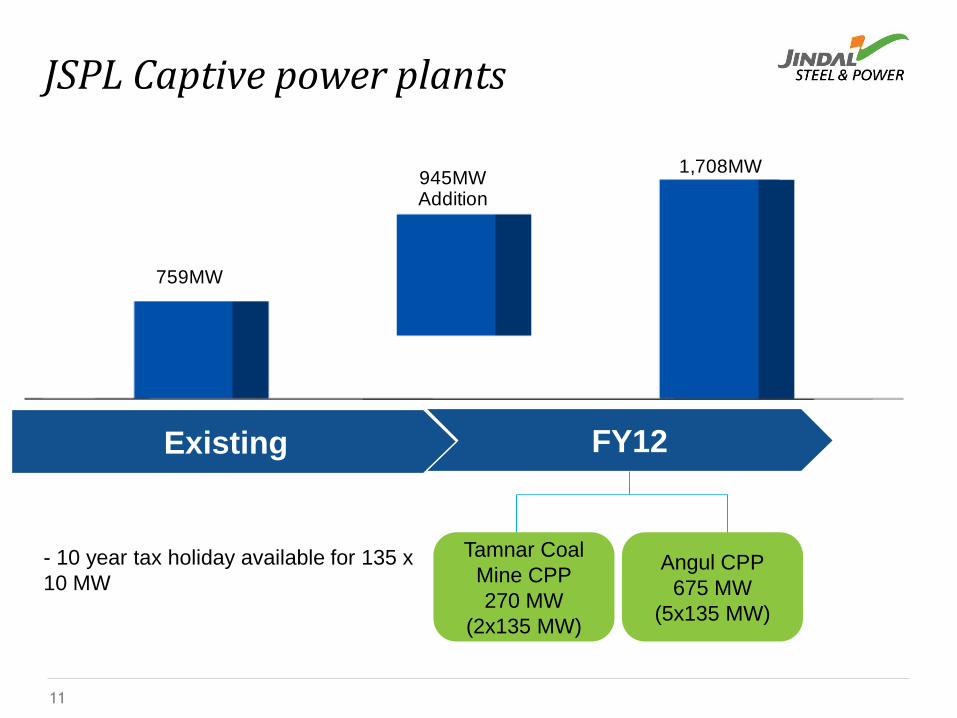
JSPL Captive power plants
759MW
945MWAddition
1,708MW
FY12
Angul CPP
675 MW
(5x135 MW)
Existing
11
Tamnar Coal
Mine CPP
270 MW
(2x135 MW)
- 10 year tax holiday available for 135 x
10 MW
Steel business overview
Power business overview
Financial overview
Growth drivers
Sustainability Initiatives
12
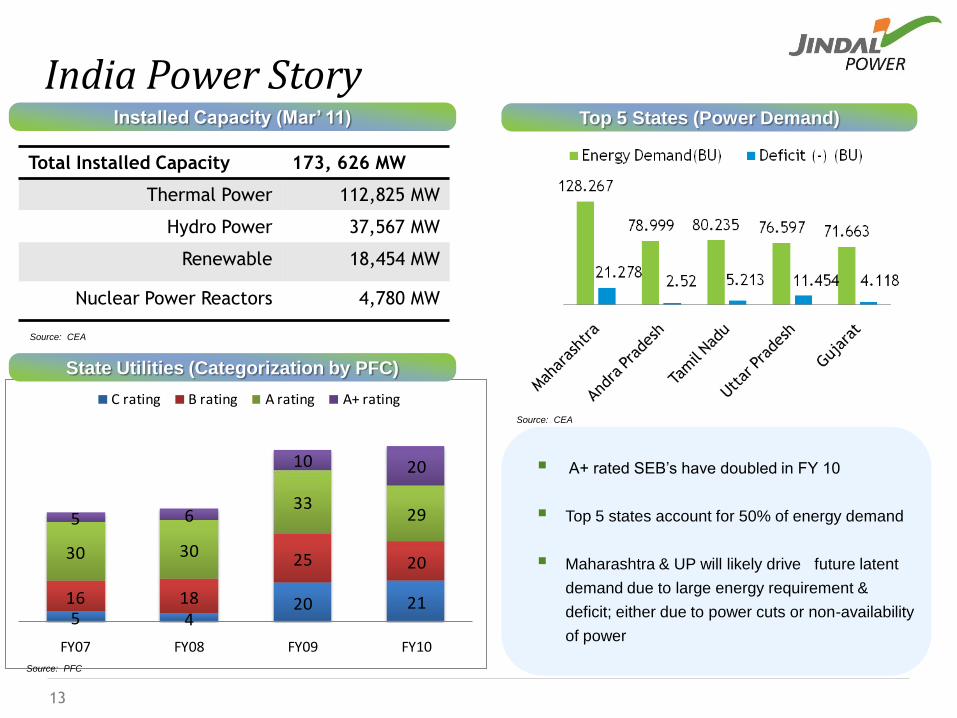
India Power Story
13
Installed Capacity (Mar’ 11) Top 5 States (Power Demand)
Source: CEA
Source: CEA
A+ rated SEB‟s have doubled in FY 10
Top 5 states account for 50% of energy demand
Maharashtra & UP will likely drive future latent
demand due to large energy requirement &
deficit; either due to power cuts or non-availability
of power
Total Installed Capacity 173, 626 MW
Thermal Power 112,825 MW
Hydro Power 37,567 MW
Renewable 18,454 MW
Nuclear Power Reactors 4,780 MW
5 420 2116 18
25 2030 30
33295 6
10 20
FY07 FY08 FY09 FY10
C rating B rating A rating A+ rating
Source: PFC
State Utilities (Categorization by PFC)
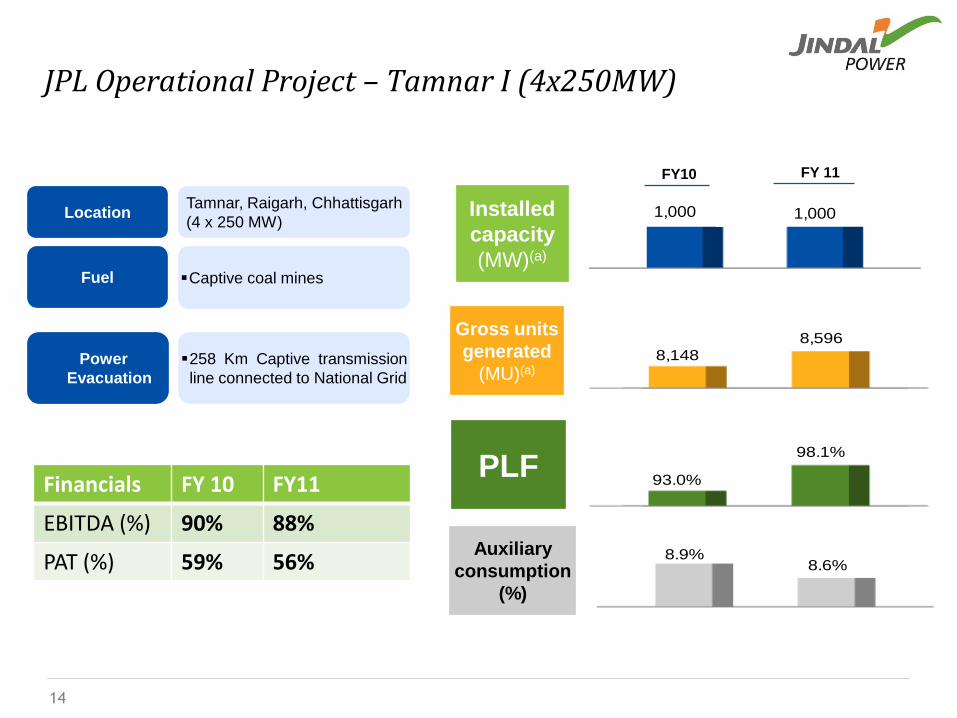
Location
Fuel
JPL Operational Project – Tamnar I (4x250MW)
Tamnar, Raigarh, Chhattisgarh
(4 x 250 MW)
Captive coal mines
Power
Evacuation
258 Km Captive transmission
line connected to National Grid
14
FY10
Installed
capacity
(MW)(a)
1,000 1,000
Gross units
generated
(MU)(a)8,148
8,596
PLF93.0%
98.1%
Auxiliary
consumption
(%)
8.9%8.6%
FY 11
Financials FY 10 FY11
EBITDA (%) 90% 88%
PAT (%) 59% 56%
15
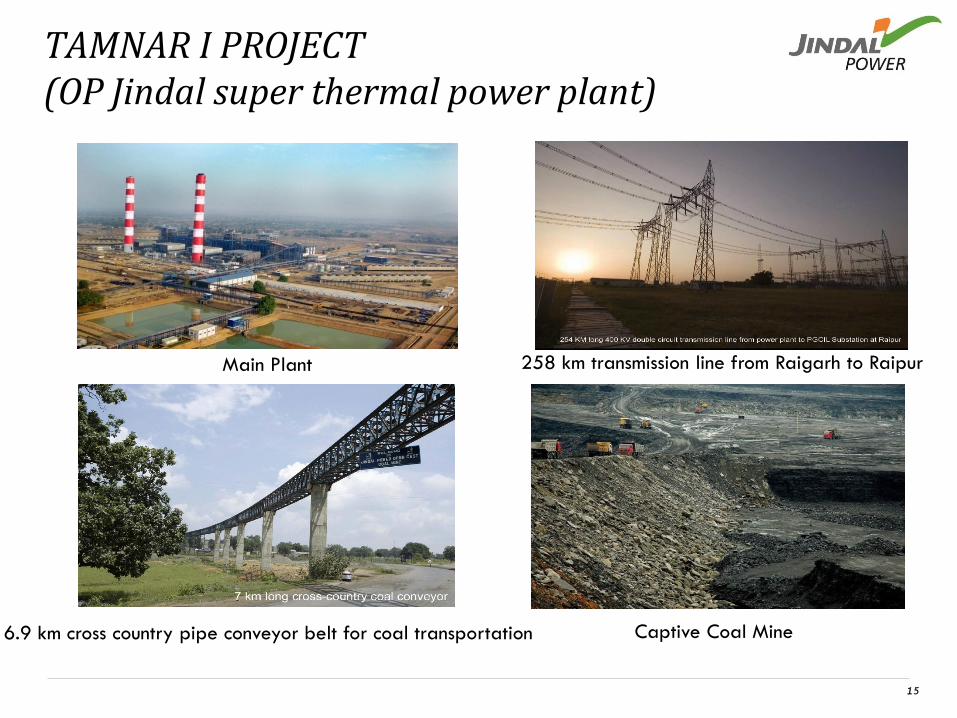
TAMNAR I PROJECT (OP Jindal super thermal power plant)
Main Plant 258 km transmission line from Raigarh to Raipur
6.9 km cross country pipe conveyor belt for coal transportation Captive Coal Mine
Steel business overview
Power business overview
Financial overview
Growth drivers
Sustainability Initiatives
16
0
500
1000
1500
2000
2500
3000
200320042005200620072008200920102011
0
100
200
300
400
500
600
700
800
900
200320042005200620072008200920102011
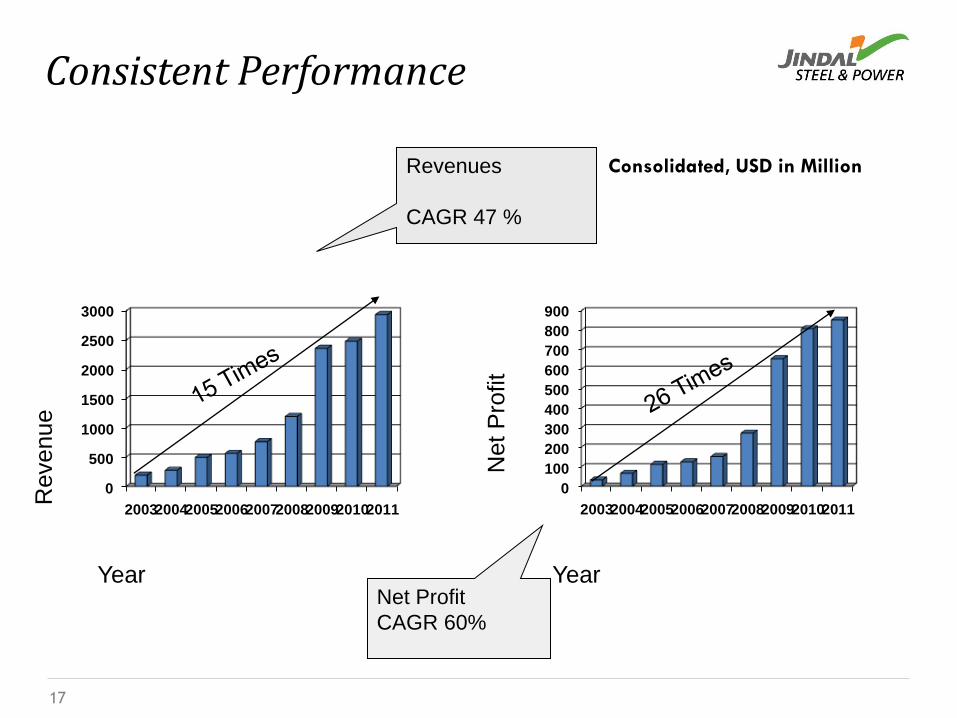
Year
Revenue
Revenues
CAGR 47 %
Year
Net P
rofit
Net Profit
CAGR 60%
Consolidated, USD in Million
Consistent Performance
17
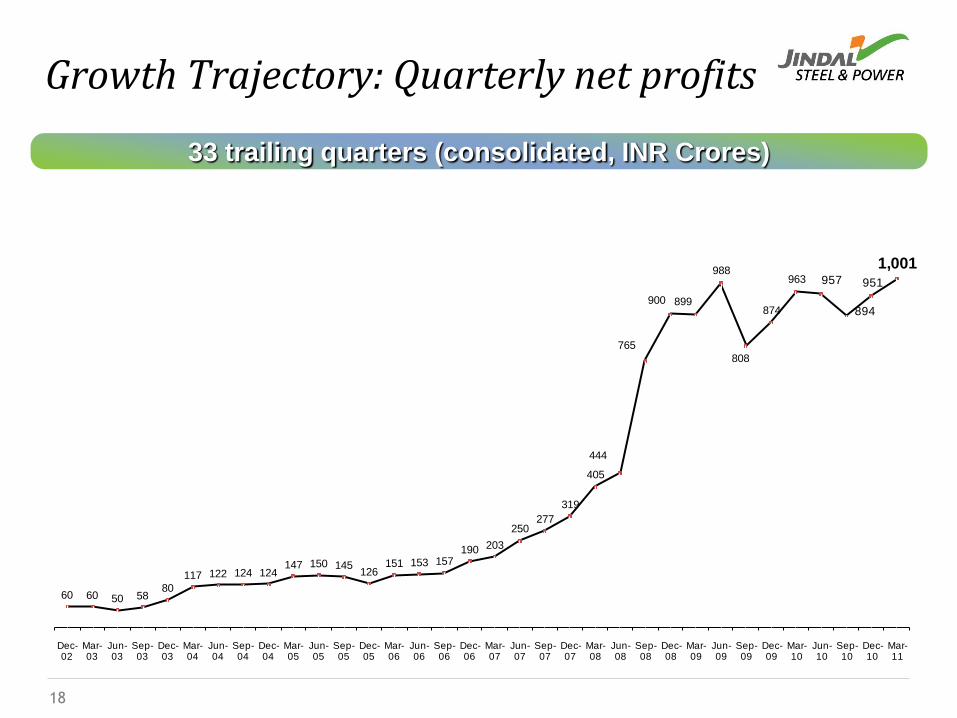
Growth Trajectory: Quarterly net profits
33 trailing quarters (consolidated, INR Crores)
60 60 50 5880
117 122 124 124147 150 145
126151 153 157
190 203
250277
319
405
444
765
900 899
988
808
874
963 957
894
951
1,001
Dec-02
Mar-03
Jun-03
Sep-03
Dec-03
Mar-04
Jun-04
Sep-04
Dec-04
Mar-05
Jun-05
Sep-05
Dec-05
Mar-06
Jun-06
Sep-06
Dec-06
Mar-07
Jun-07
Sep-07
Dec-07
Mar-08
Jun-08
Sep-08
Dec-08
Mar-09
Jun-09
Sep-09
Dec-09
Mar-10
Jun-10
Sep-10
Dec-10
Mar-11
18
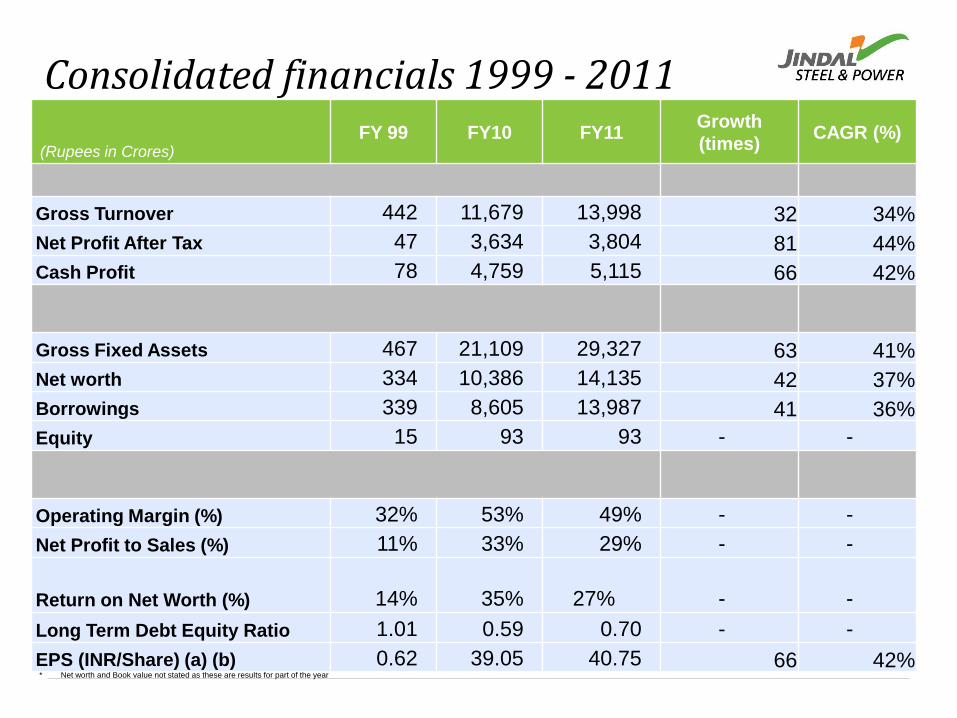
Consolidated financials 1999 - 2011
Note: EPS adjusted to reflect a 1:5 stock split w.e.f 27 Dec,07
Note: EPS adjusted to reflect a bonus issue of 5:1
* Net worth and Book value not stated as these are results for part of the year
(Rupees in Crores)FY 99 FY10 FY11
Growth
(times)CAGR (%)
Gross Turnover 442 11,679 13,998 32 34%
Net Profit After Tax 47 3,634 3,804 81 44%
Cash Profit 78 4,759 5,115 66 42%
Gross Fixed Assets 467 21,109 29,327 63 41%
Net worth 334 10,386 14,135 42 37%
Borrowings 339 8,605 13,987 41 36%
Equity 15 93 93 - -
Operating Margin (%) 32% 53% 49% - -
Net Profit to Sales (%) 11% 33% 29% - -
Return on Net Worth (%) 14% 35% 27% - -
Long Term Debt Equity Ratio 1.01 0.59 0.70 - -
EPS (INR/Share) (a) (b) 0.62 39.05 40.75 66 42%
Steel business overview
Power business overview
Financial overview
Growth drivers
Sustainability Initiatives
20
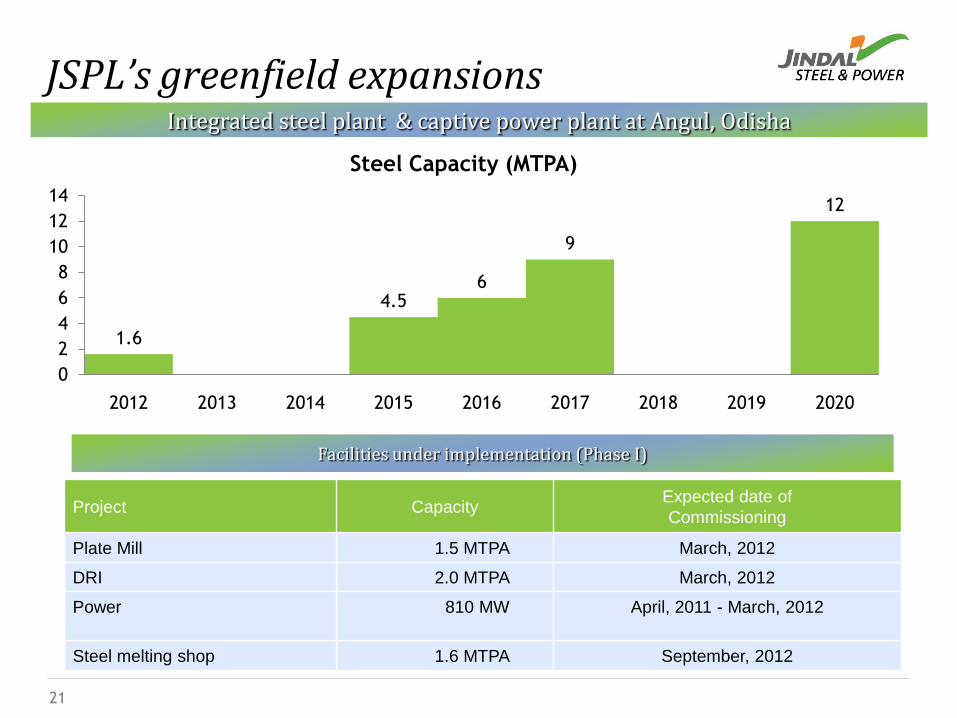
Project CapacityExpected date of
Commissioning
Plate Mill 1.5 MTPA March, 2012
DRI 2.0 MTPA March, 2012
Power 810 MW April, 2011 - March, 2012
Steel melting shop 1.6 MTPA September, 2012
Facilities under implementation (Phase I)
Integrated steel plant & captive power plant at Angul, Odisha
JSPL’s greenfield expansions
21
1.6
4.56
9
12
0
2
4
6
8
10
12
14
2012 2013 2014 2015 2016 2017 2018 2019 2020
Steel Capacity (MTPA)
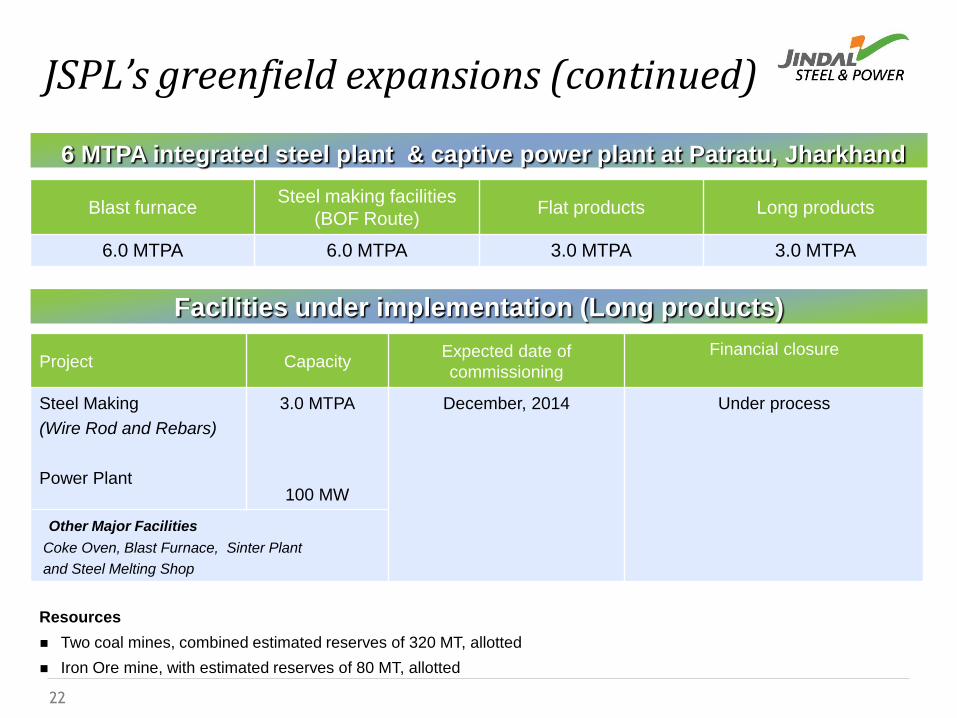
Project CapacityExpected date of
commissioning
Financial closure
Steel Making
(Wire Rod and Rebars)
Power Plant
3.0 MTPA
100 MW
December, 2014 Under process
Other Major Facilities
Coke Oven, Blast Furnace, Sinter Plant
and Steel Melting Shop
Facilities under implementation (Long products)
Resources
Two coal mines, combined estimated reserves of 320 MT, allotted
Iron Ore mine, with estimated reserves of 80 MT, allotted
Blast furnace Steel making facilities
(BOF Route)Flat products Long products
6.0 MTPA 6.0 MTPA 3.0 MTPA 3.0 MTPA
6 MTPA integrated steel plant & captive power plant at Patratu, Jharkhand
JSPL’s greenfield expansions (continued)
22
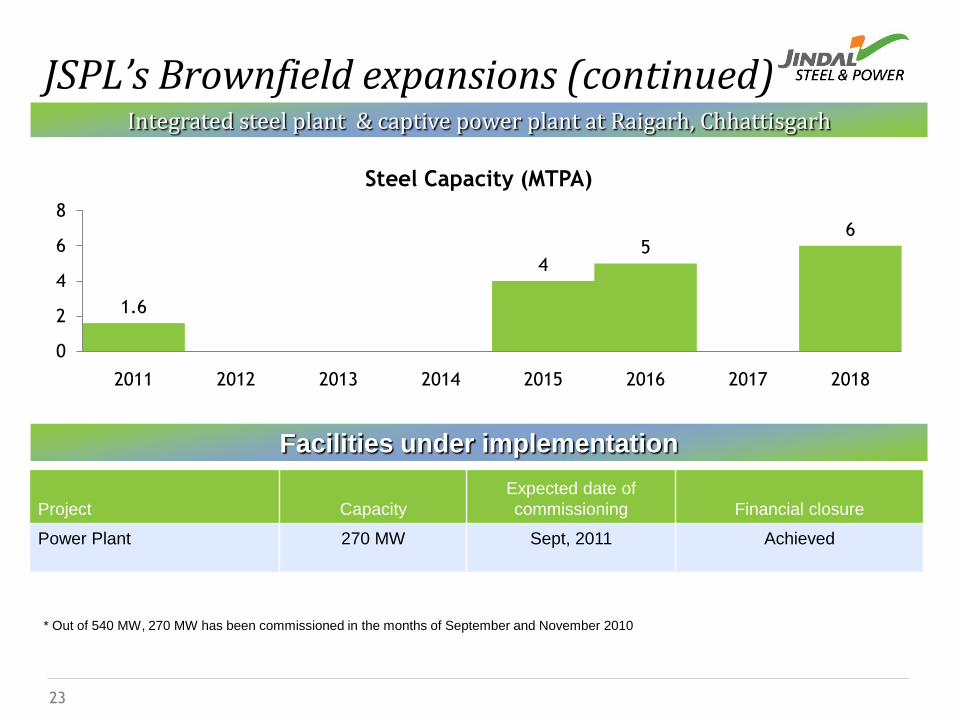
Project Capacity
Expected date of
commissioning Financial closure
Power Plant 270 MW Sept, 2011 Achieved
Facilities under implementation
JSPL’s Brownfield expansions (continued)
* Out of 540 MW, 270 MW has been commissioned in the months of September and November 2010
23
1.6
45
6
0
2
4
6
8
2011 2012 2013 2014 2015 2016 2017 2018
Steel Capacity (MTPA)
Integrated steel plant & captive power plant at Raigarh, Chhattisgarh
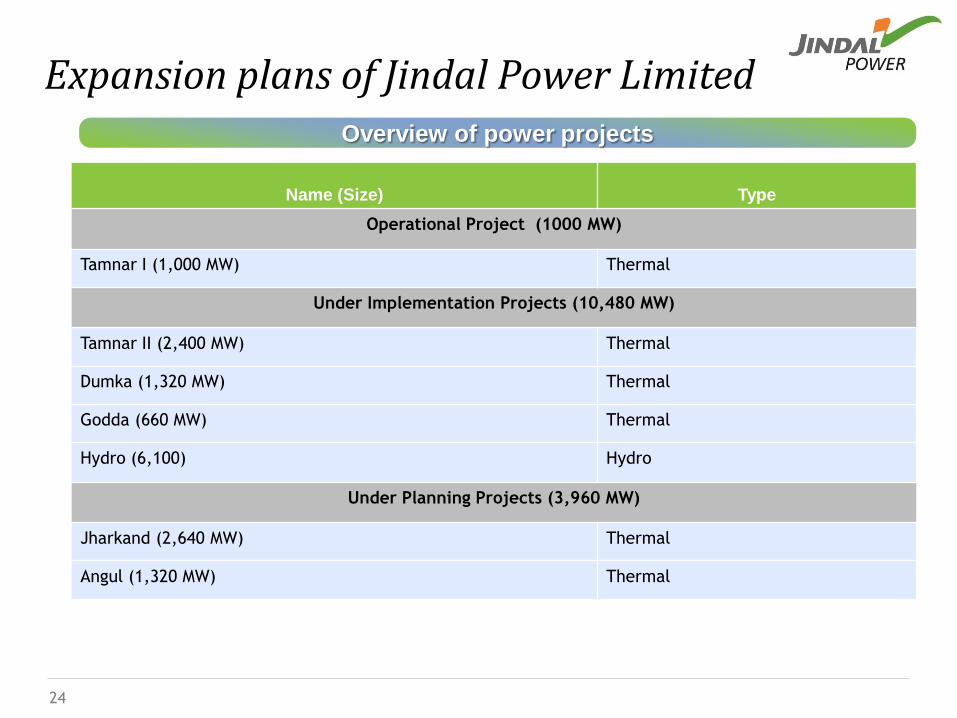
Expansion plans of Jindal Power LimitedOverview of power projects
Name (Size) Type
Operational Project (1000 MW)
Tamnar I (1,000 MW) Thermal
Under Implementation Projects (10,480 MW)
Tamnar II (2,400 MW) Thermal
Dumka (1,320 MW) Thermal
Godda (660 MW) Thermal
Hydro (6,100) Hydro
Under Planning Projects (3,960 MW)
Jharkand (2,640 MW) Thermal
Angul (1,320 MW) Thermal
24
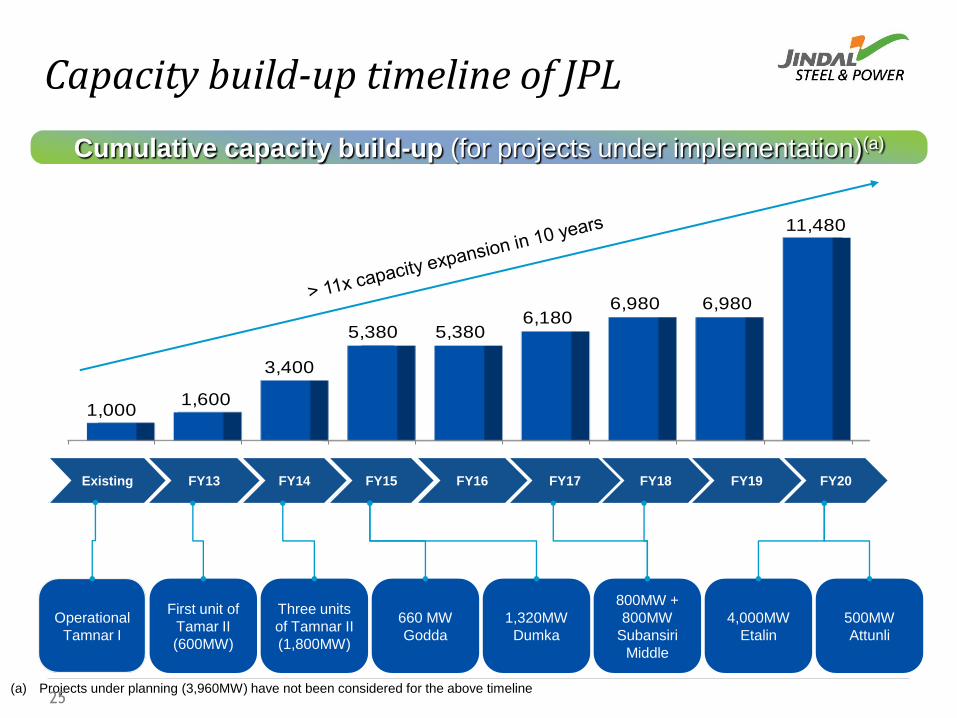
Capacity build-up timeline of JPL
Cumulative capacity build-up (for projects under implementation)(a)
1,0001,600
3,400
5,380 5,3806,180
6,980 6,980
11,480
FY14 FY15 FY16 FY17 FY18 FY19 FY20Existing
500MW
Attunli
660 MW
Godda
1,320MW
Dumka
4,000MW
Etalin
800MW +
800MW
Subansiri
Middle
Three units
of Tamnar II
(1,800MW)
Operational
Tamnar I
FY13
First unit of
Tamar II
(600MW)
(a) Projects under planning (3,960MW) have not been considered for the above timeline25
26
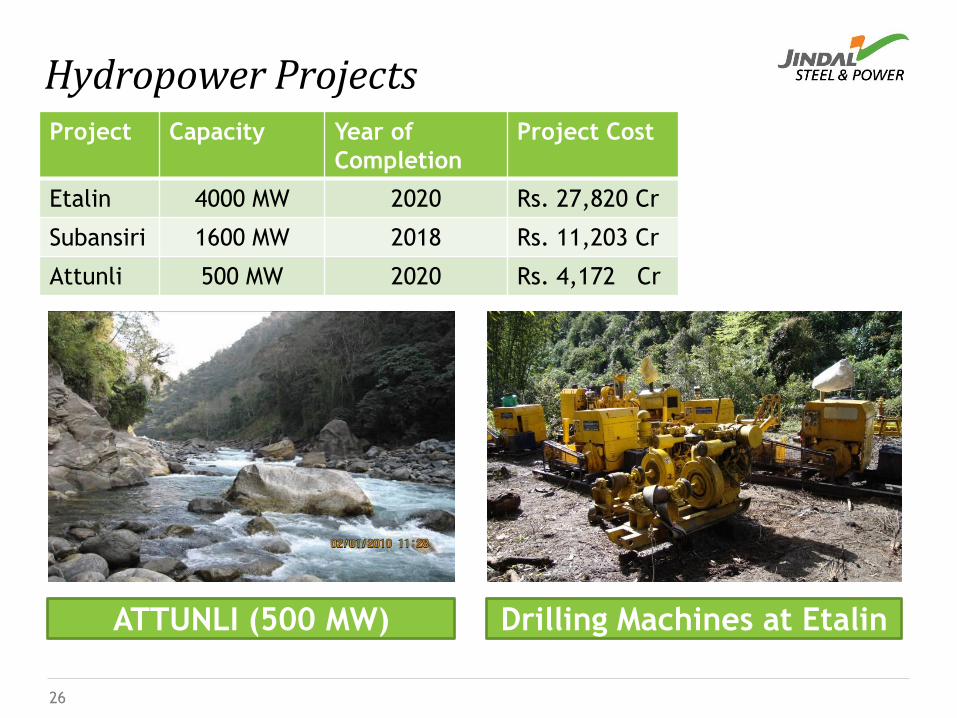
Hydropower ProjectsProject Capacity Year of
Completion
Project Cost
Etalin 4000 MW 2020 Rs. 27,820 Cr
Subansiri 1600 MW 2018 Rs. 11,203 Cr
Attunli 500 MW 2020 Rs. 4,172 Cr
ATTUNLI (500 MW) Drilling Machines at Etalin
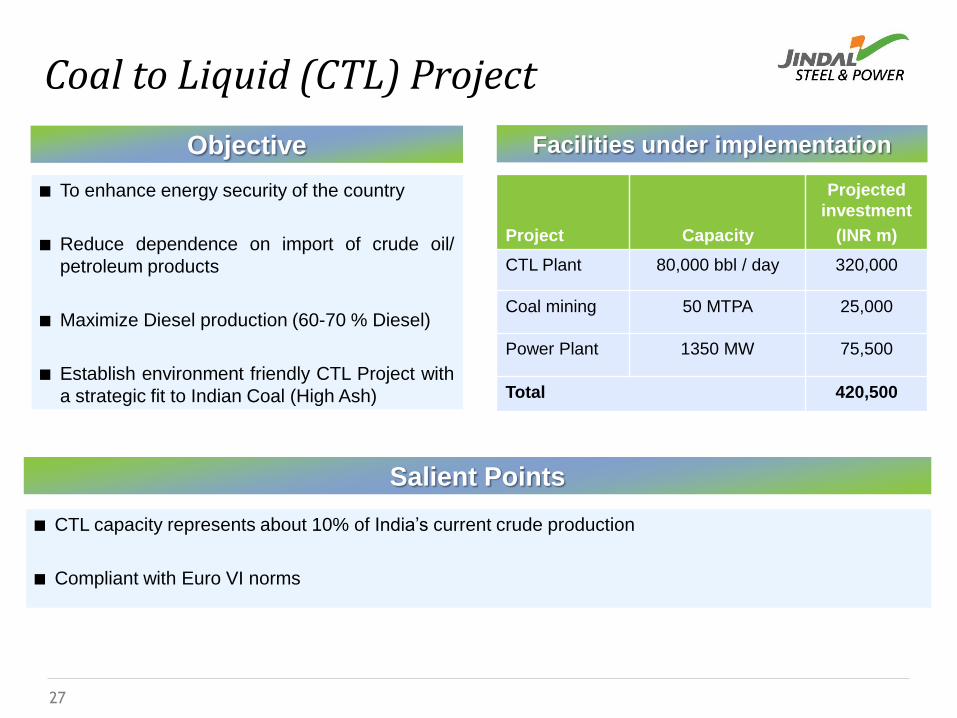
Project Capacity
Projected
investment
(INR m)
CTL Plant 80,000 bbl / day 320,000
Coal mining 50 MTPA 25,000
Power Plant 1350 MW 75,500
Total 420,500
Facilities under implementation
Coal to Liquid (CTL) Project
Objective
■ To enhance energy security of the country
■ Reduce dependence on import of crude oil/
petroleum products
■ Maximize Diesel production (60-70 % Diesel)
■ Establish environment friendly CTL Project with
a strategic fit to Indian Coal (High Ash)
27
■ CTL capacity represents about 10% of India‟s current crude production
■ Compliant with Euro VI norms
Salient Points
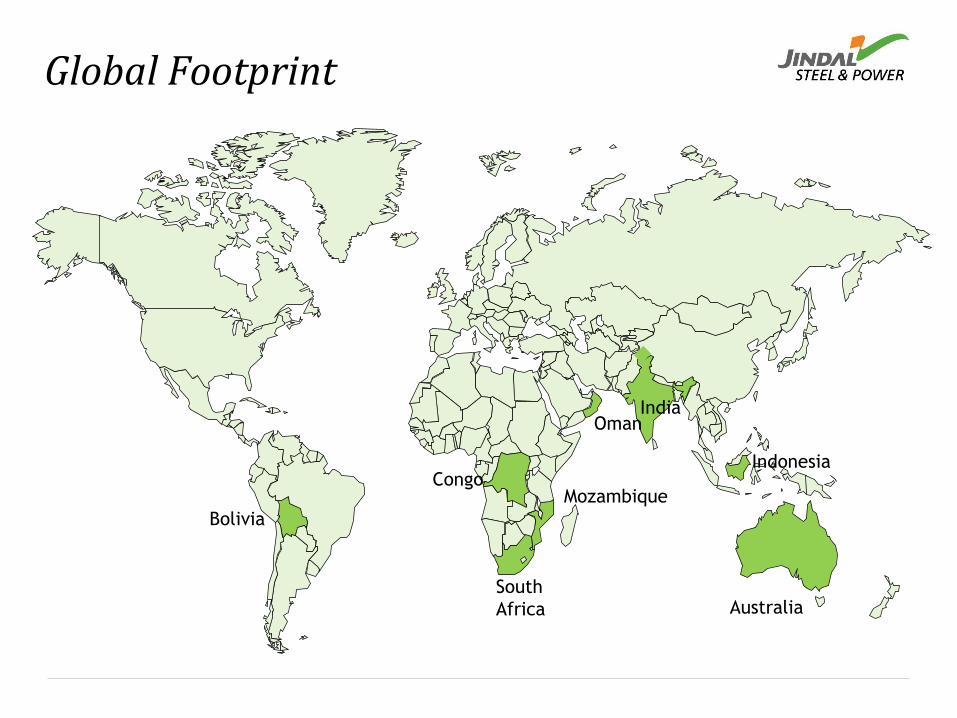
IndiaOman
Bolivia
South
Africa
Mozambique
IndonesiaCongo
Global Footprint
Georgia Australia
29
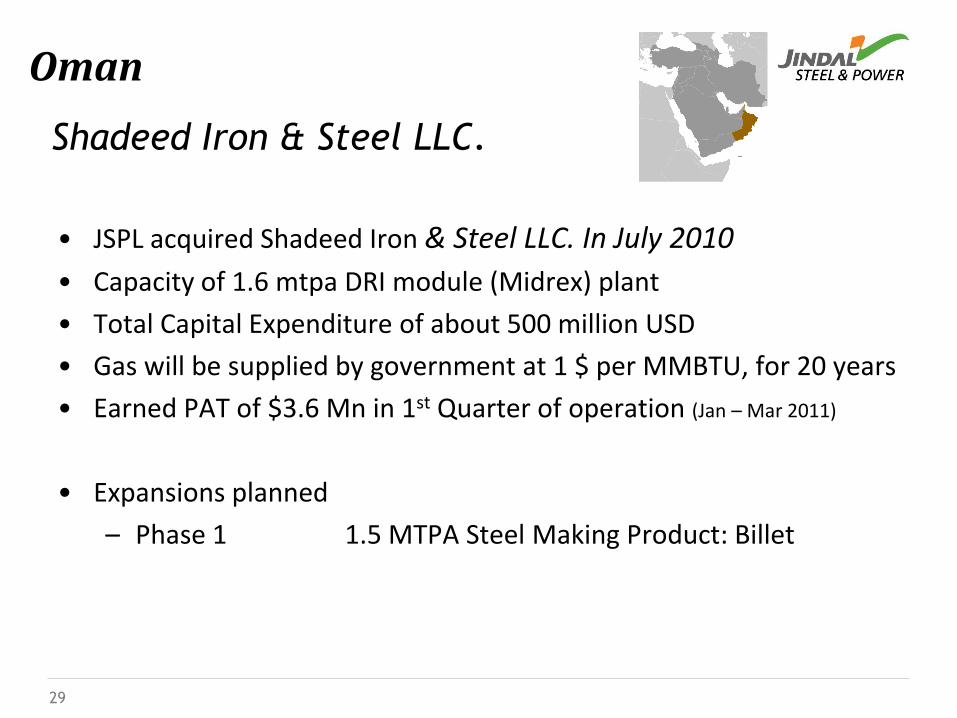
Oman
• JSPL acquired Shadeed Iron & Steel LLC. In July 2010
• Capacity of 1.6 mtpa DRI module (Midrex) plant
• Total Capital Expenditure of about 500 million USD
• Gas will be supplied by government at 1 $ per MMBTU, for 20 years
• Earned PAT of $3.6 Mn in 1st Quarter of operation (Jan – Mar 2011)
• Expansions planned
– Phase 1 1.5 MTPA Steel Making Product: Billet
Shadeed Iron & Steel LLC.
30
Oman
31
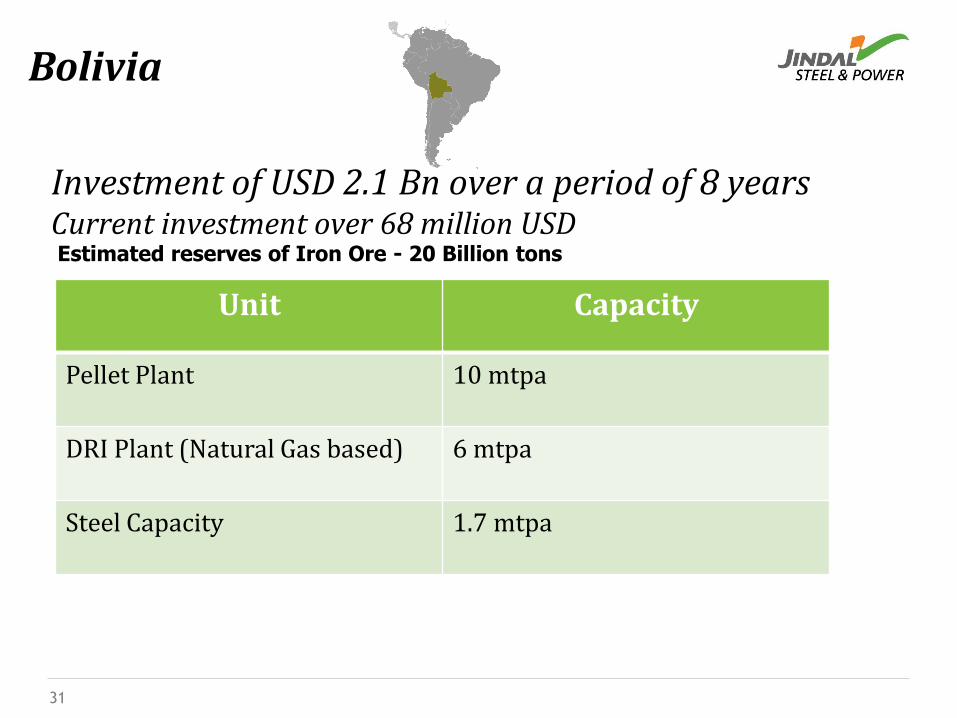
Bolivia
Estimated reserves of Iron Ore - 20 Billion tons
Investment of USD 2.1 Bn over a period of 8 yearsCurrent investment over 68 million USD
Unit Capacity
Pellet Plant 10 mtpa
DRI Plant (Natural Gas based) 6 mtpa
Steel Capacity 1.7 mtpa
32
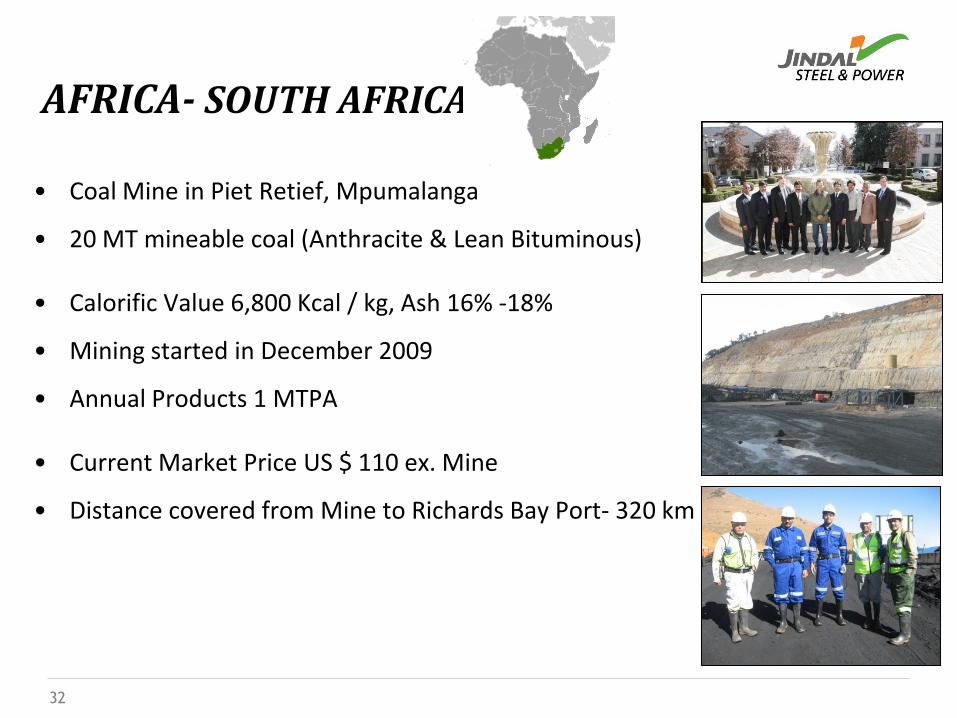
AFRICA- SOUTH AFRICA
• Coal Mine in Piet Retief, Mpumalanga
• 20 MT mineable coal (Anthracite & Lean Bituminous)
• Calorific Value 6,800 Kcal / kg, Ash 16% -18%
• Mining started in December 2009
• Annual Products 1 MTPA
• Current Market Price US $ 110 ex. Mine
• Distance covered from Mine to Richards Bay Port- 320 km
33
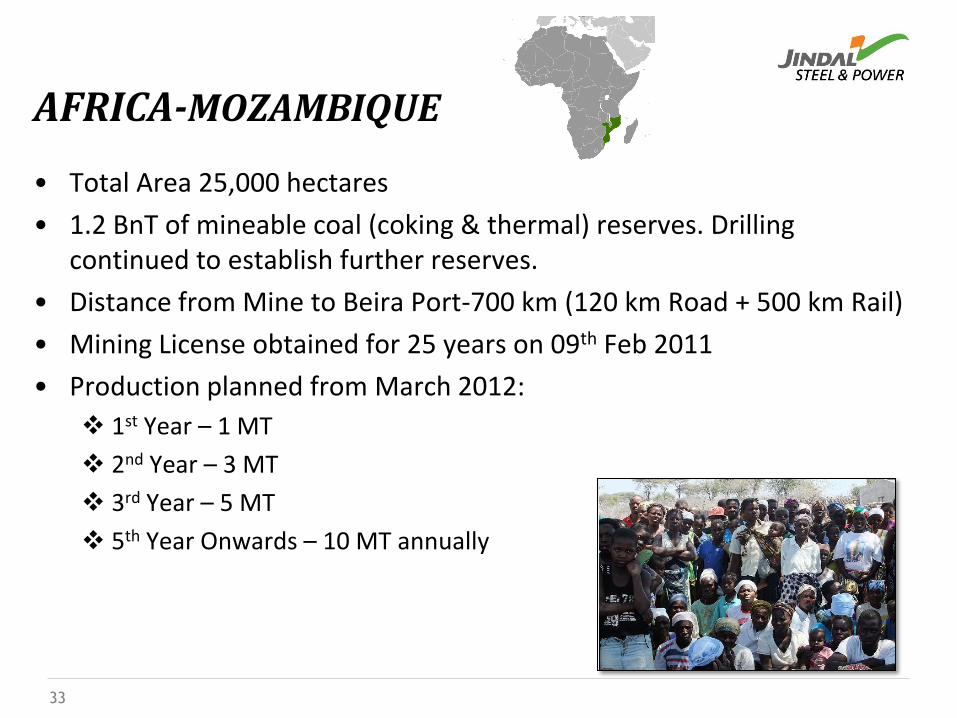
AFRICA-MOZAMBIQUE
• Total Area 25,000 hectares
• 1.2 BnT of mineable coal (coking & thermal) reserves. Drilling continued to establish further reserves.
• Distance from Mine to Beira Port-700 km (120 km Road + 500 km Rail)
• Mining License obtained for 25 years on 09th Feb 2011
• Production planned from March 2012:
1st Year – 1 MT
2nd Year – 3 MT
3rd Year – 5 MT
5th Year Onwards – 10 MT annually
34
ASIA- INDONESIA
• Total Area 3587 Hectares
• Thermal Coal Mine with reserves of over 250 MT
• Low Stripping Ratio of 2:1 Open Cast Mining
• Mining License already obtained. In-principle forest clearance obtained.
• Mining to commence in Nov, 2011 FY11-12– 3L
FY12-13 – 1 MT
FY13-14 – 3 MT
FY14-15 – 5 MT
• Own Jetty at River
• Distance to port - 270 Km. (30 Km Road + 240 Km River)
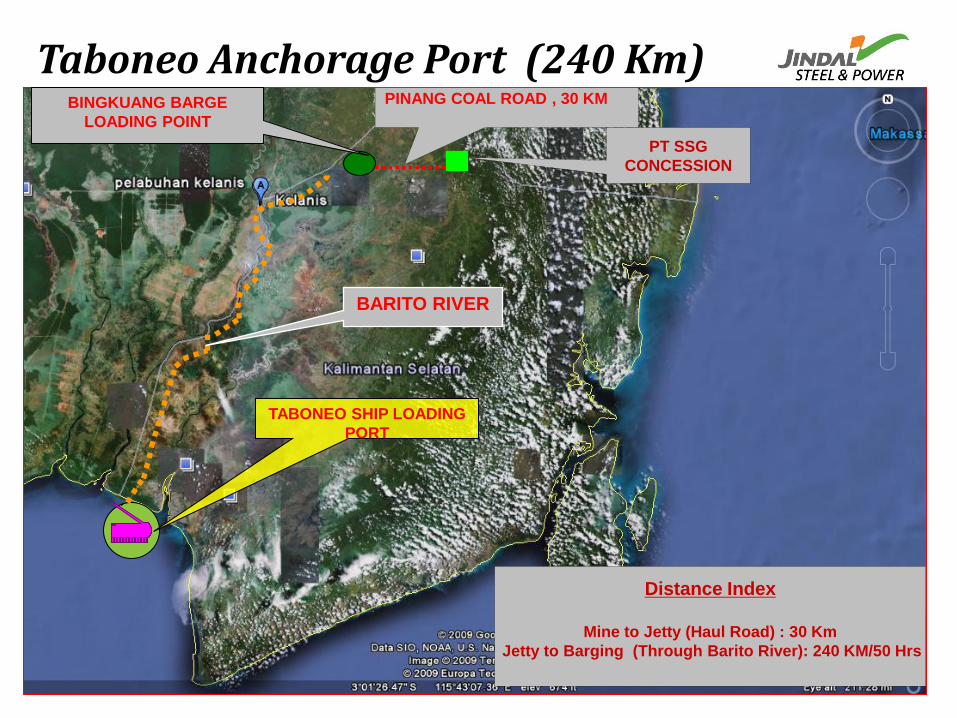
TABONEO SHIP LOADING
PORT
BINGKUANG BARGE
LOADING POINT
BARITO RIVER
Taboneo Anchorage Port (240 Km)PINANG COAL ROAD , 30 KM
Distance Index
Mine to Jetty (Haul Road) : 30 Km
Jetty to Barging (Through Barito River): 240 KM/50 Hrs
PT SSG
CONCESSION
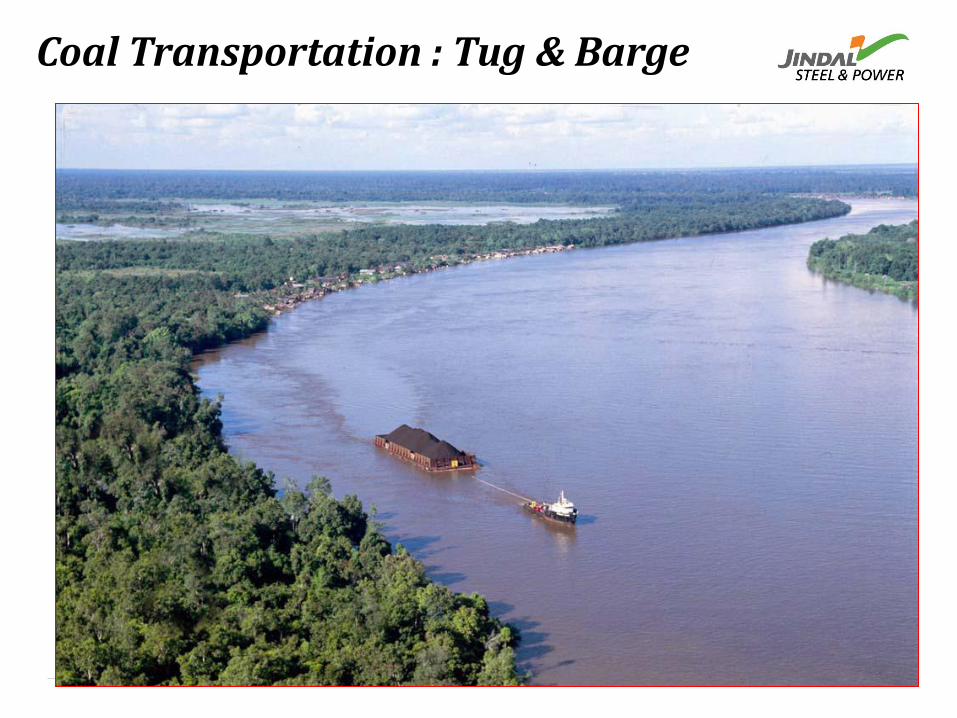
Coal Transportation : Tug & Barge
37
AUSTRALIA
• Acquired 15% stake in Rockland Richfield Ltd. - anASX Listed company having 3 Tenements
• Propose to complete acquisition in due course
• Major achievement by acquiring 3 greenfield minesfrom Govt. of Queensland - 2 Thermal Coal and 1Coking/Thermal Coal
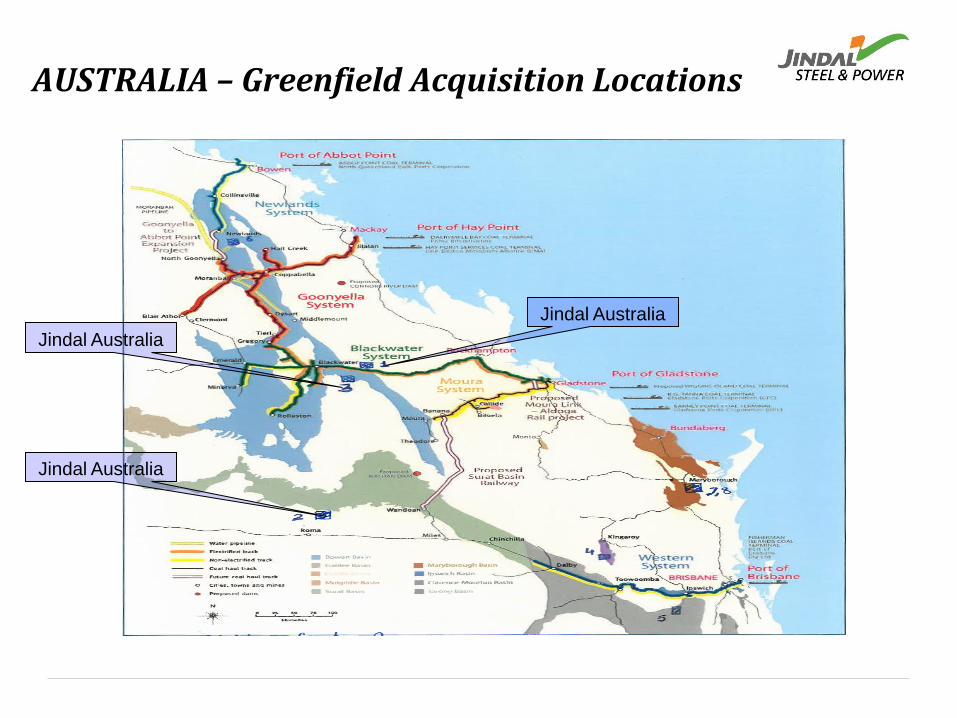
Jindal Australia
Jindal Australia
Jindal Australia
AUSTRALIA – Greenfield Acquisition Locations
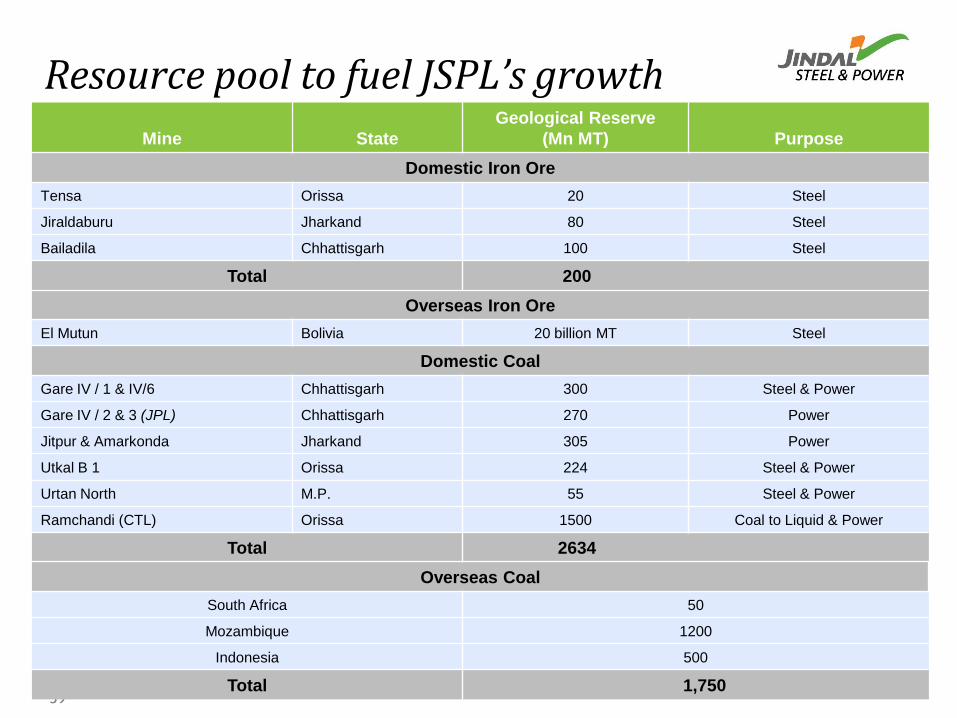
Resource pool to fuel JSPL’s growth
39
Mine State
Geological Reserve
(Mn MT) Purpose
Domestic Iron Ore
Tensa Orissa 20 Steel
Jiraldaburu Jharkand 80 Steel
Bailadila Chhattisgarh 100 Steel
Total 200
Overseas Iron Ore
El Mutun Bolivia 20 billion MT Steel
Domestic Coal
Gare IV / 1 & IV/6 Chhattisgarh 300 Steel & Power
Gare IV / 2 & 3 (JPL) Chhattisgarh 270 Power
Jitpur & Amarkonda Jharkand 305 Power
Utkal B 1 Orissa 224 Steel & Power
Urtan North M.P. 55 Steel & Power
Ramchandi (CTL) Orissa 1500 Coal to Liquid & Power
Total 2634
Overseas Coal
South Africa 50
Mozambique 1200
Indonesia 500
Total 1,750
40
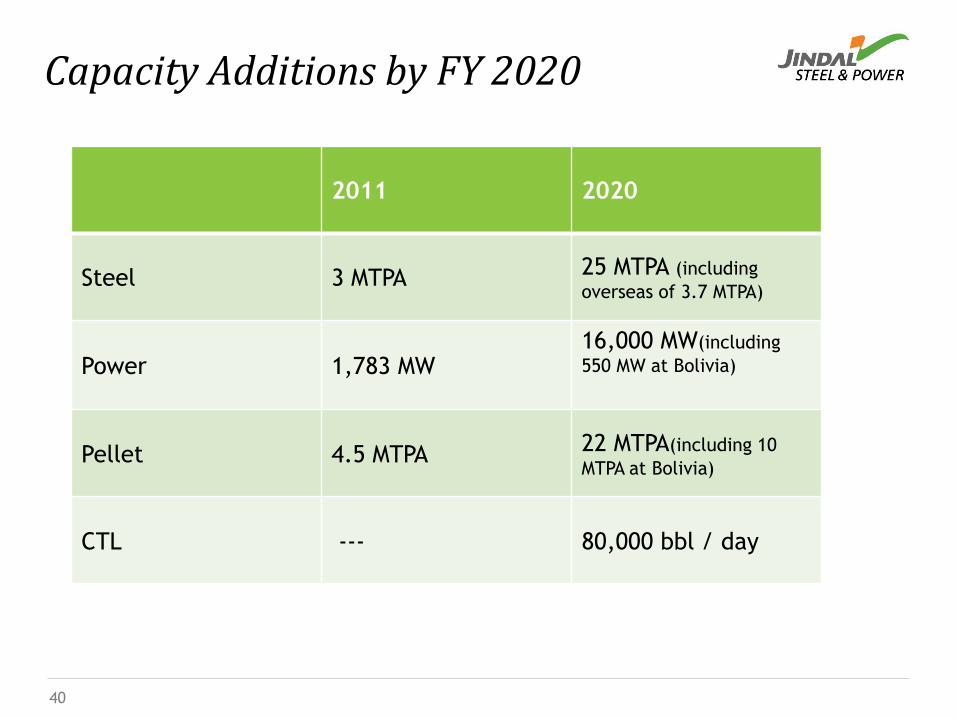
Capacity Additions by FY 2020
2011 2020
Steel 3 MTPA 25 MTPA (including
overseas of 3.7 MTPA)
Power 1,783 MW16,000 MW(including
550 MW at Bolivia)
Pellet 4.5 MTPA 22 MTPA(including 10
MTPA at Bolivia)
CTL --- 80,000 bbl / day
Steel business overview
Power business overview
Financial overview
Growth drivers
Sustainability Initiatives
41
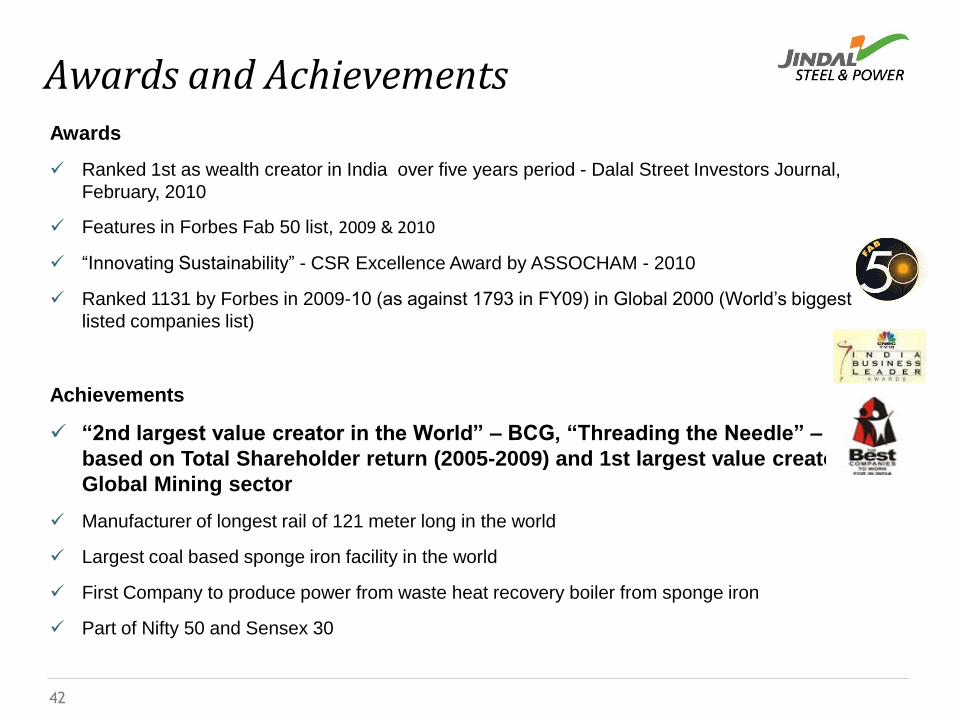
Awards
Ranked 1st as wealth creator in India over five years period - Dalal Street Investors Journal,
February, 2010
Features in Forbes Fab 50 list, 2009 & 2010
“Innovating Sustainability” - CSR Excellence Award by ASSOCHAM - 2010
Ranked 1131 by Forbes in 2009-10 (as against 1793 in FY09) in Global 2000 (World‟s biggest
listed companies list)
Achievements
“2nd largest value creator in the World” – BCG, “Threading the Needle” – 2010
based on Total Shareholder return (2005-2009) and 1st largest value creator in
Global Mining sector
Manufacturer of longest rail of 121 meter long in the world
Largest coal based sponge iron facility in the world
First Company to produce power from waste heat recovery boiler from sponge iron
Part of Nifty 50 and Sensex 30
Awards and Achievements
42
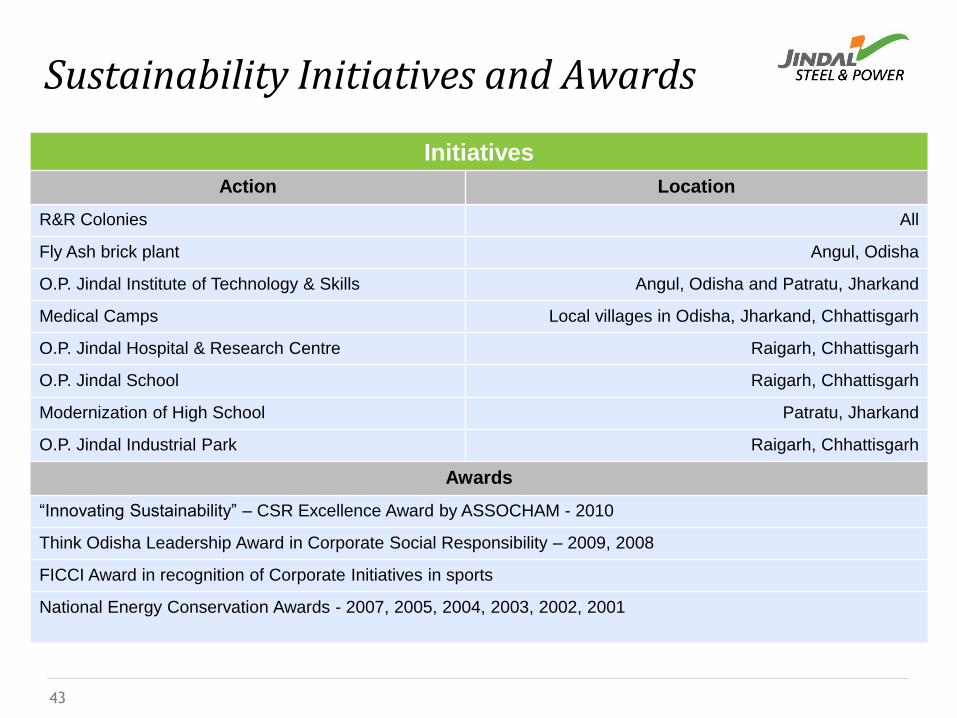
Sustainability Initiatives and Awards
Initiatives
Action Location
R&R Colonies All
Fly Ash brick plant Angul, Odisha
O.P. Jindal Institute of Technology & Skills Angul, Odisha and Patratu, Jharkand
Medical Camps Local villages in Odisha, Jharkand, Chhattisgarh
O.P. Jindal Hospital & Research Centre Raigarh, Chhattisgarh
O.P. Jindal School Raigarh, Chhattisgarh
Modernization of High School Patratu, Jharkand
O.P. Jindal Industrial Park Raigarh, Chhattisgarh
Awards
“Innovating Sustainability” – CSR Excellence Award by ASSOCHAM - 2010
Think Odisha Leadership Award in Corporate Social Responsibility – 2009, 2008
FICCI Award in recognition of Corporate Initiatives in sports
National Energy Conservation Awards - 2007, 2005, 2004, 2003, 2002, 2001
43
Copyright © 2010 Jindal Steel & Power Ltd.
Thank you