Embed Size (px)
Citation preview
Jim Sherwood, U. S. Federal Highway Administration, Turner Fairbank Highway Research Center, Infrastructure Research and Development
Roya Amjadi, U. S. Federal Highway Administration, Turner Fairbank Highway Research Center, Safety Research and Development
Gerardo Flintsch, Center for Sustainable Transportation Infrastructure, Virginia Tech Transportation Institute
1
Case Study: Ran off the Road Crash Variation with Pavement Friction
LTPP GPS 23-1001 and SPS 23-0500Reduced Friction Effect on Safety
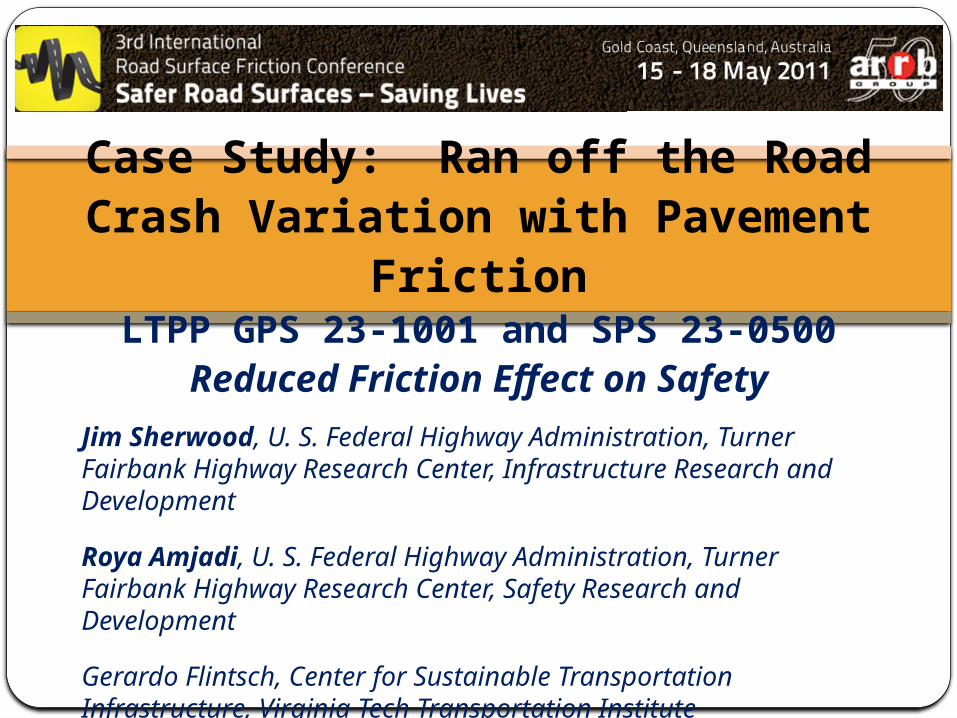
Long Term Pavement Performance Program
The objective of this research is to investigate the relation between safety and skid number with a case study:
27.55 kM (17.12 mi) on an Interstate NB was constructed in 1972 with an open graded friction course.
In June 1995, it was milled and overlaid with a dense grade asphalt concrete due to pavement deterioration.
LTPP, GPS-1 test section had a four year average friction number of 66 before the overlay, and 44 after the overlay.
2
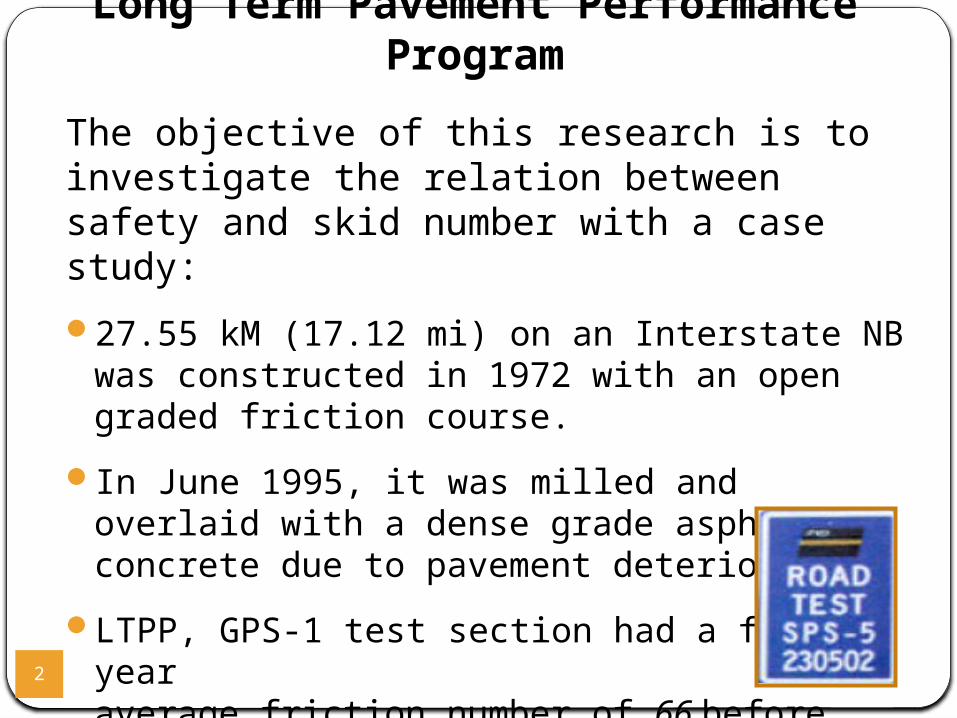
SPS 230500 and GPS Project 231001
3
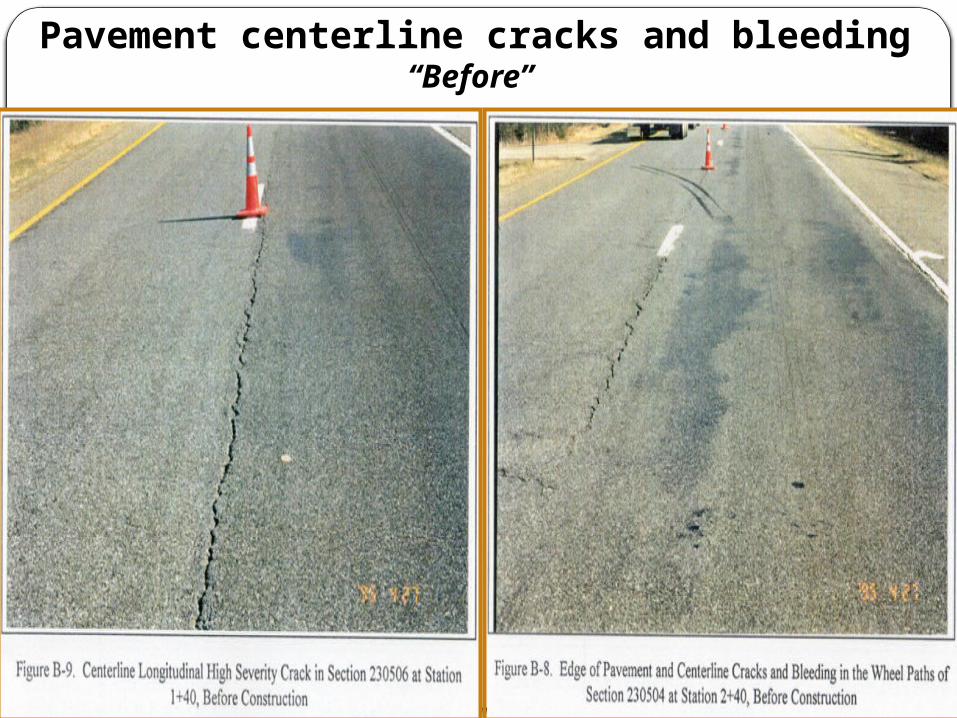
Pavement centerline cracks and bleeding“Before”
4
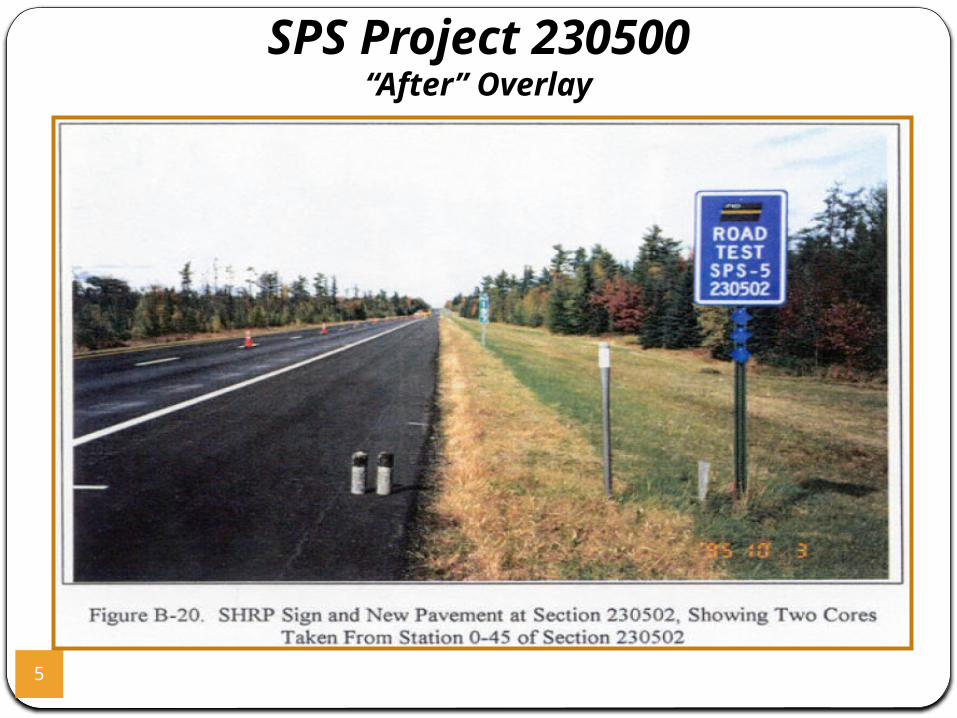
SPS Project 230500“After” Overlay
5
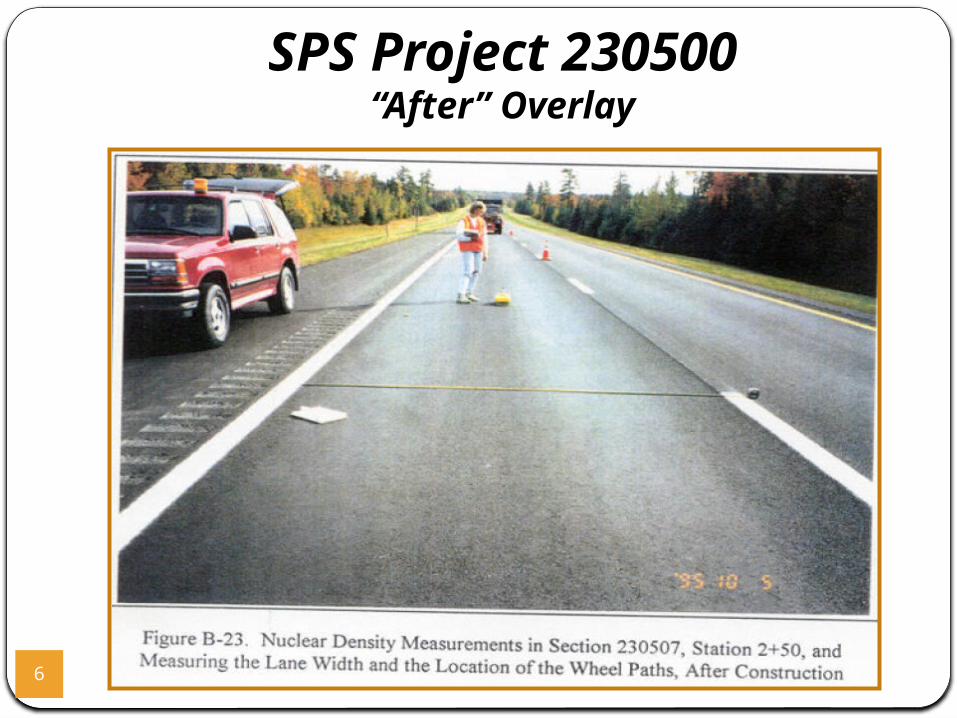
SPS Project 230500“After” Overlay
6
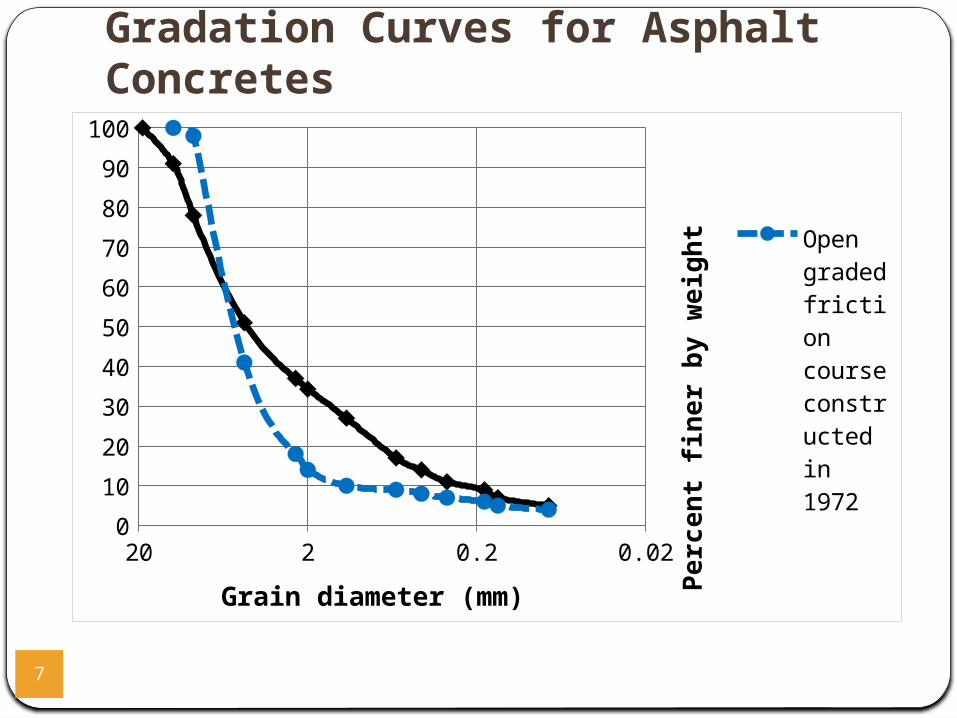
Gradation Curves for Asphalt Concretes
7
0.020.22200
10
20
30
40
50
60
70
80
90
100
Open graded friction course con-structed in 1972
Dense graded overlay con-structed in 1995
Grain diameter (mm)
Perc
ent fi
ner b
y w
eigh
t
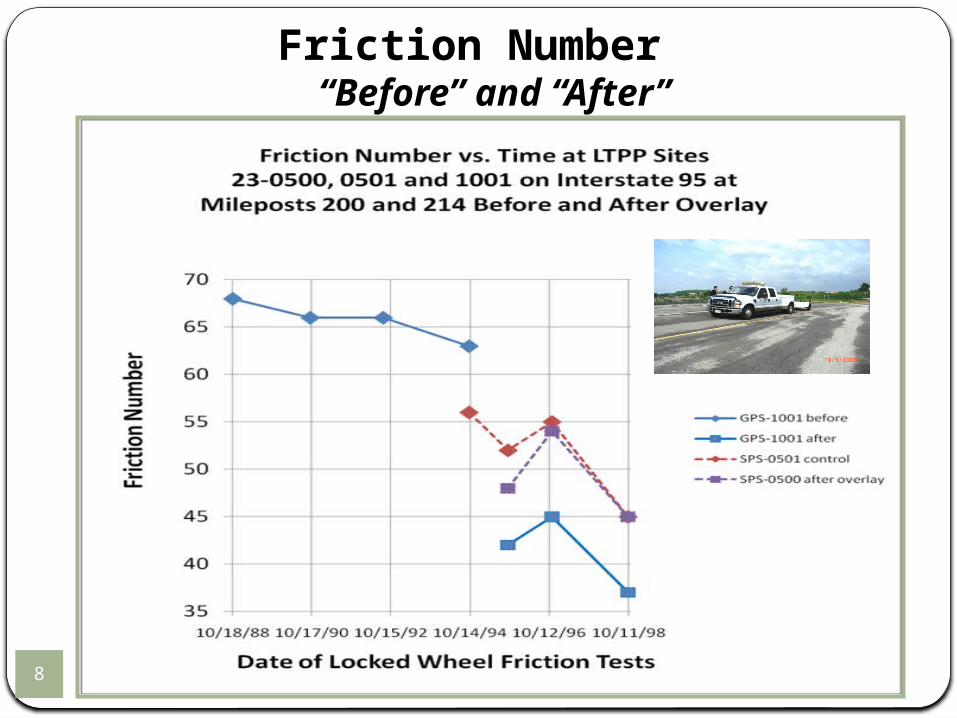
Friction Number “Before” and “After”
8
Data SourcesFHWA, Highway Safety Information System (HSIS) crash data files were used for this study:Accident type (run off road, rollover, jackknife, rear
end, object in road) and severityDate and timeLocation (nearest 0.1 mi. GIS MP)Road surface conditions (wet, dry, snow/ice)Number and types of vehicles.
9
10
0
1000
2000
3000
4000
5000
6000
1972 1980 1988 1996 2004
Vehi
cles
per
day
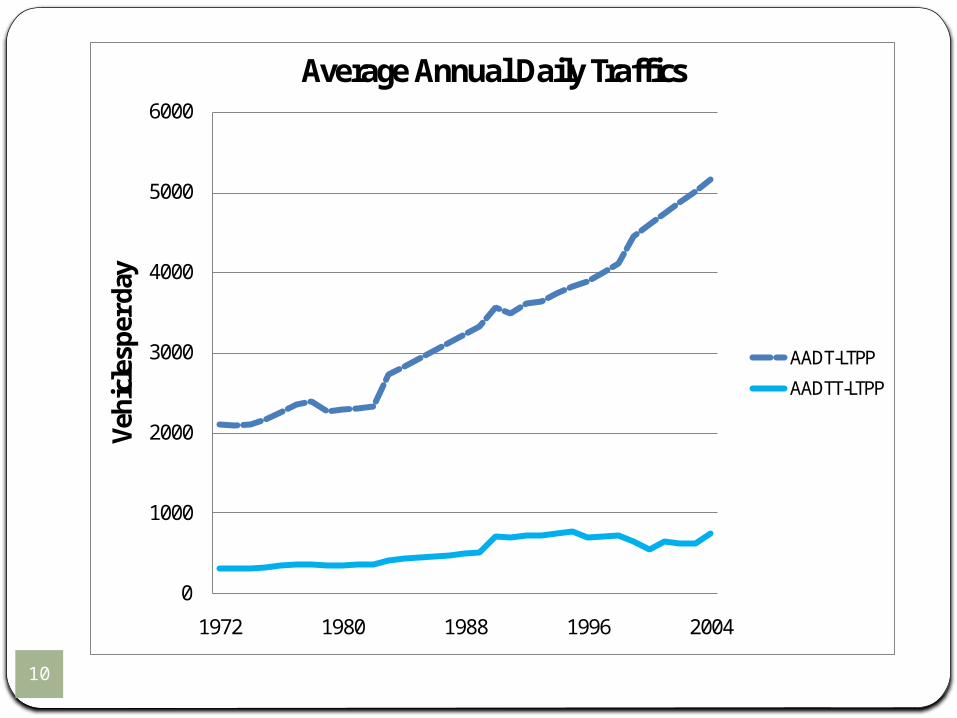
Average Annual Daily Traffics
AADT-LTPP
AADTT-LTPP
11
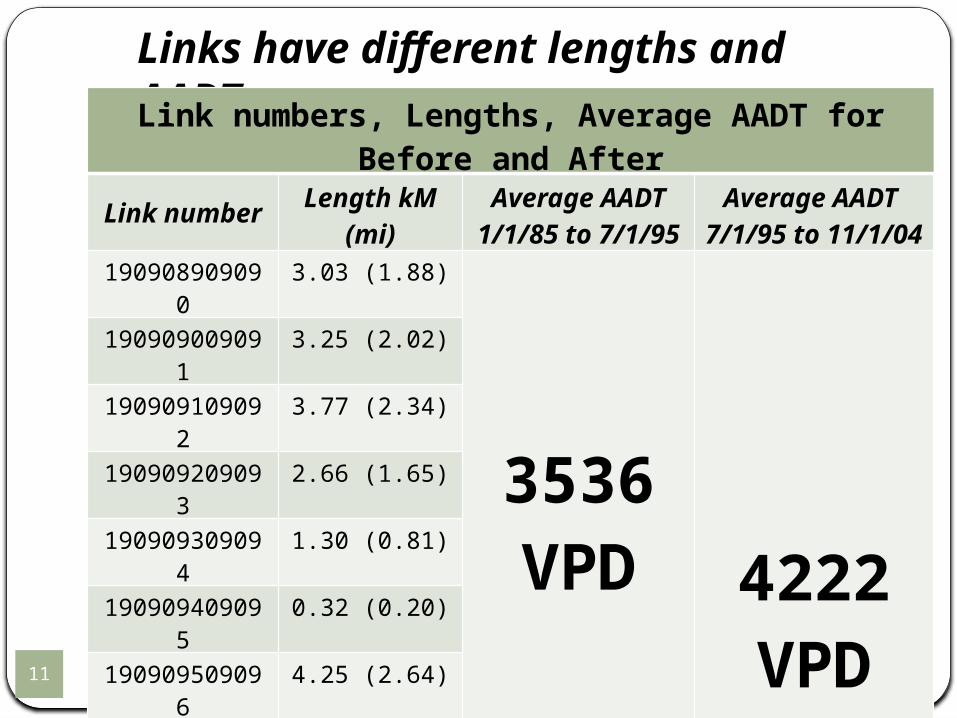
Links have different lengths and AADTsLink numbers, Lengths, Average AADT for Before and After
Link number Length kM(mi)
Average AADT1/1/85 to 7/1/95
Average AADT 7/1/95 to 11/1/04
190908909090 3.03 (1.88)
3536 VPD 4222
VPD
190909009091 3.25 (2.02)
190909109092 3.77 (2.34)
190909209093 2.66 (1.65)
190909309094 1.30 (0.81)
190909409095 0.32 (0.20)
190909509096 4.25 (2.64)
190909609097 0.71 (0.44)
190909709098 3.93 (2.44)
190909809099 1.72 (1.07)
190909909100 2.11 (1.31)
190910009713 0.32 (0.20) 2862 VPD 3463 VPD
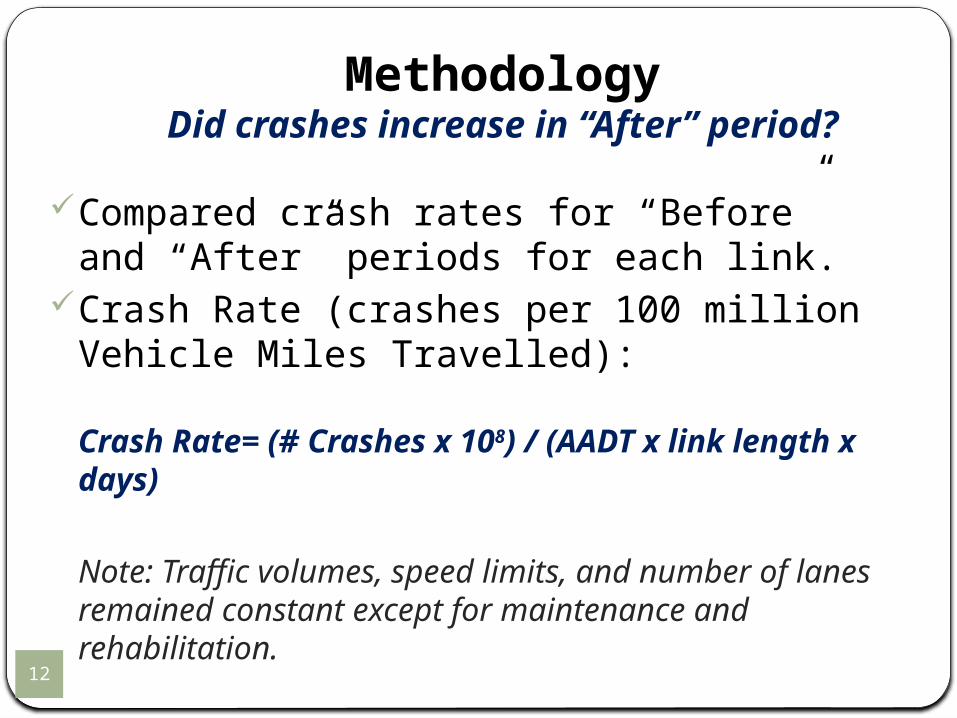
MethodologyDid crashes increase in “After” period?
Compared crash rates for “Before” and “After” periods for each link.
Crash Rate (crashes per 100 million Vehicle Miles Travelled):
Crash Rate= (# Crashes x 108) / (AADT x link length x days)
Note: Traffic volumes, speed limits, and number of lanes remained constant except for maintenance and rehabilitation.
12
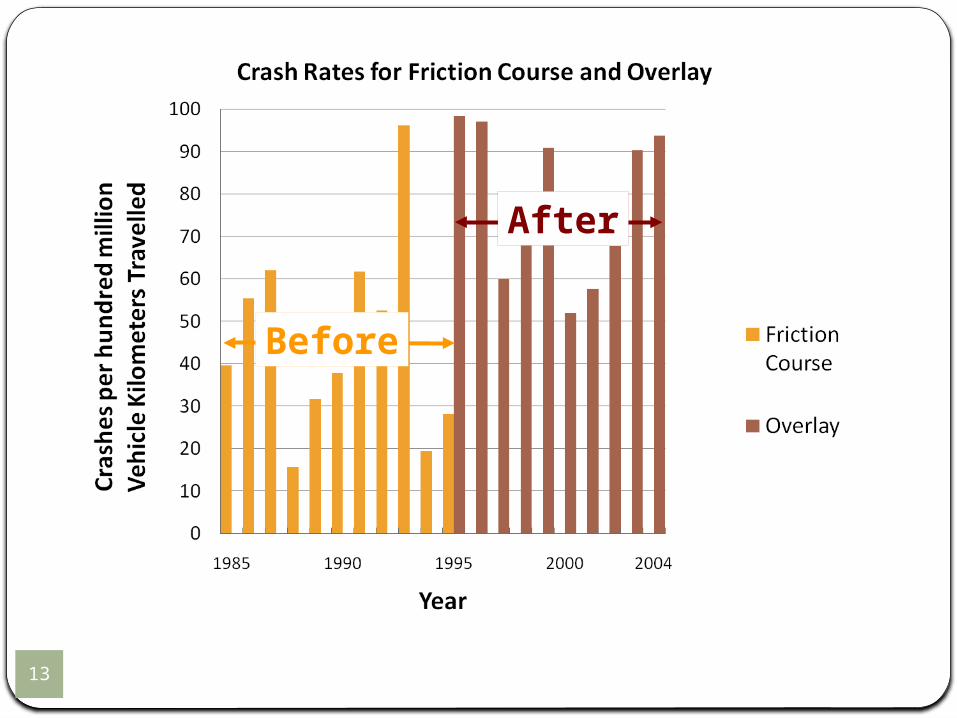
13
Before
After
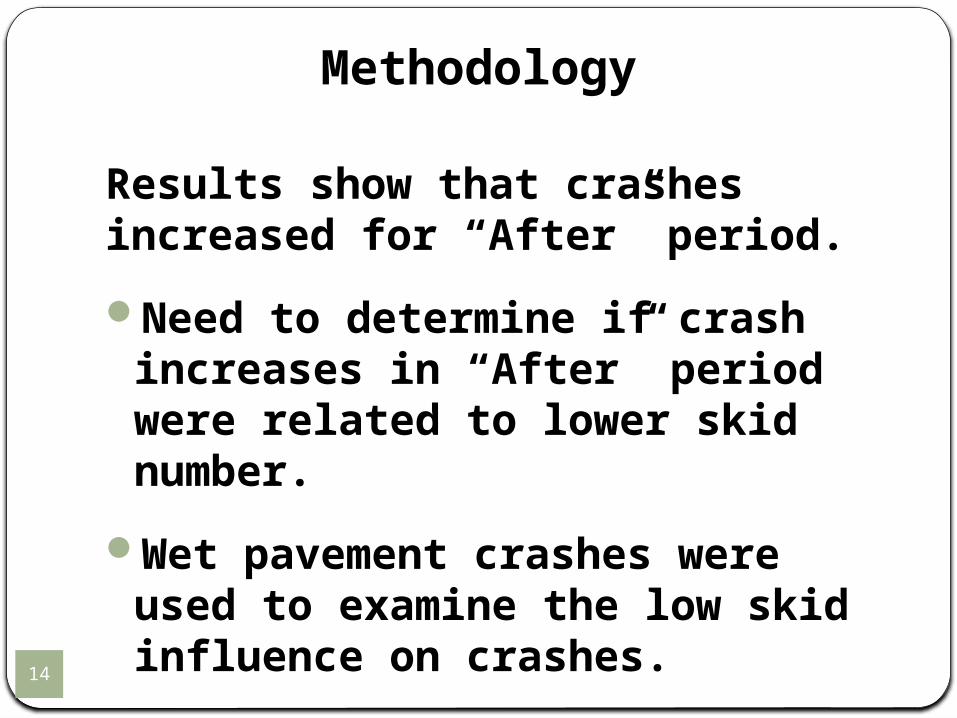
Methodology
Results show that crashes increased for “After” period.
Need to determine if crash increases in “After” period were related to lower skid number.
Wet pavement crashes were used to examine the low skid influence on crashes.
14
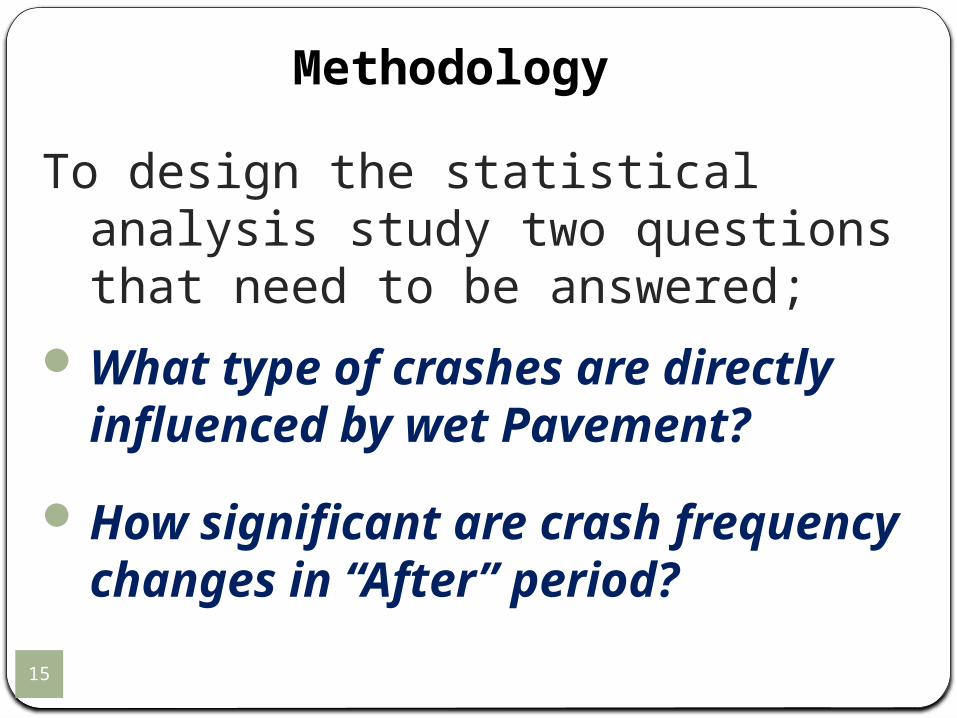
Methodology
To design the statistical analysis study two questions that need to be answered;
What type of crashes are directly influenced by wet Pavement?
How significant are crash frequency changes in “After” period?
15
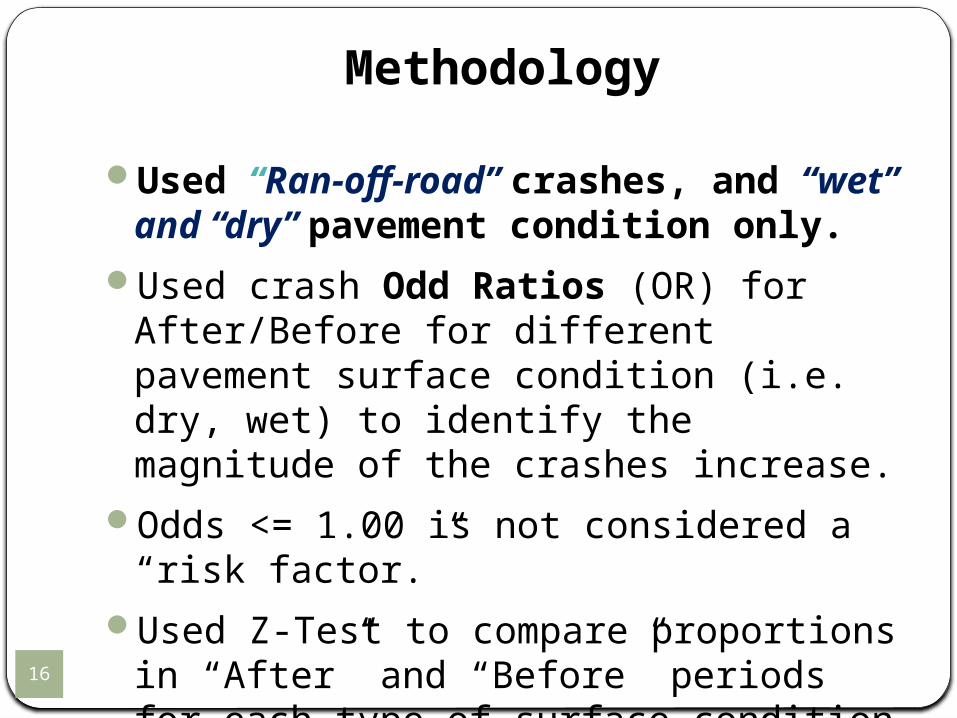
Methodology
Used “Ran-off-road” crashes, and “wet” and “dry” pavement condition only.
Used crash Odd Ratios (OR) for After/Before for different pavement surface condition (i.e. dry, wet) to identify the magnitude of the crashes increase.
Odds <= 1.00 is not considered a “risk factor.”Used Z-Test to compare proportions in “After” and
“Before” periods for each type of surface condition (only for odds>1).
16
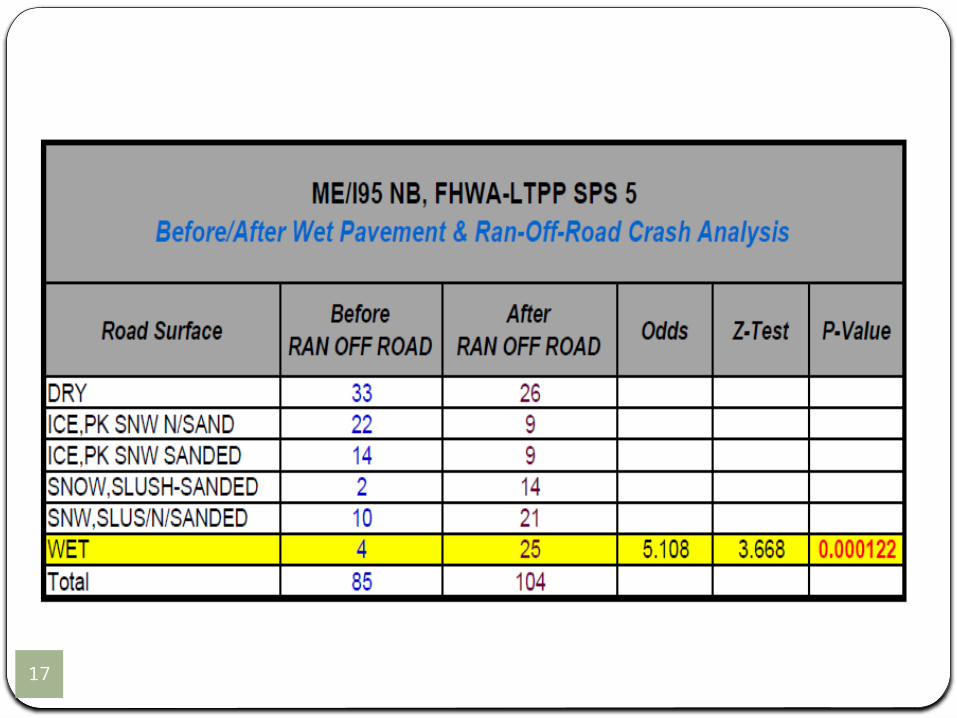
17
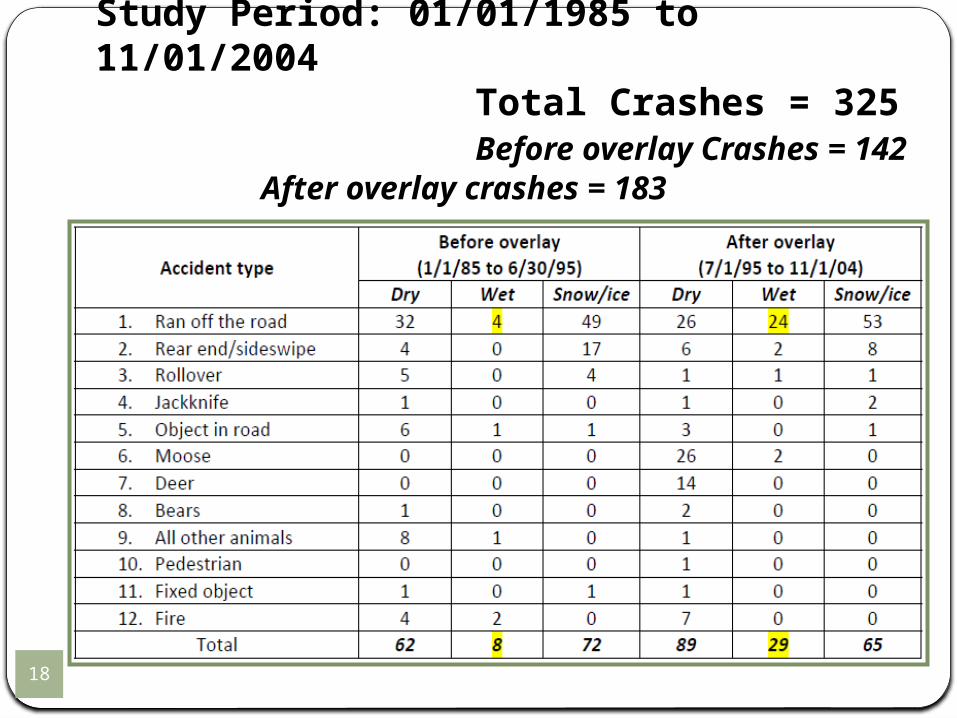
Study Period: 01/01/1985 to 11/01/2004 Total Crashes = 325 Before overlay Crashes = 142 After overlay crashes = 183
18
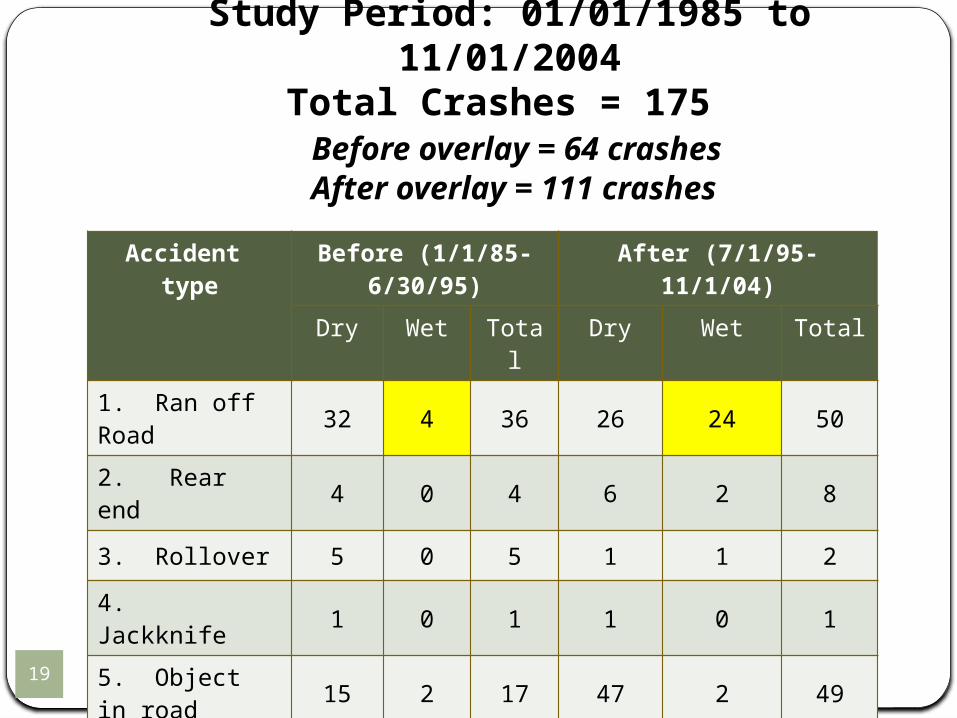
Study Period: 01/01/1985 to 11/01/2004Total Crashes = 175
Before overlay = 64 crashes After overlay = 111 crashes
19
Accident type
Before (1/1/85-6/30/95) After (7/1/95-11/1/04)
Dry Wet Total Dry Wet Total
1. Ran off Road 32 4 36 26 24 50
2. Rear end 4 0 4 6 2 8
3. Rollover 5 0 5 1 1 2
4. Jackknife 1 0 1 1 0 1
5. Object in road 15 2 17 47 2 49
6. Fixed object 1 0 1 1 0 1
Total 58 6 64 82 29 111
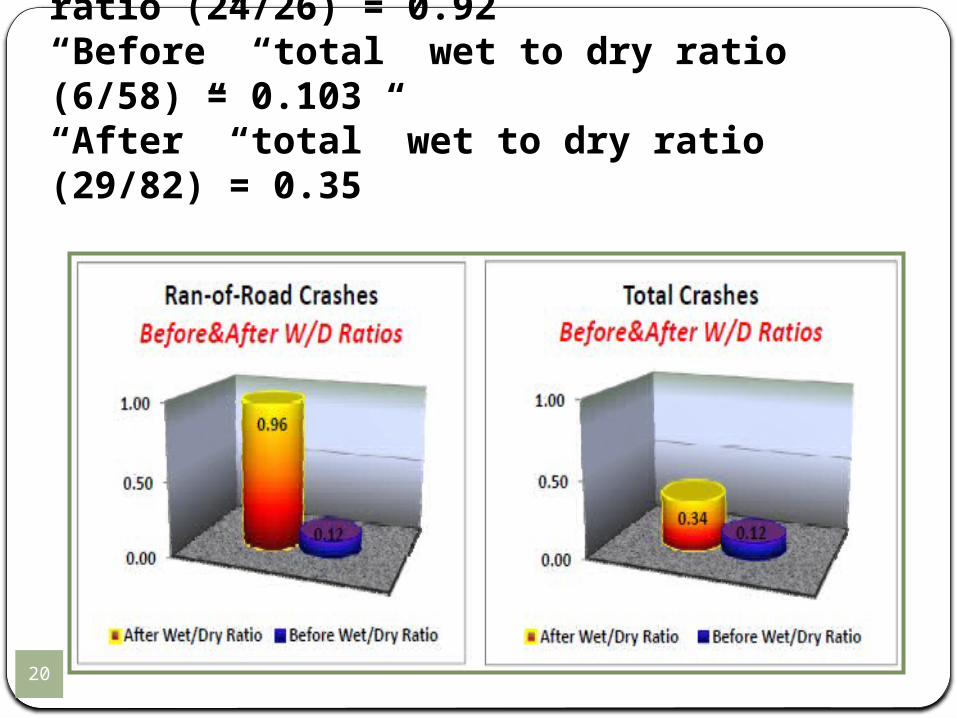
“Before” “ran-off-road” wet to dry ratio (4/32) = 0.125“After” “ran-off-road” wet to dry ratio (24/26) = 0.92“Before” “total” wet to dry ratio (6/58) = 0.103“After” “total” wet to dry ratio (29/82) = 0.35
20
ConclusionsWhen a 23 year old open graded friction course was
overlaid in 1995 with a dense graded hot mix asphalt concrete the four year average pavement skid number went from 66 to 44.
Reduced pavement friction after overlay is probably one of the factors that contributed to Þ 39% increase in ran-off-road crashes, and Þ 500% increase in ran-off-road crashes on “wet”
pavement.Þ Increase of ran-off-road crashes on “wet” pavement
in the “After” period is highly significant (P-Value= .00012)21
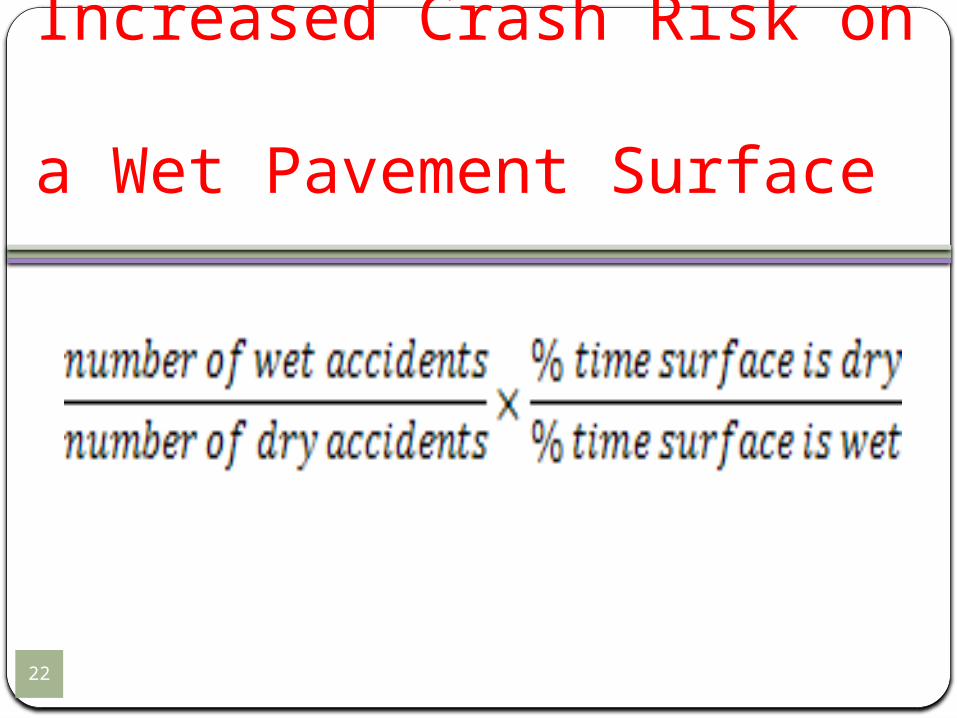
Increased Crash Risk on a Wet Pavement Surface
22
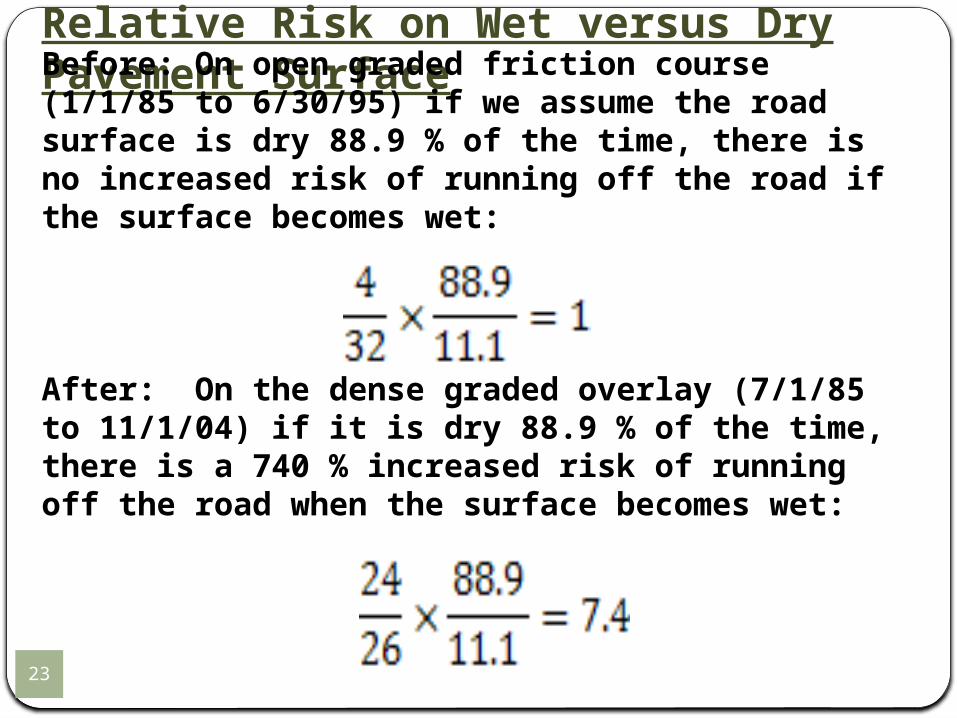
Relative Risk on Wet versus Dry Pavement SurfaceBefore: On open graded friction course (1/1/85 to 6/30/95) if we assume the road surface is dry 88.9 % of the time, there is no increased risk of running off the road if the surface becomes wet:
After: On the dense graded overlay (7/1/85 to 11/1/04) if it is dry 88.9 % of the time, there is a 740 % increased risk of running off the road when the surface becomes wet:
23

Thank you for your time and attention
24
Questions?Jim Sherwood and Roya Amjadi
[email protected]@dot.gov
Gerardo [email protected]

7th Symposium on Pavement Surface Characteristics SURF 2012
Smooth, Safe, Quiet, and Sustainable Travel through Innovative Technologies
Deadline for submission of abstracts: July 31, 2011
www.SURF2012.org
Norfolk, VA,
September, 19-21, 2012