Embed Size (px)
Citation preview

Jim Purcell
The Future of Arkansas Higher Education

Thomas Jefferson:
“I was a revolutionary so that my children could farm and so their children could do art.”

Davey Crockett
"If I could rest anywhere, it would be in Arkansas, where the men are of the real half-horse, half-alligator breed such as grows nowhere else on the face of the universal earth."

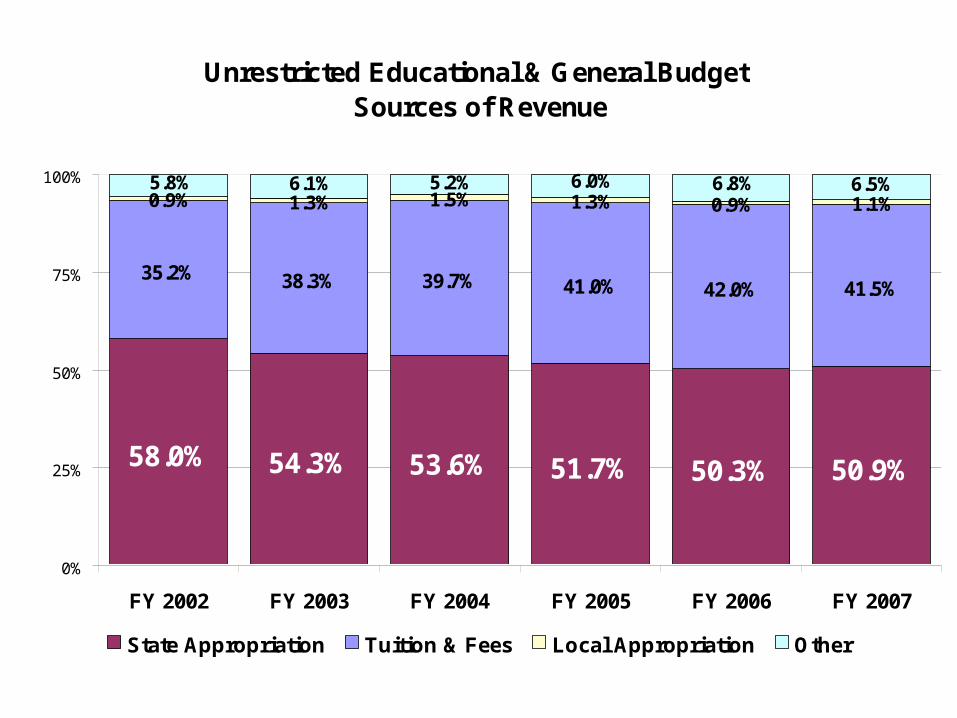
State Per Capita Personal Income v. Share of AdultPopulation with Bachelor's Degree or Higher (2005)
$16,000
$18,000
$20,000
$22,000
$24,000
$26,000
$28,000
$30,000
$32,000
$34,000
$36,000
$38,000
15% 20% 25% 30% 35% 40% 45% 50%
Percentage of Adult Population with a Bachelor's Degree or Higher
Per
Cap
ita
Inco
me
Source: U.S. Census Bureau, ACS 2005
DC
TX
NM
FL
NDNC
AL
IN
LA
MIWI
SD
WY
TN
NV
AR
IAOH
ID
SCKY
MS
WV
MO
MEAZ
VA
NJ
PA
MD
MT
CT
MA
CO
NE
AK
GA
HI
KS
OR
DE
IL
RI MN
WA
UT
VT
NHNY
CA
OK
No state with a low proportion of
Bachelor’s degrees has a high per capita
income.
No state with a high proportion of
Bachelor’s degrees has a low per capita
income.

Investing in Higher Education• Arizona Gov. Janet Napolitano (D) proposed a compact with the state’s eighth-graders: Stay out
of trouble and get Bs in high school, and we’ll give you a college education. Napolitano also pledged to double the number of bachelor’s degrees awarded by her state’s colleges by 2020.
• Michigan Gov. Jennifer Granholm (D) also set a goal of doubling the number of college graduates. She wants to expand a pilot program that gives students an associate college degree after a five-year high school program and reward colleges that manage to graduate students, as opposed to just enrolling them.
• West Virginia Gov. Joe Manchin III (D) includes $50 million for the “Bucks for Brains” initiative to recruit faculty and build infrastructure with the goal of finding success in fields that could result in profits.
• Ohio Gov. Ted Strickland (D): wants to pay for students to spend their final year of high school on a college campus for free. He also wants to make Ohio one of the 10 least-expensive states to attend college.
• Tennessee’s Phil Bredesen (D) suggested lowering the GPA threshold that college students must maintain to keep their Hope Scholarship from a 3.0 to 2.75.
• South Dakota’s Mike Rounds (R) said another 200 students could join the 3,465 who already receive the state’s Opportunity Scholarships if the ACT score requirement were lowered from 24 to 23
• Missouri’s Matt Blunt (R) asked for $100 million for Access Missouri scholarships, a sum that would quadruple the state’s investment in need-based grants.
• Idaho’s C.L. "Butch" Otter (R) proposed in his address Jan. 7 spending $50 million for scholarships for low-income students.

• More impressive is that governors are proposing the funding increases in what promises to be a tough budget year. Usually in times of financial distress, higher education is one of the first areas to suffer spending cuts.
• “A lot more governors now realize that their systems of higher education are really their major economic strategy for the future, … that (companies) go to where you have highly skilled workers,” – Raymond Scheppach, executive director of the National
Governors Association (NGA).
Investing in Higher Education

• up to 50 percent of America’s adult population today lacks the advanced skills that are the foundation for most future high-paying jobs in today’s complex knowledge economy.
Arkansas: • BLS assures us that over the long
term, labor supply and demand will balance. (pg 18)
The 2010 MeltdownSolving the Impending Jobs Crisis
Edward E. Gordon
• Strengthening the Arkansas Education Pipeline

4641
29
1612
4
100
74
9th GradeEnrollment
High SchoolGrads
EnrolledDirectly into
College
First-timeFull-timeDegreeSeekingCohort
RetainedAfter 1 Year
GraduatedWithin 6Years
WithAssociate
Degree
WithBachelorDegree
Percent 96-97 Arkansas 9th Grader’s Progression into High School and College (percent)
100%
71%
28%
Fall 2000 College Freshmen

96-97 Arkansas 9th Grader’s Progression into High School and College (number)
17,11615,172
10,701
5,817
37,160
1,4934,324
27,335
9th GradeEnrollment
High SchoolGrads
EnrolledDirectly into
College
First-timeFull-timeDegreeSeekingCohort
RetainedAfter 1 Year
GraduatedWithin 6Years
WithAssociate
Degree
WithBachelorDegree
Fall 2000 College Freshmen
100%
71%28%

• 28,53228,532 Arkansas high school graduates
• How many high school graduates in
Dallas/Fort Worth MSA?
• All of Texas
• US
• China
40,906
240,485240,485
3,152,0003,152,000
9,500,0009,500,000
Competing Globally

Catching Up• What can be done? What is possible?
What are the issues?
• What is the solution?
• Will Arkansas seek to participate in the modern-global-technological society in a capacity other than being a provider of low-skilled cheap labor?

Arkansas College-Going Rate
59.4%
63.9%
62.0%
59.3%
60.9%60.8%
55%
60%
65%
2000-01 2001-02 2002-03 2003-04 2004-05 2005-06Source: Arkansas Higher Education Information System

Arkansas_cnty.shp12 - 2526 - 4950 - 74
Reading Remediation Rates by CountyFall 2007
% Needing Remediation
First-time entering (full- and part-time) students seeking an associate or baccalaureate degree.

Arkansas_cnty.shp16 - 2526 - 4950 - 69
English Remediation Rates by CountyFall 2007
% Needing Remediation
First-time entering (full- and part-time) students seeking an associate or baccalaureate degree.

Arkansas_cnty.shp23 - 2526 - 4950 - 81
% Needing Remediation
Math Remediation Rates by CountyFall 2007
First-time entering (full- and part-time) students seeking an associate or baccalaureate degree.

Arkansas_cnty.shp33 - 4950 - 7475 - 93
% Needing Remediation
Unduplicated Remediation Rates by CountyFall 2007
First-time entering (full- and part-time) students seeking an associate or baccalaureate degree.

All Remedial
English Math Reading
% % % %ASUJ 1,733 46.68% 28.16% 38.72% 25.45%ATU 1,543 42.90% 25.92% 34.28% 22.29%HSU 803 38.11% 23.66% 30.76% 20.67%SAUM 537 55.87% 40.97% 42.27% 37.43%UAF 2899 10.93% 3.69% 7.07% 3.73%UAFS 1,138 44.02% 18.63% 38.05% 15.82%UALR 862 54.99% 33.76% 43.16% 31.55%UAM 533 64.73% 46.53% 56.10% 43.15%UAPB 819 91.70% 75.46% 84.86% 73.63%UCA 1,793 29.89% 4.13% 28.00% 6.97%
Total Four-Year 12,660 39.50% 22.50% 33.02% 21.09%
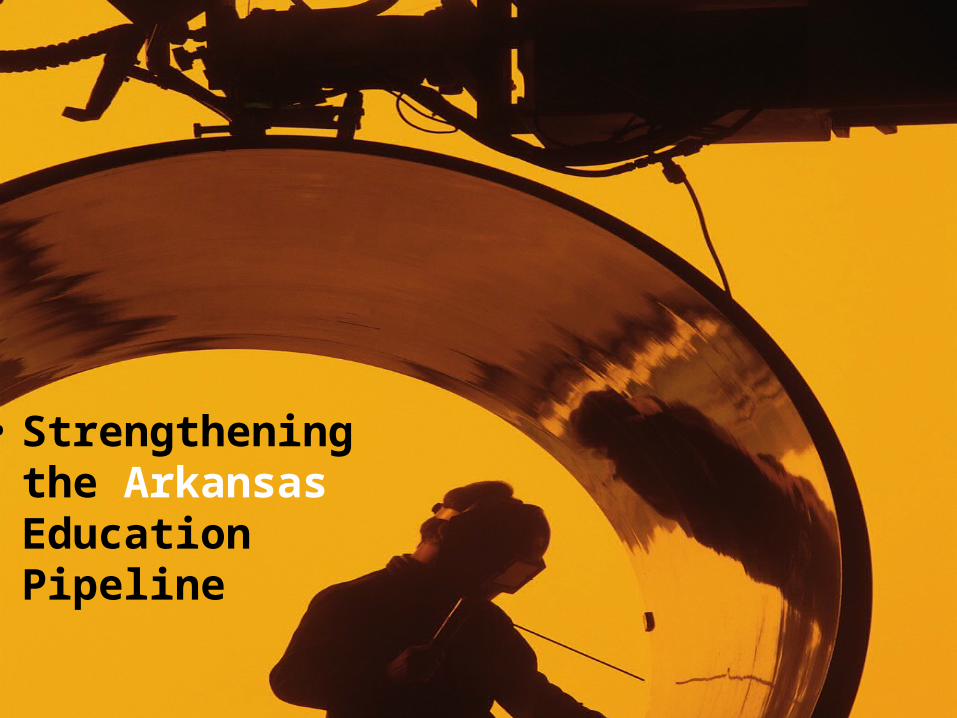
Unduplicated Number of Fall First-Time Freshmen Assigned to Remediation for 2007-2008
InstitutionFirst-Time Freshmen
All Remedial
English Math Reading
% % % %ANC 298 84.90% 55.03% 81.54% 52.35%ASUB 775 62.97% 38.32% 56.52% 31.10%ASUMH 175 64.57% 34.86% 51.43% 26.29%ASUN 153 79.74% 58.17% 71.90% 45.10%BRTC 319 72.41% 52.98% 52.66% 42.95%CCCUA 152 82.24% 60.53% 76.97% 54.61%EACC 256 84.38% 60.94% 70.31% 58.59%MSCC 280 80.00% 60.36% 70.36% 54.29%NAC 322 63.98% 42.55% 43.48% 34.16%NPCC 304 83.88% 49.01% 80.26% 38.16%NWACC 1,116 72.58% 38.35% 59.59% 30.82%OTC 131 75.57% 38.93% 70.99% 28.24%OZC 228 69.30% 47.81% 46.49% 34.21%PCCUA 75 86.67% 66.67% 72.00% 64.00%PTC 1,034 87.72% 54.26% 84.24% 53.58%RMCC 111 72.07% 40.54% 52.25% 33.33%SACC 137 87.59% 64.23% 78.83% 62.04%SAUT 160 85.00% 58.75% 74.38% 57.50%SEAC 166 86.75% 65.06% 79.52% 44.58%UACCB 216 77.78% 50.46% 70.83% 41.67%UACCH 195 79.49% 42.05% 65.13% 43.59%UACCM 453 73.95% 45.92% 65.78% 40.40%Total Two-Year 7,056 76.67% 48.41% 66.77% 42.05%
Unduplicated Number of Fall First-Time Freshmen Assigned to Remediation for 2007-2008
InstitutionFirst-Time Freshmen

Cost of Remediation
$53,800,000Equivalent to the combined budget of seven of Arkansas’s community colleges.

Certificates and Degrees Awarded by Level2006-07
Post-FP Certificate, 1571%
First-Professional, 5032%
Post-Bacc Certificate , 960%
Master's, 2,71812%
Specialist, 480%
Doctoral, 2151%
Bachelor's , 9,18839%
Adv Certificate, 20%
Associates , 5,53423%
Certificate, 5,12422%
Certificate Associates Adv Certificate Bachelor's Post-Bacc Certificate Master's Specialist Doctoral First-Professional Post-FP Certificate

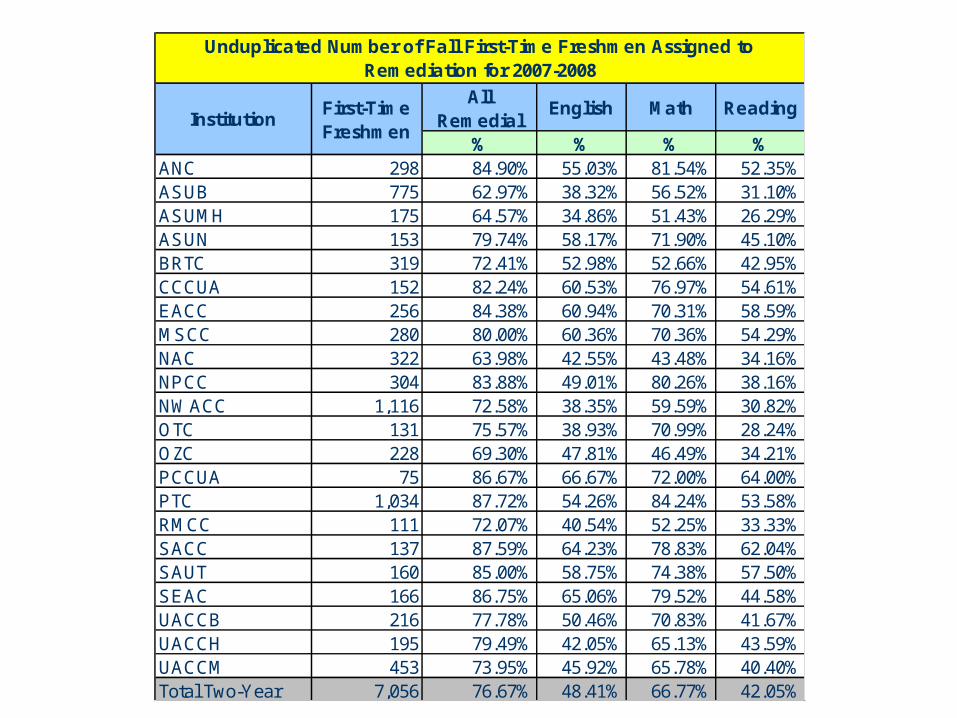
Unrestricted Educational & General Budget Sources of Revenue
58.0% 54.3% 53.6% 51.7% 50.3% 50.9%
35.2% 38.3% 39.7% 41.0% 42.0% 41.5%
0.9% 1.3% 1.5% 1.3% 0.9% 1.1%6.5%6.8%6.0%5.2%6.1%5.8%
0%
25%
50%
75%
100%
FY 2002 FY 2003 FY 2004 FY 2005 FY 2006 FY 2007
State Appropriation Tuition & Fees Local Appropriation Other
During the 1980’s what percent of college and university budgets consisted of State Funds? 69 to 70%
64%1992?
2001? 60%

Unrestricted Educational & General Budget Sources of Revenue
58.0% 54.3% 53.6% 51.7% 50.3% 50.9%
35.2% 38.3% 39.7% 41.0% 42.0% 41.5%
0.9% 1.3% 1.5% 1.3% 0.9% 1.1%6.5%6.8%6.0%5.2%6.1%5.8%
0%
25%
50%
75%
100%
FY 2002 FY 2003 FY 2004 FY 2005 FY 2006 FY 2007
State Appropriation Tuition & Fees Local Appropriation Other

Academic Challenge/Governor's Scholarship, State Need-Based Aid, Institutional Scholarships, Student Loans
(in $millions)
13.924.97 24.83
2.9 3.44
34.77
66.2185.85
141.59
215.42
330.92
395.73
$0
$50
$100
$150
$200
$250
$300
$350
$400
$450
'98 '99 '00 '01 '02 '03 '04 '05 '06 '07
Academic Challenge/Governor's Scholarship State Need-Based Aid
Institutional Scholarships Student Loans

State Per Capita Personal Income v. Share of AdultPopulation with Bachelor's Degree or Higher (2005)
$16,000
$18,000
$20,000
$22,000
$24,000
$26,000
$28,000
$30,000
$32,000
$34,000
$36,000
$38,000
15% 20% 25% 30% 35% 40% 45% 50%
Percentage of Adult Population with a Bachelor's Degree or Higher
Per
Cap
ita
Inco
me
Source: U.S. Census Bureau, ACS 2005
DC
TX
NM
FL
NDNC
AL
IN
LA
MIWI
SD
WY
TN
NV
AR
IAOH
ID
SC
OK
KY
MS
WV
MO
MEAZ
VA
NJ
PA
MD
MT
CT
MA
CO
NE
AK
GA
HI
KS
OR
DE
IL
RI MN
WA
UT
VT
NHNY
CA
OK00OK05
OK
No state with a low proportion of
Bachelor’s degrees has a high per capita
income.
No state with a high proportion of
Bachelor’s degrees has a low per capita
income.
From 2000 to 2004, Oklahoma increased in the number of bachelor’s degrees for Oklahomans age 25 and older from 20.2 to 22.2 and from 46th to 42nd in the state rankings.

Higher Education Initiatives• Increasing Awareness, Access & Opportunity –
• Improving the Educational Experience –
• Addressing Economic Development –
• Incentivizing Institutional performance –
Academic Challenge, Workforce Improvement Grant, Governor’s Scholars, Concurrent Enrollment, EPSCOR, EPAS, Smart Core, ACHIEVE/NGA Honors State, Career Pathways, YOU Program
ACTS, program alignment, SURF, Washington Center Internship
Workforce Cabinet, Teacher shortages, 2-year College Economic Initiatives
???
GEAR-UP, EPAS, ACE, Student Portal, EPSCOR outreach, Concurrent Enrollment, Cooperative Alliances, OHLAP & Academic Scholars
OKLAHOMA ARKANSAS
Retention strategies, program alignment, Programs of Excellence
Oklahoma Research Initiative, EPSCOR, Internships, workforce alliances (Nursing & Allied Health, Tinker, etc.)
Rewarding institutions for degree production and on-time graduation, as well as for achieving intermediate benchmarks.

Brain GainPerformance Funding
Beginning with FY02:
These measures emphasize degree production, retention rates, and graduation rates.
Degrees Conferred . . . . . 25%
Retention Rates. . . . . . . . 30%
Graduation Rates. . . . . . . 25%
2 Institutional-Specific . . 10% each

8,354
6,5226,766 7,479
8,002 8,155
15,257
12,47612,783
13,148 13,767
14,631
4,000
6,000
8,000
10,000
12,000
14,000
16,000
2000-01 2001-02 2002-03 2003-04 2004-05 2005-06
Oklahoma Degrees ConferredBachelor’s
Associate
22%
28%

Associate and Bachelor's Degrees Conferred
19,021 19,021 19,021 19,021 19,021 19,021
590 590 590 590 590
1,103 1,103 1,103 1,103
1,163 1,163 1,163
1,031 1,031
781
12,000
14,000
16,000
18,000
20,000
22,000
24,000
26,000
2000-01 2001-02 2002-03 2003-04 2004-05 2005-2006
Base Added 2001-02 Added 2002-03 Added 2003-04 Added 2004-05
Enrollment during this same time period only increased 10%.
Since 2000-01, a total of 4,668 additional degrees (+24.5%) have been
awarded across the State System.
OKLAHOMA

Associate and Bachelor's Degrees Conferred
11,810 11,810 11,810 11,810 11,810 11,810
1,066 1,066 1,066 1,066 1,066
401 401 401 401
537 537 537
380 380
528
10,000
11,000
12,000
13,000
14,000
15,000
2001-02 2002-03 2003-04 2004-05 2005-06 2006-07
Base Added 2002-03 Added 2003-04 Added 2004-05 Added 2005-06
Enrollment during this same time period increased 21%.
Since 2001-02, a total of 2,912 additional degrees (+24.7%) have been
awarded across the State System.
ARKANSAS

Workforce Development
• $4.5 million to increase academic programs at institutions offering nursing and allied health care programs.
• This will produce an additional 300 registered nurses, 130 allied health professionals and 15 additional masters level nursing faculty members annually.
• Based upon geography and industry shortages.
Workforce and Economic Development

Registered Nursing Pipeline (Only Public Colleges and Universities)
35
92
444
579
648
1027
2375
44
175
287
321
326
494
731
0 1000 2000 3000
Grads who got a job OUTSIDE Oklahoma
Grads who planned to continue their education
Grads who got a job in Oklahoma
Grads who got a job within 6 month
Passed licensure
Admitted applicants
Qualified Applicants
Grads who got a job OUTSIDE Oklahoma
Grads who planned to continue their education
Grads who got a job in Oklahoma
Passed licensure
Grads who got a job within 6 month
Admitted applicants
Qualified Applicants
Ass
oci
ate
Bac
cala
ure
ate
(2004 Data)
Only 68% of BSN qualified applicants are admitted into programs
Only 43% of qualified ADN applicants are admitted into programs


A Plan

“Speed to Market and Close to Customer”
Ed Barlow, Futurist

1. Implement a series of initiatives that expedite the number of degrees produced and the speed at which degrees are produced.
2. Enhance the production of degrees in high –demand programs that are needed for the modern Arkansas economy.
3. Incentivize students to complete a degree and to work in Arkansas.
“Speed to Market and Close to Customer”

1. A continuation of the current need-based funding formula with slight equity modifications
2. A separate performance funding formula coordinated by ADHE Emphasis on increasing the # of associate and bachelor degrees as fast as possible.
3. State-wide annual enrollment management workshop
4. Continue improving the college matriculation process: remediation, course articulation, advising
5. Expand concurrent enrollment
10M a
60K a
The Plan: “Speed to Market and Close to Customer”
1. Implement a series of initiatives that expedite the number of degrees produced and the speed at which degrees are produced.

1. Offer Competitive grants to address geographic workforce shortages. for program expansions -probably healthcare in first cycle –awards will be added to the institution’s base if degree targets are met within prescribed time period.
2. Establish closer ties with Business and Industry for the purposes of becoming more responsive.
3. Offer Competitive grants for the purpose of identifying academic/ technical programs as “Centers of Excellence.” Selected programs would illustrate quality, attract and graduate a large number of students. Awards will be added to the institution’s base if degree targets are met
5.0M y1 a
7.5M y2 a
1.5M a
The Plan: “Speed to Market and Close to Customer”
2. Enhance the production of degrees in high –demand programs that are needed for the modern Arkansas economy.

1. Degree completion initiatives
2. Adult financial aid or tax credits (?)
3. Streamline state financial aid programs including the reduction of loan repayment programs.
4. Add state funds for work-study programs
5. Transfer scholarships
6. Expand internship/work opportunities
7. Training institutions on how to best package financial aid for maximum impact.
500K a
10M a
The Plan: “Speed to Market and Close to Customer”
3. Incentivize students to complete a degree program and to work in Arkansas.
$ 29,560,000 a

Will it work?

Fall Enrollments at AR Public Institutions
Total Two-Year
37,58238,177
38,883
41,036
39,262
41,27542,130
43,217 43,218
45,052
35,000
37,000
39,000
41,000
43,000
45,000
47,000
1998 1999 2000 2001 2002 2003 2004 2005 2006 2007
Total Two-Year

Fall Enrollments at AR Public Institutions
Total Four-Year
60,161 60,812 61,324 62,704
69,58271,824 73,009
74,788 75,506 76,131
40,000
45,000
50,000
55,000
60,000
65,000
70,000
75,000
80,000
1998 1999 2000 2001 2002 2003 2004 2005 2006 2007
Total Four-Year

36.6%
22.1%
-6.6%
68.1%
-10.0%
0.0%
10.0%
20.0%
30.0%
40.0%
50.0%
60.0%
70.0%
80.0%
Geo
rgia
K
entu
cky
Ari
zon
a T
exas
M
inn
eso
ta
Nev
ada
Ark
ansa
s N
ort
h C
aro
lina
Idah
o
Okl
aho
ma
Mar
ylan
d
Mis
sou
ri
New
Jer
sey
Wes
t V
irg
inia
F
lori
da
Ind
ian
a W
yom
ing
M
issi
ssip
pi
Co
lora
do
V
irg
inia
U
tah
O
reg
on
M
ich
igan
Io
wa
Un
ited
Sta
tes
New
Mex
ico
M
on
tan
a W
isco
nsi
n
Mas
sach
use
tts
Cal
ifo
rnia
W
ash
ing
ton
S
ou
th C
aro
lina
Ten
nes
see
Mai
ne
Pen
nsy
lvan
ia
Ala
bam
a C
on
nec
ticu
t O
hio
N
ebra
ska
So
uth
Dak
ota
V
erm
on
t D
C
Kan
sas
Del
awar
e Ill
ino
is
New
Ala
ska
New
Yo
rk
Haw
aii
Lo
uis
ian
a N
ort
h D
ako
ta
Rh
od
e Is
lan
d
Growth in Associate Degrees Awarded by Public Institutions by State from 1999-2000 to 2004-2005
SOURCE: U.S. Department of Education, National Center for Education Statistics, Integrated Postsecondary Education Data System (IPEDS), "Completions" survey.
Arkansas ranks 7th in the growth of associate degrees since 1999-2000

18.9%
35.6%
15.0%
-20.6%
-30.0%
-20.0%
-10.0%
0.0%
10.0%
20.0%
30.0%
40.0%
Uta
h
Nev
ada
Min
nes
ota
G
eorg
ia
Flo
rid
a C
alif
orn
ia
Mai
ne
Ore
go
n
Mar
ylan
d
Pen
nsy
lvan
ia
Ark
ansa
s T
exas
In
dia
na
Okl
aho
ma
New
Jer
sey
Co
lora
do
A
rizo
na
So
uth
Car
olin
a K
ansa
s U
nit
ed S
tate
sO
hio
Id
aho
N
ort
h C
aro
lina
Wis
con
sin
W
ash
ing
ton
C
on
nec
ticu
t K
entu
cky
Mic
hig
an
Ten
nes
see
Mis
sou
ri
New
Yo
rk
Vir
gin
ia
Iow
a W
est
Vir
gin
ia
Mas
sach
use
tts
No
rth
Dak
ota
N
ew M
exic
o
Del
awar
e M
issi
ssip
pi
Rh
od
e Is
lan
d
Haw
aii
Lo
uis
ian
a A
lask
a Ill
ino
is
New
Ham
psh
ire
Mo
nta
na
Neb
rask
a V
erm
on
t A
lab
ama
Wyo
min
g
So
uth
Dak
ota
D
C
Growth in Bachelor’s Degrees Awarded by Public Institutions by State from 1999-2000 to 2004-2005
SOURCE: U.S. Department of Education, National Center for Education Statistics, Integrated Postsecondary Education Data System (IPEDS), "Completions" survey.
Arkansas ranks 11th in the growth of bachelor’s degrees since 1999-2000

• Close to customer and speed to market

16.3% - 23.3%
23.6% - 29.7%
30.5% - 37.4%
State Population Age 25 Years and Older with Bachelor’s Degree or Higher, 2004

civic involvementcivic involvementvolunteer activity by
education levels
Bureau of Labor Statistics. (2003). Volunteering in the United States, 2003. USDL03-888. U.S. Department of Labor.
50%
40%
30%
20%
10%
0%
Less Than High School
Diploma
High School Diploma
Some College
B.A. or Higher
9.9%(48 hours)
21.7%(48 hours)
34.1%(52 hours)
45.6% (60 hours)
Per
cent
age
Vol
unte
erin
g
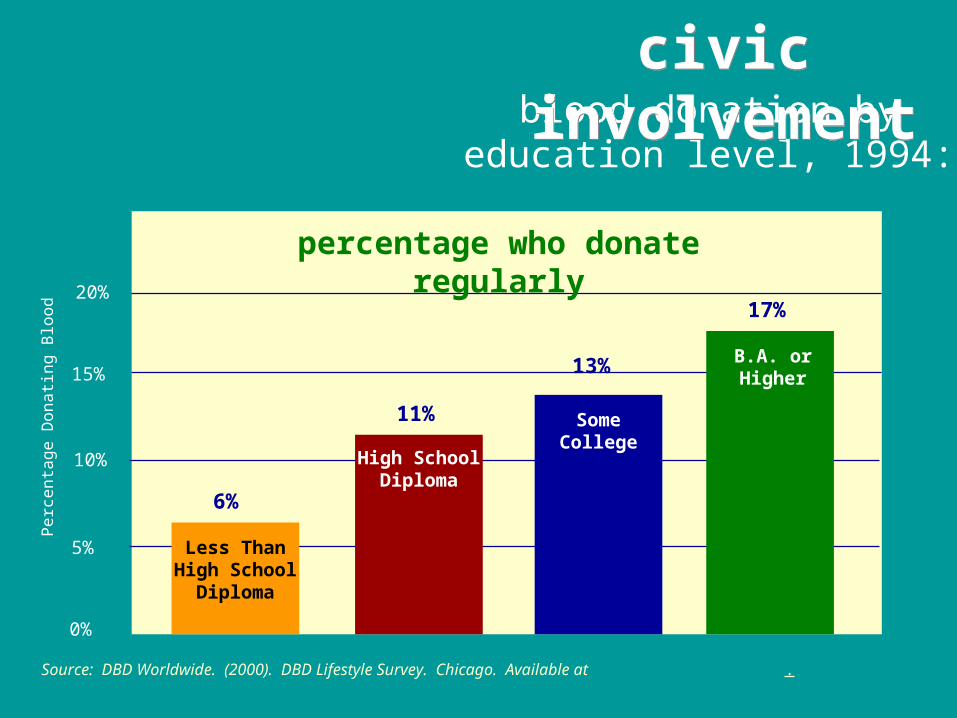
blood donation by education level, 1994:
Source: DBD Worldwide. (2000). DBD Lifestyle Survey. Chicago. Available at www.bowlingalone.com.
20%
15%
10%
5%
0%
Less Than High School
Diploma
High School Diploma
Some College
B.A. or Higher
6%
11%
13%
17%
Pe
rce
nta
ge
Do
na
ting
Blo
od
percentage who donate regularly
civic involvementcivic involvement

participation assistance programs
Source: Postsecondary Education Opportunity, May 28, 1997, pg 47.
Less Than High School
Diploma
High School Diploma
Some College& Bachelor’s
Degree or More
24.3%
10.2%
4.6%
Ever Participated in Assistance Programs
education level
governmentgovernment

governmentgovernmentincarceration rates by incarceration rates by
education levelseducation levels
2.5%
2.0%
1.5%
1.0%
0.5%
0.0%
Less Than High School
Diploma
High School Diploma
Some CollegeB.A. or Higher
1.9%
1.2%
0.3%0.1%
Per
cent
age
Inca
rcer
ated
Source: Harlow, C.W. (2003). Education and Correctional Populations. Bureau of Justice Statistics, Department of Justice. NCJ195670.

economicPercent Below Poverty
Threshold, 2004
economicPercent Below Poverty
Threshold, 2004
Census Bureau
40%
30%
10%
0%
Less Than High School
Diploma
High School Diploma
Some College
B.A. or Higher
32%
15%
10%
4%
Per
cent
age
Hom
e O
wne
rshi
p
20%

economiceconomicunemployment rates and unemployment rates and
education level, 2004education level, 2004
Source: Employment Policy Institute
10
8
6
4
2
0
Less Than High School
Diploma
High School Diploma
Some CollegeB.A. or Higher
9.7%
7.5%
5.1%4.6%

Quality of LifeQuality of LifeHome Ownership
Census Bureau, American Housing Survey for the United States:2005
80%
70%
60%
50%
Less Than High School
Diploma
High School Diploma Some College
B.A. or Higher
58%
69%66%
75%
Per
cent
age
Hom
e O
wne
rshi
p

Seatbelt Use while intoxicated, 1990
Source: American Journal of Public Health
80%
60%
40%
20%
0%
Less Than High School
Diploma
High School Diploma
Some College
B.A. or Higher
39%41%
52%
66%
Pe
rce
nta
ge
Do
na
ting
Blo
od
percentage who use seatbelt
SafetySafety
15%20%
31%
78%

economiceconomic
Average family income by educational
attainment, 2003
Source: Postsecondary Education Opportunity, 2005
25
175
50
100
75
125
150
0LT-9 9-12 HSG Some ProfMA PhDBAAA
Inco
me
($00
0)
College

3,798,9405,254,193Professional degree
2,527,3243,982,577Doctorate
1,507,8232,963,076Master's degree
$1,111,921$2,567,174Bachelor's degree
346,1201,801,373Associate degree
270,5691,725,822Some college, no degree
01,455,253High school graduate
-304,5551,150,698High school dropout
-$478,903$976,350Less than 9th grade
DifferenceCompared to
High School Graduate
EstimatedLifetimeEarnings
Education Level
Source: Federal Reserve Bank of Dallas, 2005
The Impact of Education on Individuals:Lifetime Earnings
economiceconomic

Nearly all economic growth and prosperity for individuals, families, cities, states, and the country is now driven by college educated workers.
Those individuals, families, cities, states and –increasingly—countries with the most education are prospering, while those with the least higher education are experiencing relative and often absolute economic decline.
--Postsecondary Education OPPORTUNITY, June 2005.
Time and Place