Embed Size (px)
Citation preview

Jim Kinter
COLA
Regional Climate Prediction and Projection: Balancing Scientific Reality & Societal Need
UT Austin
4 April 2014

UT Austin April 2014 – Jim Kinter
COLA News
is now
We are pleased to announce that the Center for Ocean-Land-Atmosphere Studies (COLA) has become an integral part of George Mason University. COLA staff and the COLA computing facility are now collocated with the Climate Dynamics (CLIM) faculty and students and the Atmospheric, Oceanic and Earth Sciences (AOES) department on the GMU main campus in Fairfax, Virginia.
Research Hall at Mason New Home of COLA and CLIM
Jim Kinter,Director, COLA
Barry Klinger,Graduate Coordinator, AOES
J. Shukla, Director, CLIM
Paul Schopf,Chair, AOES

UT Austin April 2014 – Jim Kinter
Department of
Atmospheric, Oceanic,
and Earth Sciences
Faculty
• T. DelSole; PhD, Harvard• P. Dirmeyer; PhD, Univ. of Maryland• B. Huang; PhD, Univ. of Maryland • J. Kinter; PhD, Princeton• B. Klinger; PhD, MIT/WHOI
• E. Schneider; PhD, Harvard• P. Schopf (chair, AOES); PhD, Princeton• J. Shukla (director); PhD, BHU; Sc.D., MIT • C. Stan; PhD, Colorado State Univ.• D. Straus; PhD, Cornell
GMU Ph.D. Program Climate Dynamics
CURRENT SEARCH: 2 ASST. PROFs

UT Austin April 2014 – Jim Kinter
Issues in Global Climate Change

UT Austin April 2014 – Jim Kinter
Issues in Global Climate Change
Scientific questions– How and by how much is the
Earth’s climate varying and changing?
– What are the processes, responsible for climate variability and change? How can we detect/attribute changes to human activities?
– Can we predict where, how much and at what rate climate will vary and change in the future?
Socioeconomic questions– What are the impacts of climate
variability and change on human socio-economic systems and natural ecosystems ?
– How can human activities be held accountable?
– Can we take advantage of the positive effects and minimize, mitigate or adapt to the negative effects?
– What local, national and international strategies can or should be employed?
Comfort Zone

UT Austin April 2014 – Jim Kinter
Issues in Global Climate Change
Scientific questions– How and by how much is the
Earth’s climate varying and changing?
– What are the processes, responsible for climate variability and change? How can we detect/attribute changes to human activities?
– Can we predict where, how much and at what rate climate will vary and change in the future?
Socioeconomic questions– What are the impacts of climate
variability and change on human socio-economic systems and natural ecosystems ?
– How can human activities be held accountable?
– Can we take advantage of the positive effects and minimize, mitigate or adapt to the negative effects?
– What local, national and international strategies can or should be employed?
Growing Demand

UT Austin April 2014 – Jim Kinter
Balancing Scientific Reality and Societal Needs
• Communication– “Simple, clear messages repeated often by trusted sources.”
(Ed Maibach, Director, GMU Center for Climate Change Communication)
• Transparency– Documentation, lineage and provenance
• Free, Open Data Access– Universal accessibility and utility
• Assessments– Means and variability– Predictability, uncertainty and confidence– Vulnerability and risk
• Translation Services– Climate simulations climate narratives
• Decision Support– Local and regional decision-makers

UT Austin April 2014 – Jim Kinter
Communication: Societal Demand
for Climate Information
America’s Climate Choices
ADVANCE
SCIENCE
INFORM
ADAPT
LIM
IT
National Research Council2010
It takes 4 volumes to deliver this simple, clear message!

UT Austin April 2014 – Jim Kinter
Transparency
• Coupled Model Intercomparison Project (CMIP) – 2013 completion of CMIP5
• Documentation of: – Models (scholarly literature, user guides)– Experimental protocols (CMIP5, CMIP6, …)– Full workflow (pre- and post-processing)– Model lineage and provenance – e.g., what were
model’s predecessors and how was model tuned (metrics, tolerances, parameters)
• Extensive diagnostic projects– NOAA MAPP CMIP5 Task Force

UT Austin April 2014 – Jim Kinter
Free, Open Data Access
• Cautionary tale #1: Michael Mann and the “Hockey Stick”
• Cautionary tale #2: “Climate-gate”• Additional tension: Proprietary data period vs.
openness• White House Climate Data Initiative
– http://www.whitehouse.gov/blog/2014/03/19/climate-data-initiative-launches-strong-public-and-private-sector-commitments
• Climate Models: – Data accessible via ESGF– Are the data intelligible to non-specialists? Should
data access be restricted on that account?

UT Austin April 2014 – Jim Kinter
Example of Data Access – USGS NEX-DCP30 Viewer
Select• Month, Annual (September)• CMIP5 Model (HadGEM2)• Tmax, Tmin, Precip (Precip)• CONUS, States (CONUS)• Scenario (RCP8.5)
http://www.usgs.gov/climate_landuse/clu_rd/apps/nex-dcp30_viewer.asp

UT Austin April 2014 – Jim Kinter
Example of Data Access – USGS NEX-DCP30 Viewer
Select• Histogram, Time Series, Tables• Model documentation• Scenario – RCP 4.5 or 8.5 • Period - early, mid- or late 21st C)• Scenario (RCP8.5)
September HadGEM2 ΔPrecip(RCP8.5) for CONUS
http://www.usgs.gov/climate_landuse/clu_rd/apps/nex-dcp30_viewer.asp

UT Austin April 2014 – Jim Kinter
Example of Data Access – USGS NEX-DCP30 Viewer
Travis County, TX – drier springby late 21st C under RCP4.5, according to HadGEM2; histogram suggests general agreement on drier spring by most CMIP5 models
What can a decision maker do with this information?
September HadGEM2 ΔPrecip(RCP4.5) for Texas
http://www.usgs.gov/climate_landuse/clu_rd/apps/nex-dcp30_viewer.asp

UT Austin April 2014 – Jim Kinter
Assessments
• Intergovernmental Panel on Climate Change
• (USGCRP) National Climate Assessment

UT Austin April 2014 – Jim Kinter
IPCC Fifth Assessment Report
• So far, only Working Group I has reported in the 5th Assessment• Headlines (9/30/2013):
– Warming of the climate system is unequivocal and unprecedented over recent decades to millennia.
– Most recent decades are warmest– Ice sheets are diminishing; sea level is rising; oceans are
acidifying– Greenhouse gas concentrations are increasing; energy due to
GHG is being taken up by Earth– Human influence is clear and future emissions will change climate
even more with model-based projections of +1.5C or more above 1900 values, further sea ice and glacier loss, and further sea level rise
– Climatic effects of warming will persist for centuries• None of these headlines is “news” – mostly refinements of
headlines from AR4. • What municipal, state or regional policies are needed to address
these changes? How can you tell??

UT Austin April 2014 – Jim Kinter
U.S. National Climate Assessment
• Go to http://ncadac.globalchange.gov/• NB: The NCA is still in draft form and is expected to become final in April 2014.
Nevertheless, the lead time needed to prepare the assessment meant that it had to be done with CMIP3 results, because CMIP5 results were not sufficiently available or analyzed to inform the NCA.
• Finding: Global climate is changing, and this is apparent across the U.S. in a wide range of observations. The climate change of the past 50 years is due primarily to human activities, predominantly the burning of fossil fuels.
• Finding: Some extreme weather and climate events have increased in recent decades, and there is new and stronger evidence that many of these increases are related to human activities.
• Finding: Human-induced climate change is projected to continue and accelerate significantly if emissions of heat-trapping gases continue to increase.
• Finding: Impacts related to climate change are already evident in many sectors and are expected to become increasingly challenging across the nation throughout this century and beyond.
• Finding: Climate change threatens human health and well-being in many ways, including impacts from increased extreme weather events, wildfire, decreased air quality, diseases transmitted by insects, food, and water, and threats to mental health.
• (many other findings relating to agriculture, energy etc., broken down by region)

UT Austin April 2014 – Jim Kinter
U.S. National Climate Assessment
• Finding: Infrastructure across the U.S. is being adversely affected by phenomena associated with climate change, including sea level rise, storm surge, heavy downpours, and extreme heat.
• Finding: Reliability of water supplies is being reduced by climate change in a variety of ways that affect ecosystems and livelihoods in many regions, particularly the Southwest, the Great Plains, the Southeast, and the islands of the Caribbean and the Pacific, including the state of Hawai`i.
• Finding: Adverse impacts to crops and livestock over the next 100 years are expected. Over the next 25 years or so, the agriculture sector is projected to be relatively resilient, even though there will be increasing disruptions from extreme heat, drought, and heavy downpours. U.S. food security and farm incomes will also depend on how agricultural systems adapt to climate changes in other regions of the world.
• Finding: Natural ecosystems are being directly affected by climate change, including changes in biodiversity and location of species. As a result, the capacity of ecosystems to moderate the consequences of disturbances such as droughts, floods, and severe storms is being diminished.
• Finding: Life in the oceans is changing as ocean waters become warmer and more acidic. • Finding: Planning for adaptation (to address and prepare for impacts) and mitigation (to reduce
emissions) is increasing, but progress with implementation is limited.
• The NOAA MAPP CMIP5 Task Force has undertaken to advise NCA on the differences between CMIP3 and CMIP5 focusing on North American climate – this is being prepared as a NOAA Technical Report being released in late summer, followed by a BAMS article by the end of 2014.

UT Austin April 2014 – Jim Kinter
Translation Services
• Called for in 2012 NRC report, “A National Strategy for Advancing Climate Modeling”– Societal needs are diverse and complex.
• Some users require information about their local region• Others require climate data on a global scale.
– Challenge: Climate modeling community cannot easily work directly with the broad array of climate model users.
– Challenge: There are no recognized mechanisms for verifying the quality of the information provided.
– To help ensure the accuracy and appropriateness of climate information, as well as help communicate users needs back to climate model developers …
• Develop a national education and accreditation program to train climate model interpreters to use technical findings and output from climate model in a range of applications could.

UT Austin April 2014 – Jim Kinter
If climate scientists don’t provide the information, forge ahead …
• There is ample room for misapplication of climate observations and model data
• Example: EPA air quality and human health study plan – Use the CMIP5 data for 3 years selected from the past decade, and 3 years selected from around 2030 from 1 model, 1 scenario, 1 member, to force an air quality model. – Any thoughts about what will be learned? – How will interannual variability be characterized (3
samples)? Inter-model variability (1 sample)? Sensitivity to scenario (1 sample)? Or predictability (1 sample)?

UT Austin April 2014 – Jim Kinter
Decision Support for Local and Regional Climate Vulnerability
• Nobody lives on the global mean• Decisions are not made for entire continents
(except Australia)
• Tension:
• Resolution: Provide reliable information at actionable scale Both means and variability + estimates of uncertainty, confidence, predictability + in narrative form
greatest confidence in largest (planetary)
scale information about climate
decisions about distribution of community
resources are made at local/regional scales

UT Austin April 2014 – Jim Kinter
IPCC AR5 WGI2013
AR5 Surface Temperature Change Decision-making
regions

UT Austin April 2014 – Jim Kinter
CMIP5 Climate Change: Apr-Sep Rainfall 20th 21st (RCP8.5)
CNRM CESM
UT Austin April 2014 – Jim Kinter
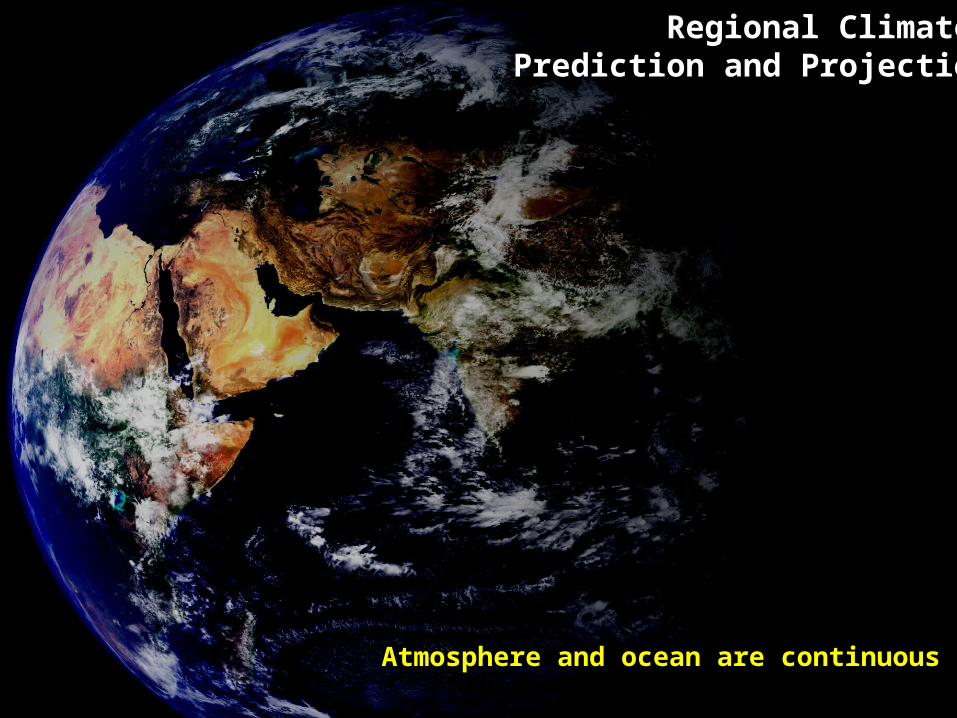
Atmosphere and ocean are continuous fluids … but computers can only represent discrete objects
Regional Climate Prediction and Projection

UT Austin April 2014 – Jim Kinter
Atmosphere and ocean are continuous fluids … but computers can only represent discrete objects
Regional Climate Prediction and Projection

UT Austin April 2014 – Jim Kinter
Accuracy of solution Representation of features
Representation of processes Interaction among scales
Meeting societal demands
… and which drives computational and data resources demands
Regional Climate Prediction and Projection
… means increasing models’ spatial
resolution… which is required for :

UT Austin April 2014 – Jim Kinter
Europe Growing Season (Apr-Oct) Precipitation Change: 20th C to 21st C
T159 (125-km) T1279 (16-km)
“Time-slice” runs of the ECMWF IFS global atmospheric model with observed SST for the 20th century and CMIP3 projections of SST for the 21st century at two different model resolutions
The continental-scale pattern of precipitation change in April – October (growing season) associated with global warming is similar, but the regional details are quite different, particularly in southern Europe.

UT Austin April 2014 – Jim Kinter
4X probability of extreme summer drought in Great Plains, Florida, Yucutan, and parts of Eurasia
Future Change in Extreme Summer Drought Late 20th C to Late 21st C
10th Percentile Drought: Number of years out of 47 in a simulation of future climate (2071-2117) for which the June-August mean rainfall was less than the 5th driest year of 47 in a simulation of current climate (1961-2007).

UT Austin April 2014 – Jim Kinter
Decision Support
• How can this result support decision making? • This image has huge implications for water resource
managers or agricultural interests and futures investors in the U.S. Great Plains, but how can they use it?– Projection is for 50 years hence … what institutions can plan on
that time horizon?– Simulation is a single instantiation with a single model (due to
computational cost) … how much confidence should be placed in this result?
– What risk management models are capable of ingesting this kind of information? Do such models have the necessary vulnerability and adaptability information built in or is the situation so unprecedented that statistical models are insufficient?
Extreme drought incidence change

UT Austin April 2014 – Jim Kinter
Balancing Scientific Reality and Societal Needs
• Communication– “Simple, clear messages” are good for communication, but climate variability
and change is complex it takes time to communicate well
• Transparency– All climate scientists can contribute to evaluating and establishing the bona fides
of climate data and climate model projections
• Free, Open Data Access– Provide data *AND* tools to use and understand the data too
• Assessments– Valuable to climate data users and climate modelers interested in how to improve
the models further
• Translation Services– Narratives about climate variability and change and sanity checks on how to use
complex climate observations and model output data
• Decision Support– Local and regional decision-makers critically need help in using, interpreting and
understanding what climate information suggests for their difficult decisions