Embed Size (px)
Citation preview
JHM Telemedicine: Data Review and Equity Dashboard
June 28th, 2021
Brian Hasselfeld, MD – Medical Director, Digital Health and Telemedicine
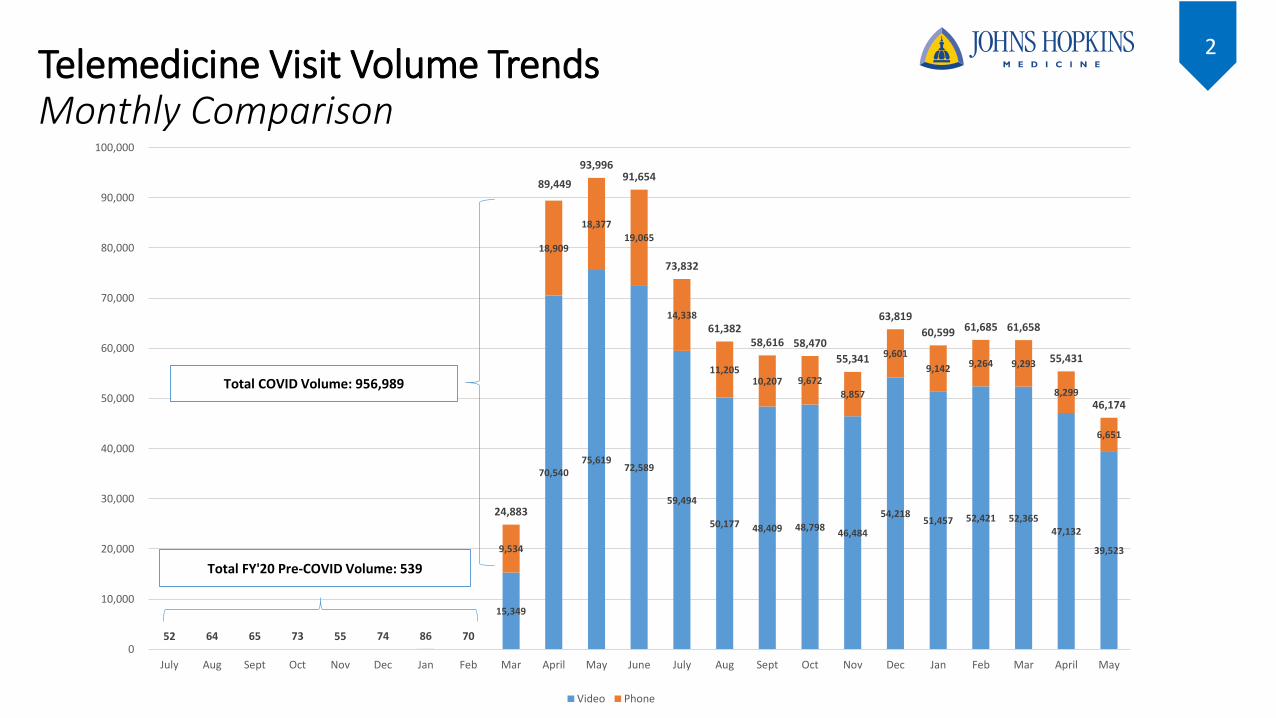
2Telemedicine Visit Volume TrendsMonthly Comparison
15,349
70,540 75,619
72,589
59,494
50,177 48,409 48,798 46,484
54,218 51,457 52,421 52,365
47,132
39,523 9,534
18,909
18,377
19,065
14,338
11,205 10,207 9,672
8,857
9,601
9,142 9,264 9,293
8,299
6,651
52 64 65 73 55 74 86 70
24,883
89,449
93,996 91,654
73,832
61,382 58,616 58,470
55,341
63,819
60,599 61,685 61,658
55,431
46,174
0
10,000
20,000
30,000
40,000
50,000
60,000
70,000
80,000
90,000
100,000
July Aug Sept Oct Nov Dec Jan Feb Mar April May June July Aug Sept Oct Nov Dec Jan Feb Mar April May
Video Phone
Total COVID Volume: 956,989
Total FY'20 Pre-COVID Volume: 539

0
2,000
4,000
6,000
8,000
10,000
12,000
14,000
16,000
18,000
20,000
2-Mar-20 2-Apr-20 2-May-20 2-Jun-20 2-Jul-20 2-Aug-20 2-Sep-20 2-Oct-20 2-Nov-20 2-Dec-20 2-Jan-21 2-Feb-21 2-Mar-21 2-Apr-21
Telemedicine In-Person Pre-COVID FY Daily Volume Average
3Telemedicine Visits vs. In-Person VisitsTotal Ambulatory Volume Major snow
events▪ Telemedicine
volume peaked in April / May
▪ Stabilized over last 6 months
▪ Total volume remains around pre-COVID projected volume (to date, telemedicine substitute and not additive)
*Note: Orange (in-person) and blue (Telemedicine, including both video and audio-only visits) are stacked (not overlapping)
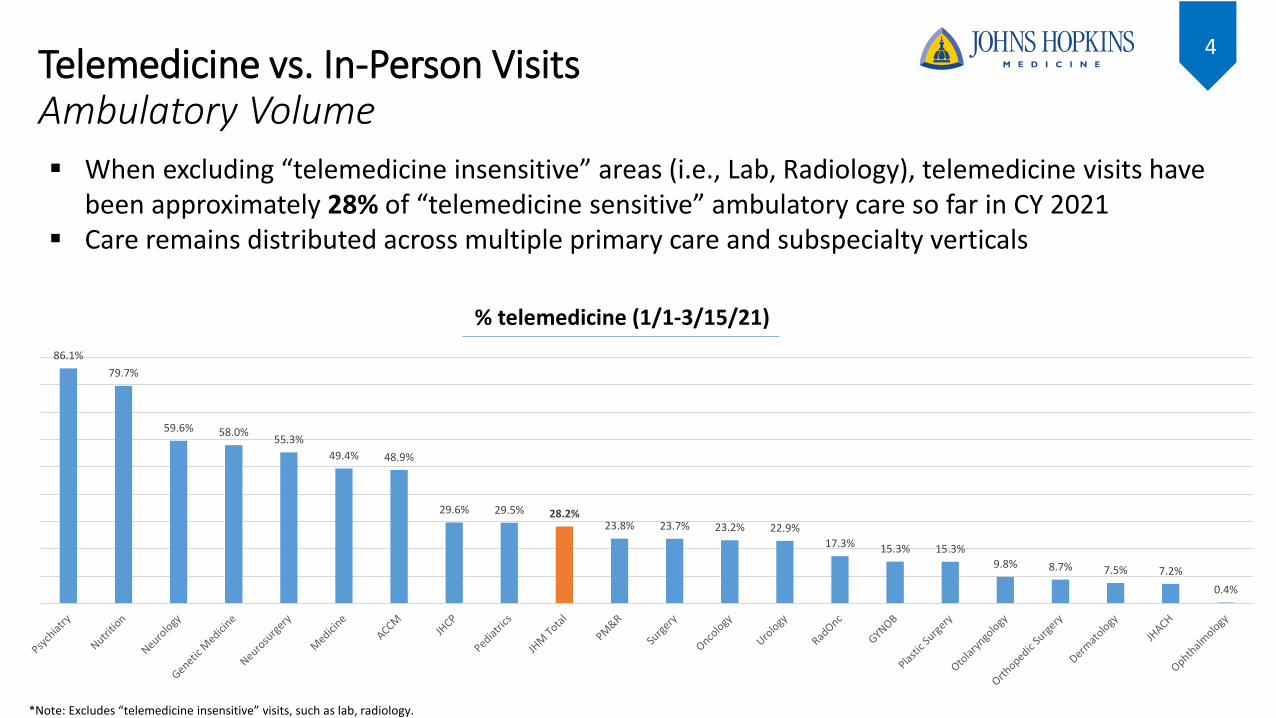
4Telemedicine vs. In-Person VisitsAmbulatory Volume
▪ When excluding “telemedicine insensitive” areas (i.e., Lab, Radiology), telemedicine visits have been approximately 28% of “telemedicine sensitive” ambulatory care so far in CY 2021
▪ Care remains distributed across multiple primary care and subspecialty verticals
% telemedicine (1/1-3/15/21)
*Note: Excludes “telemedicine insensitive” visits, such as lab, radiology.
86.1%
79.7%
59.6% 58.0%55.3%
49.4% 48.9%
29.6% 29.5% 28.2%23.8% 23.7% 23.2% 22.9%
17.3% 15.3% 15.3%
9.8% 8.7% 7.5% 7.2%
0.4%
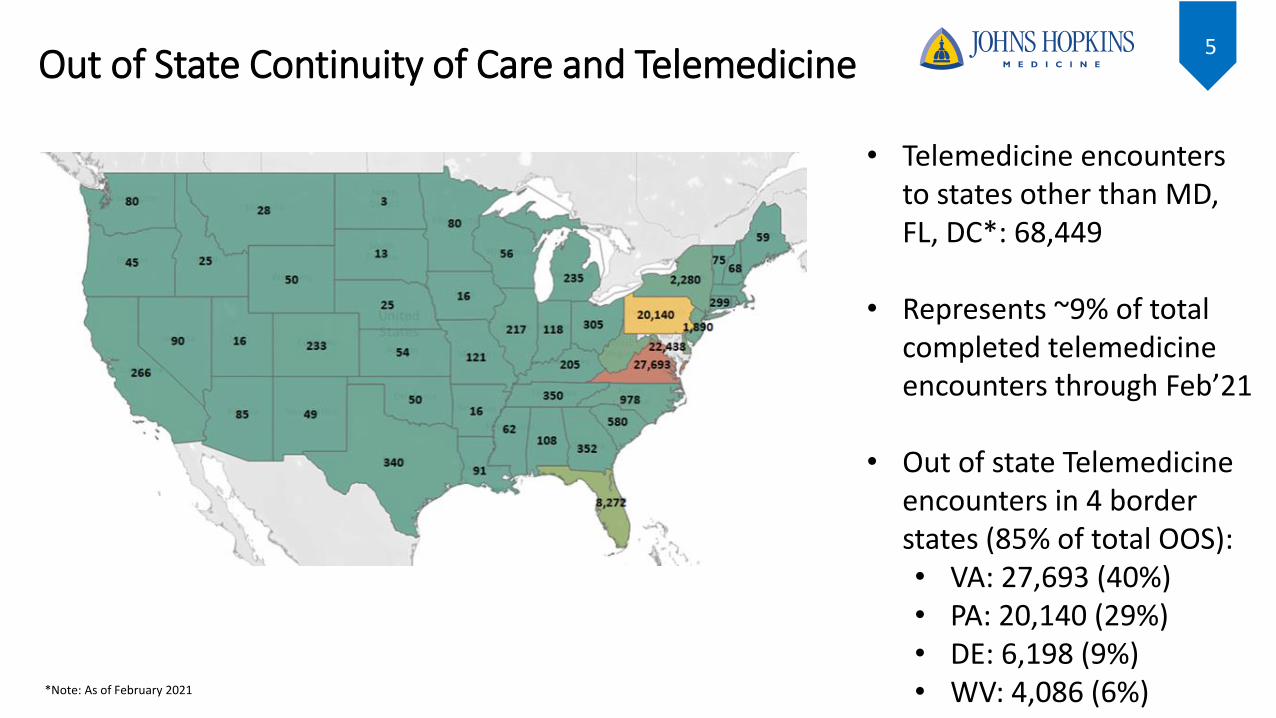
5Out of State Continuity of Care and Telemedicine
• Telemedicine encounters to states other than MD, FL, DC*: 68,449
• Represents ~9% of total completed telemedicine encounters through Feb’21
• Out of state Telemedicine encounters in 4 border states (85% of total OOS):• VA: 27,693 (40%)• PA: 20,140 (29%)• DE: 6,198 (9%)• WV: 4,086 (6%)*Note: As of February 2021
6
Patient and Provider Expectations
7
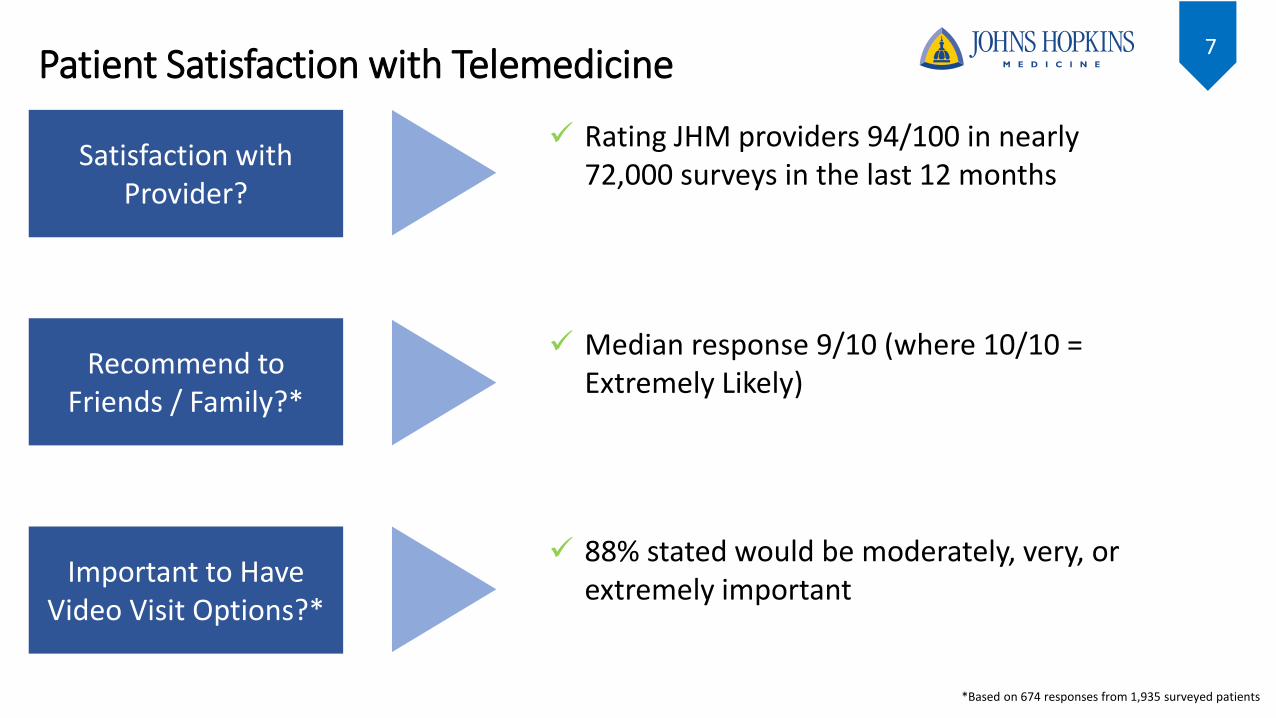
Satisfaction with Provider?
Recommend to Friends / Family?*
Important to Have Video Visit Options?*
✓ Rating JHM providers 94/100 in nearly 72,000 surveys in the last 12 months
✓ Median response 9/10 (where 10/10 = Extremely Likely)
✓ 88% stated would be moderately, very, or extremely important
Patient Satisfaction with Telemedicine
*Based on 674 responses from 1,935 surveyed patients
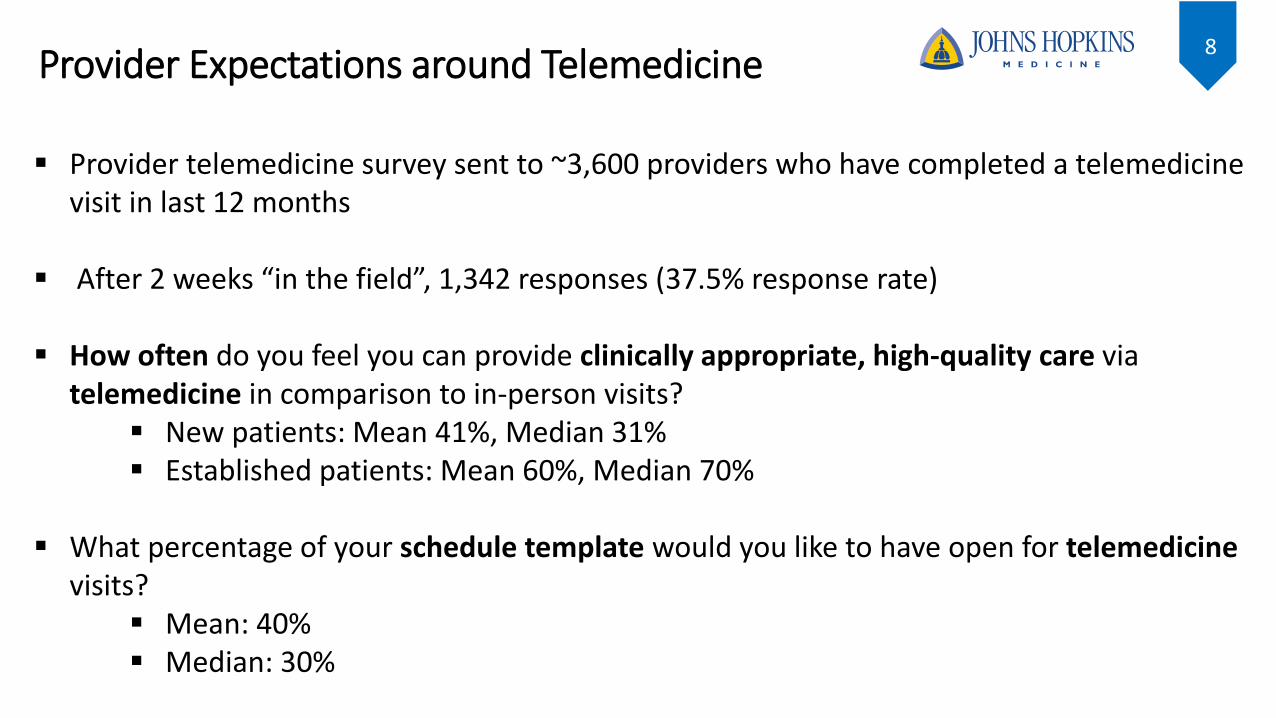
8Provider Expectations around Telemedicine
▪ Provider telemedicine survey sent to ~3,600 providers who have completed a telemedicine visit in last 12 months
▪ After 2 weeks “in the field”, 1,342 responses (37.5% response rate)
▪ How often do you feel you can provide clinically appropriate, high-quality care via telemedicine in comparison to in-person visits?
▪ New patients: Mean 41%, Median 31% ▪ Established patients: Mean 60%, Median 70%
▪ What percentage of your schedule template would you like to have open for telemedicinevisits?
▪ Mean: 40%▪ Median: 30%
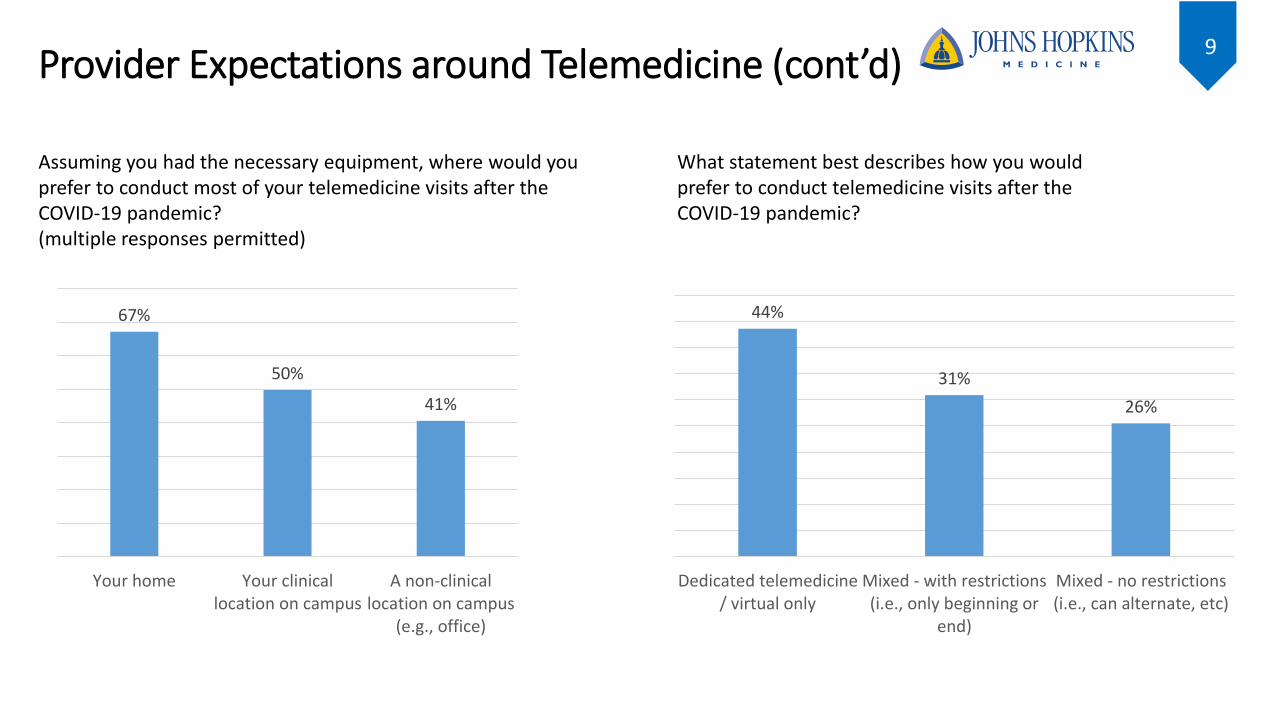
9Provider Expectations around Telemedicine (cont’d)
Assuming you had the necessary equipment, where would you prefer to conduct most of your telemedicine visits after the COVID-19 pandemic? (multiple responses permitted)
67%
50%
41%
Your home Your clinicallocation on campus
A non-clinicallocation on campus
(e.g., office)
What statement best describes how you would prefer to conduct telemedicine visits after the COVID-19 pandemic?
44%
31%
26%
Dedicated telemedicine/ virtual only
Mixed - with restrictions(i.e., only beginning or
end)
Mixed - no restrictions(i.e., can alternate, etc)
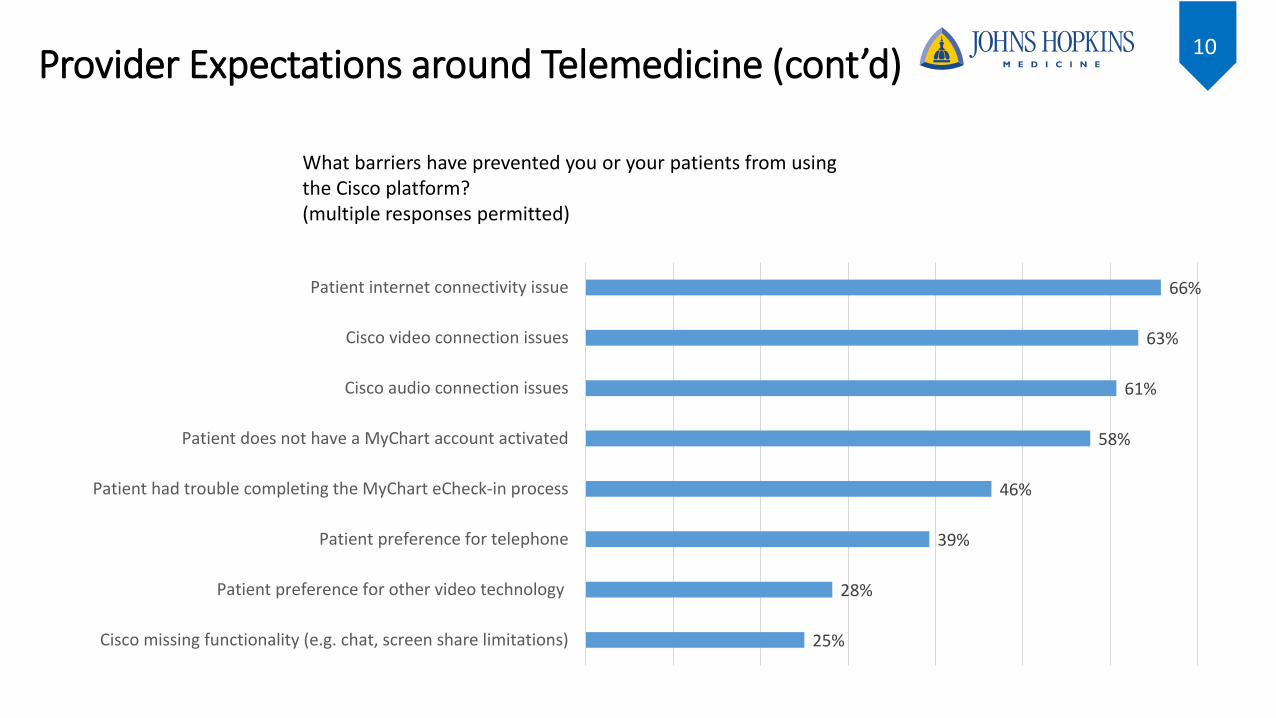
10Provider Expectations around Telemedicine (cont’d)
What barriers have prevented you or your patients from using the Cisco platform? (multiple responses permitted)
25%
28%
39%
46%
58%
61%
63%
66%
Cisco missing functionality (e.g. chat, screen share limitations)
Patient preference for other video technology
Patient preference for telephone
Patient had trouble completing the MyChart eCheck-in process
Patient does not have a MyChart account activated
Cisco audio connection issues
Cisco video connection issues
Patient internet connectivity issue
11
Telemedicine Equity
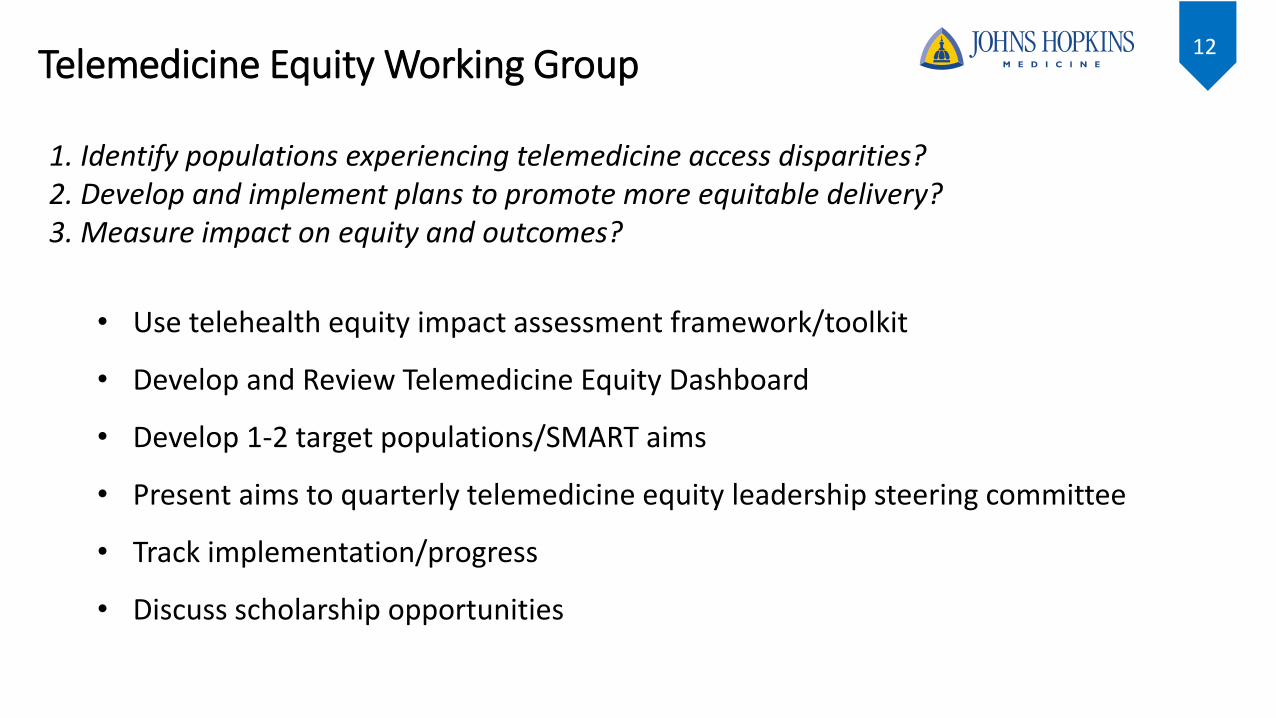
12Telemedicine Equity Working Group
1. Identify populations experiencing telemedicine access disparities?2. Develop and implement plans to promote more equitable delivery?3. Measure impact on equity and outcomes?
• Use telehealth equity impact assessment framework/toolkit
• Develop and Review Telemedicine Equity Dashboard
• Develop 1-2 target populations/SMART aims
• Present aims to quarterly telemedicine equity leadership steering committee
• Track implementation/progress
• Discuss scholarship opportunities
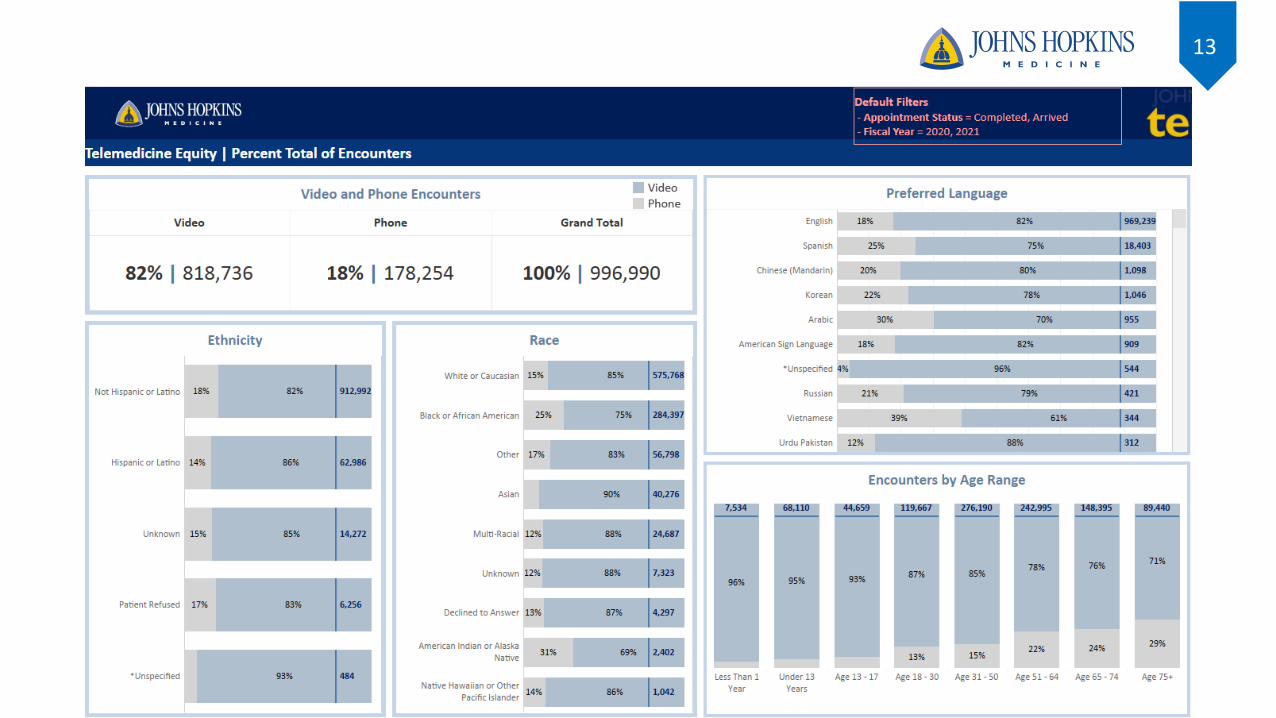
13
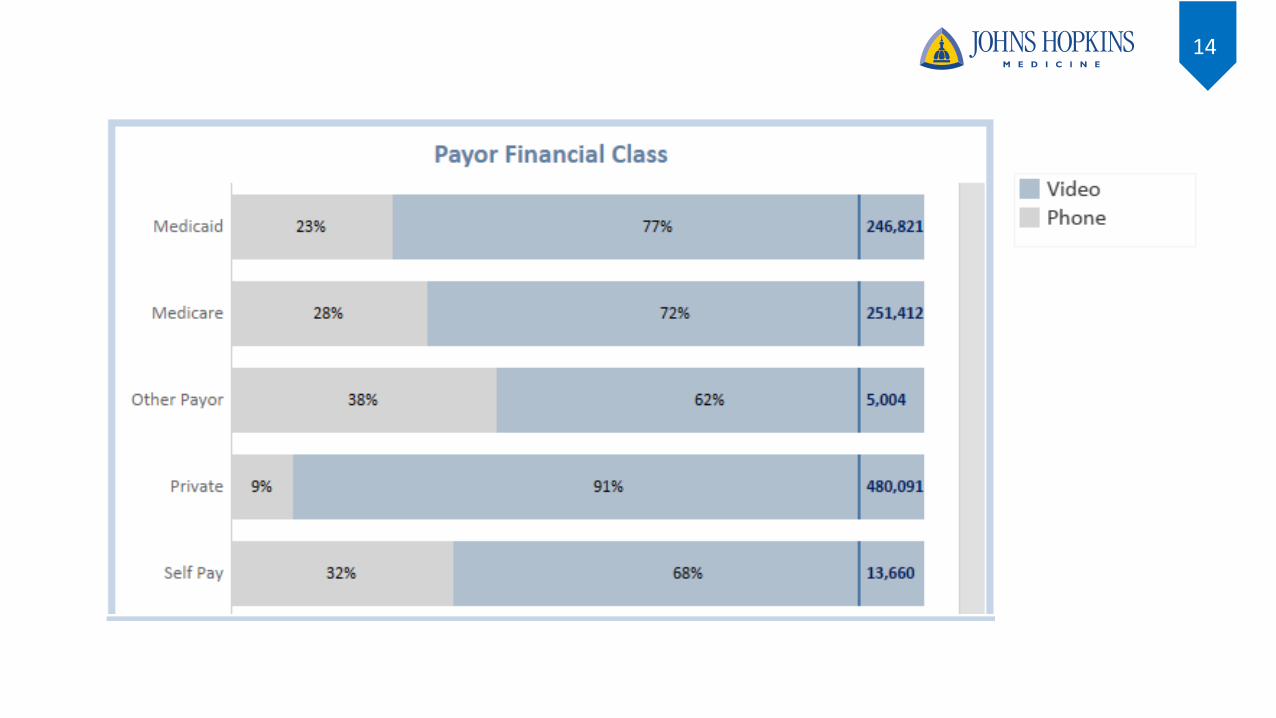
14
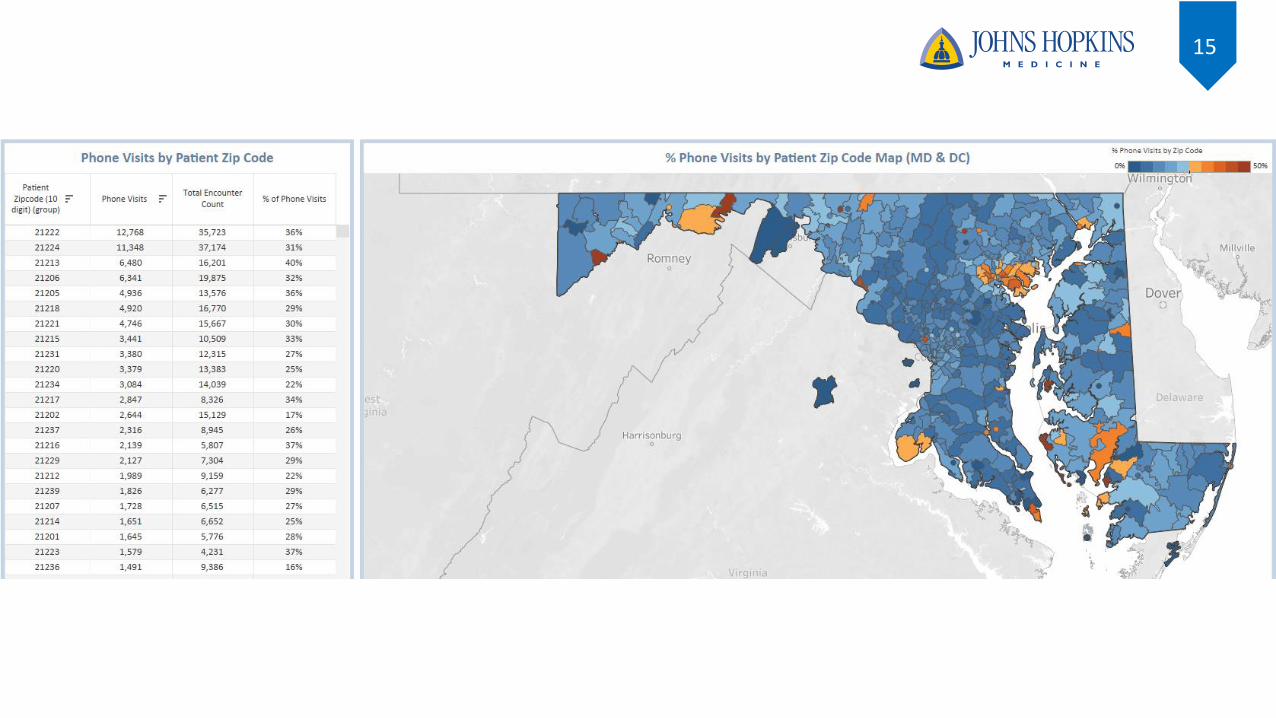
15
16
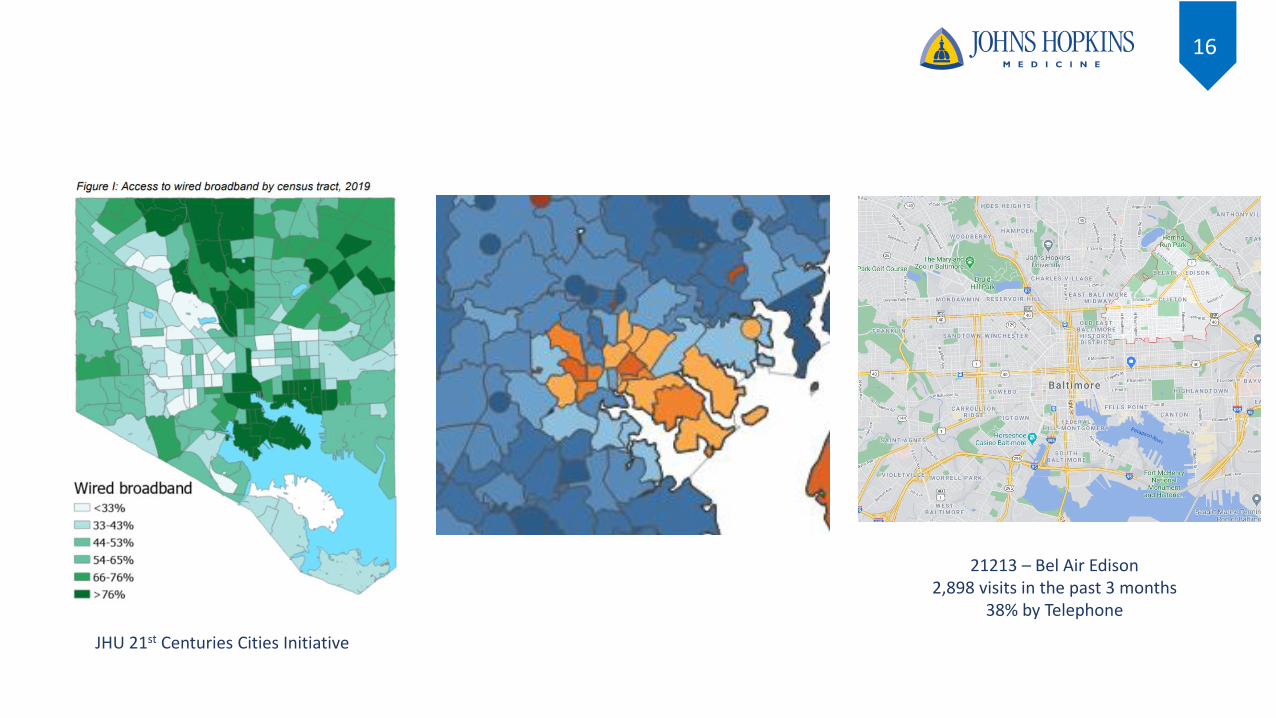
JHU 21st Centuries Cities Initiative
21213 – Bel Air Edison 2,898 visits in the past 3 months
38% by Telephone
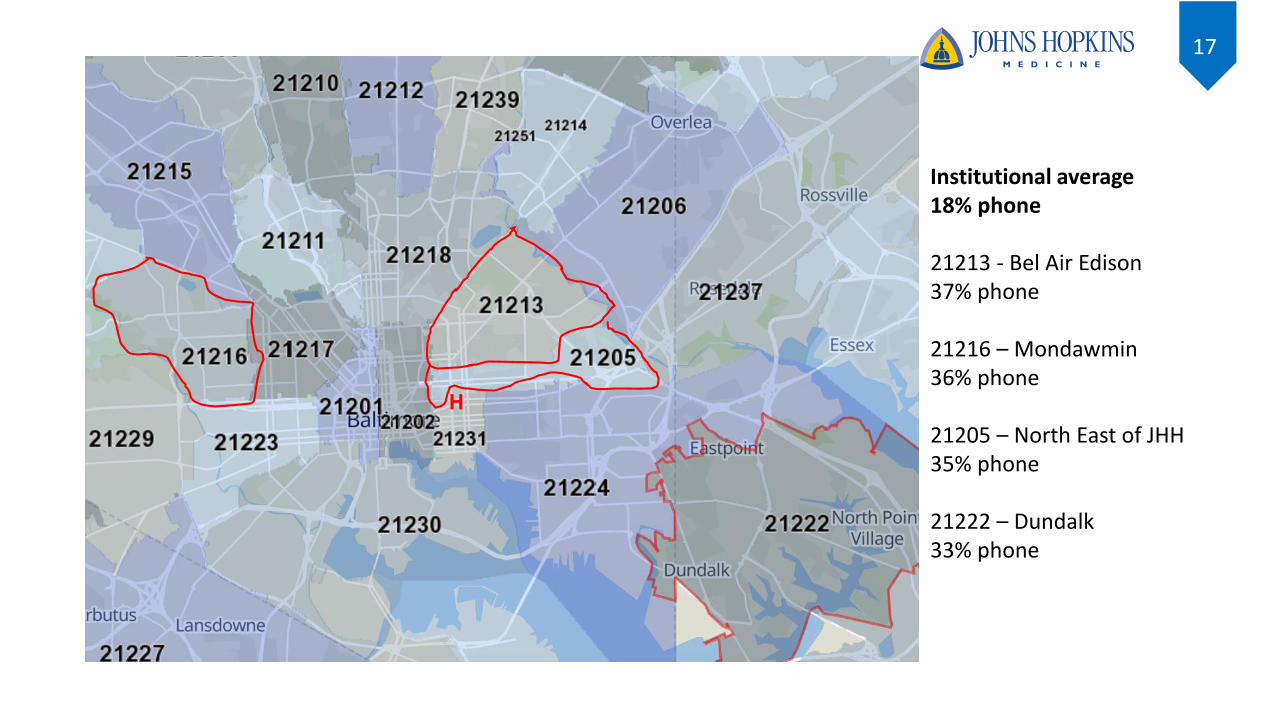
17
Institutional average 18% phone
21213 - Bel Air Edison37% phone
21216 – Mondawmin36% phone
21205 – North East of JHH35% phone
21222 – Dundalk33% phone
H