Embed Size (px)
Citation preview
Jewish Population in the United States, 2003
NJPS Released
The 2000-01 National Jewish Population Survey (NJPS), sponsoredby United Jewish Communities (UJC), was designed to be the most com-prehensive and sophisticated study ever conducted of American Jews. Sothat the results should be representative of all American Jews, respon-dents were selected using random-digit-dialing techniques and a complexscreening process. Interviews were conducted between August 2000 andAugust 2001. The questionnaire and overall study design were developedby the UJC Research Department in close collaboration with its Na-tional Technical Advisory Committee (NTAC), a distinguished group of20 academicians and federation professionals with expertise in demog-raphy, sociology, religion, geography, economics, education, and other rel-evant disciplines.
Among the multitude of topics to be explored in NJPS 2000-01 wereJewish population size, socioeconomic characteristics, family structure,fertility, marital history, intermarriage, Jewish identification, religiouspractices, Jewish education, synagogue affiliation, philanthropic behav-ior, and relationship to Israel. UJC and others were expected to under-write a broad range of analyses based on NJPS results to guide the plan-ning and policy-making of the Jewish community.
UJC issued some findings at a press conference on October 8, 2002,most notably the report of a decline in the American Jewish populationfrom 5.5 million in 1990 to 5.2 million a decade later. Major presenta-tions on various aspects of the NJPS were scheduled for the UJC Gen-eral Assembly (GA) that November. But these were canceled abruptly aweek before the start of the GA and the full survey suppressed when itcame to light that data had been lost two years earlier by the polling com-pany, Roper Audits and Surveys Worldwide. Some insiders expressed theview that the missing data would have shown a higher number of Jews.The UJC—against the wishes of the survey's Technical Advisory Com-mittee, which believed that the problems were insubstantial and shouldnot delay release of the findings—set up a six-member task force to in-vestigate, under the leadership of Bernard Shapiro, vice chancellor of
114
J E W I S H P O P U L A T I O N I N T H E U N I T E D S T A T E S / 1 1 5
McGill University. The release date for the survey was now set for the fol-lowing spring (see AJYB 2003, pp. 138-42).
In January 2003, the Shapiro task force reported to the UJC that evenaside from the lost data there were other methodological problems, someof which were "not fixable." In April, the task force recommended theinvolvement of a new team of investigators with a higher level of tech-nical expertise. The second review panel would be led by Mark Schulman,president of the Schulman, Ronca & Bucuvalas research firm, who saidthat it would take at least two months before the survey would see thelight of day.
That estimate proved overoptimistic: the full survey was not distributeduntil September 10 (it is available at www.ujc.org; a full analysis is sched-uled for publication in AJYB 2005). Reiterating the finding released theprevious October that there were 5.2 million American Jews, the NJPSpresented the picture of a community that had barely changed since 1990:compared to other Americans, Jews were highly educated, concentratedin the professions, disproportionately aging, and having fewer children.Of the Jews who belonged to a synagogue, 39 percent were Reform, 33percent Conservative, 21 percent Orthodox, 3 percent Reconstructionist,and 4 percent "other." As expected, Jews in the West and South tendedto be less Jewishly connected than those in the East. There was some goodnews about Jewish education: nearly a quarter of Jewish children had at-tended an all-day Jewish school at some point, and about 40 percent ofJewish college students had taken a course in Jewish studies.
The item drawing greatest attention had to do with intermarriage. The1990 finding of a 52-percent rate, which came as a profound shock tothe community, had drawn fire almost immediately because it countedcategories of people who, though connected in various ways to Jewishhouseholds, were not, by any stretch of the imagination, "core" Jews,and their inclusion had the effect of exaggerating the extent of inter-marriage. The new NJPS therefore recalculated the 1990 numbers andgenerated the new ones using only "core" Jews (for the definition of"core," see below, p. 000). "Survey Finds Slight Rise in Jews' Intermar-rying," was the headline in the New York Times (Sept. 11). The read-justed 1990 rate was 43 percent, and it rose just four points to 47 per-cent in the new survey, prompting some to conclude that intermarriage,which rose rapidly in the 1970s and 1980s, was leveling off. Only abouta third of the children of intermarriage, according to the survey, werebeing raised as Jews.
Mark Schulman, chair of the survey's final review committee, issued
116 / A M E R I C A N J E W I S H Y E A R B O O K , 2 0 0 4
a separate 24-page report on the methodological issues. He noted thepresence of a "skew" in the NJPS toward completely Jewish householdsand toward religious Jews, and thus a possible undercount of nonaffil-iated and intermarried Jews, which, when combined with the low, 28-percent response rate, may have led to an underestimate of the com-munity's size. Schulman noted, however, that the validity of "theanalysis of relationships between variables" would not be affected by thesurvey's shortcomings. A few days after Schulman submitted his report,the UJC eliminated the position of the professional who had overseenthe NJPS.
The controversies that had been swirling around the NJPS before itsrelease did not abate afterward. UJC officials touted the survey, LorraineBlass, the project manager, assuring reporters that it was "checked anddouble-checked." The social scientists who had served on the originalTechnical Advisory Committee and had favored release of the reportback in November also praised it. But some critics claimed that themethodological problems rendered the findings of little value, and the $6million spent on the project (double original estimates) a waste of money.Other experts came down somewhere in the middle, arguing that theNJPS could be a useful tool for communal planning if interpreted withrequisite care. On October 26-27, Brandeis University and the WilsteinInstitute cosponsored a conference in Boston at which these variousviews were aired, although none of those present believed that a con-sensus was likely to emerge any time soon.
Adding a political tinge to the debate was a campaign by the Forwardnewspaper accusing the UJC of deliberately falsifying data in order tofrighten the Jewish community about its future. In an unusual front pageeditorial in the September 12 issue entitled "The 52% Fraud," editor J.J.Goldberg interpreted the recalculation of the 1990 intermarriage num-bers as an admission that the 1990 NJPS, with its 52-percent rate, hadbeen a "fraud" intended to "arouse the Jewish public" to take actionagainst mixed marriage in the interests of Jewish "separatism." And heclaimed that the new NJPS, having admitted that "fraud," was now per-petrating another: that the American Jewish population was declining.Goldberg went on to press his claim on the op-ed page of the New YorkTimes (Sept. 17), where he wrote that the NJPS had "invented a crisis.1'After Stephen Hoffman, president and CEO of the UJC, accused Gold-berg of "slander," the editor backtracked somewhat, allowing that the sur-vey's problems may not have resulted from deliberate fraud (Forward,Sept. 26).
J E W I S H P O P U L A T I O N I N T H E U N I T E D S T A T E S / 117
Jewish Community Studies
A number of demographic surveys of individual Jewish communitieswere conducted in 2002 and 2003. Local federations sponsored studiesof Pittsburgh and Phoenix, both carried out by Ukeles Associates; thetwo communities had last been surveyed almost 20 years earlier. ThePittsburgh data showed a slight decline in the number of Jews, from44,900 in 1984 to 42,200. The Phoenix community, in contrast, grew sig-nificantly over that same time period, the number of people living in Jew-ish households more than doubling from 45,000 to 106,900. While thenumber of Jewish persons was not tallied in 1984, the study's authors be-lieved that the current number of Jews, 82,900, was at least double the1984 figure
NEW YORK
A study of the largest Jewish community in the country, New YorkCity—including the five boroughs plus neighboring Nassau, Suffolk,and Westchester counties—was conducted in 2002 by UJA-Federationof New York and released in June, 2003. The principal investigators wereJacob B. Ukeles and Ron Miller of Ukeles Associates. Almost 69,000households were contacted and 6,035 Jewish households were identified,of which 4,533 were subjects of interviews.
The study found that since 1991, when the previous survey of New YorkJewry was conducted, the Jewish population of the eight-county region de-clined slightly, from 1,420,000 to 1,412,000, while the number of Jewishhouseholds rose slightly, from 638,000 to 643,000. As in 1991, Jews madeup about 15 percent of the New York region's total population in 2002.
But movement to the suburbs led to a 6-percent decline in the numberof Jewish households in the five boroughs and a 5-percent drop in thenumber of Jewish persons: there were now fewer than a million Jewswithin the city limits, 972,000. The 5-percent decline, however, was farlower than the 11-percent decline in the city's non-Hispanic white popu-lation. Jewish households in the three suburban counties increased by 24percent since 1991, to 188,000, and the Jewish population by 12 percent,to 440,000.
The boroughs of Brooklyn and Manhattan together accounted for 51percent of the Jewish households in the area and almost 50 percent of theJewish population. Indeed, Brooklyn itself was home to more Jews thanany American city with the exception of Los Angeles. Brooklyn (by 23
1 1 8 / A M E R I C A N J E W I S H Y E A R B O O K , 2 0 0 4
percent) and Staten Island (by 27 percent) were the only city boroughsthat experienced growth between 1991 and 2002, the others sustainingsubstantial losses. Westchester Jewry grew by 40 percent and Nassau by9 percent, while the number for Suffolk fell 8 percent. The 2002 Jewishpopulation figures for the eight counties are listed below, p. 133.
More than half—57 percent—of the adults surveyed were married atthe time they were interviewed, 20 percent reported never having married,12 percent were widowed, 9 percent separated or divorced, and 2 percentliving together. Manhattan had the highest percentage of never married(35 percent) and the Bronx highest percentage of widowed (24 percent).More than a quarter of Jewish households had at least one child underage 18.
Almost three-quarters of Jewish adults were born in the U.S., but some92,000 households and 202,000 persons were Russian-speaking (300 re-spondents filled out the survey in Russian). Of these households, 76,000included an adult born in the former Soviet Union. Indeed, over 90 per-cent of Russian-speaking American Jews lived in the New York area.Russian speakers made up 19 percent of the city's Jewish population and4 percent of the population of the three suburban counties. Brooklyn washome to 62 percent of New York's Russian speakers and Queens to 19percent. The Russian speakers made up a large part of the Jewish com-munities in Brooklyn (27 percent), Staten Island (26 percent) and Queens(21 percent).
On denominational identification, the big increases since 1991 were forthe Orthodox, up from 13 to 19 percent, and for those identifying as "sec-ular" or "no religion," up from 3 to 10 percent. The Reform numbersdropped from 36 to 29 percent and the Conservative from 34 to 26 per-cent. The borough with the highest percentage of Orthodox (37 percent)was Brooklyn.
Asked how important being Jewish was in their lives, 65 percent of NewYork Jews replied it was very important, another 26 percent said it wassomewhat important, and just 9 percent felt it was unimportant. Givena list of Jewish values and asked to indicate which were "very important,"the top choices were "survival of the State of Israel" (92 percent) and"making the world a better place" (88 percent). As for Jewish communalpriorities, the three most popular, all attracting the backing of 86 percent,were helping Jews in distress around the world, supporting Jewish chil-dren and families in crisis, and aiding the Jewish poor.
Fully half of all Jewish households belonged to a Jewish organizationof some kind, and 43 percent belonged to a synagogue—up from 38 per-
J E W I S H P O P U L A T I O N I N T H E U N I T E D S T A T E S / 1 1 9
cent in 1991. In Nassau and Suffolk, more than half of Jewish householdsbelonged to synagogues. Younger Jews were slightly more likely thantheir elders to be synagogue members. Only 17 percent of New York Jewsactually attended service at least once a week. Of those Jews who con-sidered it very important to be part of a Jewish community, about aquarter did not have any Jewish communal connection. More than three-quarters of Jews said that Hanukkah candles were lit in their homes andthat they attended a Passover seder regularly; almost three-quarters saidthey fasted on Yom Kippur; Shabbat candles were regularly lit in almosta third of households; and a little over a quarter of respondents said theirhomes were kosher. On all of these measures, observance was slightly upfrom 1991.
Of all married Jews in New York, 83 percent had Jewish born-spouses,4 percent were married to converts, and 13 percent were married to non-Jews. Looking at marriages involving Jews, 72 percent were between twoJews, 7 percent between a born-Jew and a convert, and 22 percent betweena Jew and a non-Jew. Suffolk County had the highest intermarriage rateand Brooklyn the lowest. The intermarriage rate for the New York area,which rose rapidly in the 1970s, appeared to have stabilized since the1980s. Of the 370,000 children living in Jewish households (defined ascontaining at least one Jewish adult), 83 percent were being raised as Jews,12 percent as non-Jews, and 4 percent as Jews and "something else."Some 61,000 children, 16 percent of the total, were living in intermarriedhouseholds, and of that number, half were not being raised as Jews.
The New York study found a number of what it called "vulnerable pop-ulations." Some 83,000 Jewish seniors lived alone, and almost a third ofJewish households reported an income below $35,000. One of every sixJewish households in the region lived under the poverty line—almostdouble the 1991 rate—and one in three respondents reported that theywere "just managing." The Russian-speaking population had much higherpoverty rates than other Jews.
The data about the extent of poverty among New York Jews, con-firming previous anecdotal evidence, attracted considerable attention.The NJPS, released just a few months later, found that about 5 percentof Jews nationally were poor, a figure that many considered too low.
WASHINGTON, D.C.
A study of the Jews of Greater Washington, D.C. (including the Dis-trict and the surrounding areas of Maryland and Virginia), sponsored by
1 2 0 / A M E R I C A N J E W I S H Y E A R B O O K , 2 0 0 4
the Charles I. and Mary Kaplan Family Foundation and conducted byProf. Ira Sheskin, was completed in 2003. It was based primarily on tele-phone interviews, the sample derived through random digit dialing(RRD). While summary report was made available promptly, the fullstudy was not yet released at year's end.
The survey found 267,000 persons living in Jewish households, a 47-percent increase from the previous survey in 1983. Of these individuals,215,000 (80 percent) were Jewish, making Greater Washington the sixthlargest Jewish community in the country. But the increase in the numberof Jews was just 37 percent in 20 years, ten points lower than the increasein persons living in Jewish households. A major reason for the differencewas a rise in the percentage of intermarried couples from 29 percent in1983 to 41 percent in 2003 (53 percent for those under age 35). Twenty-seven percent of Jewish children lived in intermarried households, and 35percent of all Jewish households at least sometimes had a Christmas tree.
Washington area Jews were disproportionately unaffiliated with theJewish community. Just 37 percent of Jews were synagogue members, farbelow the national average. Only 44 percent of Jewish households werefound to be on the federation's mailing list, the lowest rate of about 20comparable cities, and only 9 percent of households belonged to a Jew-ish community center. Only 20 percent of the households reported cur-rent membership in any Jewish organization, a very low figure. One rea-son for the minimal level of participation was the very high number ofsingles living alone, 17 percent. More than half of all children living inJewish households had both parents (one, in single-parent families) work-ing full-time, 9 percent of children lived in single-parent households, and28 percent in homes where an adult is or has been divorced.
The Washington Jewish community was relatively wealthy. The medianvalue of a home owned by a Jew was $369,000, as compared to $197,400for all homes in the area. Median household income stood at $95,900,with 47 percent of households making $100,000 or over, and 12 percent$200,000 or over. Jews were also highly educated, 85 percent of adults (ascompared to 45 percent of all Washingtonians) possessing a four-year col-lege degree, and 52 percent having graduate degrees.
Also of interest were the survey's data on Jewish attitudes. The num-ber of respondents who reported experiencing anti-Semitism was 12 per-cent of the total, a huge decline from the 29 percent recorded in 1983.The percentage perceiving a moderate amount or a great deal of anti-Semitism in the area similarly declined over the 20-year period, from 56to 29 percent.
J E W I S H P O P U L A T I O N I N T H E U N I T E D S T A T E S / 1 2 1
This survey, perhaps the first in any Jewish community to ask aboutpolitical preferences, found that 69 percent considered themselves De-mocrats, 11 percent Republicans, and 17 percent independents; the po-litical breakdown for those under age 35 was virtually identical.
Local Jewish Population
For many years, the research staff of the Council of Jewish Federationsand its successor organization, the UJC, had prepared and updated list-ings of local Jewish population statistics for the AJYB. The UJC broughtthis arrangement to an end after 2001, and thus up-to-date local data isno longer available. As a service to our readers, we reprint the 2001 tablesthat were published in the 2002 AJYB, updated only for the New York Cityarea, Phoenix, and Pittsburgh, where surveys conducted in 2002 have be-come available. For a description of how the 2001 data were derived, seeAJYB 2002, pp. 247-49.
THE EDITORS
122 / A M E R I C A N J E W I S H YEAR B O O K , 2 0 0 4
APPENDIX
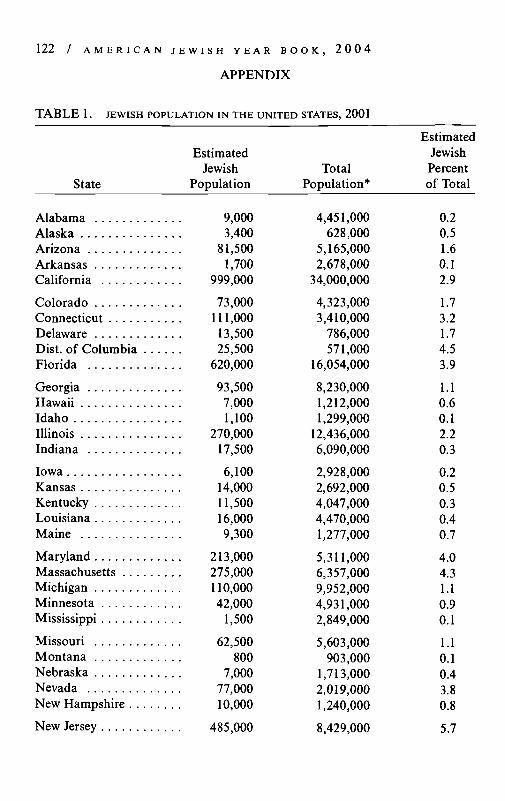
T A B L E 1. JEWISH POPULATION IN THE UNITED STATES, 2001
State
EstimatedJewish
PopulationTotal
Population*
EstimatedJewishPercentof Total
Alabama 9,000 4,451,000Alaska 3,400 628,000Arizona 81,500 5,165,000Arkansas 1,700 2,678,000California 999,000 34,000,000
Colorado 73,000 4,323,000Connecticut 111,000 3,410,000Delaware 13,500 786,000Dist. of Columbia 25,500 571,000Florida 620,000 16,054,000
Georgia 93,500 8,230,000Hawaii 7,000 1,212,000Idaho 1,100 1,299,000Illinois 270,000 12,436,000Indiana 17,500 6,090,000
Iowa 6,100 2,928,000Kansas 14,000 2,692,000Kentucky 11,500 4,047,000Louisiana 16,000 4,470,000Maine 9,300 1,277,000
Maryland 213,000 5,311,000Massachusetts 275,000 6,357,000Michigan 110,000 9,952,000Minnesota 42,000 4,931,000Mississippi 1,500 2,849,000
Missouri 62,500 5,603,000Montana 800 903,000Nebraska 7,000 1,713,000Nevada 77,000 2,019,000New Hampshire 10,000 1,240,000
New Jersey 485,000 8,429,000
0.20.51.60.12.9
1.73.21.74.53.9
1.10.60.12.20.3
0.20.50.30.40.7
4.04.31.10.90.1
1.10.10.43.80.8
5.7
JEWISH POPULATION IN THE UNITED STATES / 123
State
EstimatedJewish
PopulationTotal
Population*
EstimatedJewishPercentof Total
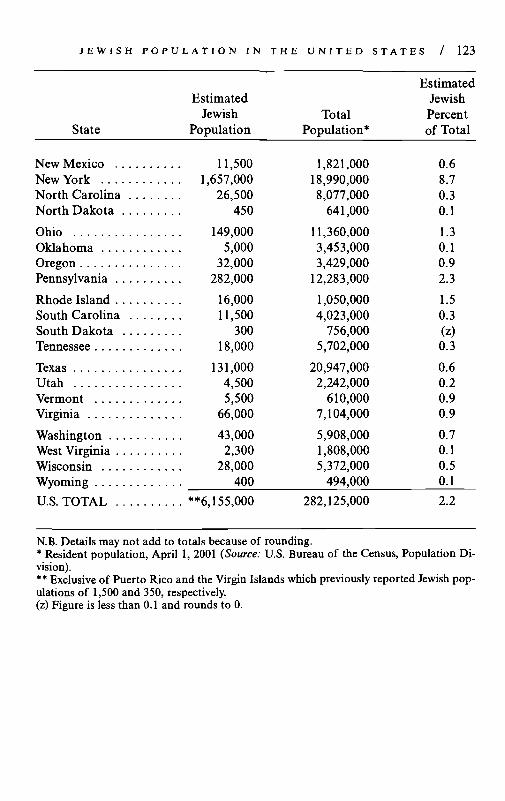
New Mexico 11,500 1,821,000New York 1,657,000 18,990,000North Carolina 26,500 8,077,000North Dakota 450 641,000
Ohio 149,000 11,360,000Oklahoma 5,000 3,453,000Oregon 32,000 3,429,000Pennsylvania 282,000 12,283,000
Rhode Island 16,000 1,050,000South Carolina 11,500 4,023,000South Dakota 300 756,000Tennessee 18,000 5,702,000
Texas 131,000 20,947,000Utah 4,500 2,242,000Vermont 5,500 610,000Virginia 66,000 7,104,000
Washington 43,000 5,908,000West Virginia 2,300 1,808,000Wisconsin 28,000 5,372,000Wyoming 400 494,000
U.S. TOTAL **6,155,000 282,125,000
0.68.70.30.1
1.30.10.92.3
1.50.3(z)0.3
0.60.20.90.9
0.70.10.50.1
2.2
N.B. Details may not add to totals because of rounding.* Resident population, April 1, 2001 (Source: U.S. Bureau of the Census, Population Di-vision).** Exclusive of Puerto Rico and the Virgin Islands which previously reported Jewish pop-ulations of 1,500 and 350, respectively,(z) Figure is less than 0.1 and rounds to 0.
124 / A M E R I C A N J E W I S H Y E A R B O O K , 2 0 0 4
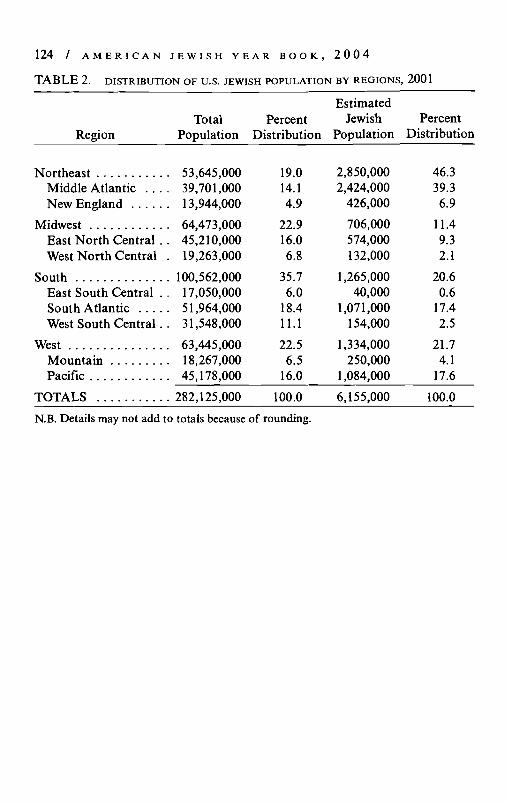
T A B L E 2. DISTRIBUTION OF U.S. JEWISH POPULATION BY REGIONS, 2001
RegionTotal
PopulationPercent
Distribution
EstimatedJewish
PopulationPercent
Distribution
Northeast 53,645,000 19.0Middle Atlantic . . . . 39,701,000 14.1New England 13,944,000 4.9
Midwest 64,473,000 22.9East North Central . . 45,210,000 16.0West North Central . 19,263,000 6.8
South 100,562,000 35.7East South Central . . 17,050,000 6.0South Atlantic 51,964,000 18.4West South Central. . 31,548,000 11.1
West 63,445,000 22.5Mountain 18,267,000 6.5Pacific 45,178,000 16.0
TOTALS 282,125,000 100.0
N.B. Details may not add to totals because of rounding.
2,850,0002,424,000
426,000
706,000574,000132,000
1,265,00040,000
1,071,000154,000
1,334,000250,000
1,084,000
46.339.36.9
11.49.32.1
20.60.6
17.42.5
21.74.1
17.6
6,155,000 100.0
9.7
4.1
8.5
4.6
2.9
33.3
10.9
5.4
4.6
4.3
33.3
44.2
49.6
54.2
58.5
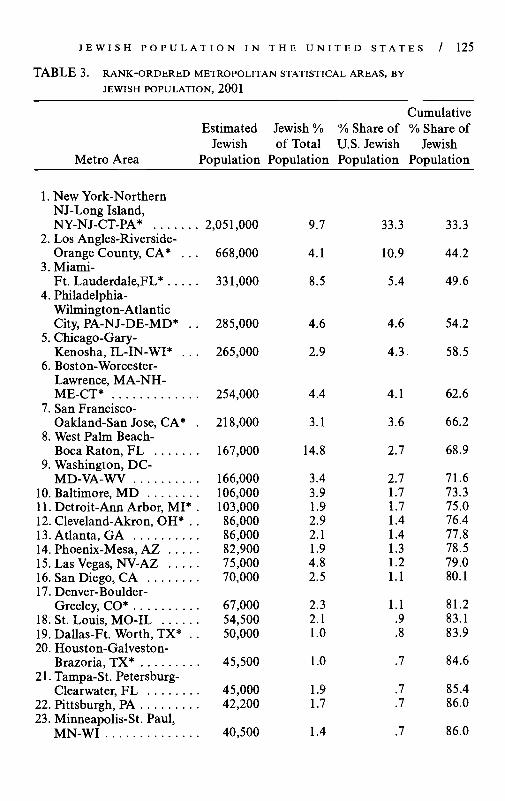
J E W I S H P O P U L A T I O N IN THE U N I T E D STATES / 125
TABLE 3. RANK-ORDERED METROPOLITAN STATISTICAL AREAS, BYJEWISH POPULATION, 2001
CumulativeEstimated Jewish % % Share of % Share of
Jewish of Total U.S. Jewish JewishMetro Area Population Population Population Population
1. New York-NorthernNJ-Long Island,NY-NJ-CT-PA* 2,051,000
2. Los Angles-Riverside-Orange County, CA* . . . 668,000
3. Miami-Ft. Lauderdale,FL* 331,000
4. Philadelphia-Wilmington-AtlanticCity, PA-NJ-DE-MD* . . 285,000
5. Chicago-Gary-Kenosha, IL-IN-WI* . . . 265,000
6. Boston-Worcester-Lawrence, MA-NH-ME-CT* 254,000 4.4 4.1 62.6
7. San Francisco-Oakland-San Jose, CA* . 218,000 3.1 3.6 66.2
8. West Palm Beach-Boca Raton, FL 167,000 14.8 2.7 68.9
9. Washington, DC-MD-VA-WV 166,000
10. Baltimore, MD 106,00011. Detroit-Ann Arbor, MI* . 103,00012. Cleveland-Akron, OH* . . 86,00013. Atlanta, GA 86,00014. Phoenix-Mesa, AZ 82,90015. Las Vegas, NV-AZ 75,00016. San Diego, CA 70,00017. Denver-Boulder-
Greeley, CO* 67,00018. St. Louis, MO-IL 54,50019. Dallas-Ft. Worth, TX* . . 50,00020. Houston-Galveston-
Brazoria, TX* 45,50021. Tampa-St. Petersburg-
Clearwater, FL 45,00022. Pittsburgh, PA 42,20023. Minneapolis-St. Paul,
MN-WI 40,500 1.4 .7 86.0
3.43.91.92.92.11.94.82.5
2.32.11.0
1.0
1.91.7
2.71.71.71.41.41.31.21.1
1.1.9.8
.7
.7
.7
71.673.375.076.477.878.579.080.1
81.283.183.9
84.6
85.486.0
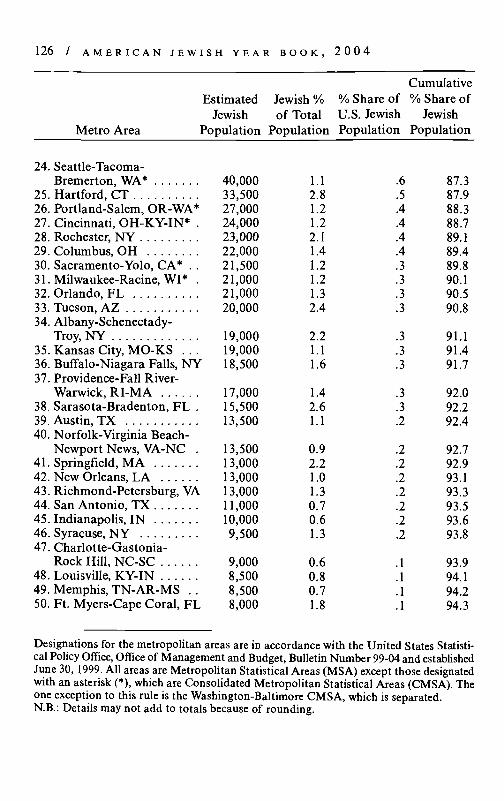
1 2 6 / A M E R I C A N J E W I S H Y E A R B O O K . , 2 0 0 4
Metro Area
CumulativeEstimated Jewish % % Share of % Share of
Jewish of Total U.S. Jewish JewishPopulation Population Population Population
24. Seattle-Tacoma-Bremerton, WA* 40,000
25. Hartford, CT 33,50026. Portland-Salem, OR-WA* 27,00027. Cincinnati, OH-KY-IN* . 24,00028. Rochester, NY 23,00029. Columbus, OH 22,00030. Sacramento-Yolo, CA* . . 21,50031. Milwaukee-Racine, WI* . 21,00032. Orlando, FL 21,00033. Tucson, AZ 20,00034. Albany-Schenectady-
Troy.NY 19,00035. Kansas City, MO-KS . . . 19,00036. Buffalo-Niagara Falls, NY 18,50037. Providence-Fall River-
Warwick, RI-MA 17,00038. Sarasota-Bradenton, FL . 15,50039. Austin, TX 13,50040. Norfolk-Virginia Beach-
Newport News, VA-NC . 13,50041. Springfield, MA 13,00042. New Orleans, LA 13,00043. Richmond-Petersburg, VA 13,00044. San Antonio, TX 11,00045. Indianapolis, IN 10,00046. Syracuse, NY 9,50047. Charlotte-Gastonia-
Rock Hill, NC-SC 9,00048. Louisville, KY-IN 8,50049. Memphis, TN-AR-MS . . 8,50050. Ft. Myers-Cape Coral, FL 8,000
1.12.81.21.22.11.41.21.21.32.4
2.21.11.6
1.42.61.1
0.92.21.01.30.70.61.3
0.60.80.71.8
.6
.5
.4
.4
.4
.4
.3
.3
.3
.3
.3
.3
.3
.3
.3
.2
.2
.2
.2
.2
.2
.2
.2
.1
.1
.1
.1
87.387.988.388.789.189.489.890.190.590.8
91.191.491.7
92.092.292.4
92.792.993.193.393.593.693.8
93.994.194.294.3
Designations for the metropolitan areas are in accordance with the United States Statisti-cal Policy Office, Office of Management and Budget, Bulletin Number 99-04 and establishedJune 30, 1999. All areas are Metropolitan Statistical Areas (MSA) except those designatedwith an asterisk (*), which are Consolidated Metropolitan Statistical Areas (CMSA). Theone exception to this rule is the Washington-Baltimore CMSA, which is separated.N.B.: Details may not add to totals because of rounding.
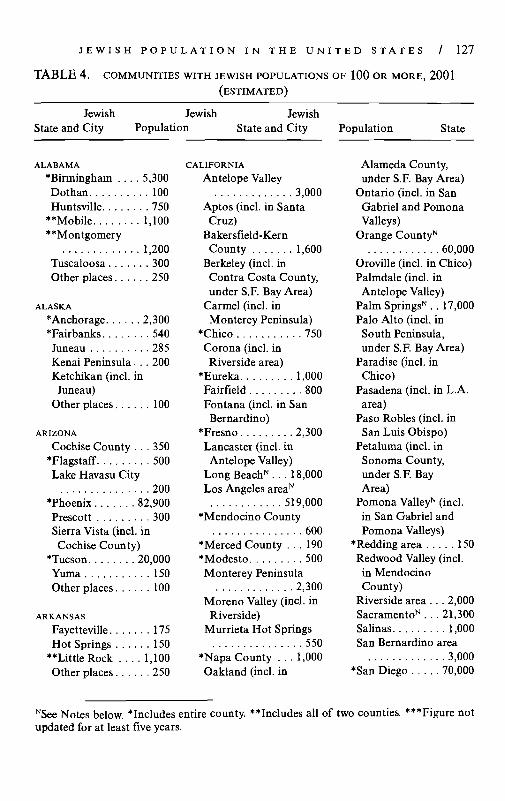
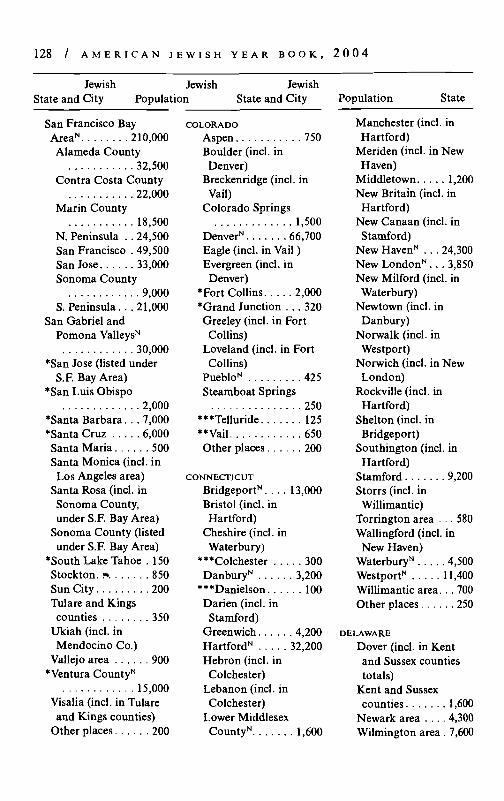
J E W I S H P O P U L A T I O N I N T H E U N I T E D S T A T E S / 1 2 7
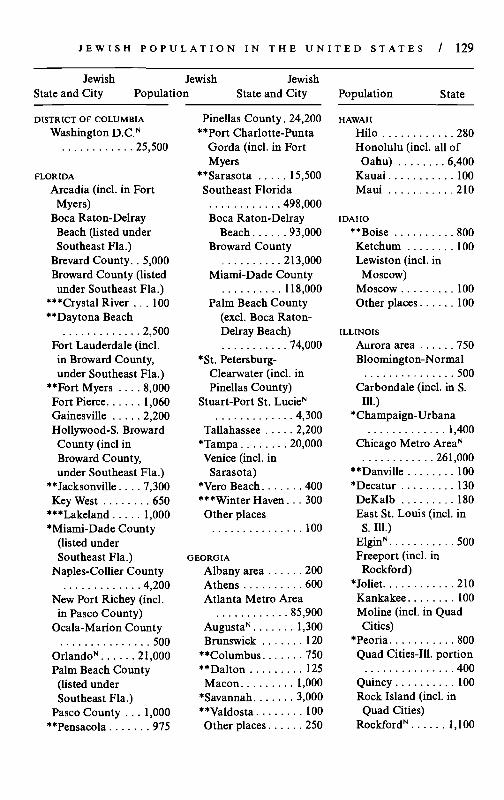
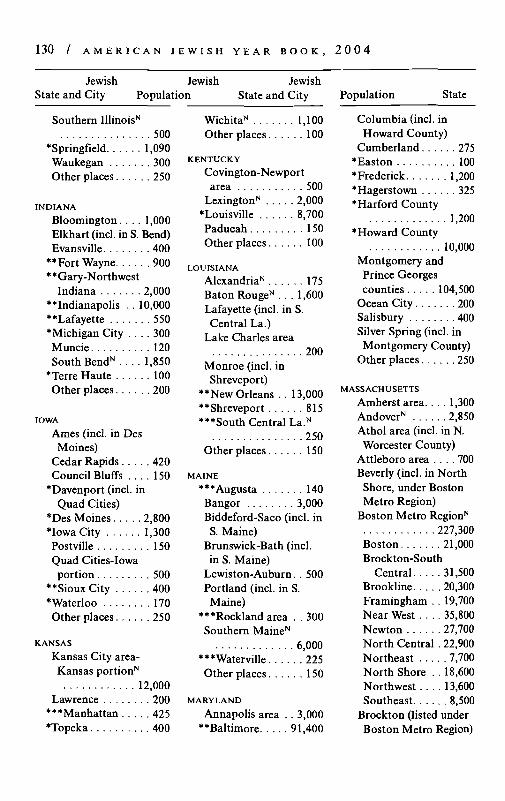
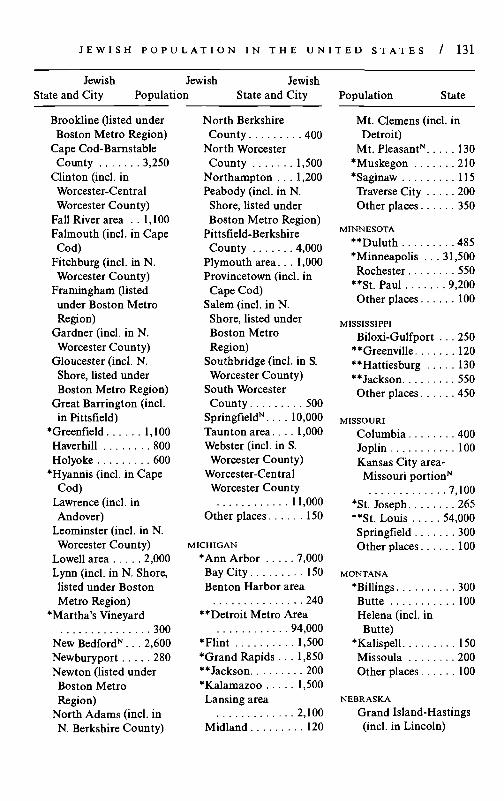
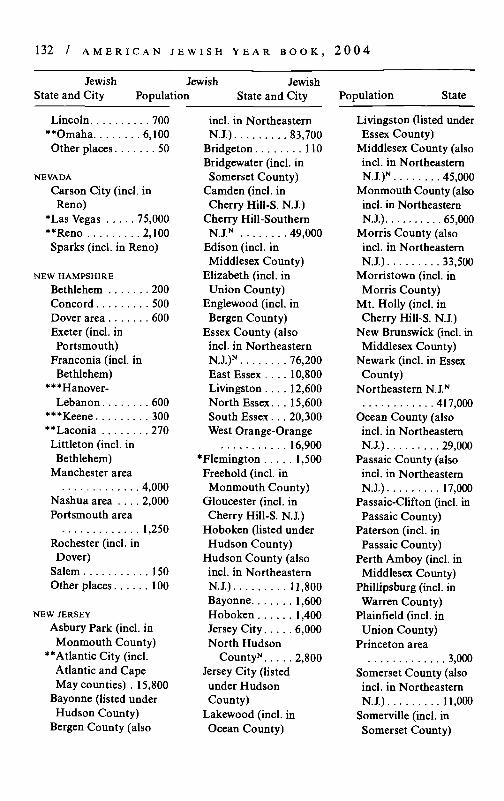
T A B L E 4. COMMUNITIES WITH JEWISH POPULATIONS OF 100 OR MORE, 2001
(ESTIMATED)
Jewish Jewish JewishState and City Population State and City Population State
ALABAMA
*Birmingham . . . . 5,300Dothan 100Huntsville 750
**Mobile 1,100**Montgomery
1,200Tuscaloosa 300Other places 250
ALASKA
•Anchorage 2,300•Fairbanks 540Juneau 285Kenai Peninsula... 200Ketchikan (incl. inJuneau)
Other places 100
ARIZONA
Cochise County . . . 350•Flagstaff 500Lake Havasu City
200•Phoenix 82,900Prescott 300Sierra Vista (incl. inCochise County)
•Tucson 20,000Yuma 150Other places 100
ARKANSAS
Fayetteville 175Hot Springs 150
••Little Rock 1,100Other places 250
CALIFORNIA
Antelope Valley3,000
Aptos (incl. in SantaCruz)
Bakersfield-KernCounty 1,600
Berkeley (incl. inContra Costa County,under S.F. Bay Area)
Carmel (incl. inMonterey Peninsula)
•Chico 750Corona (incl. inRiverside area)
•Eureka 1,000Fairfield 800Fontana (incl. in SanBernardino)
•Fresno 2,300Lancaster (incl. inAntelope Valley)
Long BeachN . . . 18,000Los Angeles areaN
519,000•Mendocino County
600•Merced County . . . 190•Modesto 500Monterey Peninsula
2,300Moreno Valley (incl. inRiverside)
Murrieta Hot Springs550
•Napa County . . . 1,000Oakland (incl. in
Alameda County,under S.F. Bay Area)
Ontario (incl. in SanGabriel and PomonaValleys)
Orange CountyN
60,000Oroville (incl. in Chico)Palmdale (incl. inAntelope Valley)
Palm Springs'". . 17,000Palo Alto (incl. inSouth Peninsula,under S.F. Bay Area)
Paradise (incl. inChico)
Pasadena (incl. in L.A.area)
Paso Robles (incl. inSan Luis Obispo)
Petaluma (incl. inSonoma County,under S.F. BayArea)
Pomona ValleyN (incl.in San Gabriel andPomona Valleys)
•Redding area 150Redwood Valley (incl.in MendocinoCounty)
Riverside area . . . 2,000SacramentoN . . . 21,300Salinas 1,000San Bernardino area
3,000•San Diego 70,000
NSee Notes below. •Includes entire county. ••Includes all of two counties. •••Figure notupdated for at least five years.
1 2 8 / A M E R I C A N J E W I S H Y E A R B O O K , 2 0 0 4
JewishState and City
JewishPopulation
JewishState and City
San Francisco BayAreaN 210,000Alameda County
32,500Contra Costa County
22,000Marin County
18,500N. Peninsula . . 24,500San Francisco . 49,500San Jose 33,000Sonoma County
9,000S. Peninsula. . .21,000
San Gabriel andPomona ValleysN
30,000*San Jose (listed under
S.F. Bay Area)*San Luis Obispo
2,000*Santa Barbara.. . 7,000•Santa Cruz 6,000Santa Maria 500Santa Monica (incl. inLos Angeles area)
Santa Rosa (incl. inSonoma County,under S.F. Bay Area)
Sonoma County (listedunder S.F. Bay Area)
•South Lake Tahoe . 150Stockton. ;*. 850Sun City 200Tulare and Kingscounties 350
Ukiah (incl. inMendocino Co.)
Vallejo area 900•Ventura CountyN
15,000Visalia (incl. in Tulareand Kings counties)
Other places 200
COLORADO
Aspen 750Boulder (incl. inDenver)
Breckenridge (incl. inVail)
Colorado Springs1,500
Denver"1 66,700Eagle (incl. in Vail)Evergreen (incl. inDenver)
•Fort Collins 2,000•Grand Junction . . . 320Greeley (incl. in FortCollins)
Loveland (incl. in FortCollins)
PuebloN 425Steamboat Springs
250•••Telluride 125••Vail 650Other places 200
CONNECTICUT
Bridgeport 13,000Bristol (incl. inHartford)
Cheshire (incl. inWaterbury)
•••Colchester 300DanburyN 3,200
•••Danielson 100Darien (incl. inStamford)
Greenwich 4,200HartfordN 32,200Hebron (incl. inColchester)
Lebanon (incl. inColchester)
Lower MiddlesexCountyN 1,600
Population State
Manchester (incl. inHartford)
Meriden (incl. in NewHaven)
Middletown 1,200New Britain (incl. inHartford)
New Canaan (incl. inStamford)
New HavenN . . . 24,300New London1".. . 3,850New Milford (incl. inWaterbury)
Newtown (incl. inDanbury)
Norwalk (incl. inWestport)
Norwich (incl. in NewLondon)
Rockville (incl. inHartford)
Shelton (incl. inBridgeport)
Southington (incl. inHartford)
Stamford 9,200Storrs (incl. inWillimantic)
Torrington area . . . 580Wallingford (incl. inNew Haven)
WaterburyN 4,500WestportN 11,400Willimantic area. . . 700Other places 250
DELAWARE
Dover (incl. in Kentand Sussex countiestotals)
Kent and Sussexcounties 1,600
Newark area 4,300Wilmington area. 7,600
J E W I S H P O P U L A T I O N I N T H E U N I T E D S T A T E S / 129
JewishState and City
JewishPopulation
JewishState and City Population State
DISTRICT OF COLUMBIA
Washington D.C.N
25,500
FLORIDA
Arcadia (incl. in FortMyers)
Boca Raton-DelrayBeach (listed underSoutheast Fla.)
Brevard County. . 5,000Broward County (listedunder Southeast Fla.)
** "Crystal River . . . 100**Daytona Beach
2,500Fort Lauderdale (incl.in Broward County,under Southeast Fla.)
**Fort Myers 8,000Fort Pierce 1,060Gainesville 2,200Hollywood-S. BrowardCounty (incl inBroward County,under Southeast Fla.)
••Jacksonville 7,300Key West 650
***Lakeland 1,000*Miami-Dade County
(listed underSoutheast Fla.)
Naples-Collier County4,200
New Port Richey (incl.in Pasco County)
Ocala-Marion County500
OrlandoN 21,000Palm Beach County(listed underSoutheast Fla.)
Pasco County . . . 1,000**Pensacola 975
Pinellas County. 24,200**Port Charlotte-Punta
Gorda (incl. in FortMyers
**Sarasota 15,500Southeast Florida
498,000Boca Raton-Delray
Beach 93,000Broward County
213,000Miami-Dade County
118,000Palm Beach County
(excl. Boca Raton-Delray Beach)
74,000*St. Petersburg-
Clearwater (incl. inPinellas County)
Stuart-Port St. LucieN
4,300Tallahassee 2,200
*Tampa 20,000Venice (incl. in
Sarasota)*Vero Beach 400***Winter Haven.. . 300Other places
100
GEORGIA
Albany area 200Athens 600Atlanta Metro Area
85,900AugustaN 1,300Brunswick 120
**Columbus 750**Dalton 125Macon 1,000
•Savannah 3,000**Valdosta 100Other places 250
HAWAII
Hilo 280Honolulu (incl. all of
Oahu) 6,400Kauai 100Maui 210
IDAHO
**Boise 800Ketchum 100Lewiston (incl. in
Moscow)Moscow 100Other places 100
ILLINOIS
Aurora area 750Bloomington-Normal
500Carbondale (incl. in S.111.)
*Champaign-Urbana1,400
Chicago Metro AreaN
261,000••Danville 100•Decatur 130DeKalb 180East St. Louis (incl. inS. 111.)
ElginN 500Freeport (incl. inRockford)
•Joliet 210Kankakee 100Moline (incl. in QuadCities)
•Peoria 800Quad Cities-Ill, portion
400Quincy 100Rock Island (incl. inQuad Cities)
RockfordN 1,100
1 3 0 / A M E R I C A N J E W I S H Y E A R B O O K , 2 0 0 4
JewishState and City
JewishPopulation
JewishState and City
Southern Illinois'"500
•Springfield 1,090Waukegan 300Other places 250
INDIANA
Bloomington.. . . 1,000Elkhart (incl. in S. Bend)Evansville 400
**Fort Wayne 900* *Gary-Northwest
Indiana 2,000**Indianapolis . . 10,000**Lafayette 550•Michigan City . . . . 300Muncie 120South BendN 1,850
Terre Haute 100Other places 200
IOWA
Ames (incl. in DesMoines)
Cedar Rapids 420Council Bluffs 150
•Davenport (incl. inQuad Cities)
•Des Moines 2,800•Iowa City 1,300Postville 150Quad Cities-Iowaportion 500
•*SiouxCity 400•Waterloo 170Other places 250
KANSAS
Kansas City area-Kansas portionN
12,000Lawrence 200
•••Manhattan 425•Topeka 400
WichitaN 1,100Other places 100
KENTUCKY
Covington-Newportarea 500
LexingtonN 2,000•Louisville 8,700Paducah 150Other places 100
LOUISIANA
Alexandria"1 175Baton RougeN . . . 1,600Lafayette (incl. in S.Central La.)
Lake Charles area200
Monroe (incl. inShreveport)
••New Orleans . . 13,000••Shreveport 815•••South Central La.N
250Other places 150
MAINE
•••Augusta 140Bangor 3,000Biddeford-Saco (incl. inS. Maine)
Brunswick-Bath (incl.in S. Maine)
Lewiston-Auburn. . 500Portland (incl. in S.Maine)
•••Rocklandarea . .300Southern MaineN
6,000•••Waterville 225Other places 150
MARYLAND
Annapolis area . . 3,000••Baltimore 91,400
Population State
Columbia (incl. inHoward County)
Cumberland 275•Easton 100•Frederick 1,200•Hagerstown 325•Harford County
1,200•Howard County
10,000Montgomery andPrince Georgescounties 104,500
Ocean City 200Salisbury 400Silver Spring (incl. inMontgomery County)
Other places 250
MASSACHUSETTS
Amherst area. . . . 1,300AndoverN 2,850Athol area (incl. in N.Worcester County)
Attleboro area . . . . 700Beverly (incl. in NorthShore, under BostonMetro Region)
Boston Metro RegionN
227,300Boston 21,000Brockton-South
Central 31,500Brookline 20,300Framingham . . 19,700Near West 35,800Newton 27,700North Central . 22,900Northeast 7,700North Shore . . 18,600Northwest 13,600Southeast 8,500
Brockton (listed underBoston Metro Region)
J E W I S H P O P U L A T I O N I N T H E U N I T E D S T A T E S / 131
JewishState and City
JewishPopulation
JewishState and City
Brookline (listed underBoston Metro Region)
Cape Cod-BarastableCounty 3,250
Clinton (incl. inWorcester-CentralWorcester County)
Fall River area . . 1,100Falmouth (incl. in CapeCod)
Fitchburg (incl. in N.Worcester County)
Framingham (listedunder Boston MetroRegion)
Gardner (incl. in N.Worcester County)
Gloucester (incl. N.Shore, listed underBoston Metro Region)
Great Barrington (incl.in Pittsfield)
•Greenfield 1,100Haverhill 800Holyoke 600
*Hyannis (incl. in CapeCod)
Lawrence (incl. inAndover)
Leominster (incl. in N.Worcester County)
Lowell area 2,000Lynn (incl. in N. Shore,listed under BostonMetro Region)
*Martha's Vineyard300
New BedfordN . . . 2,600Newburyport 280Newton (listed underBoston MetroRegion)
North Adams (incl. inN. Berkshire County)
North BerkshireCounty 400
North WorcesterCounty 1,500
Northampton . . . 1,200Peabody (incl. in N.
Shore, listed underBoston Metro Region)
Pittsfield-BerkshireCounty 4,000
Plymouth area. . . 1,000Provincetown (incl. inCape Cod)
Salem (incl. in N.Shore, listed underBoston MetroRegion)
Southbridge (incl. in S.Worcester County)
South WorcesterCounty 500
SpringfieldN.... 10,000Tauntonarea 1,000Webster (incl. in S.
Worcester County)Worcester-CentralWorcester County
11,000Other places 150
MICHIGAN
*Ann Arbor 7,000Bay City 150Benton Harbor area
240**Detroit Metro Area
94,000•Flint 1,500*Grand Rapids . . . 1,850**Jackson 200*Kalamazoo 1,500Lansing area
2,100Midland 120
Population State
Mt. Clemens (incl. inDetroit)
Mt. PleasantN 130•Muskegon 210*Saginaw 115Traverse City 200Other places 350
MINNESOTA
**Duluth 485•Minneapolis . . . 31,500Rochester 550
**St. Paul 9,200Other places 100
MISSISSIPPI
Biloxi-Gulfport . . . 250••Greenville 120••Hattiesburg 130••Jackson 550Other places 450
MISSOURI
Columbia 400Joplin 100Kansas City area-
Missouri portion1"7,100
•St. Joseph 265••St. Louis 54,000Springfield 300Other places 100
MONTANA
•Billings 300Butte 100Helena (incl. inButte)
•Kalispell 150Missoula 200Other places 100
NEBRASKA
Grand Island-Hastings(incl. in Lincoln)
1 3 2 / A M E R I C A N J E W I S H Y E A R B O O K , 2 0 0 4
JewishState and City
JewishPopulation
JewishState and City Population State
Lincoln 700**Omaha 6,100Other places 50
NEVADA
Carson City (incl. inReno)
*Las Vegas 75,000**Reno 2,100Sparks (incl. in Reno)
NEW HAMPSHIRE
Bethlehem 200Concord 500Dover area 600Exeter (incl. inPortsmouth)
Franconia (incl. inBethlehem)
***Hanover-Lebanon 600
***Keene 300**Laconia 270Littleton (incl. inBethlehem)
Manchester area4,000
Nashua area . . . . 2,000Portsmouth area
1,250Rochester (incl. inDover)
Salem 150Other places 100
NEW JERSEY
Asbury Park (incl. inMonmouth County)
••Atlantic City (incl.Atlantic and CapeMay counties) . 15,800
Bayonne (listed underHudson County)
Bergen County (also
incl. in NortheasternN. I ) 83,700
Bridgeton 110Bridgewater (incl. inSomerset County)
Camden (incl. inCherry Hill-S. N.J.)
Cherry Hill-SouthernN.J.N 49,000
Edison (incl. inMiddlesex County)
Elizabeth (incl. inUnion County)
Englewood (incl. inBergen County)
Essex County (alsoincl. in NortheasternN.J.)N 76,200East Essex 10,800Livingston 12,600North Essex. . . 15,600South Essex . . . 20,300West Orange-Orange
16,900*Flemington 1,500Freehold (incl. inMonmouth County)
Gloucester (incl. inCherry Hill-S. N.J.)
Hoboken (listed underHudson County)
Hudson County (alsoincl. in NortheasternN.J.) 11,800Bayonne 1,600Hoboken 1,400Jersey City 6,000North Hudson
CountyN 2,800Jersey City (listedunder HudsonCounty)
Lakewood (incl. inOcean County)
Livingston (listed underEssex County)
Middlesex County (alsoincl. in NortheasternN.J.)N 45,000
Monmouth County (alsoincl. in NortheasternN.J.) 65,000
Morris County (alsoincl. in NortheasternN.J.) 33,500
Morristown (incl. inMorris County)
Mt. Holly (incl. inCherry Hill-S. N.J.)
New Brunswick (incl. inMiddlesex County)
Newark (incl. in EssexCounty)
Northeastern N.J.N
417,000Ocean County (alsoincl. in NortheasternN.J.) 29,000
Passaic County (alsoincl. in NortheasternN.J.) 17,000
Passaic-Clifton (incl. inPassaic County)
Paterson (incl. inPassaic County)
Perth Amboy (incl. inMiddlesex County)
Phillipsburg (incl. inWarren County)
Plainfield (incl. inUnion County)
Princeton area3,000
Somerset County (alsoincl. in NortheasternN.J.) 11,000
Somerville (incl. inSomerset County)
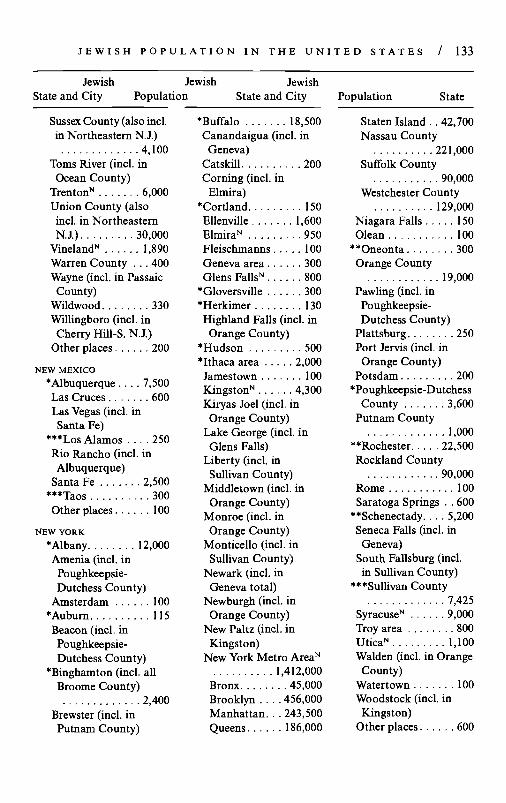
J E W I S H P O P U L A T I O N I N T H E U N I T E D S T A T E S / 1 3 3
JewishState and City
JewishPopulation
JewishState and City
Sussex County (also incl.in Northeastern N.J.)
4,100Toms River (incl. inOcean County)
TrentonN 6,000Union County (alsoincl. in NortheasternN.J.) 30,000
VinelandN 1,890Warren County . . . 400Wayne (incl. in PassaicCounty)
Wildwood 330Willingboro (incl. inCherry Hill-S. N.J.)
Other places 200
NEW MEXICO
•Albuquerque... . 7,500Las Cruces 600Las Vegas (incl. in
Santa Fe)***Los Alamos 250Rio Rancho (incl. inAlbuquerque)
Santa Fe 2,500***Taos 300Other places 100
NEW YORK
•Albany 12,000Amenia (incl. in
Poughkeepsie-Dutchess County)
Amsterdam 100*Auburn 115Beacon (incl. inPoughkeepsie-Dutchess County)
*Binghamton (incl. allBroome County)
2,400Brewster (incl. inPutnam County)
•Buffalo 18,500Canandaigua (incl. in
Geneva)Catskill 200Corning (incl. in
Elmira)•Cortland 150Ellenville 1,600ElmiraN 950Fleischmanns 100Geneva area 300Glens FallsN 800
•Gloversville 300*Herkimer 130Highland Falls (incl. in
Orange County)•Hudson 500•Ithaca area 2,000Jamestown 100Kingston1" 4,300Kiryas Joel (incl. in
Orange County)Lake George (incl. inGlens Falls)
Liberty (incl. inSullivan County)
Middletown (incl. inOrange County)
Monroe (incl. inOrange County)
Monticello (incl. inSullivan County)
Newark (incl. inGeneva total)
Newburgh (incl. inOrange County)
New Paltz (incl. inKingston)
New York Metro AreaN
1,412,000Bronx 45,000Brooklyn 456,000Manhattan. . . 243,500Queens 186,000
Population State
Staten Island . . 42,700Nassau County
221,000Suffolk County
90,000Westchester County
129,000Niagara Falls 150Olean 100
••Oneonta 300Orange County
19,000Pawling (incl. inPoughkeepsie-Dutchess County)
Plattsburg 250Port Jervis (incl. inOrange County)
Potsdam 200•Poughkeepsie-Dutchess
County 3,600Putnam County
1,000••Rochester 22,500Rockland County
90,000Rome 100Saratoga Springs . . 600
••Schenectady 5,200Seneca Falls (incl. inGeneva)
South Fallsburg (incl.in Sullivan County)
•••Sullivan County7,425
SyracuseN 9,000Troy area 800UticaN 1,100Walden (incl. in OrangeCounty)
Watertown 100Woodstock (incl. in
Kingston)Other places 600
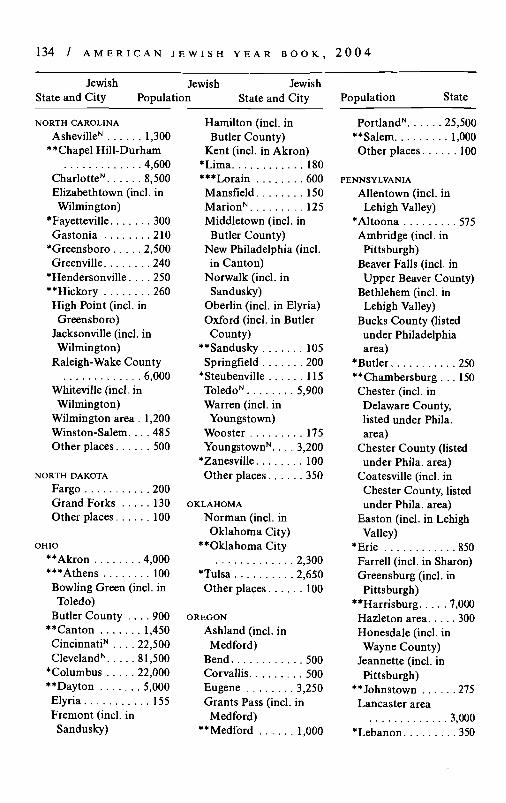
134 / AMERK
JewishState and City
NORTH CAROLINA
AsheviIleN
: A N J E W I S H Y E A R B O O K ,
Jewish JewishPopulation State and City
. 1,300**Chapel Hill-Durham
CharlotteN. 4,600. 8,500
Elizabethtown (incl. inWilmington)
•Fayetteville. . . .Gastonia
•Greensboro . . . .Greenville
*Hendersonville. .**HickoryHigh Point (incl.Greensboro)
Jacksonville (inclWilmington)
. . . 300
. . .210. 2,500. . . 240. . . 250. . . 260in
. in
Raleigh-Wake Countv
Whiteville (incl. iWilmington)
Wilmington areaWinston-Salem. .Other places . . . .
NORTH DAKOTA
FargoGrand Forks . . .Other p l a c e s . . . .
OHIO
**Akron***Athens
6 000n
. 1,200. . 485. . 500
.200..130. . 100
. 4,000. . 100
Bowling Green (incl. inToledo)
Butler County . .**CantonCincinnati"1 . . . .Cleveland1"
* Columbus**DaytonElyriaFremont (incl. inSandusky)
. .900. 1,45022,50081,50022,000. 5,000
155
Hamilton (incl. inButler County)
Kent (incl. in Akron)*Lima***LorainMansfieldMarionN
Middletown (incl.Butler County)
180..600. . 150. . 125in
New Philadelphia (incl.in Canton)
Norwalk (incl. inSandusky)
Oberlin (incl. in Elyria)Oxford (incl. in ButlerCounty)
**SanduskySpringfield
*SteubenvilleToledoN
Warren (incl. inYoungstown)
WoosterYoungstownN.. . .
*ZanesvilleOther p laces . . . .
OKLAHOMA
Norman (incl. inOklahoma City)
"""Oklahoma City
*TulsaOther places
OREGON
Ashland (incl. inMedford)
Bend.. .CorvallisEugene
Medford)**Medford
. . 105
. .200115
5,900
. . 1753,200
. . 100
..350
2 3002,650. . 100
500..5003,250
1,000
2 U U 4
Population State
PortlandN 25,500**Salem 1,000Other places 100
PENNSYLVANIA
Allentown (incl. inLehigh Valley)
*Altoona 575Ambridge (incl. inPittsburgh)
Beaver Falls (incl. inUpper Beaver County)
Bethlehem (incl. inLehigh Valley)
Bucks County (listedunder Philadelphiaarea)
*Butler 250**Chambersbure 150Chester (incl. inDelaware County,listed under Phila.area)
Chester County (listedunder Phila. area)
Coatesville (incl. inChester County, listedunder Phila. area)
Easton (incl. in LehighValley)
•Erie 850Farrell (incl. in Sharon)Greensburg (incl. inPittsburgh)
••Harrisburg 7,000Hazleton area 300Honesdale (incl. inWayne County)
Pittsburgh)**Johnstown 275
. 3,000•Lebanon 350
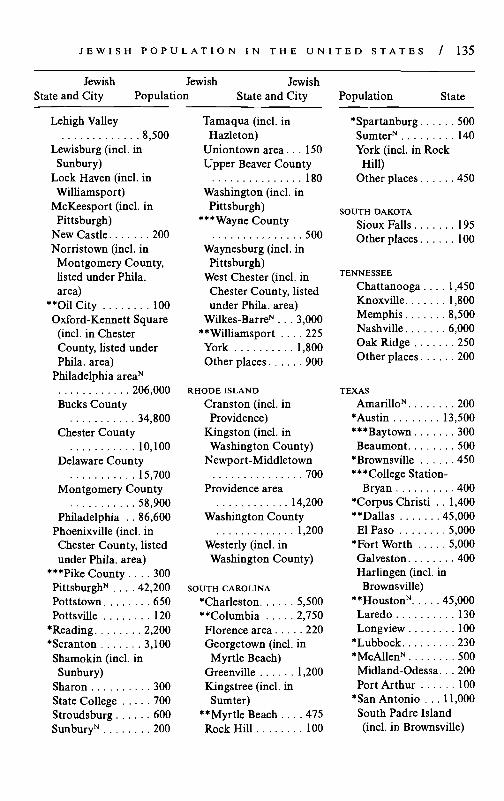
J E W I S H P O P U L A T I O N I N T H E U N I T E D S T A T E S / 1 3 5
JewishState and City
JewishPopulation
JewishState and City
Lehigh Valley8,500
Lewisburg (incl. inSunbury)
Lock Haven (incl. inWilliamsport)
McKeesport (incl. inPittsburgh)
Newcastle 200Norristown (incl. in
Montgomery County,listed under Phila.area)
**OilCity 100Oxford-Kennett Square(incl. in ChesterCounty, listed underPhila. area)
Philadelphia areaN
206,000Bucks County
34,800Chester County
10,100Delaware County
15,700Montgomery County
58,900Philadelphia . . 86,600
Phoenixville (incl. inChester County, listedunder Phila. area)
***Pike County 300Pittsburgh1" 42,200Pottstown 650Pottsville 120
•Reading 2,200•Scranton 3,100Shamokin (incl. inSunbury)
Sharon 300State College 700Stroudsburg 600SunburyN 200
Tamaqua (incl. inHazleton)
Uniontown area . . . 150Upper Beaver County
180Washington (incl. in
Pittsburgh)***Wayne County
500Waynesburg (incl. in
Pittsburgh)West Chester (incl. in
Chester County, listedunder Phila. area)
Wilkes-BarreN . . . 3,000**Williamsport 225York 1,800Other places 900
RHODE ISLAND
Cranston (incl. inProvidence)
Kingston (incl. inWashington County)
Newport-Middletown700
Providence area14,200
Washington County1,200
Westerly (incl. inWashington County)
SOUTH CAROLINA
•Charleston 5,500"•Columbia 2,750Florence area 220Georgetown (incl. inMyrtle Beach)
Greenville 1,200Kingstree (incl. inSumter)
**Myrtle Beach 475Rock Hill 100
Population State
•Spartanburg 500SumterN 140York (incl. in RockHill)
Other places 450
SOUTH DAKOTA
Sioux Falls 195Other places 100
TENNESSEE
Chattanooga.. . . 1,450Knoxville 1,800Memphis 8,500Nashville 6,000Oak Ridge 250Other places 200
TEXAS
AmarilloN 200•Austin 13,500•••Baytown 300Beaumont 500
•Brownsville 450•••College Station-
Bryan 400•Corpus Christi . . 1,400••Dallas 45,000El Paso 5,000
•Fort Worth 5,000Galveston 400Harlingen (incl. in
Brownsville)••HoustonN 45,000Laredo 130Longview 100
•Lubbock 230•McAllenN 500Midland-Odessa. . . 200Port Arthur 100
•San Antonio . . . 11,000South Padre Island(incl. in Brownsville)
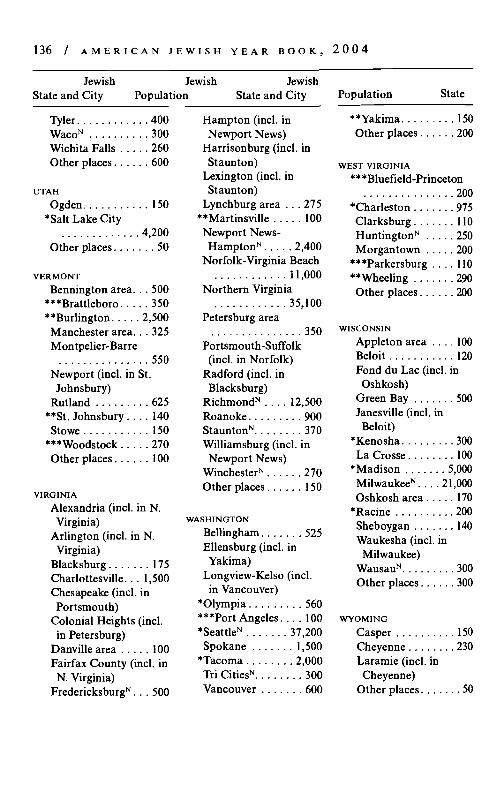
1 3 6 / A M E R I C A N J E W I S H Y E A R B O O K , 2 0 0 4
JewishState and City
JewishPopulation
JewishState and City
Tyler 400WacoN 300Wichita Falls 260Other places 600
UTAH
Ogden 150•Salt Lake City
4,200Other places 50
VERMONT
Bennington area. . . 500***Brattleboro 350**Burlington 2,500Manchester area. . . 325Montpelier-Barre
550Newport (incl. in St.Johnsbury)
Rutland 625**St. Johnsbury 140Stowe 150
***Woodstock 270Other places 100
VIRGINIA
Alexandria (incl. in N.Virginia)
Arlington (incl. in N.Virginia)
Blacksburg 175Charlottesville. . . 1,500Chesapeake (incl. inPortsmouth)
Colonial Heights (incl.in Petersburg)
Danville area 100Fairfax County (incl. in
N. Virginia)FredericksburgN... 500
Hampton (incl. inNewport News)
Harrisonburg (incl. inStaunton)
Lexington (incl. inStaunton)
Lynchburg area . . . 275**Martinsville 100Newport News-
HamptonN 2,400Norfolk-Virginia Beach
11,000Northern Virginia
35,100Petersburg area
350Portsmouth-Suffolk
(incl. in Norfolk)Radford (incl. inBlacksburg)
RichmondN 12,500Roanoke 900StauntonN 370Williamsburg (incl. inNewport News)
Winchester 270Other places 150
WASHINGTON
Bellingham 525Ellensburg (incl. inYakima)
Longview-Kelso (incl.in Vancouver)
*Olympia 560***Port Angeles 100*SeattleN 37,200Spokane 1,500
•Tacoma 2,000Tri CitiesN 300Vancouver 600
Population State
••Yakima 150Other places 200
WEST VIRGINIA
•••Bluefield-Princeton200
•Charleston 975Clarksburg 110HuntingtonN 250Morgantown 200
•••Parkersburg . . . . 110••Wheeling 290Other places 200
WISCONSIN
Appleton area . . . . 100Beloit 120Fond du Lac (incl. inOshkosh)
Green Bay 500Janesville (incl. inBeloit)
•Kenosha 300La Crosse 100
•Madison 5,000Milwaukee"1 21,000Oshkosh area 170
•Racine 200Sheboygan 140Waukesha (incl. in
Milwaukee)WausauN 300Other places 300
WYOMING
Casper 150Cheyenne 230Laramie (incl. inCheyenne)
Other places 50
J E W I S H P O P U L A T I O N I N T H E U N I T E D S T A T E S / 1 3 7
Notes
CALIFORNIA
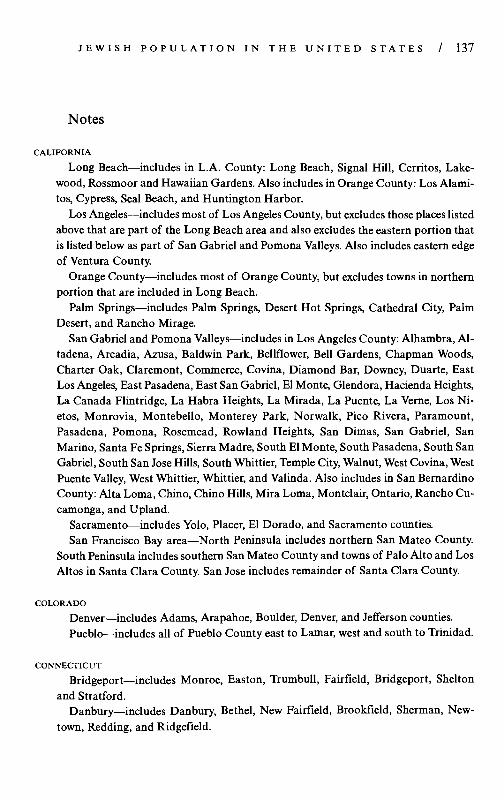
Long Beach—includes in L.A. County: Long Beach, Signal Hill, Cerritos, Lake-wood, Rossmoor and Hawaiian Gardens. Also includes in Orange County: Los Alami-tos, Cypress, Seal Beach, and Huntington Harbor.
Los Angeles—includes most of Los Angeles County, but excludes those places listedabove that are part of the Long Beach area and also excludes the eastern portion thatis listed below as part of San Gabriel and Pomona Valleys. Also includes eastern edgeof Ventura County.
Orange County—includes most of Orange County, but excludes towns in northernportion that are included in Long Beach.
Palm Springs—includes Palm Springs, Desert Hot Springs, Cathedral City, PalmDesert, and Rancho Mirage.
San Gabriel and Pomona Valleys—includes in Los Angeles County: Alhambra, Al-tadena, Arcadia, Azusa, Baldwin Park, Bellflower, Bell Gardens, Chapman Woods,Charter Oak, Claremont, Commerce, Covina, Diamond Bar, Downey, Duarte, EastLos Angeles, East Pasadena, East San Gabriel, El Monte, Glendora, Hacienda Heights,La Canada Flintridge, La Habra Heights, La Mirada, La Puente, La Verne, Los Ni-etos, Monrovia, Montebello, Monterey Park, Norwalk, Pico Rivera, Paramount,Pasadena, Pomona, Rosemead, Rowland Heights, San Dimas, San Gabriel, SanMarino, Santa Fe Springs, Sierra Madre, South El Monte, South Pasadena, South SanGabriel, South San Jose Hills, South Whittier, Temple City, Walnut, West Covina, WestPuente Valley, West Whittier, Whittier, and Valinda. Also includes in San BernardinoCounty: Alta Loma, Chino, Chino Hills, Mira Loma, Montclair, Ontario, Rancho Cu-camonga, and Upland.
Sacramento—includes Yolo, Placer, El Dorado, and Sacramento counties.San Francisco Bay area—North Peninsula includes northern San Mateo County.
South Peninsula includes southern San Mateo County and towns of Palo Alto and LosAltos in Santa Clara County. San Jose includes remainder of Santa Clara County.
COLORADO
Denver—includes Adams, Arapahoe, Boulder, Denver, and Jefferson counties.Pueblo—includes all of Pueblo County east to Lamar, west and south to Trinidad.
CONNECTICUT
Bridgeport—includes Monroe, Easton, Trumbull, Fairfield, Bridgeport, Sheltonand Stratford.
Danbury—includes Danbury, Bethel, New Fairfield, Brookfield, Sherman, New-town, Redding, and Ridgefield.
138 / A M E R I C A N J E W I S H Y E A R B O O K , 2 0 0 4
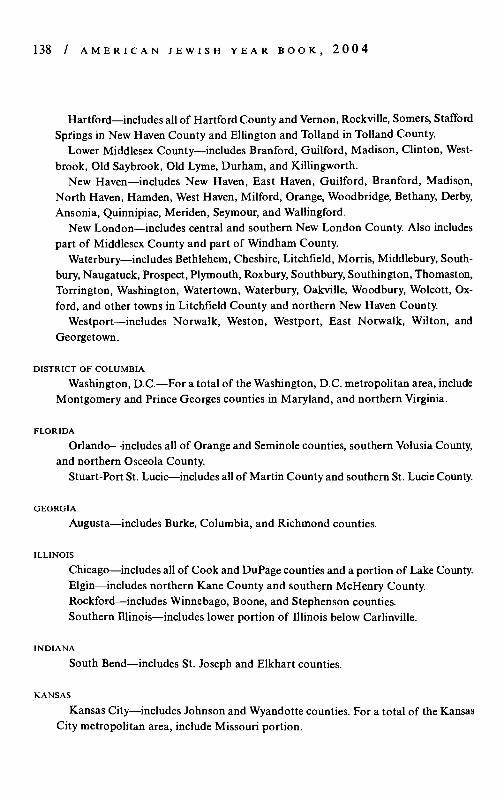
Hartford—includes all of Hartford County and Vernon, Rockville, Somers, StaffordSprings in New Haven County and Ellington and Tolland in Tolland County.
Lower Middlesex County—includes Branford, Guilford, Madison, Clinton, West-brook, Old Saybrook, Old Lyme, Durham, and Killingworth.
New Haven—includes New Haven, East Haven, Guilford, Branford, Madison,North Haven, Hamden, West Haven, Milford, Orange, Woodbridge, Bethany, Derby,Ansonia, Quinnipiac, Meriden, Seymour, and Wallingford.
New London—includes central and southern New London County. Also includespart of Middlesex County and part of Windham County.
Waterbury—includes Bethlehem, Cheshire, Litchfield, Morris, Middlebury, South-bury, Naugatuck, Prospect, Plymouth, Roxbury, Southbury, Southington, Thomaston,Torrington, Washington, Watertown, Waterbury, Oakville, Woodbury, Wolcott, Ox-ford, and other towns in Litchfield County and northern New Haven County.
Westport—includes Norwalk, Weston, Westport, East Norwalk, Wilton, andGeorgetown.
DISTRICT OF COLUMBIA
Washington, D.C.—For a total of the Washington, D.C. metropolitan area, includeMontgomery and Prince Georges counties in Maryland, and northern Virginia.
FLORIDA
Orlando—includes all of Orange and Seminole counties, southern Volusia County,and northern Osceola County.
Stuart-Port St. Lucie—includes all of Martin County and southern St. Lucie County.
GEORGIA
Augusta—includes Burke, Columbia, and Richmond counties.
ILLINOIS
Chicago—includes all of Cook and DuPage counties and a portion of Lake County.Elgin—includes northern Kane County and southern McHenry County.Rockford—includes Winnebago, Boone, and Stephenson counties.Southern Illinois—includes lower portion of Illinois below Carlinville.
INDIANA
South Bend—includes St. Joseph and Elkhart counties.
KANSAS
Kansas City—includes Johnson and Wyandotte counties. For a total of the KansasCity metropolitan area, include Missouri portion.
J E W I S H P O P U L A T I O N I N T H E U N I T E D S T A T E S / 1 3 9
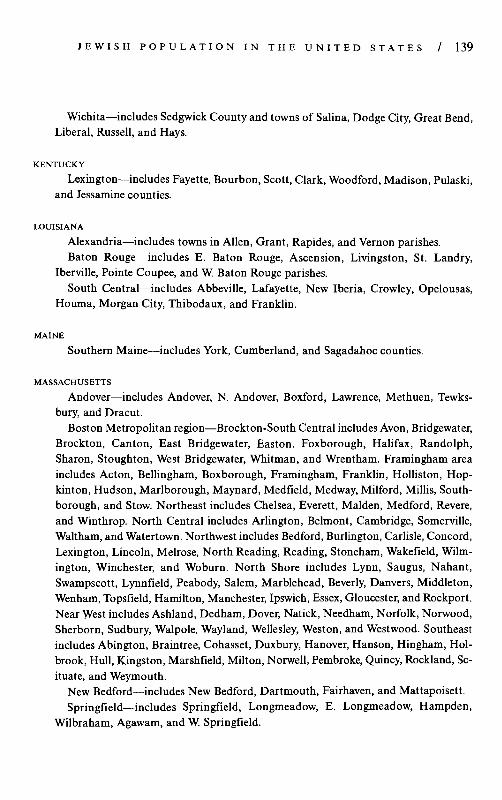
Wichita—includes Sedgwick County and towns of Salina, Dodge City, Great Bend,Liberal, Russell, and Hays.
KENTUCKY
Lexington—includes Fayette, Bourbon, Scott, Clark, Woodford, Madison, Pulaski,and Jessamine counties.
LOUISIANA
Alexandria—includes towns in Allen, Grant, Rapides, and Vernon parishes.Baton Rouge—includes E. Baton Rouge, Ascension, Livingston, St. Landry,
Iberville, Pointe Coupee, and W. Baton Rouge parishes.South Central—includes Abbeville, Lafayette, New Iberia, Crowley, Opelousas,
Houma, Morgan City, Thibodaux, and Franklin.
MAINE
Southern Maine—includes York, Cumberland, and Sagadahoc counties.
MASSACHUSETTS
Andover—includes Andover, N. Andover, Boxford, Lawrence, Methuen, Tewks-bury, and Dracut.
Boston Metropolitan region—Brockton-South Central includes Avon, Bridgewater,Brockton, Canton, East Bridgewater, Easton. Foxborough, Halifax, Randolph,Sharon, Stoughton, West Bridgewater, Whitman, and Wrentham. Framingham areaincludes Acton, Bellingham, Boxborough, Framingham, Franklin, Holliston, Hop-kinton, Hudson, Marlborough, Maynard, Medfield, Medway, Milford, Millis, South-borough, and Stow. Northeast includes Chelsea, Everett, Maiden, Medford, Revere,and Winthrop. North Central includes Arlington, Belmont, Cambridge, Somerville,Waltham, and Watertown. Northwest includes Bedford, Burlington, Carlisle, Concord,Lexington, Lincoln, Melrose, North Reading, Reading, Stoneham, Wakefield, Wilm-ington, Winchester, and Woburn. North Shore includes Lynn, Saugus, Nahant,Swampscott, Lynnfield, Peabody, Salem, Marblehead, Beverly, Danvers, Middleton,Wenham, Topsfield, Hamilton, Manchester, Ipswich, Essex, Gloucester, and Rockport.Near West includes Ashland, Dedham, Dover, Natick, Needham, Norfolk, Norwood,Sherborn, Sudbury, Walpole, Wayland, Wellesley, Weston, and Westwood. Southeastincludes Abington, Braintree, Cohasset, Duxbury, Hanover, Hanson, Hingham, Hol-brook, Hull, Kingston, Marshfield, Milton, Norwell, Pembroke, Quincy, Rockland, Sc-ituate, and Weymouth.
New Bedford—includes New Bedford, Dartmouth, Fairhaven, and Mattapoisett.Springfield—includes Springfield, Longmeadow, E. Longmeadow, Hampden,
Wilbraham, Agawam, and W. Springfield.
1 4 0 / A M E R I C A N J E W I S H Y E A R B O O K , 2 0 0 4
MICHIGAN
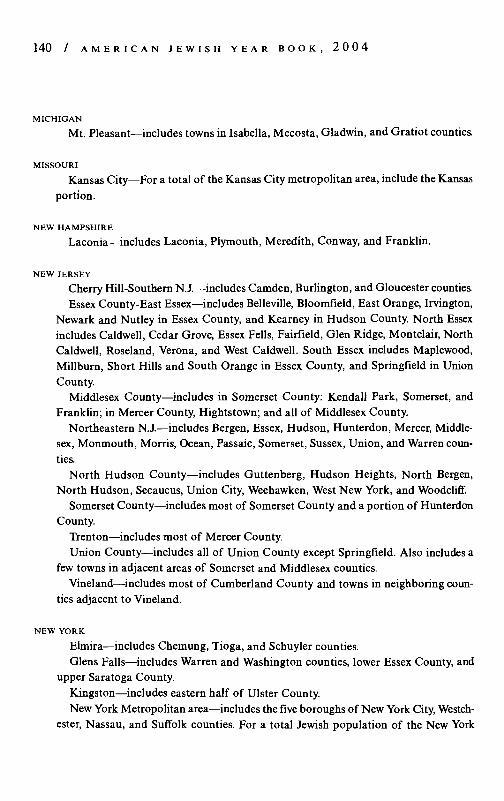
Mt. Pleasant—includes towns in Isabella, Mecosta, Gladwin, and Gratiot counties.
MISSOURI
Kansas City—For a total of the Kansas City metropolitan area, include the Kansasportion.
NEW HAMPSHIRE
Laconia—includes Laconia, Plymouth, Meredith, Conway, and Franklin.
NEW JERSEY
Cherry Hill-Southern N. J.—includes Camden, Burlington, and Gloucester counties.Essex County-East Essex—includes Belleville, Bloomfield, East Orange, Irvington,
Newark and Nutley in Essex County, and Kearney in Hudson County. North Essexincludes Caldwell, Cedar Grove, Essex Fells, Fairfield, Glen Ridge, Montclair, NorthCaldwell, Roseland, Verona, and West Caldwell. South Essex includes Maplewood,Millburn, Short Hills and South Orange in Essex County, and Springfield in UnionCounty.
Middlesex County—includes in Somerset County: Kendall Park, Somerset, andFranklin; in Mercer County, Hightstown; and all of Middlesex County.
Northeastern N.J.—includes Bergen, Essex, Hudson, Hunterdon, Mercer, Middle-sex, Monmouth, Morris, Ocean, Passaic, Somerset, Sussex, Union, and Warren coun-ties.
North Hudson County—includes Guttenberg, Hudson Heights, North Bergen,North Hudson, Secaucus, Union City, Weehawken, West New York, and Woodcliff.
Somerset County—includes most of Somerset County and a portion of HunterdonCounty.
Trenton—includes most of Mercer County.Union County—includes all of Union County except Springfield. Also includes a
few towns in adjacent areas of Somerset and Middlesex counties.Vineland—includes most of Cumberland County and towns in neighboring coun-
ties adjacent to Vineland.
NEW YORK
Elmira—includes Chemung, Tioga, and Schuyler counties.Glens Falls—includes Warren and Washington counties, lower Essex County, and
upper Saratoga County.Kingston—includes eastern half of Ulster County.New York Metropolitan area—includes the five boroughs of New York City, Westch-
ester, Nassau, and Suffolk counties. For a total Jewish population of the New York
J E W I S H P O P U L A T I O N I N T H E U N I T E D S T A T E S / 141
metropolitan region, include Fairfield and New Haven counties, Connecticut; Rock-land, Putnam, and Orange counties, New York; Northeastern New Jersey, and PikeCounty, Pennsylvania.
Syracuse—includes Onondaga County, western Madison County, and most of Os-wego County.
Utica—southeastern third of Oneida County.
NORTH CAROLINA
Asheville—includes Buncombe, Haywood, and Madison counties.Charlotte—includes Mecklenburg County. For a total of the Charlotte area, include
Rock Hill, South Carolina.
OHIO
Cincinnati—includes Hamilton and Butler counties. For a total of the Cincinnatiarea, include the Covington-Newport area of Kentucky.
Cleveland—includes all of Cuyahoga County and portions of Lake, Geauga,Portage, and Summit counties. For a metropolitan total, also include Elyria, Lorain,and Akron.
Toledo—includes Fulton, Lucas, and Wood counties.Youngstown—includes Mahoning and Trumbull counties.
PENNSYLVANIA
Philadelphia—For total Jewish population of the Philadelphia metropolitan re-gion, include the Cherry Hill-Southern, N. J., Princeton, and Trenton areas of New Jer-sey, and the Wilmington and Newark areas of Delaware.
Pittsburgh—includes all of Allegheny County and adjacent portions of Washing-ton, Westmoreland, and Beaver counties.
Sunbury—includes Shamokin, Lewisburg, Milton, Selinsgrove, and Sunbury.Wilkes-Barre—includes all of Luzerne County except southern portion, which is in-
cluded in the Hazleton total.
SOUTH CAROLINA
Sumter—includes towns in Sumter, Lee, Clarendon, and Williamsburg counties.
TEXAS
Amarillo—includes Canyon, Childress, Borger, Dumas, Memphis, Pampa, Vega, andHereford in Texas, and Portales, New Mexico.
Houston—includes Harris, Montgomery, and Fort Bend counties, and parts of Bra-zoria and Galveston counties.
McAllen—includes Edinburg, Harlingen, McAllen, Mission, Pharr, Rio Grande
1 4 2 / A M E R I C A N J E W I S H Y E A R B O O K , 2 0 0 4
City, San Juan, and Weslaco.Waco—includes McLennan, Coryell, Bell, Falls, Hamilton, and Hill counties.
VIRGINIA
Fredericksburg—includes towns in Spotsylvania, Stafford, King George, and Orangecounties.
Newport News—includes Newport News, Hampton, Williamsburg, James City,York County, and Poquoson City.
Richmond—includes Richmond City, Henrico County, and Chesterfield County.Staunton—includes towns in Augusta, Page, Shenandoah, Rockingham, Bath, and
Highland Counties.Winchester—includes towns in Winchester, Frederick, Clarke, and Warren counties.
WASHINGTON
Seattle—includes King County and adjacent portions of Snohomish and Kitsapcounties.
Tri Cities—includes Pasco, Richland, and Kennewick.
WISCONSIN
Milwaukee—includes Milwaukee County, eastern Waukesha County, and southernOzaukee County.
Wausau—includes Stevens Point, Marshfield, Antigo, and Rhinelander.