Embed Size (px)
Citation preview

8/14/2019 Jewell County Profile
http://slidepdf.com/reader/full/jewell-county-profile 1/34
N
o r t h
C e n t r a l K
a n s a s C o u n t y P r o f i l e s
2 0
0 8
Jewe
C
y
ROUGH DRAFT
Project funding support provided through Rural Business Tax
Credits from the Kansas Department of Commerce through
NCKCN an affiliate of North Central Regional Planning
Commission.

8/14/2019 Jewell County Profile
http://slidepdf.com/reader/full/jewell-county-profile 2/34
JEWELL COUNTY
Section I
Overview of Jewell County
Jewell County is
one of 105 counties
of the sunflower
state located in the
north central partof Kansas. The
county seat is the
City of Mankato.

8/14/2019 Jewell County Profile
http://slidepdf.com/reader/full/jewell-county-profile 3/34
JEWELL COUNTY
County Profile - Jewell County, KS
Jewell County is one of the 105 counties in the state of Kansas. The 2007 populationsestimate lists the population to be 3,198. According to 2000 estimates, it has 909.18 sq.miles in land area and a population density of 4.2 people per square mile. The averagehousehold size is 2.21 persons (2000) and median household income is $31,390 (2004)(US census Bureau).
Population Estimates
Jewell County has a population of 3,198 as of July 1, 2007 (US Census Bureau). The
population decreased by 15.64% from the year 2000 to 2007. As per the 2000 censussurvey, population of the county was 3,791 with median age of 46.2 years. In 2000,Jewell County had 17.1% of its population under the age of 15 years, 16.9% in the agegroup 15 to 34 years, 34.7% in the age group 35 years to 59 years and 31.4% of itspopulation above 60 years of age.
Table 1: Population estimates for Jewell County
Population EstimatesYear Ending Jewell County Kansas
July 1,2007 3,198 2,775,997
July 1,2006 3,253 2,755,817
July 1,2005 3,263 2,741,665
July 1,2004 3,346 2,730,828
July 1,2003 3,422 2,721,824
July 1,2002 3,496 2,712,383
July 1,2001 3,612 2,700,979
July 1,2000 3,759 2,692,890
Census 2000 April 1,2000 3,791 2,688,418
2000 to 2007 % change -15.64% 3.26%
1990 to 2000 % change -10.8% 8.5%
Source: US Census Bureau

8/14/2019 Jewell County Profile
http://slidepdf.com/reader/full/jewell-county-profile 4/34
JEWELL COUNTY
Source: US census Bureau
Figure 1: Population Change in the last century
Table 2: Sex and Age of Population (2000 Census)
SEX AND AGE Count Percentage
Male 1,875 49.5
Female 1,916 50.5
Under 5 years 173 4.6
5 to 9 years 214 5.6
10 to 14 years 260 6.9
15 to 19 years 256 6.8
20 to 24 years 97 2.6
25 to 34 years 286 7.5
35 t 44 528 13 9
500,000
1,000,000
1,500,000
2,000,000
2,500,000
3,000,000
Kansas
0
5,000
10,000
15,000
20,000
25,000
1900 1910 1920 1930 1940 1950 1960 1970 1980 1990 2000
Jewell

8/14/2019 Jewell County Profile
http://slidepdf.com/reader/full/jewell-county-profile 5/34
JEWELL COUNTY
Household Income
Median Household income in 2005 for Jewell County was $32,500 which is 28.75% lessthan the state median income. The Median household income had declined by 14.7%from 1999 to 2005, while the state median income declined by 9.9%.
Table 3: Median Income in Jewell CountyMedian Income Jewell KansasMedian household income in 2005 $32,500 $42,861Median household income in 1999 (adj. for inflation1) $35,799 $47622
5-year percent change 2000 to 2005 -14.70% -9.9%Source: USDA ERS (www.ers.usda.gov) and US Census Bureau
Figure 2: Median Household Income – Jewell County & Kansas
Poverty rates
Current poverty rate for Jewell County is greater than that of the state. In 2000, JewellCounty’s poverty rate was 11.4 which increased to 13.2 in 2005. The poverty rate forKansas in the same period went from 8.9 to 11.7.
Table 4: Poverty estimates for Jewell CountyPoverty Estimates Jewell 5-Year % Change Kansas
Poverty rate in 2005In 2000
13.211.4
--15.8%
11.78.9
Poverty rate for children under 18 in 2005In 2000
20.716.3
--27.0%
15.211.9
$32,500 $35,799 $42,861 $47,622
$0 $10,000 $20,000 $30,000 $40,000 $50,000 $60,000
Median household income in 2005 Median household income in 1999
Jewell
Kansas

8/14/2019 Jewell County Profile
http://slidepdf.com/reader/full/jewell-county-profile 6/34
Jewell4.1. Thunempl
Table 5Labor Fo
Total Lab5-year10-year
Employe5-year10-year
Unemplo5-year
10-yearUnemplo
5-year10-year
Source: US
ounty’s ctotal labo
yed labor
: Labor Force Annual
or Forcechange
% change
change% change
edchange
% changement Rate
change% change
Bureau of Labo
rrent uner force forforce decli
rce Annuverages in
Statistics ( Dow
ploymentthe countyed by 8.5 i
l Average2007
nloaded from w
97
3%
rate is 2.9declinedn the last f
for JeweJew
--
--
1w.stats.indiana
which is ly 11.4 in tive years.
ll Countyll County
1,84911.4%11.4%
1,79511.5%11.8%
548.5%
3.8% 2.9
3.6%6.0%
.edu)
JE
Labor
ess than the last fiv
Employ
Unempl
ELL COU
orce
e state rayears an
Kansas
1,478,7813.8%6.9%
1,418,6665.0%6.7%
60,115-17.8%
12.0%4.1
-19.6%5.1%
d
yed
NTY
te ofthe

8/14/2019 Jewell County Profile
http://slidepdf.com/reader/full/jewell-county-profile 7/34
JEWELL COUNTY
Educational Attainment
About eighty seven percent of the population above the age of 25 has at least a highschool degree. 29.1% of the population above the age of twenty five had some collegeeducation, and 19% are college graduates.
Table 6: Educational attainment – Jewell County
Educational Attainment: Census 2000 Jewell Percent ofPopulation25+
Kansas Percent ofPopulation25+
Total Population 25 and Older 2,798 100 1,701,207 100.0%
Less Than 9th Grade 139 5 88,124 5.2%
9th to 12th, No Diploma 208 7.4 149,675 8.8%
High School Graduate (incl. equiv.) 1,106 39.5 507,612 29.8%
Some College, No Degree 814 29.1 417,722 24.6%
Associate Degree 145 5.2 99,096 5.8%
Bachelor's Degree 284 10.2 290,271 17.1%
Graduate or Professional Degree 102 3.6 148,707 8.7%
Source: US Census Bureau
5.00% 5.20%7.40% 8.80%
39.50% 29.80%
29.10%
24.60%
5.20%
5.80%
10.20%17.10%
3.60% 8.70%
0%
10%
20%30%
40%
50%
60%
70%
80%
90%
100%
Jewell Kansas
Graduate or Professional Degree
Bachelor's Degree
Associate Degree
Some College, No Degree
High School Graduate (incl. equiv.)
9th to 12th, No Diploma

8/14/2019 Jewell County Profile
http://slidepdf.com/reader/full/jewell-county-profile 8/34
JEWELL COUNTY
Workers commuting to work
More than seventy two percent of the labor force work in the county itself. Themaximum outflow of workers from Jewell County is to Mitchell County (about 10% ofworkers commute to Mitchell County for work). Another 93 workers commute toNuckolls County in Nebraska for work.
Table 7: Workers (Commuting to work) Living in Jewell County
Workers Living inCounty in 2000
JewellPct Dist.
in CountyKansas
Pct Dist.in State
Total 1,779 100.00% 1,310,746 100.00%
Working in County 1,297 72.91% 1,214,739 92.68%
Working Elsewhere 482 27.09% 96,007 7.32%
Cherokee Co. KS 2 0.11% - -
Cloud Co. KS 19 1.07% - -
Crawford Co. KS 2 0.11% - -Ford Co. KS 2 0.11% - -
Harvey Co. KS 2 0.11% - -
Johnson Co. KS 6 0.34% - -
Lyon Co. KS 7 0.39% - -
Marshall Co. KS 2 0.11% - -
Mitchell Co. KS 187 10.51% - -
Osborne Co. KS 19 1.07% - -
Reno Co. KS 2 0.11% - -
Republic Co. KS 57 3.20% - -
Rice Co. KS 2 0.11% - -
Saline Co. KS 4 0.22% - -
Smith Co. KS 31 1.74% - -
Washington Co. 7 0.39% - -
Adams Co. NE 7 0.39% - -
Clay Co. NE 10 0.56% - -Douglas Co. NE 3 0.17% - -
Fillmore Co. NE 2 0.11% - -
Gage Co. NE 2 0.11% - -
Nuckolls Co. NE 93 5.23% - -
Seward Co NE 2 0 11%

8/14/2019 Jewell County Profile
http://slidepdf.com/reader/full/jewell-county-profile 9/34
JEWELL COUNTY
9
Figure 5: Workers commute from Jewell County

8/14/2019 Jewell County Profile
http://slidepdf.com/reader/full/jewell-county-profile 10/34
JEWELL COUNTY
The maximum inflow of workers to Jewell County is from Mitchell County. Thirty twoworkers commute to Jewell County from Mitchell County for work, and 29 come fromNuckolls County, Nebraska. In total around 171 workers commute to Jewell County forwork.
Table 8: People Working in Jewell CountyPeople Working in County in Jewell Pct Dist. Kansas Pct Dist.
Total 1,468 100.00% 1,317,070 100.0%Living in County 1,297 88.35% 1,214,739 92.2%
Living Elsewhere 171 11.65% 102,331 7.8%
Allen Co. KS 5 - - -
Cloud Co. KS 2 - - -
Geary Co. KS 10 - - -
Graham Co. KS 2 - - -
Mitchell Co. KS 32 - - -
Osborne Co. KS 4 - - -
Pottawatomie Co. KS 3 - - -
Republic Co. KS 28 - - -
Riley Co. KS 7 - - -
Rooks Co. KS 6 - - -
Smith Co. KS 25 - - -
Nuckolls Co. NE 29 - - -
Webster Co. NE 6 - - -Beckham Co. OK 12 - - -
Source: US Census Bureau (Includes only workers over 16 years old.)

8/14/2019 Jewell County Profile
http://slidepdf.com/reader/full/jewell-county-profile 11/34
JEWELL COUNTY
11
Figure 6: Workers commuting to Jewell County

8/14/2019 Jewell County Profile
http://slidepdf.com/reader/full/jewell-county-profile 12/34
JEWELL COUNTY
Section – II
Industry Analysis

8/14/2019 Jewell County Profile
http://slidepdf.com/reader/full/jewell-county-profile 13/34
JEWELL COUNTY
13
Industry Analysis
Industry Totals for Jewell County
Industry employment increased by 1.98% from 1990 to 2007 in Jewell County. Average pay (after adjusting for inflation)has grown by 6.68%, and the number of establishments in the same period increased by around 3.88%. This is a goodindicator of growing industry in the county as population in the county has been declining every decade since 1990(Figure 1).
Table 9: Annual Covered Employment & Wages2
over Time (NAICS) – Jewell County
Year Establishments Employment Average Annual Pay Average Pay in terms of
1990 129 910 $12,894 $20,455
1991 139 893 $13,391 $20,386
1992 139 950 $13,704 $20,252
1993 133 938 $14,303 $20,523
1994 130 953 $14,428 $20,186
1995 132 981 $15,099 $20,542
1996 135 988 $15,549 $20,548
1997 134 982 $15,710 $20,295
2 Covered Employment & Wages (CEW) also known as ES202 data are the product of a federal-state cooperative program, the Quarterly Census of Employment
and Wages (QCEW) program, also known as the ES-202 program. The data are derived from summaries of employment and total pay of workers covered by state
and federal unemployment insurance (UI) legislation and provided by State Workforce Agencies (SWAs). The summaries are a result of the administration of state
unemployment insurance programs that require most employers to pay quarterly taxes based on the employment and wages of workers covered by UI.(www.bls.gov).
3Average wages in 2007 dollars term calculated using CPI inflation calculator available at Bureau of Labor Statistics website http://data.bls.gov/cgi-bin/cpicalc.pl.
The CPI inflation calculator uses the average Consumer Price Index for a given calendar year. This data represents changes in prices of all goods and services
purchased for consumption by urban households. This index value has been calculated every year since 1913. For the current year, the latest monthly index value
is used (www.bls.gov).

8/14/2019 Jewell County Profile
http://slidepdf.com/reader/full/jewell-county-profile 14/34
JEWELL COUNTY
14
Year Establishments Employment Average Annual Pay Average Pay in terms of
1998 137 1002 $15,716 $19,991
1999 131 945 $15,922 $19,8162000 126 890 $16,639 $20,035
2001 124 893 $16,953 $19,848
2002 125 979 $18,454 $21,269
2003 124 1006 $18,463 $20,805
2004 130 994 $18,818 $20,655
2005 133 962 $20,275 $21,525
2006 129 922 $20,845 $21,439
2007 134 928 $21,821 $21,821
Change from 1990 to 2007 5 18 8927 1366.01
Percent change from 1990 to 3.88% 1.98% 69.23% 6.68%Source: US Bureau of Labor Statistics (BLS) *adj = Adjusted for Inflation.
8/14/2019 Jewell County Profile
http://slidepdf.com/reader/full/jewell-county-profile 15/34
JEWELL COUNTY
15
Figure 7: Industry, Employment & Average Wages over time in Jewell County
1 2 9
1 3 9
1 3 9
1 3 3
1 3 0
1 3 2 1
3 5
1 3 4 1
3 7
1 3 1
1 2 6
1 2 4
1 2 5
1 2 4
1 3 0 1
3 3
1 2 9
1 3 4
115
120
125
130
135
140
145Establishments
9 1
0
8 9 3
9 5
0
9 3 8
9 5
3 9 8 1
9 8 8
9 8 2 1
0 0 2
9 4 5
8 9 0
8 9 3
9 7
9 1 0 0 6
9 9 4
9 6 2
9 2 2
9 2 8
800
850
900
950
1000
1050
Employment
$ 2 0
, 4 5 5
$ 2 0
, 3 8 6
$ 2 0
, 2 5
2
$ 2 0
, 5
2 3
$ 2 0
, 1
8 6
$ 2 0
, 5 4
2
$ 2 0
, 5 4
8
$ 2 0
, 2 9 5
$ 1
9 ,
9 9 1
$ 1
9 ,
8 1
6
$ 2 0
, 0 3 5
$ 1
9 ,
8 4
8
$ 2 1
, 2 6 9
$ 2 0
, 8 0 5
$ 2 0
, 6 5 5
$ 2 1
, 5
2 5
$ 2 1
, 4
3 9
$ 2 1
, 8 2 1
$18,500
$19,000
$19,500$20,000
$20,500
$21,000
$21,500
$22,000
1990 1991 1992 1993 1994 1995 1996 1997 1998 1999 2000 2001 2002 2003 2004 2005 2006 2007
Adjusted Average Annual Wage

8/14/2019 Jewell County Profile
http://slidepdf.com/reader/full/jewell-county-profile 16/34
JEWELL COUNTY
16
Jobs and Average Wages by Industry
Public Administration is the largest sector in Jewell County with 19 establishments and 151 jobs. The highest paid sectoris the Finance & Insurance sector with annual average wages of $33,144. Other high wage paying sectors are:Transportation & Warehousing (annual average wages of $28,345) and Wholesale Trade (annual average wages of$20,625).
Table 10: Industry Distribution of Establishments, Jobs, and Average Wages – Jewell CountyIndustry Distribution of Establishments, Jobs & Average Wages (2007) Establishments Jobs Annual Average Wage
Total Covered Employment and Wages 134 928 $21,821Private 98 458 $23,042
Agriculture, forestry, fishing and hunting 8 N N
Mining 1 N N
Utilities 2 N N
Construction 8 N N
Manufacturing 1 N N
Wholesale Trade 8 69 $20,624
Retail Trade 15 65 $13,280Transportation and Warehousing 13 23 $28,345
Information 5 N N
Finance and Insurance 8 27 $33,144
Real Estate and Rental and Leasing NA NA NA
Professional, Scientific, and Technical Services 5 8 $12,509
Management of Companies and Enterprises 1 N N
Administrative and Support and Waste Management and Remediation 2 N NEducational Services 5 N N
Health Care and Social Assistance 12 38 $11,561
Arts, Entertainment, and Recreation 2 N N
Accommodation and Food Services 9 N N
Other Services (except Public Administration) 12 30 $9,639
Public Administration 19 151 $17,367Source: US Bureau of Labor Statistics (BLS) N – Non-disclosed, NA- Not Applicable

8/14/2019 Jewell County Profile
http://slidepdf.com/reader/full/jewell-county-profile 17/34
JEWELL COUNTY
17
Figure 8: Establishments & Jobs in various industries in Jewell County
Establishments Jobs
Agriculture Mining Utilities
Construction Manufacturing Wholesale Trade
Retail Trade Transportation & Warehousing Information
Finance & Insurance Real Estate Professional & Technical Services
Management of Companies Waste Management Educational Services
Health Care & Social Assistance Arts & Entertainment Accommodation & Food Services
Other Services Public Administration

8/14/2019 Jewell County Profile
http://slidepdf.com/reader/full/jewell-county-profile 18/34
JEWELL COUNTY
18
Figure 9: Annual average wage in various industries in Jewell County
0 0 0 0 0
$ 2 0
, 6 2
4
$ 1
3 ,
2 8 0
$ 2 8
, 3 4 5
0
$ 3 3
, 1 4 4
0
$ 1
2 ,
5 0 9
0 0 0
$ 1 1
, 5
6 1
0 0
$ 9
, 6 3 9
$
1 7
, 3 6 7
0
5000
10000
15000
20000
25000
30000
35000
Annual Average WageAgriculture
Mining
UtilitiesConstruction
ManufacturingWholesale Trade
Retail TradeTransportation & Warehousing
Information
Finance & Insurance
Real Estate Professional & Technical Services
Management of Companies Waste Management Educational Services
Health Care & Social Assistance
Arts & EntertainmentAccommodation & Food Services
Other Services
Public Administration

8/14/2019 Jewell County Profile
http://slidepdf.com/reader/full/jewell-county-profile 19/34
JEWELL COUNTY
19
Key Industries
Jewell County is home to some very well performing industries. These industries may be a part of existing or emergingclusters. For identifying key industries and clusters, three criteria were used:
1. Location Quotient – Location quotients (LQ) for industries at 6-digit NAICS level were calculated with US industryemployment as base. The cutoff for LQ was taken as 1.25 (based on previous studies, especially Cortright 2003)
2. Average Wages – Average wages at 6-digit NAICS codes were compared to US average wages. If any industryhas average wages 10% above the US average, it is considered to be a good performing industry.
3. Growth Rate – Growth rates for the employment were calculated over three year time period from 2003 to 20064,growth rate above 5% was considered to be an indicator of good industry performance.
Any industry that satisfies one of these three conditions is either a good performing industry or an industry with goodpotential for growth. There may or may not be a cluster existing in a region for every good performing industry, but ifthere are good performing industries, a cluster may emerge in the near future. (For further details of methodology,please see Appendix B).
Industries with High Growth Rates
The highest growth rate in the Jewell County is for the convenience stores and Full service restaurants are the largestemployers in the high growth industry in Jewell County. Although the average annual wages for both these sectors is quitelow.
Table 12: Industries (6-digit NAICS) with highest growth rates
NAICS NAICS Definition Establishments EmploymentAverage
Wages
Growth
DifferentialsCluster
445120 Convenience Stores 1 6 $6,558 81.71% Local Food and Beverages Processing & Distribution
813910 Business Associations 1 5 $14,278 71.00% Local Community & Civic Organizations
4 There were two reasons for selecting 2003 base year. 1) The numbers were more likely to be free from 9/11 impacts as compared to 2001 or 2002 numbers. 2) NAICSdefinitions changed in 2002, so it was very difficult to bridge between 2002 & 1997 codes for some industries.

8/14/2019 Jewell County Profile
http://slidepdf.com/reader/full/jewell-county-profile 20/34
JEWELL COUNTY
20
541211 Offices of Certified Public
Accountants3 3 $13,984 44.22% Business and Financial Services
621610 Home Health Care Services 7 9 $5,943 44.22% Biomedical/Biotechnical (Life
Sciences)
446110 Pharmacies and Drug Stores 1 5 $19,419 35.72% Biomedical/Biotechnical (Life Sciences)
444190 Other Building Material
Dealers1 4 $18,820 10.06% Local Real Estate , Construction &
Development
493130 Farm Product Warehousing
and Storage1 6 $30,676 6.27% Transportation & Logistics
722110 Full-Service Restaurants 8 64 $7,111 4.55% Local Hospitality Establishments 221122 Electric Power Distribution 1 33 $52,358 2.11% Energy (Fossil and Renewable)
Source: ES202 2006 data, IMPLAN MIG Group
Industries with High Location Quotient
The sector ‘other farm product raw material merchant wholesalers’ (NAICS 424590) has the highest LQ in Jewell County
of 1184. There are five sectors with high LQ that belong to Agribusiness, Food Processing and technology cluster. Theseare the sectors – Other farm product raw material merchant wholesalers, Crop harvesting, primarily by machine, SupportActivities for Animal Production, Grain and field bean whsle and Farm and garden machinery and equipment merchantwholesalers. This is a good indicator that the Agribusiness is a well performing sector in Jewell County. It may not be acluster in itself, as there are only a few establishments in the cluster, but it maybe an emerging cluster, ancillary cluster tosome bigger cluster in a nearby location or part of the cluster if all 19 counties are considered to be a region together.
Table 13: Top 10 Industries (6-digit NAICS) with highest Location QuotientsNAICS NAICS Definition Establishments Employment Average
WagesLocationQuotient
Cluster
424590 Other farm product raw materialmerchant wholesalers
1 42 $13,585 1184.29 Agribusiness, Food Processing andTechnology
115113 Crop harvesting, primarily bymachine
1 14 $28,169 311.39 Agribusiness, Food Processing andTechnology

8/14/2019 Jewell County Profile
http://slidepdf.com/reader/full/jewell-county-profile 21/34
JEWELL COUNTY
21
115210 Support Activities for AnimalProduction
2 29 $27,198 266.48 Agribusiness, Food Processing andTechnology
493130 Farm product warehousing andstorage
1 6 $30,676 165.97 Transportation & Logistics
221122 Electric power distribution 1 33 $52,358 62.88 Energy (Fossil and Renewable)
424510 Grain and field bean whsle 4 5 $35,007 29.52 Agribusiness, Food Processing andTechnology
624210 Community Food Services 1 3 $7,748 28.90 Local Health Services
332311 Prefabricated metal buildingsand components
1 3 $31,273 21.66 Fabricated Metal ProductManufacturing
423820 Farm and garden machineryand equipment merchantwholesalers
1 8 $19,786 20.09 Agribusiness, Food Processing andTechnology
484230 Specialized Freight (exceptUsed Goods) Trucking, Long-Distance
1 9 $30,029 19.21 Transportation & Logistics
Source: ES202 2006 data, IMPLAN MIG Group
Industries with wages higher than national average
The county’s hotels and motels (NAICS 721110) have average wages around 46% higher than the national averages.This may be because of two reasons – this sector is a well performing industry with higher profits and they pay higherwages, or there is shortage of labor so to retain employees they have to pay higher wages. The other sectors with highwages are residential remodelers, Crop harvesting and household appliance stores.

8/14/2019 Jewell County Profile
http://slidepdf.com/reader/full/jewell-county-profile 22/34
JEWELL COUNTY
22
Table 14: Industries (6-digit NAICS) with Wages above national averagesNAICS NAICS Definition Establishments Employment Average
WagesWages compared
to nation5
Cluster
721110 Hotels (except Casino
Hotels) and Motels1 5 $33,789 46.42% Arts, Entertainment, Recreation
& Visitor Industries
236118 Residential Remodelers 2 2 $48,039 32.47% Local Real Estate , Construction & Development
115113 Crop Harvesting, Primarily
by Machine1 14 $28,169 23.16% Agribusiness, Food Processing
and Technology
443111 Household Appliance Stores 1 1 $37,284 17.47% Local Household Goods & Services
Source: ES202 2006 data, IMPLAN MIG Group
Shift Share Analysis
Shift share analysis breaks down changes in employment (growth or decline) over a period of time into three components:National growth share, Industry mix share and local share. This analysis is used to account for the competitiveness of aregion’s industries and to analyze the local economic base6.
National growth shareThe share of growth (decline) in local employment that can be attributed to growth (decline) in employment at
national level.National Growth Share = Employment in base year * National employment growth rate
Industry mix share
This is the growth (decline) in employment in the region that can be attributed to the growth (decline) in thatparticular industry at the national level.Industry Mix Share = Employment in base year *(Industry’s National Growth rate – National employment growth
rate)
5 Wages compared to nation – the difference in county & national average wages for particular industry as percentage of national average
6 Pennstate (2003) Using Employment data to better understand your local economy.
8/14/2019 Jewell County Profile
http://slidepdf.com/reader/full/jewell-county-profile 23/34
JEWELL COUNTY
23
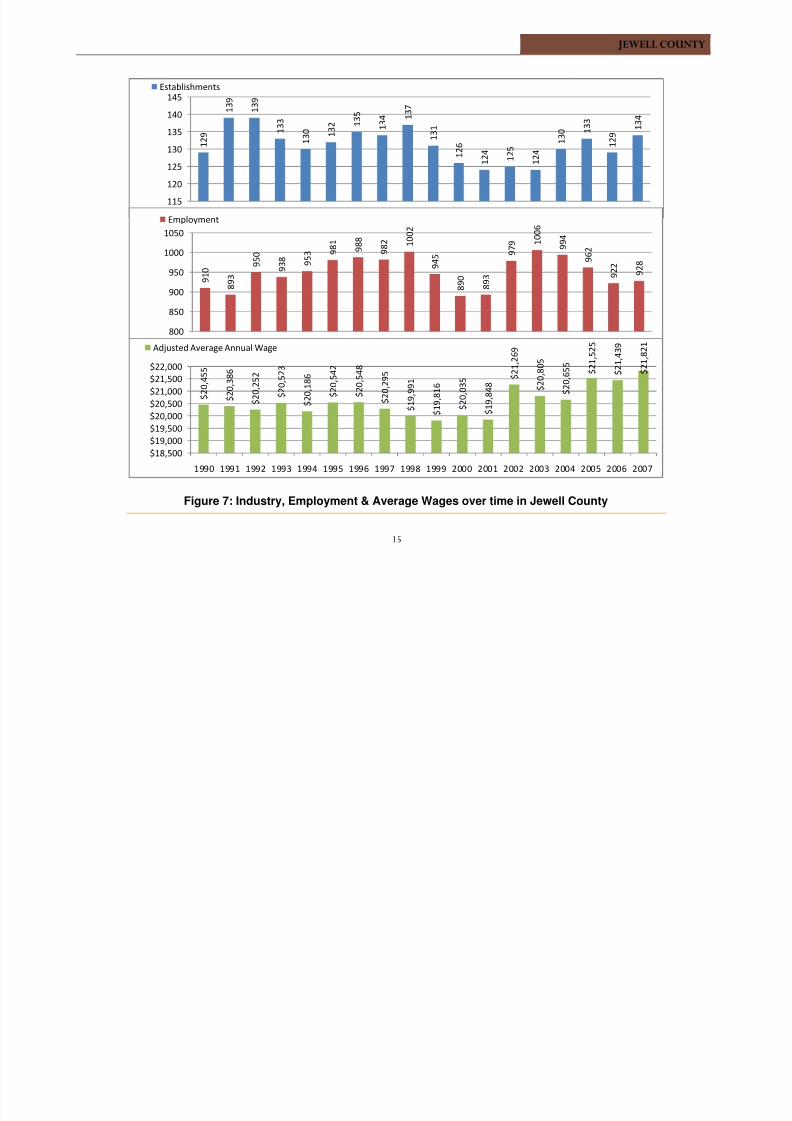
Local share
This is the share of growth (decline) in employment in a region that can be attributed to the competitiveness of aregion.Local Share = Employment in base year *(Region’s industry growth rate – National Industry growth rate)
The industry with the highest local share in growth is the Home Health Care Services. The employment in the sectorincreased by 6 jobs and out of those 5 can be attributed to local growth (Table 15). The second highest growth inemployment was in the Convenience Stores. In this industry there was a net growth of 5 jobs, all of which wereattributable to local growth in the region.
Table 15: Industries with highest local share of growth – Shift Share Analysis Jewell CountyNAICS NAICS Definition Net Growth National Growth Share Industry Mix Share Local Share
621610 Home Health Care Services 6 0 0 5
445120 Convenience Stores 5 0 0 5
813910 Business Associations 4 0 0 4
722110 Full-Service Restaurants 8 3 2 3
446110 Pharmacies and Drug Stores 3 0 0 3221122 Electric Power Distribution 2 2 -2 3
541211 Offices of Certified Public Accountants 2 0 0 2
493130 Farm Product Warehousing and Storage 1 0 0 1
444190 Other Building Material Dealers 1 0 0 1Data Source: ES202 data, IMPLAN MIG group

8/14/2019 Jewell County Profile
http://slidepdf.com/reader/full/jewell-county-profile 24/34
JEWELL COUNTY
24
Clusters in Jewell County
Traded Clusters
An agribusiness, food processing & technology cluster seems to exist in Jewell County. The cluster has 16establishments, 179 jobs, has grown at a rate of around 18% and has an LQ of 13.9. The wages in the cluster are about30% less than national average. Biomedical/biotechnical cluster has a very high growth rate of 50.37% but hasconsiderably wages than the rest of the nation and a low LQ. Also, the transportation and logistics cluster has a highgrowth rate and high LQ. Investments into these sectors should be considered to make them more competitive.
Table 16: Clusters in Jewell County
Cluster Establishments EmploymentAverageWages
Wages compared
to national
average
GrowthRate
LQ
Advanced Materials 0 0 N N N 0.00Agribusiness, Food Processing and Technology 16 179 $23,568 -30.74% 18.34% 13.97Apparel and Textiles 0 0 N N N 0.00
Arts, Entertainment, Recreation and Visitor 4 7 $28,154 -14.14% - 0.37Biomedical/Biotechnical (Life Sciences) 9 17 $11,360 -72.89% 50.37% 0.37
Business and Financial Services 8 12 $12,976 -82.94% - 0.26
Chemicals and Chemical-Based Products 0 0 N N N 0.00
Computer and Electronic Product Manufacturing 0 0 N N N 0.00Defense and Security 0 0 N N N 0.00Education and Knowledge Creation 0 0 N N N 0.00Electrical Equipment, Appliance and Component 0 0 N N N 0.00Energy (Fossil & Renewable) 9 51 $38,684 -35.26% -5.79% 1.69
Fabricated Metal Product Manufacturing 1 3 $31,272 -28.82% - 0.50
Forest and Wood Products 1 1 $3,981 -90.03% 0.00% 0.10
Glass and Ceramics 0 0 N N N 0.00
Information Technology and Telecommunications 1 1 $68,577 -9.36% - 0.04
Machinery Manufacturing 0 0 N N N 0.00Mining 1 0 N N N 0.00

8/14/2019 Jewell County Profile
http://slidepdf.com/reader/full/jewell-county-profile 25/34
JEWELL COUNTY
25
Primary Metal Manufacturing 0 0 N N N 0.00
Printing and Publishing 0 0 N N N 0.00Transportation and Logistics
7 28 $29,746 -29.38% 13.80% 1.47Transportation Equipment Manufacturing 0 0 N N N 0.00Total All Industries 98 448 $20,406 -51.88% -2.54% 1.00Data Source: ES202 data, IMPLAN MIG groupHighlighted cell represent values higher than specified criteria values
Figure 10: Location Quotients for various clusters in Jewell County
Agribusiness & Food Processing, 13.97
Arts, Entertainment & Recreation, 0.37
Energy , 1.69
Business & Financial Services , 0.26
Fabricated Metal Product Mfg, 0.5
Transportation and Logistics , 1.47
Forest and Wood Products, 0.1
IT & Telecommunications,
0.04
Transportation and Logistics , 1.47
Biomedical/Biotechni
cal, 0.37

8/14/2019 Jewell County Profile
http://slidepdf.com/reader/full/jewell-county-profile 26/34
JEWELL COUNTY
26
Figure11: Traded Clusters in Jewell County

8/14/2019 Jewell County Profile
http://slidepdf.com/reader/full/jewell-county-profile 27/34
JEWELL COUNTY
27
Figure 12: Traded cluster Location Quotients for Jewell County

8/14/2019 Jewell County Profile
http://slidepdf.com/reader/full/jewell-county-profile 28/34
JEWELL COUNTY
28
Local Clusters
Jewell County doesn’t have a very clearly defined local cluster, but a few clusters that have high LQ and growth rates, butnone of the clusters has wages above the national averages. The Local Financial Services cluster has the highest LQ of3.17. The local Food and Beverages Processing & Distribution industry has an LQ of 2.69 and the Local Hospitalityindustry has an LQ of 1.79. The Local Health Services has highest growth rate of about 91% and a LQ of 0.33. Othercluster with high growth rates is Local Community & Civic Organizations with growth rate of 71%.
Table 17: Local Clusters in Jewell County
Cluster Establishments EmploymentAverageWages
Wages compared
to national
averageGrowth Rate LQ
Local Commercial Services 0 0 N N N N
Local Community & Civic Organizations 1 5 $14,278 -53.25% 71.00% 0.96
Local Education & Training 0 0 N N N N
Local Entertainment & Media 0 0 N N N N
Local Financial Services 5 25 $31,732 -38.04% -29.05% 3.17
Local Food and Beverages Processing &Distribution
5 41 $9,992 -63.18% -0.80% 2.69
Local Health Services 3 7 $10,181 -78.80% 91.29% 0.33
Local Hospitality 8 64 $7,111 -48.20% 4.55% 1.79
Local Household Goods & Services 3.3 8 $20,619 -46.57% -3.85% 0.50
Local Industrial Products & Services 0 0 N N N N
Local Logistical Services 0 0 N N N N
Local Motor Vehicle Products & Services 3 6 $13,230 -64.05% -15.66% 0.50Local Personal Services (Non-Medical) 2 4 $6,561 -66.51% -7.17% 0.70
Local Real Estate , Construction & Development 2 2 $48,039 -5.94% -20.63% 0.18
Local Retail Clothing & Accessories 1 0 N N N N
Local Utilities 0 0 N N N N
Data Source: ES202 data, IMPLAN MIG groupHighlighted cell represent values higher than specified criteria values

8/14/2019 Jewell County Profile
http://slidepdf.com/reader/full/jewell-county-profile 29/34
JEWELL COUNTY
29
Figure 13: Local Clusters in Jewell County
JEWELL COUNTY

8/14/2019 Jewell County Profile
http://slidepdf.com/reader/full/jewell-county-profile 30/34
JEWELL COUNTY
30
Appendix A
Table A1: Industries in Jewell County with average wages greater than 10 % of US average wages
NAICS Establishments Wages Average Wages Average Wages 10% above US average Growth Rate LQ
115113 1 14 $28,169 23.16% N 311.39
236118 2 2 $48,039 32.47% 0.00% 1.65
443111 1 1 $37,284 17.47% -20.63% 3.45
721110 1 5 $33,789 46.42% N 0.87Data Source: ES202 2006 data, IMPLAN MIG Group
Table A2: Industries in Jewell County with growth rate greater than 5%
NAICS Establishments Wages Average Wages Average Wages 10% above US average Growth Rate LQ
444190 1 4 $18,820 -55.99% 10.06% 3.31
445120 1 6 $6,558 -59.56% 81.71% 10.69
446110 1 5 $19,419 -39.48% 35.72% 1.78
493130 1 6 $30,676 -11.76% 6.27% 165.97
541211 3 3 $13,984 -78.57% 44.22% 1.87
621610 7 9 $5,943 -75.56% 44.22% 2.61
813910 1 5 $14,278 -74.91% 71.00% 10.44Source: ES202 2006 data, IMPLAN MIG Group
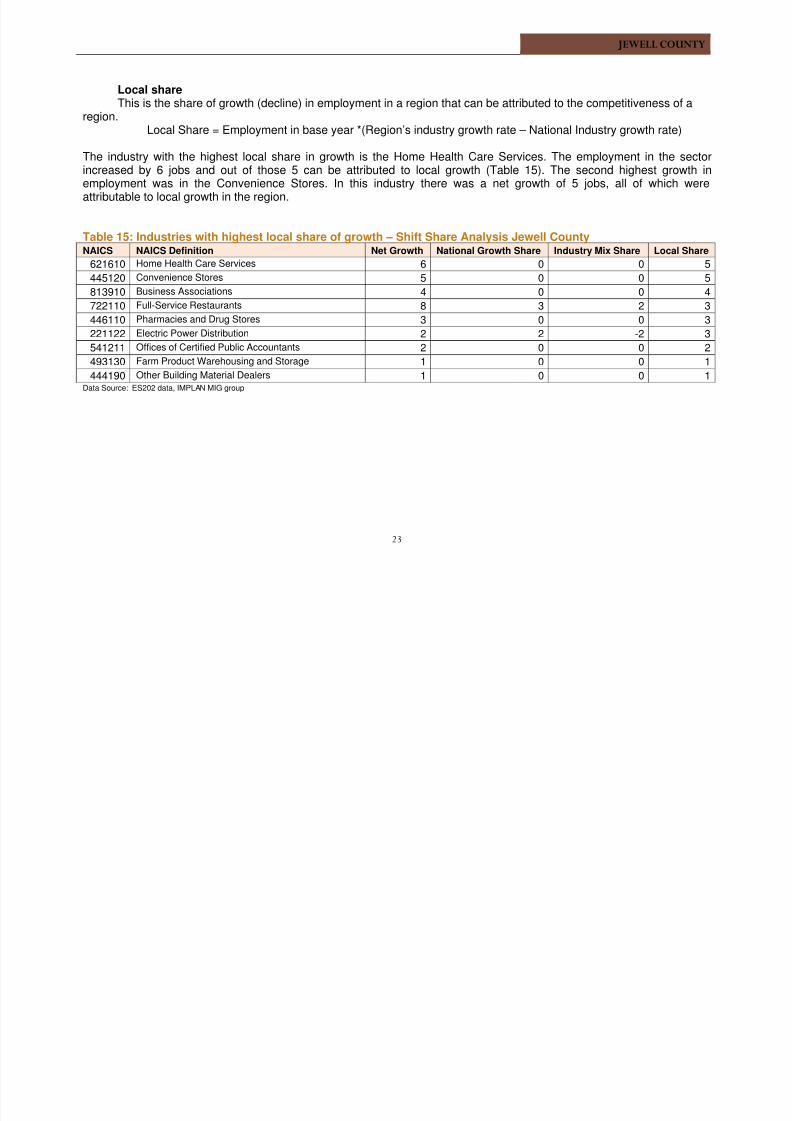
Table A3: Industries in Jewell County with Location Quotients greater than 1.25
NAICS Establishments Wages Average Wages Average Wages 10% above US average Growth Rate LQ
115113 1 14 $28,169 23.16% N 311.39
115210 2 29 $27,198 -4.01% N 266.48
221122 1 33 $52,358 -26.24% 2.11% 62.88
236118 2 2 $48,039 32.47% 0.00% 1.65238160 1 1 $3,981 -88.93% N 1.26
238320 1 2 $8,037 -74.93% 0.00% 2.06
332311 1 3 $31,273 -27.58% N 21.66
423820 1 8 $19,786 -52.01% -28.62% 20.09
424510 4 5 $35,007 -21.50% -49.58% 29.52
424590 1 42 $13,585 -69.99% N 1184.29
JEWELL COUNTY
8/14/2019 Jewell County Profile
http://slidepdf.com/reader/full/jewell-county-profile 31/34
JEWELL COUNTY
31
NAICS Establishments Wages Average Wages Average Wages 10% above US average Growth Rate LQ
424910 1 7 $40,419 -2.51% N 16.33
424920 1 1 $29,687 -27.29% N 4.51
442110 1 3 $16,834 -47.82% -9.14% 2.54
443111 1 1 $37,284 17.47% -20.63% 3.45
444190 1 4 $18,820 -55.99% 10.06% 3.31
445110 2 34 $9,829 -52.71% -3.64% 3.71
445120 1 6 $6,558 -59.56% 81.71% 10.69
446110 1 5 $19,419 -39.48% 35.72% 1.78
447110 1 7 $11,446 -32.10% -24.09% 2.36
447190 4 7 $16,213 -22.27% -11.21% 15.33453110 1 3 $11,153 -30.32% -9.14% 7.83
484220 1 5 $25,757 -30.91% 0.00% 6.13
484230 1 9 $30,029 -28.08% N 19.21
493130 1 6 $30,676 -11.76% 6.27% 165.97
512131 1 1 $10,164 -6.44% -37.00% 1.94
522110 4 24 $32,221 -41.40% -26.32% 4.56
524210 3 4 $13,044 -77.26% -12.64% 1.52
541211 3 3 $13,984 -78.57% 44.22% 1.87
621310 1 3 $13,183 -50.98% N 6.59
621420 1 3 $14,180 -56.36% N 4.75
621610 7 9 $5,943 -75.56% 44.22% 2.61
624210 1 3 $7,748 -65.92% N 28.90
713930 1 1 $12,106 -57.80% -70.26% 7.94
722110 8 64 $7,111 -53.23% 4.55% 3.65
811111 2 4 $12,397 -61.07% -7.17% 3.17811121 1 2 $14,895 -59.61% -26.32% 2.25
811310 1 2 $15,171 -65.52% 0.00% 2.85
812210 1 1 $8,475 -72.76% 0.00% 2.45
813910 1 5 $14,278 -74.91% 71.00% 10.44Source: ES202 2006 data, IMPLAN MIG Group
JEWELL COUNTY

8/14/2019 Jewell County Profile
http://slidepdf.com/reader/full/jewell-county-profile 32/34
JEWELL COUNTY
32
Table A4: Industries in Jewell County fulfilling one of three conditional criteria (either LQ>1.25 or Growthrate>5.0% or Average wages 10% above the national averages)NAICS NAICS definition Average Wages
10% above USaverage
Growth
Rate
LQ Cluster
115113 Crop Harvesting, Primarily by Machine 23.16% N 311.39 Agribusiness & Food Processing
115210 Support Activities for Animal
Production
-4.01% N 266.48 Agribusiness & Food Processing
221122 Electric Power Distribution -26.24% 2.11% 62.88 Energy (Fossil & Renewable)
236118 Residential Remodelers (pt) 32.47% 0.00% 1.65 Local Real Estate , Construction &
Development
238160 Roofing Contractors -88.93% N 1.26 Energy (Fossil & Renewable)
238320 Painting and Wall Covering
Contractors
-74.93% 0.00% 2.06 Energy (Fossil & Renewable)
332311 Prefabricated Metal Building and
Component Manufacturing
-27.58% N 21.66 Fabricated metal product manufacturing
423820 Farm and Garden Machinery and
Equipment Merchant Wholesalers
-52.01% -28.62% 20.09 Agribusiness & Food Processing
424510 Grain and Field Bean MerchantWholesalers
-21.50% -49.58% 29.52 Agribusiness & Food Processing
424590 Other Farm Product Raw Material
Merchant Wholesalers
-69.99% N 1184.29 Agribusiness & Food Processing
424910 Farm Supplies Merchant Wholesalers -2.51% N 16.33 Agribusiness & Food Processing
424920 Book, Periodical, and Newspaper
Merchant Wholesalers
-27.29% N 4.51 Local Food and Beverages Processing &
Distribution
442110 Furniture Stores -47.82% -9.14% 2.54 Local Household Goods & Services443111 Household Appliance Stores 17.47% -20.63% 3.45 Local Household Goods & Services
444190 Other Building Material Dealers -55.99% 10.06% 3.31 Local Household Goods & Services
445110 Supermarkets and Other Grocery
(except Convenience) Stores
-52.71% -3.64% 3.71 Local Food and Beverages Processing &
Distribution
445120 Convenience Stores -59.56% 81.71% 10.69 Local Food and Beverages Processing &
Distribution
JEWELL COUNTY

8/14/2019 Jewell County Profile
http://slidepdf.com/reader/full/jewell-county-profile 33/34
JEWELL COUNTY
33
NAICS NAICS definition Average Wages10% above US
average
GrowthRate
LQ Cluster
446110 Pharmacies and Drug Stores -39.48% 35.72% 1.78 Biomedical/Biotechnical (Life Sciences)
447110 Gasoline Stations with Convenience
Stores
-32.10% -24.09% 2.36 Energy (Fossil & Renewable)
447190 Other Gasoline Stations -22.27% -11.21% 15.33 Energy (Fossil & Renewable)
453110 Florists -30.32% -9.14% 7.83 -
484220 Specialized Freight (except Used
Goods) Trucking, Local
-30.91% 0.00% 6.13 Transportation & Logistics
484230 Specialized Freight (except UsedGoods) Trucking, Long-Distance -28.08% N 19.21 Transportation & Logistics
493130 Farm Product Warehousing and
Storage
-11.76% 6.27% 165.97 Transportation & Logistics
512131 Motion Picture Theaters (except Drive-
Ins)
-6.44% -37.00% 1.94 Arts, Entertainment, Recreation & Visitor
Industries
522110 Commercial Banking -41.40% -26.32% 4.56 Local Financial Services
524210 Insurance Agencies and Brokerages -77.26% -12.64% 1.52 Business & Financial Services
541211 Offices of Certified Public Accountants -78.57% 44.22% 1.87 Business & Financial Services
621310 Offices of Chiropractors -50.98% N 6.59 Local Health Services
621420 Outpatient Mental Health and
Substance Abuse Centers
-56.36% N 4.75 Biomedical/Biotechnical (Life Sciences)
621610 Home Health Care Services -75.56% 44.22% 2.61 Biomedical/Biotechnical (Life Sciences)
624210 Community Food Services -65.92% N 28.90 Local Health Services
713930 Marinas -57.80% -70.26% 7.94 Arts, Entertainment, Recreation & Visitor
Industries721110 Hotels (except Casino Hotels) and
Motels
46.42% N 0.87 Arts, Entertainment, Recreation & Visitor
Industries
722110 Full-Service Restaurants -53.23% 4.55% 3.65 Local Hospitality Establishments
811111 General Automotive Repair -61.07% -7.17% 3.17 Local Motor Vehicle Products & Services
811121 Automotive Body, Paint, and Interior
Repair and Maintenance
-59.61% -26.32% 2.25 Local Motor Vehicle Products & Services
JEWELL COUNTY

8/14/2019 Jewell County Profile
http://slidepdf.com/reader/full/jewell-county-profile 34/34
J W COU
34
NAICS NAICS definition Average Wages10% above US
average
GrowthRate
LQ Cluster
811310 Commercial and Industrial Machineryand Equipment (except Automotive
and Electronic) Repair & Maintenance
-65.52% 0.00% 2.85 Local Personal Services (Non-Medical)
812210 Funeral Homes and Funeral Services -72.76% 0.00% 2.45 Local Health Services
813910 Business Associations -74.91% 71.00% 10.44 Local Community & Civic OrganizationsData Source: ES202 data, IMPLAN MIG group
Table A5: Ten Largest Employers in Jewell CountyCompany Employment NAICS NAICS DefinitionJewell County Hospital 90 622110 General Medical and Surgical Hospitals
Jewell County Rural Health 80 621112 Offices of Physicians, Mental Health Specialists
Kansas Department of Trans 58 926120 Regulation and Administration of Transportation Programs
Jewell Unified School District 50 611110 Elementary and Secondary Schools
White Rock Unified SD 104 44 611110 Elementary and Secondary Schools
Schueman Transfer 40 484110 General Freight Trucking, Local
Adjutant General's Department 39 928110 National Security
Unified School District 278 35 611110 Elementary and Secondary Schools
County of Jewell 32 115112 Soil Preparation, Planting, and Cultivating
C&K Jensen Inc 30 722110 Full-Service Restaurants
Source: Harris Database