Embed Size (px)
Citation preview

Jet Fuel Vaporization and Condensation:
Modeling and Validation
C.E. PolymeropoulosRobert OchsRutgers, The StateUniversity of NewJersey
International Aircraft
Systems Fire Protection
Working Group Meeting
Part I: Physical Considerations and Modeling

Motivation
• Combustible mixtures can be generated in the ullage of aircraft fuel tanks
• Need for estimating temporal dependence of F/A on:– Fuel Loading– Temperature of the liquid fuel and tank walls– Ambient pressure and temperature

Physical Considerations• 3D natural convection heat
and mass transfer– Liquid vaporization– Vapor condensation
• Variable Pa and Ta
• Multicomponent vaporization and condensation
• Well mixed liquid and gas phases– Rayleigh number of liquid
~o(106)– Rayleigh number of ullage
~o(109)

Principal Assumptions• Well mixed gas and liquid phases
– Uniformity of temperatures and species concentrations in the ullage and in the evaporating liquid fuel pool
• Use of available experimental liquid fuel and tank wall temperatures
• Quasi-steady transport using heat transfer correlations and the analogy between heat and mass transfer for estimating film coefficients for heat and mass transfer
• Liquid Jet A composition from published data from samples with similar flash points as those tested
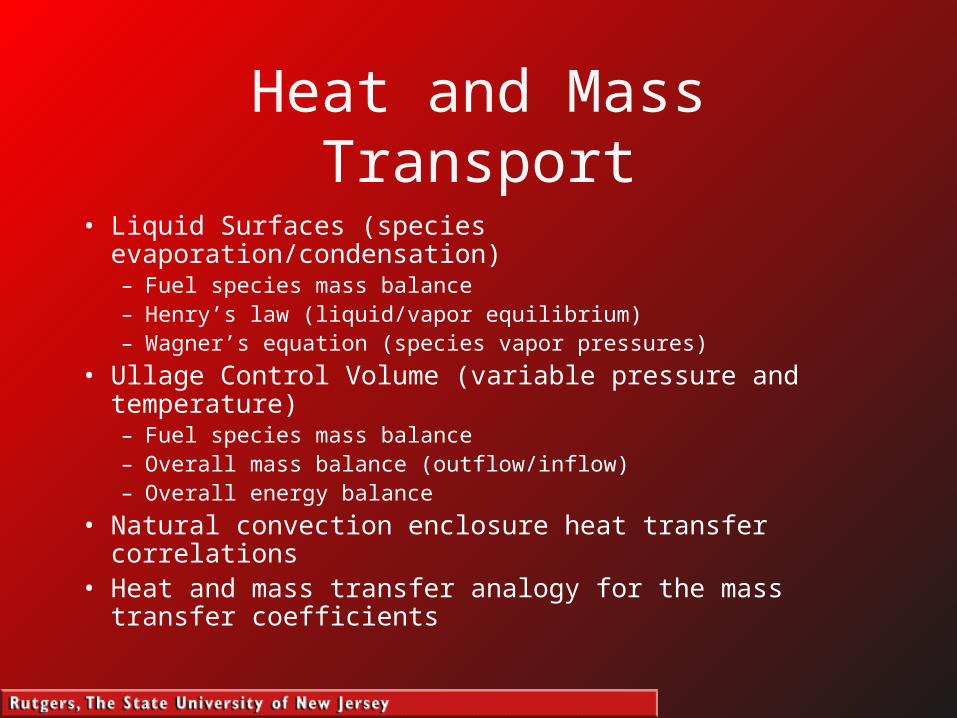
Heat and Mass Transport
• Liquid Surfaces (species evaporation/condensation)– Fuel species mass balance– Henry’s law (liquid/vapor equilibrium)– Wagner’s equation (species vapor pressures)
• Ullage Control Volume (variable pressure and temperature)– Fuel species mass balance– Overall mass balance (outflow/inflow)– Overall energy balance
• Natural convection enclosure heat transfer correlations• Heat and mass transfer analogy for the mass transfer
coefficients
Liquid Jet A Composition• Liquid Jet A composition depends on origin and
weathering• Jet A samples with different flash points were
characterized by Woodrow (2003):– Results in terms of C5-C20 Alkanes– Computed vapor pressures in agreement with measured data
• JP8 used with FAA testing in the range of 115-125 Deg. F.
• Present results use compositions corresponding to samples with F.P.=115 Deg. F. and 120 Deg. F. from the Woodrow (2003) data
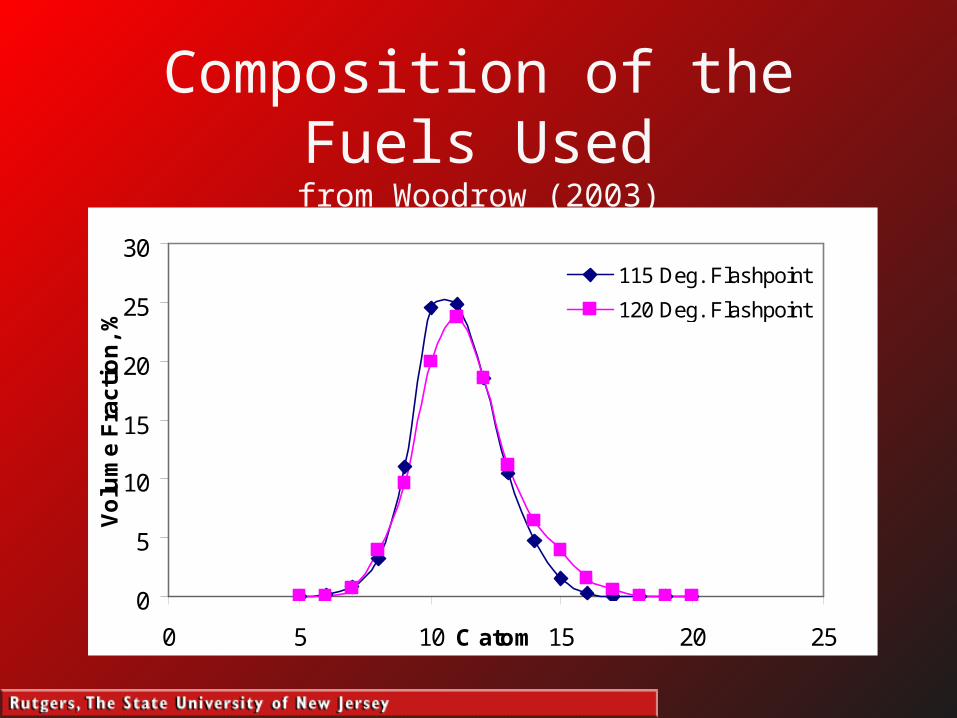
Composition of the Fuels Usedfrom Woodrow (2003)
0
5
10
15
20
25
30
0 5 10 15 20 25C atom
Vo
lum
e F
rac
tio
n,
%
115 Deg. Flashpoint
120 Deg. Flashpoint

Part II: Experimentation

Requirements for Experimental Setup
• Ability to vary fuel tank floor temperature with uniform floor heating
• Setup with capability of changing ambient temperature and pressure with controlled profiles
• Measurement of temporal changes in liquid, surface, ullage, and ambient temperatures
• Ability to asses the concentration of fuel in the ullage at a point in time
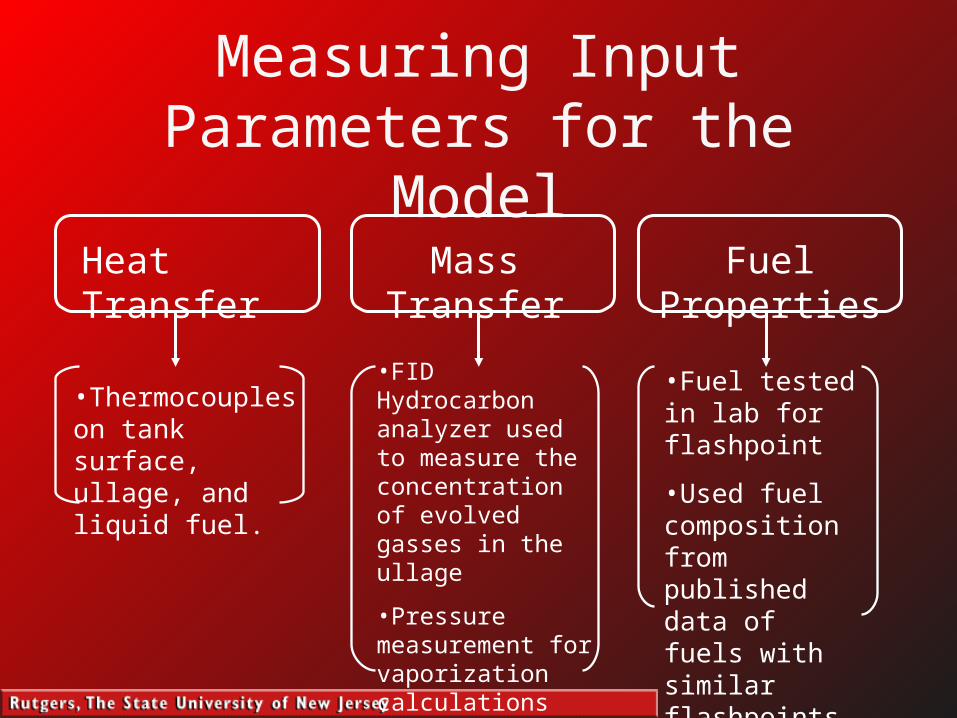
Measuring Input Parameters for the Model
Heat Transfer
•Thermocouples on tank surface, ullage, and liquid fuel.
Mass Transfer Fuel Properties
•Fuel tested in lab for flashpoint
•Used fuel composition from published data of fuels with similar flashpoints
•FID Hydrocarbon analyzer used to measure the concentration of evolved gasses in the ullage
•Pressure measurement for vaporization calculations

Experimental Setup• Fuel tank – 36”x36”x24”, ¼” aluminum• Sample ports • Heated hydrocarbon sample line• Pressurization of the sample for sub-atmospheric pressure
experiments by means of a heated head sample pump• Intermittent (at 10 minute intervals) 30 sec long sampling• FID hydrocarbon analyzer, cal. w/2% propane• 12 K-type thermocouples• Blanket heater for uniform floor heating• Unheated tank walls and ceiling• JP-8 jet fuel

Experimental Setup
• Fuel tank inside environmental chamber– Programmable variation of chamber pressure
and temperature• Vacuum pump system
• Air heating and refrigeration

Thermocouple LocationsThermocouple Channel:
1. Left Fuel
2. Center Fuel
3. Right Fuel
4. Left Ullage
5. Center Ullage
6. Right Ullage
7. Rear Surface
8. Left Surface
9. Top Surface
10. Ambient
11. Heater
12. Heater Temperature Controller
12
3
4
5
6
78
910
1112

Experimental Procedure• Fill tank with specified quantity of fuel• Adjust chamber pressure and temperature to desired
values, let equilibrate for 1-2 hours• Begin to record data with DAS• Take initial hydrocarbon reading to get initial quasi-
equilibrium fuel vapor concentration• Set tank pressure and temperature as well as the
temperature variation• Experiment concludes when hydrocarbon
concentration levels off and quasi-equilibrium is attained
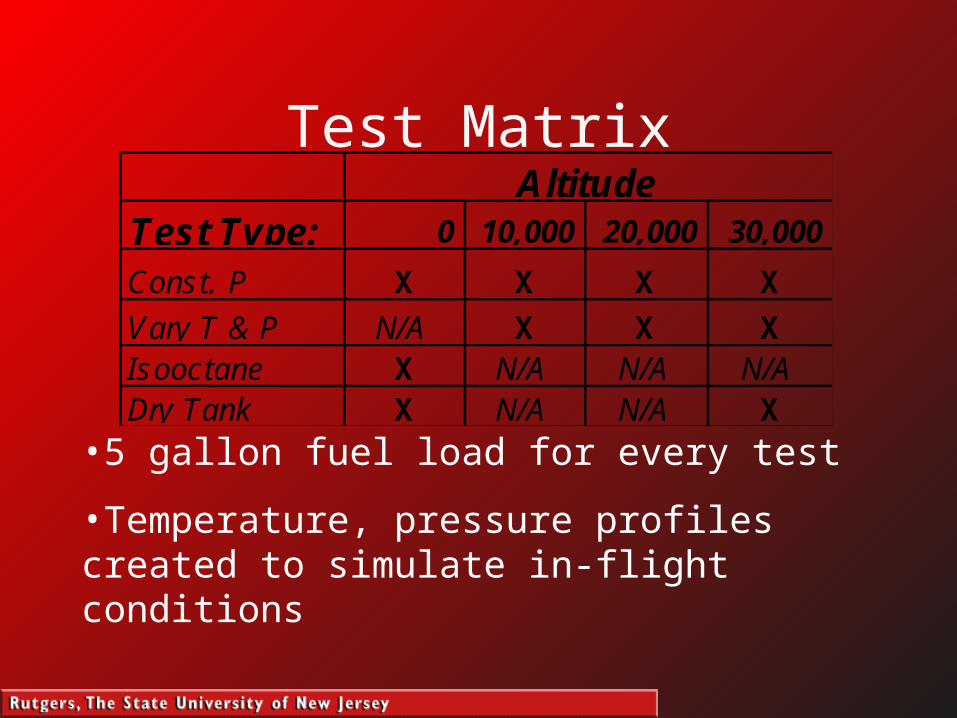
•5 gallon fuel load for every test
•Temperature, pressure profiles created to simulate in-flight conditions
Test Matrix
Test Type: 0 10,000 20,000 30,000
Const. P X X X X
Vary T & P N/A X X XIsooctane X N/A N/A N/ADry Tank X N/A N/A X
Altitude

Dry Tank Ullage Temperature
40
50
60
70
80
90
100
110
0 1000 2000 3000 4000 5000 6000
Time, seconds
Te
mp
era
ture
, D
eg
. F
.Input TempMeasured Ullage Temp
Calculated Ullage Temp
Comparison of measured vs. calculated ullage temperatureShows validity of well-mixed ullage assumption:
Calculated vs. Measured Ullage Gas Temperature

Fuel Vaporization:Constant Ambient Conditions at Atmospheric Pressure
0
20
40
60
80
100
120
140
0 500 1000 1500 2000 2500 3000
Time, seconds
Te
mp
era
ture
, De
g. F
.
0
0.5
1
1.5
2
2.5
% P
rop
ane
Liquid TempMeasuredCalculated, 120 FPCalculated, 115 FP
Calculated vs. Measured Ullage Vapor Concentration
Sea Level Vaporization:
-0.005
0
0.005
0.01
0.015
0.02
0.025
0 500 1000 1500 2000 2500 3000
Time, seconds
Mas
s, k
g
0
20
40
60
80
100
120
140
Deg. F.
EVAPORATED
CONDENSED
STORED
VENTED
LiquidTemperature
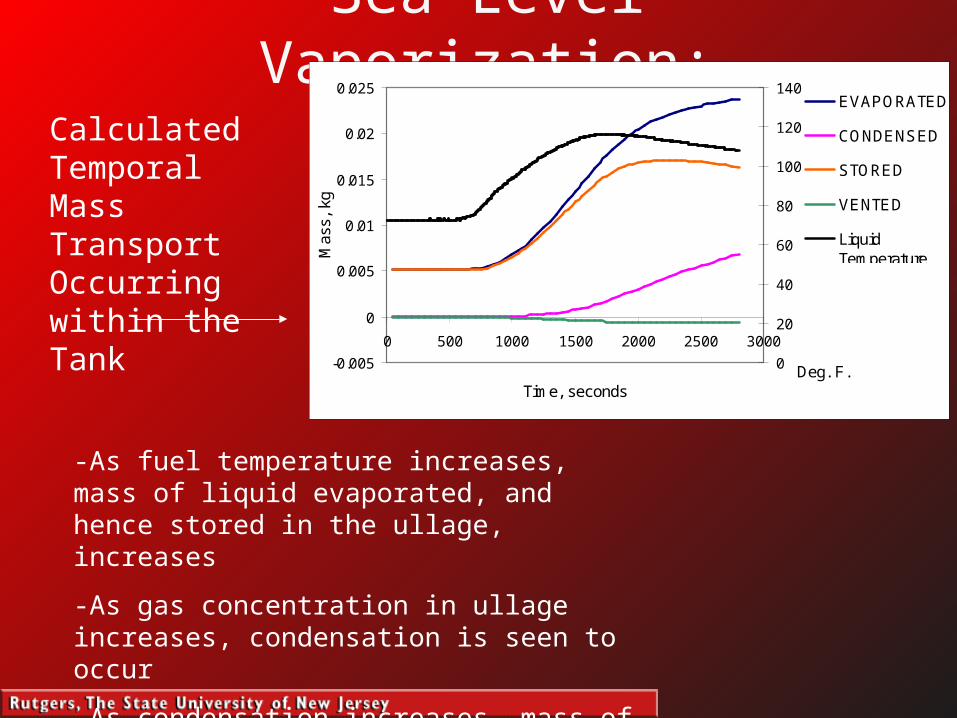
Calculated Temporal Mass Transport Occurring within the Tank
-As fuel temperature increases, mass of liquid evaporated, and hence stored in the ullage, increases
-As gas concentration in ullage increases, condensation is seen to occur
-As condensation increases, mass of fuel stored in the ullage decreases due to fuel condensing

Sea Level Vaporization:Flammability Assessment
0
0.01
0.02
0.03
0.04
0.05
0 500 1000 1500 2000 2500 3000
Time, seconds
FA
R
Measured Fuel to AirMass Ratio
Lower Flammability Limit
0
0.2
0.4
0.6
0.8
1
1.2
1.4
0 500 1000 1500 2000 2500 3000
Time, seconds
LeC
hate
lier's
Rat
io
LeChatelier's Ratio, 115 FP
LeChatelier's Ratio, 120 FP
LeChatelier's FlammabilityLimit
Flammability Assessment using the FAR rule, 0.033<LFL<0.045
Flammability Assessment using LeChatelier’s Rule, Flammable if LC>=1
0
20
40
60
80
100
0 2000 4000 6000 8000 10000 12000
Time, secondsT
empe
ratu
re,
Deg
. F
.
0
5
10
15
20
Pre
ssur
e, p
sia
Liquid Fuel TempAverage Ullage TempAverage Surface TempAmbient Pressure
0
0.5
1
1.5
2
2.5
3
0 2000 4000 6000 8000 10000 12000
Time, Seconds
% P
ropa
ne
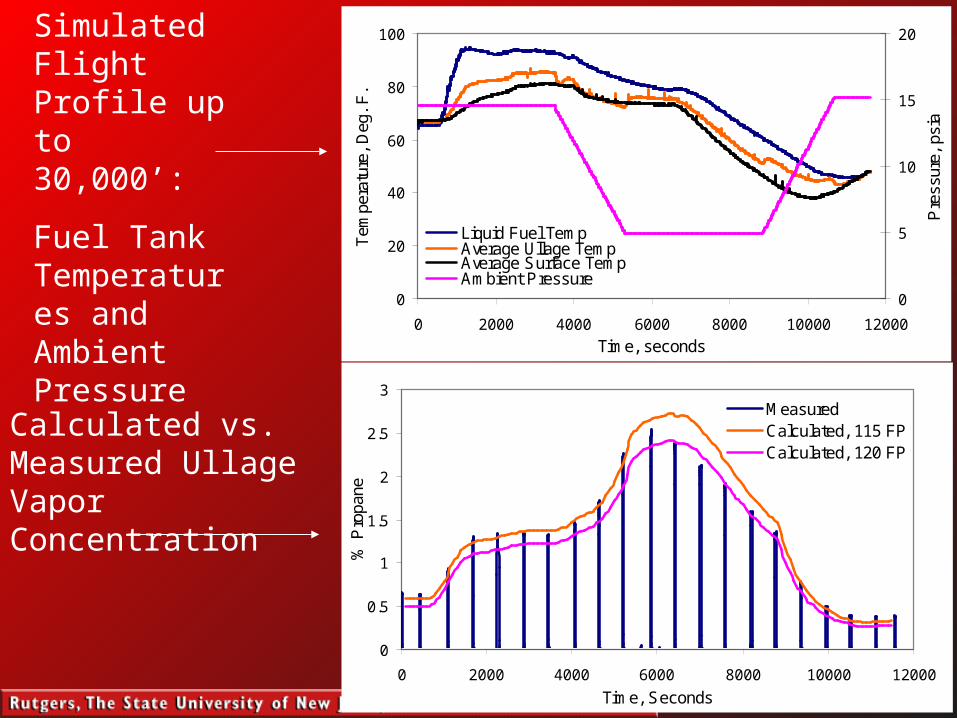
MeasuredCalculated, 115 FPCalculated, 120 FP
Simulated Flight Profile up to 30,000’:
Fuel Tank Temperatures and Ambient Pressure
Calculated vs. Measured Ullage Vapor Concentration

Varying T & P:Modeled Transport Processes
-0.015
-0.01
-0.005
0
0.005
0.01
0.015
0.02
0.025
0 2000 4000 6000 8000 10000 12000
Time, seconds
Mas
s, k
g
MassEvaporated
MassCondensed
MassStored inUllageMassVented

Varying T & P:Flammability Assessment
0
0.2
0.4
0.6
0.8
1
1.2
0 2000 4000 6000 8000 10000 12000 14000
LeChatelier's Ratio,115 FPLeChatelier's Ratio,120 FPLeChatelier'sFlammability Limit
0
0.01
0.02
0.03
0.04
0.05
0 2000 4000 6000 8000 10000 12000 14000
Time, seconds
FA
R
Measured Fuel to AirMass Ratio
Lower FlammabilityLimit Flammability
Assessment using the FAR rule, 0.033<LFL<0.045
Flammability Assessment using LeChatelier’s Rule, Flammable if LC>=1

Summary of Results• Experiment was well designed to provide usable model
validation data• Model calculations of ullage gas temperature and ullage
vapor concentration agree well with measured values• Model calculations of mass transport within the tank give a
good explanation of the processes occurring in a fuel tank• Model can be used to determine the level of flammability
using either the FAR rule or LeChatelier’s Flammability Rule
• The calculations show that flammability is dependent on the composition of the ullage gas.