Embed Size (px)
Citation preview
8/7/2019 Jerusalem - Facts and Trends 2005-2006
http://slidepdf.com/reader/full/jerusalem-facts-and-trends-2005-2006 1/72
The Jerusalem Institute for Israel StudiesFounded by the Charles H. Revson Foundation
Jerusalem: Facts and Trends
2005/2006
Maya Choshen, Michal Korach
2008
8/7/2019 Jerusalem - Facts and Trends 2005-2006
http://slidepdf.com/reader/full/jerusalem-facts-and-trends-2005-2006 2/72
Jerusalem: Facts and Trends
2005/2006
Maya ChoshenMichal Korach
This publication has been produced with the support of the Charles H. RevsonFoundation of New York and the Pratt Foundation. The statements made and theviews expressed in this document re ect solely the opinions of its authors.
Translation from Hebrew: Laura Wharton
© 2008, The Jerusalem Institute for Israel StudiesThe Hay Elyachar House
20 Radak St., 92186 Jerusalem
http://www.jiis.org.il
8/7/2019 Jerusalem - Facts and Trends 2005-2006
http://slidepdf.com/reader/full/jerusalem-facts-and-trends-2005-2006 3/72
- Table of Contents -
About the Authors .............................................................................................. 7
Preface ................................................................................................................. 9
Area ....................................................................................................................11
Population ..........................................................................................................11Population Size ...................................................................................................11The Legal Status of the Arab Population ........................................................... 12The Geographical Distribution of the Population .............................................. 13Population Growth ............................................................................................. 14Sources of Population Growth ........................................................................... 15
Births and Fertility ....................................................................................... 16Mortality ...................................................................................................... 18
Natural Population Growth .......................................................................... 19Immigration ................................................................................................. 20Migration Between Settlements ................................................................... 23
The Age of the Population ................................................................................. 25Measures of Religious Identi cation ................................................................. 33Households ......................................................................................................... 33Incidence of Poverty .......................................................................................... 34Socio-Economic Status ...................................................................................... 35
Ownership of Consumer Goods ......................................................................... 36Monthly Consumer Expenditures ...................................................................... 36Housing Density................................................................................................. 37
Employment...................................................................................................... 38Rate of Participation in the Civilian Labor Force .............................................. 38Employment by Economic Branch .................................................................... 41Income and Wages ............................................................................................. 42
8/7/2019 Jerusalem - Facts and Trends 2005-2006
http://slidepdf.com/reader/full/jerusalem-facts-and-trends-2005-2006 4/72
Education .......................................................................................................... 45Jerusalem’s Educational System ........................................................................ 45
Hebrew Education ....................................................................................... 46
Arab Education ............................................................................................ 48Special Education ........................................................................................ 49
Entitlement to Matriculation Certi cates ........................................................... 51Higher Education ............................................................................................... 51
University Enrollment ................................................................................. 52
Construction ..................................................................................................... 55Apartments ......................................................................................................... 55Apartment Prices ................................................................................................ 57Construction Starts ............................................................................................. 57Construction Completions ................................................................................. 58
Tourism ............................................................................................................. 61Tourist Hotels ..................................................................................................... 61Guests and Overnight Stays ............................................................................... 61
Jerusalem Compared to Other Selected Cities ................................................... 63West Jerusalem – East Jerusalem ....................................................................... 65Revenue .............................................................................................................. 65
Museums ........................................................................................................... 66
Transportation .................................................................................................. 67Vehicles .............................................................................................................. 67
Road Accidents .................................................................................................. 67
Health ................................................................................................................ 68
Jerusalem as a Component of National Strength .......................................... 69
8/7/2019 Jerusalem - Facts and Trends 2005-2006
http://slidepdf.com/reader/full/jerusalem-facts-and-trends-2005-2006 5/72
List of Illustrations
Population of Jerusalem, by Population Group, 1967-2006 (Thousands) ......... 12Population of Jerusalem, by Population Group, 1967-2006 (Percent) .............. 12Population in Areas Annexed to the City with its Uni cation in 1967,
by Population Group, 1972-2005 ............................................................ 13Jewish Population in Areas Annexed to the City with its Uni cation
in 1967, as Percentage of the Overall Jewish Population in Jerusalem ... 14Population Growth in Areas Annexed to the City with its Uni cation
in 1967, by Population Group, 1972-2005 .............................................. 14Population Growth in Jerusalem, by Population Group, 1968-2006 ................. 15Sources of Population Growth in Jerusalem, 1985-2006 ................................... 16Births in Jerusalem, by Population Group, 1975-2006 ...................................... 17Deaths in Jerusalem, by Population Group, 1975-2006 .................................... 18Initial Settlement of Immigrants in Jerusalem, 1987-2006 ................................ 21Immigrants in Jerusalem, by Sub-Quarter, 2005 ............................................... 22Migration Balance to and from Jerusalem, 1980-2006 ...................................... 23
Migration Balance to and from Jerusalem, by District, 2000-2005 ................... 24Age Structure of the Population in Jerusalem, 1977, 2005 ................................ 26Age Structure of the Population in Jerusalem and in Israel, 2005 ..................... 26Age Structure of the Jewish Population in Jerusalem and in Israel, 2005 ......... 27Age Structure of the Arab Population in Jerusalem and in Israel, 2005 ............ 27Age Structure of the Population in Jerusalem, by Population Group, 2005 ...... 28Age Structure of the Population in Ma’ale Adumim and in
Mevasseret Zion, 2005 ............................................................................. 28
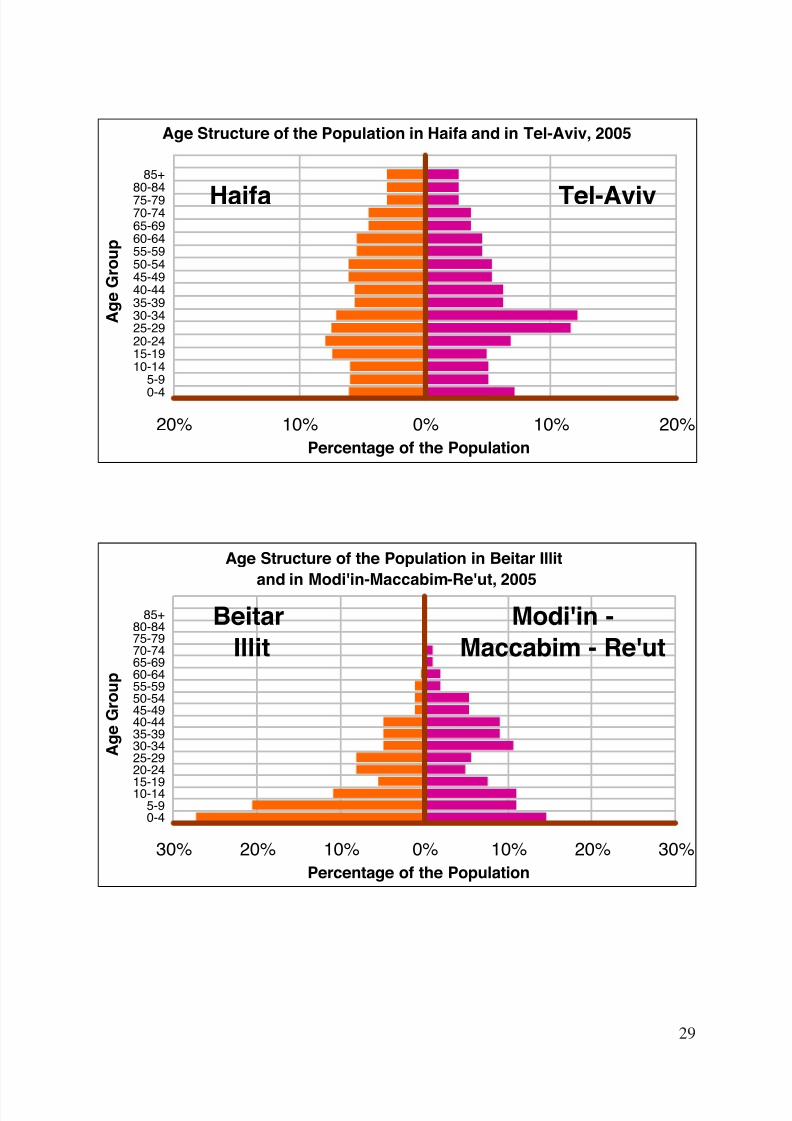
Age Structure of the Population in Haifa and in Tel Aviv, 2005 ........................ 29Age Structure of the Population in Beitar Illit and in Modi’in-
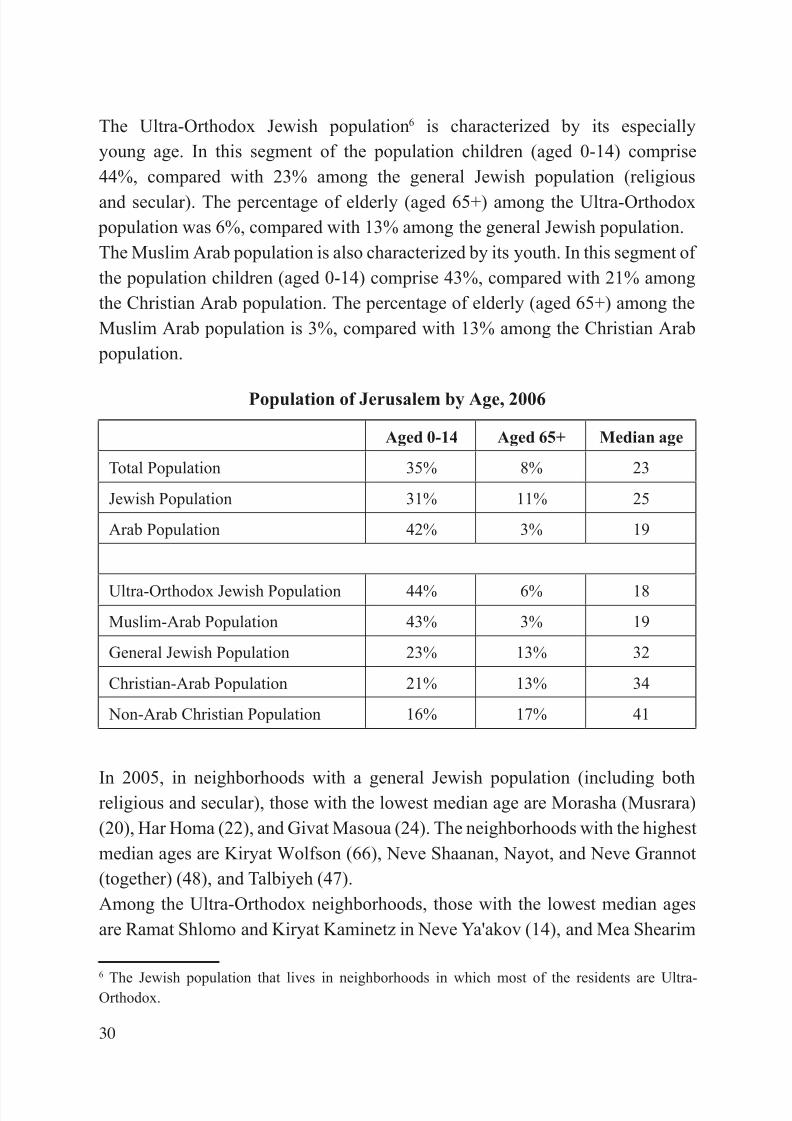
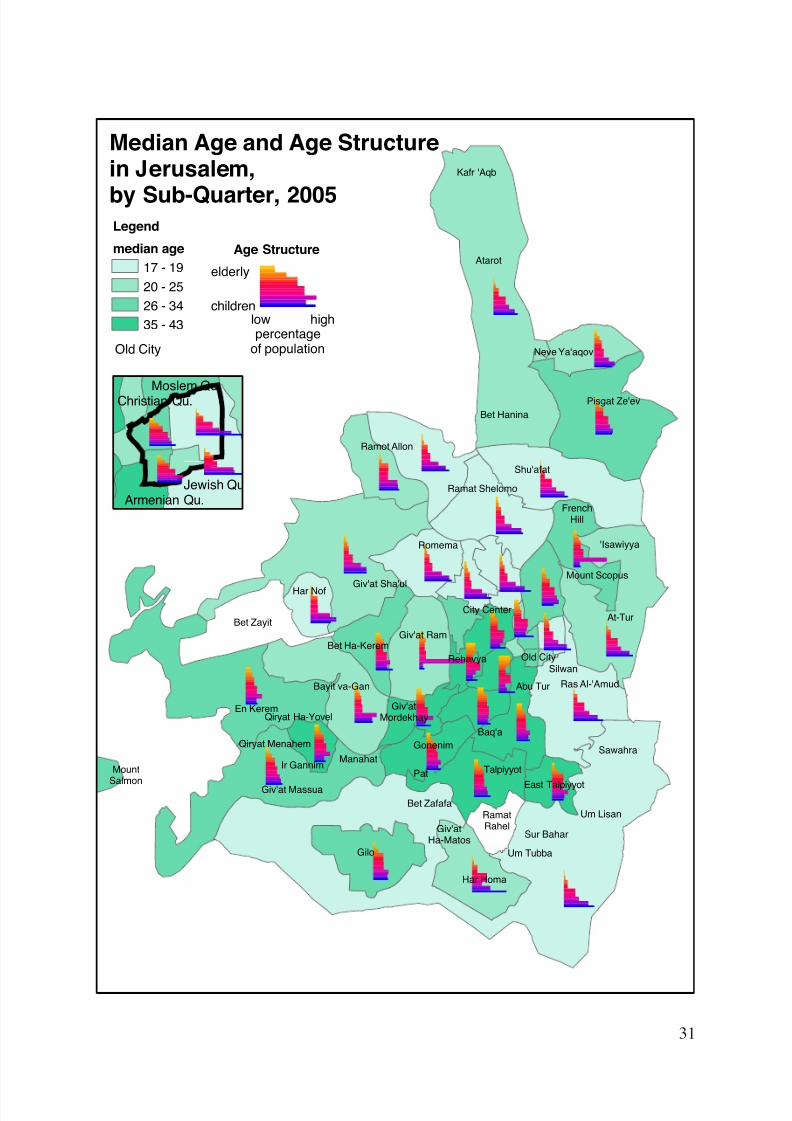
Maccabim-Re’ut, 2005 ............................................................................ 29Median Age and Age Structure in Jerusalem, by Sub-Quarter, 2005 ................ 31Young People, Aged 20-34, as a Percentage of the Total Population
of Statistical Area, 2005 ........................................................................... 32Extent of Poverty, by District, 2005 ................................................................... 35Civilian Labor Force in Jerusalem and in Israel, as Percentage of
Population Aged 15+, by Years of Schooling, 2006 ................................ 39
8/7/2019 Jerusalem - Facts and Trends 2005-2006
http://slidepdf.com/reader/full/jerusalem-facts-and-trends-2005-2006 6/72
Civilian Labor Force in Jerusalem and in Israel, as Percentage of Population Aged 15+, by Years of Schooling, 2006 - JewishPopulation ................................................................................................ 39
Civilian Labor Force in Jerusalem and in Israel, as Percentage of Population Aged 15+, by Years of Schooling and Gender, 2006 ............. 40
Civilian Labor Force in Jerusalem and in Israel, as Percentage of Population Aged 15+, by Years of Schooling and Gender, 2006 -Jewish Population .................................................................................... 40
Pupils in the Education System in Jerusalem, by Sector, 2006/2007 ................ 50Pupils in the Education System in Jerusalem, by Sector, 2000/01-2006/07 ...... 50Applications for Under-graduate Studies (BA) at Universities in Israel
and Their Results, 2005/2006 .................................................................. 53Applications for Under-graduate Studies (BA) at the Hebrew University
and Their Results, 1979/80-2005/06 ........................................................ 54Average Annual Growth Rate in Numbers of Students at the Hebrew
University, by Degree, 1995/1996-2005/2006 ......................................... 54Apartment Size in Jerusalem, by Statistical Area, 2006 .................................... 56Area of Residential Construction Starts in Jerusalem, Tel-Aviv
and Haifa, 1980-2005 .............................................................................. 58Building Completion of Apartments in Jerusalem, by Sub-Quarter, 2005 ........ 60Overnight Stays in Tourist Hotels in Jerusalem, by Month, 2006 ..................... 62Overnight Stays in Tourist Hotels in Jerusalem (Thousands), 1980-2006 ........ 63Overnight Stays in Tourist Hotels in Jerusalem (as Percentage of Total
Overnights in Israel), 1980-2006 ............................................................. 63Overnight Stays in Tourist Hotels in Selected Localities, 1980-2006 ............... 64
8/7/2019 Jerusalem - Facts and Trends 2005-2006
http://slidepdf.com/reader/full/jerusalem-facts-and-trends-2005-2006 7/72
- About the Authors -
Dr. Maya Choshen – Geographer and urban planner, researcher at the JerusalemInstitute for Israel Studies. Dr. Choshen is Editor of the Statistical Yearbook of
Jerusalem , project adviser for research teams and director of numerous projectson a wide range of subjects, including social issues, planning, and education inJerusalem.
Michal Korach – received a bachelor's degree in Islam and Middle Eastern
Studies and a master's degree in geography with a specialty in regional and urbanstudies, both from the Hebrew University of Jerusalem. Korach is a researcher atthe Jerusalem Institute for Israel Studies in the elds of Jerusalem's populationand society as well as environmental affairs.

8/7/2019 Jerusalem - Facts and Trends 2005-2006
http://slidepdf.com/reader/full/jerusalem-facts-and-trends-2005-2006 8/72
8/7/2019 Jerusalem - Facts and Trends 2005-2006
http://slidepdf.com/reader/full/jerusalem-facts-and-trends-2005-2006 9/72
- Preface -
This publication presents a cogent and up-to-date picture of Jerusalem and itstrends of change as evidenced in a wide range of issues, including population,employment, education, tourism, transportation, and construction.
In many cases comparisons are presented between the Jewish and Arab populationsof Jerusalem. Yet there are subjects in which statistical information is lackingregarding the Arab population.
The primary source of information in this publication is the Statistical Yearbook of Jerusalem 2005/2006 . The Yearbook is published annually by the JerusalemMunicipality and the Jerusalem Institute for Israel Studies. It draws on a number of sources, but principally on the Central Bureau of Statistics and the JerusalemMunicipality. This is an opportunity to thank all those sources that provided dataand their great contribution both to the Yearbook and this publication.
Yair Assaf-Shapira was responsible for the graphic design, Laura Wharton for translation, Eran Avni for proo ng, Hamutal Appel for preparing for publication,Esti Boehm for the production, the Charles H. Revson Foundation and the PrattFoundation assisted in funding: to all of them we express our gratitude andappreciation.
Dr. Maya Choshen and Michal Korach

8/7/2019 Jerusalem - Facts and Trends 2005-2006
http://slidepdf.com/reader/full/jerusalem-facts-and-trends-2005-2006 10/72
8/7/2019 Jerusalem - Facts and Trends 2005-2006
http://slidepdf.com/reader/full/jerusalem-facts-and-trends-2005-2006 11/72
11
- Area -
Jerusalem is Israel's largest city in terms of area. Its jurisdiction covers 126 squarekilometers. For the sake of comparison, Tel Aviv's 1 area is 51 square kilometers,Haifa 60 square kilometers and Ma'ale Adumim 49 square kilometers.
-Population-
Population Size
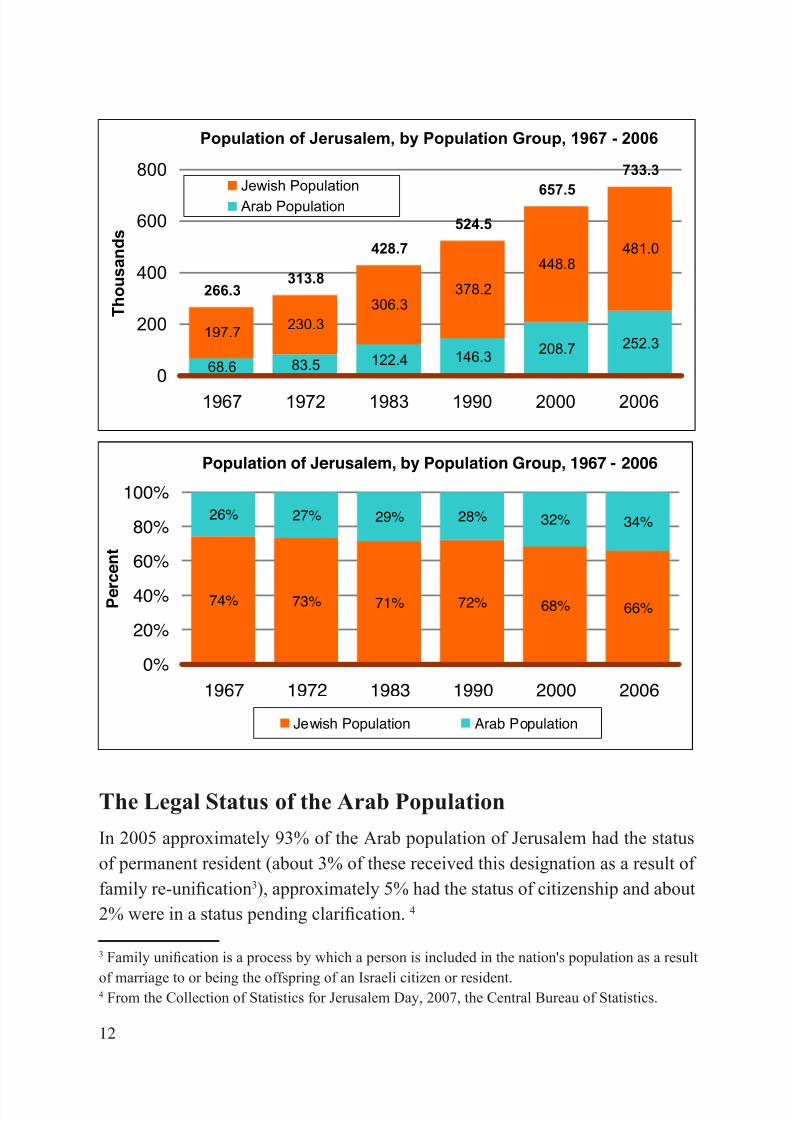
At the end of 2006 the population of Jerusalem stood at 733.3 thousand. TheJewish 2 population numbered 481.0 thousand and the Arab 252.4 thousand; theArab population was composed of a Muslim majority (94%) and a Christianminority. For that year the population of Jerusalem constituted 10% of Israel'stotal population, Jerusalem's Jewish population accounted for 8% of the country'sJewish population, and Jerusalem's Arab population was 18% of the country'sArab population.
The portion of Jerusalem's Jewish population dwindled from 74% in 1967 to72% in 1980 and down to 66% in 2006. Parallel to this the Arab portion of the
population rose from 26% in 1967 to 28% in 1980 and up to 34% in 2006.
1 Whereever data appears regarding Tel Aviv, they refer to Tel Aviv-Yafo.2
In this chapter, statistics for the Jewish population include: Jews, non-Arab Christians, and otherswithout religious categorization.
8/7/2019 Jerusalem - Facts and Trends 2005-2006
http://slidepdf.com/reader/full/jerusalem-facts-and-trends-2005-2006 12/72
12
The Legal Status of the Arab Population
In 2005 approximately 93% of the Arab population of Jerusalem had the statusof permanent resident (about 3% of these received this designation as a result of family re-uni cation 3), approximately 5% had the status of citizenship and about2% were in a status pending clari cation. 4
3 Family uni cation is a process by which a person is included in the nation's population as a result
of marriage to or being the offspring of an Israeli citizen or resident.4 From the Collection of Statistics for Jerusalem Day, 2007, the Central Bureau of Statistics.
Population of Jerusalem, by Population Group, 1967 - 2006
74% 73% 71% 72% 68% 66%
26% 27% 29% 28% 32% 34%
0%
20%
40%
60%
80%
100%
1967 1972 1983 1990 2000 2006
P e r c e n
t
Jewish Population Arab Population
8/7/2019 Jerusalem - Facts and Trends 2005-2006
http://slidepdf.com/reader/full/jerusalem-facts-and-trends-2005-2006 13/72
13
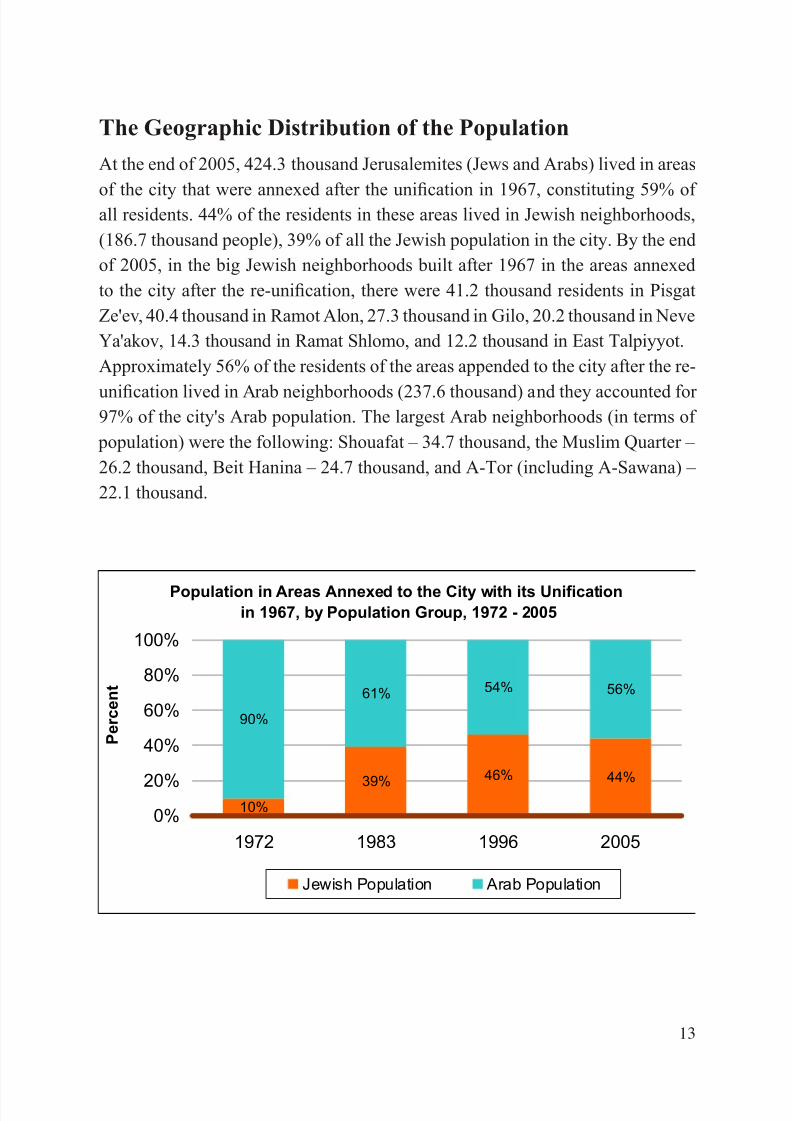
The Geographic Distribution of the Population
At the end of 2005, 424.3 thousand Jerusalemites (Jews and Arabs) lived in areas
of the city that were annexed after the uni cation in 1967, constituting 59% of all residents. 44% of the residents in these areas lived in Jewish neighborhoods,(186.7 thousand people), 39% of all the Jewish population in the city. By the endof 2005, in the big Jewish neighborhoods built after 1967 in the areas annexedto the city after the re-uni cation, there were 41.2 thousand residents in PisgatZe'ev, 40.4 thousand in Ramot Alon, 27.3 thousand in Gilo, 20.2 thousand in NeveYa'akov, 14.3 thousand in Ramat Shlomo, and 12.2 thousand in East Talpiyyot.Approximately 56% of the residents of the areas appended to the city after the re-
uni cation lived in Arab neighborhoods (237.6 thousand) and they accounted for 97% of the city's Arab population. The largest Arab neighborhoods (in terms of
population) were the following: Shouafat – 34.7 thousand, the Muslim Quarter – 26.2 thousand, Beit Hanina – 24.7 thousand, and A-Tor (including A-Sawana) – 22.1 thousand.
8/7/2019 Jerusalem - Facts and Trends 2005-2006
http://slidepdf.com/reader/full/jerusalem-facts-and-trends-2005-2006 14/72
14
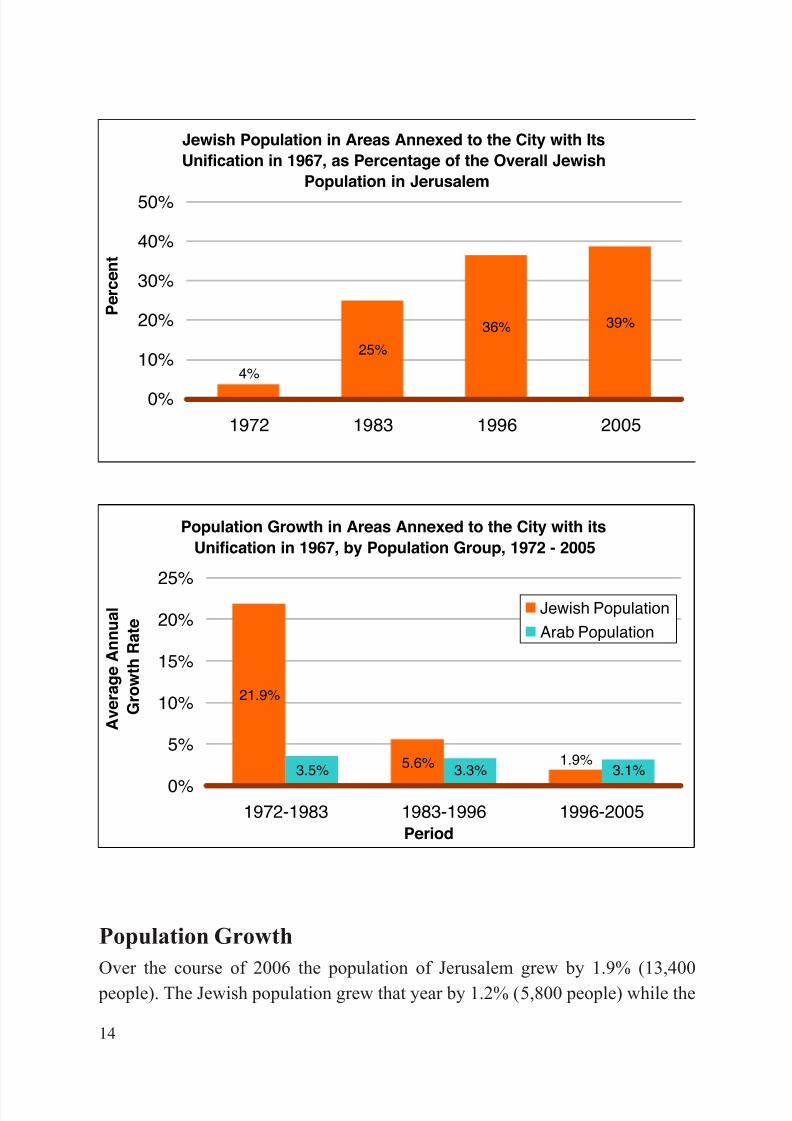
Population GrowthOver the course of 2006 the population of Jerusalem grew by 1.9% (13,400
people). The Jewish population grew that year by 1.2% (5,800 people) while the
Population Growth in Areas Annexed to the City with itsUnification in 1967, by Population Group, 1972 - 2005
21.9%
5.6%3.5% 3.3% 3.1%1.9%
0%
5%
10%
15%
20%
25%
1972-1983 1983-1996 1996-2005Period
A v e r a g e
A n n u a l
G r o w
t h R a t e
Jewish PopulationArab Population
Jewish Population in Areas Annexed to the City with ItsUnification in 1967, as Percentage of the Overall Jewish
Population in Jerusalem
25%
39%36%
4%
0%
10%
20%
30%
40%
50%
1972 1983 1996 2005
P e r c e n
t
8/7/2019 Jerusalem - Facts and Trends 2005-2006
http://slidepdf.com/reader/full/jerusalem-facts-and-trends-2005-2006 15/72
15
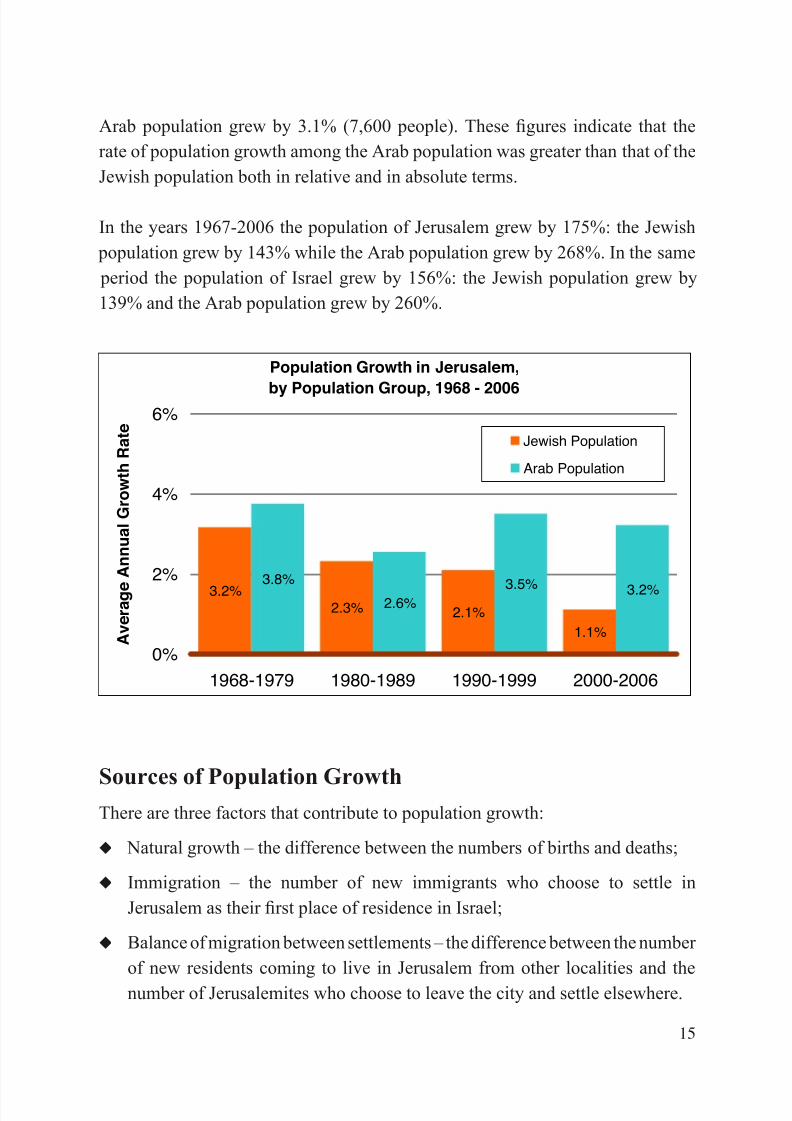
Arab population grew by 3.1% (7,600 people). These gures indicate that therate of population growth among the Arab population was greater than that of theJewish population both in relative and in absolute terms.
In the years 1967-2006 the population of Jerusalem grew by 175%: the Jewish population grew by 143% while the Arab population grew by 268%. In the same period the population of Israel grew by 156%: the Jewish population grew by139% and the Arab population grew by 260%.
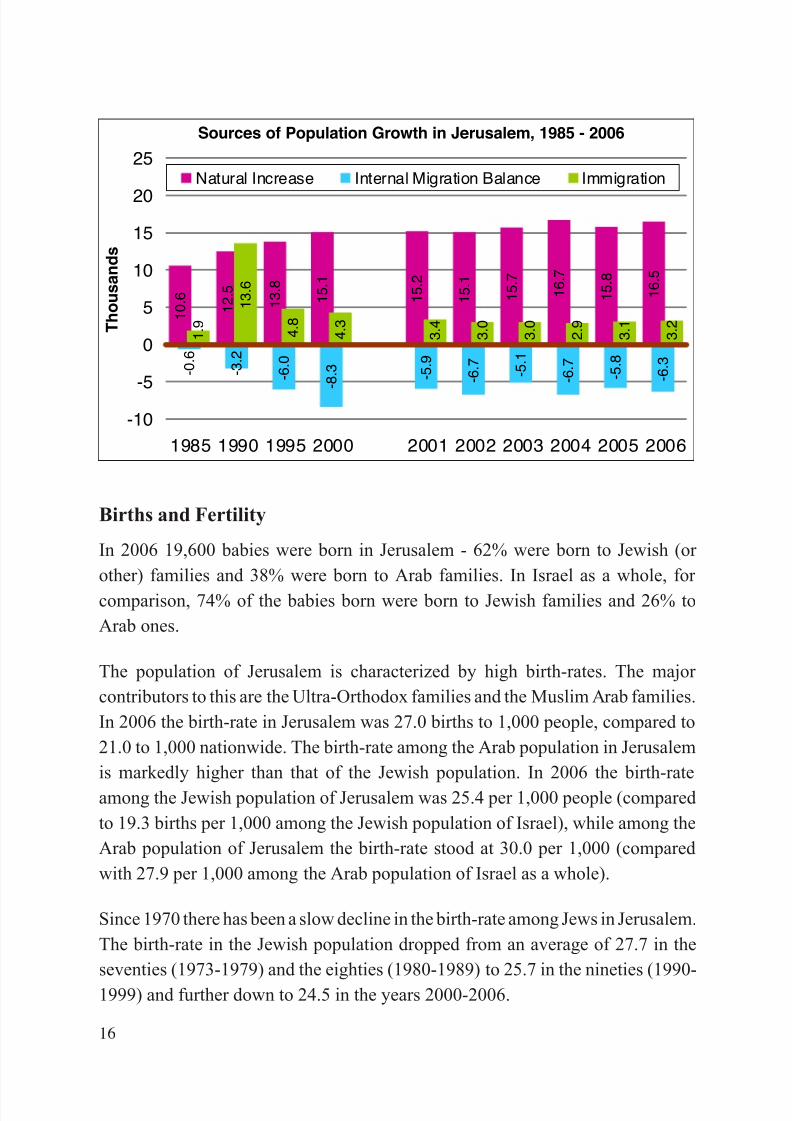
Sources of Population GrowthThere are three factors that contribute to population growth:
Natural growth – the difference between the numbers of births and deaths;
Immigration – the number of new immigrants who choose to settle inJerusalem as their rst place of residence in Israel;
Balance of migration between settlements – the difference between the number of new residents coming to live in Jerusalem from other localities and thenumber of Jerusalemites who choose to leave the city and settle elsewhere.
◆
◆
◆
Population Growth in Jerusalem,
by Population Group, 1968 - 2006
3.2%2.3% 2.1%
1.1%
3.8%
2.6% 3.5% 3.2%
0%
2%
4%
6%
1968-1979 1980-1989 1990-1999 2000-2006
A v e r a g e
A n n u a l G r o w
t h R a t e
Jewish Population
Arab Population
8/7/2019 Jerusalem - Facts and Trends 2005-2006
http://slidepdf.com/reader/full/jerusalem-facts-and-trends-2005-2006 16/72
16
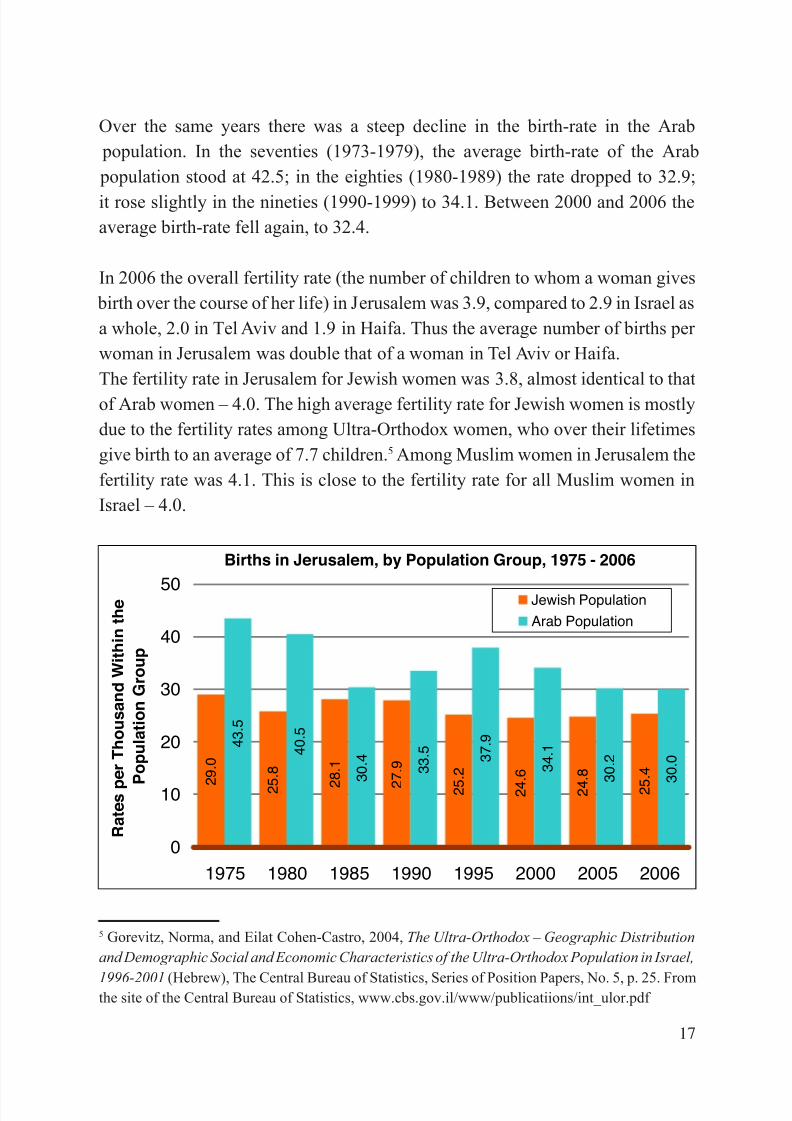
Births and Fertility
In 2006 19,600 babies were born in Jerusalem - 62% were born to Jewish (or other) families and 38% were born to Arab families. In Israel as a whole, for comparison, 74% of the babies born were born to Jewish families and 26% toArab ones.
The population of Jerusalem is characterized by high birth-rates. The major contributors to this are the Ultra-Orthodox families and the Muslim Arab families.In 2006 the birth-rate in Jerusalem was 27.0 births to 1,000 people, compared to21.0 to 1,000 nationwide. The birth-rate among the Arab population in Jerusalemis markedly higher than that of the Jewish population. In 2006 the birth-rateamong the Jewish population of Jerusalem was 25.4 per 1,000 people (comparedto 19.3 births per 1,000 among the Jewish population of Israel), while among theArab population of Jerusalem the birth-rate stood at 30.0 per 1,000 (comparedwith 27.9 per 1,000 among the Arab population of Israel as a whole).
Since 1970 there has been a slow decline in the birth-rate among Jews in Jerusalem.The birth-rate in the Jewish population dropped from an average of 27.7 in theseventies (1973-1979) and the eighties (1980-1989) to 25.7 in the nineties (1990-1999) and further down to 24.5 in the years 2000-2006.
Sources of Population Growth in Jerusalem, 1985 - 2006
1 0
. 6 1 2
. 5 1 3
. 8 1 5
. 1 1 5
. 2
1 5
. 1 1 5
. 7 1 6
. 7
1 5
. 8 1 6
. 5
- 0 . 6
- 3 . 2
- 6 . 0
- 8 . 3 - 5
. 9 - 6 . 7
- 5 . 1
- 6 . 7
- 5 . 8
- 6 . 3
1 . 9
1 3
. 6
4 . 8
4 . 3
3 . 4
3 . 0
3 . 0
2 . 9
3 . 1
3 . 2
-10
-5
0
5
10
15
20
25
1985 1990 1995 2000 2001 2002 2003 2004 2005 2006
T h o u s a n
d s
Natural Increase Internal Migration Balance Immigration
8/7/2019 Jerusalem - Facts and Trends 2005-2006
http://slidepdf.com/reader/full/jerusalem-facts-and-trends-2005-2006 17/72
1
Over the same years there was a steep decline in the birth-rate in the Arab population. In the seventies (1973-1979), the average birth-rate of the Arab population stood at 42.5; in the eighties (1980-1989) the rate dropped to 32.9;it rose slightly in the nineties (1990-1999) to 34.1. Between 2000 and 2006 theaverage birth-rate fell again, to 32.4.
In 2006 the overall fertility rate (the number of children to whom a woman gives birth over the course of her life) in Jerusalem was 3.9, compared to 2.9 in Israel asa whole, 2.0 in Tel Aviv and 1.9 in Haifa. Thus the average number of births per woman in Jerusalem was double that of a woman in Tel Aviv or Haifa.The fertility rate in Jerusalem for Jewish women was 3.8, almost identical to thatof Arab women – 4.0. The high average fertility rate for Jewish women is mostlydue to the fertility rates among Ultra-Orthodox women, who over their lifetimesgive birth to an average of 7.7 children. 5 Among Muslim women in Jerusalem thefertility rate was 4.1. This is close to the fertility rate for all Muslim women inIsrael – 4.0.
5 Gorevitz, Norma, and Eilat Cohen-Castro, 2004, The Ultra-Orthodox – Geographic Distributionand Demographic Social and Economic Characteristics of the Ultra-Orthodox Population in Israel,
1996-2001 (Hebrew), The Central Bureau of Statistics, Series of Position Papers, No. 5, p. 25. Fromthe site of the Central Bureau of Statistics, www.cbs.gov.il/www/publicatiions/int_ulor.pdf
Births in Jerusalem, by Population Group, 1975 - 2006
2 9
. 0
2 5
. 8
2 8
. 1
2 7
. 9
2 5 . 2
2 4 . 6
2 4 . 8
2 5
. 4
4 3
. 5
4 0
. 5
3 0
. 4 3 3
. 5 3 7
. 9
3 4
. 1
3 0
. 2
3 0
. 0
0
10
20
30
40
50
1975 1980 1985 1990 1995 2000 2005 2006
R a t e s p e r
T h o u s a n
d W i t h i n t h e
P o p u
l a t i o n
G r o u p
Jewish PopulationArab Population
8/7/2019 Jerusalem - Facts and Trends 2005-2006
http://slidepdf.com/reader/full/jerusalem-facts-and-trends-2005-2006 18/72
18
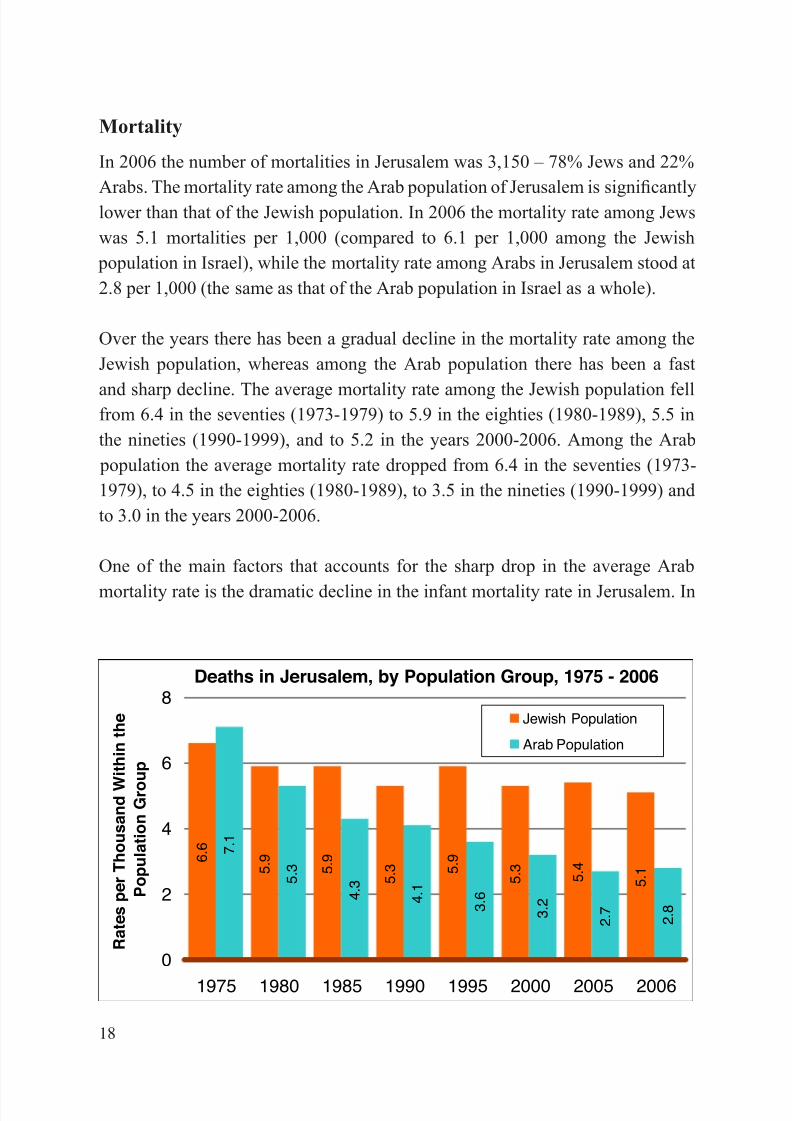
Mortality
In 2006 the number of mortalities in Jerusalem was 3,150 – 78% Jews and 22%
Arabs. The mortality rate among the Arab population of Jerusalem is signi cantlylower than that of the Jewish population. In 2006 the mortality rate among Jewswas 5.1 mortalities per 1,000 (compared to 6.1 per 1,000 among the Jewish
population in Israel), while the mortality rate among Arabs in Jerusalem stood at2.8 per 1,000 (the same as that of the Arab population in Israel as a whole).
Over the years there has been a gradual decline in the mortality rate among theJewish population, whereas among the Arab population there has been a fast
and sharp decline. The average mortality rate among the Jewish population fellfrom 6.4 in the seventies (1973-1979) to 5.9 in the eighties (1980-1989), 5.5 inthe nineties (1990-1999), and to 5.2 in the years 2000-2006. Among the Arab
population the average mortality rate dropped from 6.4 in the seventies (1973-1979), to 4.5 in the eighties (1980-1989), to 3.5 in the nineties (1990-1999) andto 3.0 in the years 2000-2006.
One of the main factors that accounts for the sharp drop in the average Arab
mortality rate is the dramatic decline in the infant mortality rate in Jerusalem. In
Deaths in Jerusalem, by Population Group, 1975 - 2006
6 . 6
5 . 9
5 . 9
5 . 3 5
. 9
5 . 3
5 . 4
5 . 1
7 . 1
5 . 3
4 . 3
4 . 1
3 . 6
3 . 2
2 . 7
2 . 8
0
2
4
6
8
1975 1980 1985 1990 1995 2000 2005 2006
R a t e s p e r
T h o u s a n
d W
i t h i n t h e
P o p u
l a t i o n
G r o u p
Jewish Population
Arab Population
8/7/2019 Jerusalem - Facts and Trends 2005-2006
http://slidepdf.com/reader/full/jerusalem-facts-and-trends-2005-2006 19/72
1
the seventies (1972-1979) the average rate of infant mortality among the Arab population of Jerusalem was 45.2 (deaths per thousand live births); this guredropped to 17.2 in the eighties (1980-1989), to 10.7 in the nineties (1990-1999)and to 6.2 (deaths per thousand live births) in the years 2004-2006.The decline in the infant mortality rate among the Arab population of Jerusalemis the result of improvements in the sanitary conditions, the health services, andthe preventative medical care in the seventies and eighties, as well as the passageof the national health law in the mid-nineties. Another part of the explanationis that the Arab population is younger than the Jewish population. In 2006 the
portion of children (aged 0-14) among the Arab population was 42% (comparedwith 31% among the Jewish population) and of the elderly (aged 65+) was only3% (as compared to 11% among the Jewish population).
In the years 2004-2006 the average rate of infant mortality among the Jewish population of Jerusalem was 3.4 (versus 3.1 among the Jewish population of Israel as a whole) and 6.2 among the Arab population (versus 7.6 among the Arab
population of Israel as a whole).
Natural Population Growth
The natural population growth (the difference between the number of births andthe number of deaths) is an important component in the growth of Jerusalem's
population. In 2006 Jerusalem gained 16,500 new residents as a result of natural population growth – 58% Jews and 42% Arabs. The natural growth of Jerusalem(16,500 people) is signi cantly higher than that of Tel Aviv (3,500 people) or
Haifa (900 people). This year the natural growth rate of Jerusalem was 22.7 per thousand people, as opposed to 15.5 for all of Israel, 9.2 for Tel Aviv, and 3.4 for Haifa.
The natural growth rate of the Arab population of Jerusalem was notably higher than that of the Jewish population. In 2006 the natural growth rate of the Arab
population was 27.4 per thousand, as compared to 20.3 for the Jewish population.However, the natural growth rate for the Jewish population in Jerusalem washigher than the rate for the Jewish population of Israel as a whole, 20.3 and 13.2,
8/7/2019 Jerusalem - Facts and Trends 2005-2006
http://slidepdf.com/reader/full/jerusalem-facts-and-trends-2005-2006 20/72
20
respectively. The natural growth rate for the Arab population of Jerusalem wasalso higher than the rate for the Arab population of Israel as a whole, 27.4 and24.9, respectively.From the 1970s to 2006 there has been a drop in the rate of natural populationgrowth among both the Arab and the Jewish population. Generally, the declinein the rate among the Jewish population has been gradual but steady -- in theseventies (1973-1979) and the eighties (1980-1989) the average rate of naturalgrowth was 21.3 and 21.8 per thousand, respectively, and this dropped further to20.3 in the nineties (1990-1999) and further still to 19.4 in the period 2000-2006.In contrast, the trend among the Arab population was one of rapid decline. In theseventies (1973-1979) the average rate of natural growth was 36.2 per thousandArab residents, the rate fell to 28.5 in the eighties (1980-1989), rose slightly to30.3 in the nineties (1990-1999), and stood at 29.3 in the years 2000-2006.
Immigration
In 2006 2,500 new immigrants, representing 13% of all immigrants to Israel
that year, chose to settle in Jerusalem. In 2005 – 2,500 immigrants, 12% of allimmigrants to Israel – settled in Jerusalem. 5% of the immigrants to Israel settledin Tel Aviv and 4% in Haifa.
Beginning in 2002 there was a signi cant rise in the rate of immigrants whochose Jerusalem as their rst place of residence in Israel. This change stems in
part from the rise in the relative portion of immigrants from the U.S. and WesternEurope and an accompanying drop in the portion of immigrants from the former U.S.S.R. During the large wave of immigration from the U.S.S.R and it successor states, Jerusalem absorbed a relatively small percentage of immigrants. In theyears 1990-2001, 77,400 immigrants, constituting 7% of all immigrants to Israel,settled in Jerusalem. Tel Aviv and Haifa, in comparison, each absorbed 10% of the new immigrants over the same time period.
Between 1990 and 2005 89,400 new immigrants took up residence in Jerusalem.Over time they became familiar with the opportunities available in differentsettlements in the country and re-de ned their desires, aspirations, and economic
8/7/2019 Jerusalem - Facts and Trends 2005-2006
http://slidepdf.com/reader/full/jerusalem-facts-and-trends-2005-2006 21/72
21
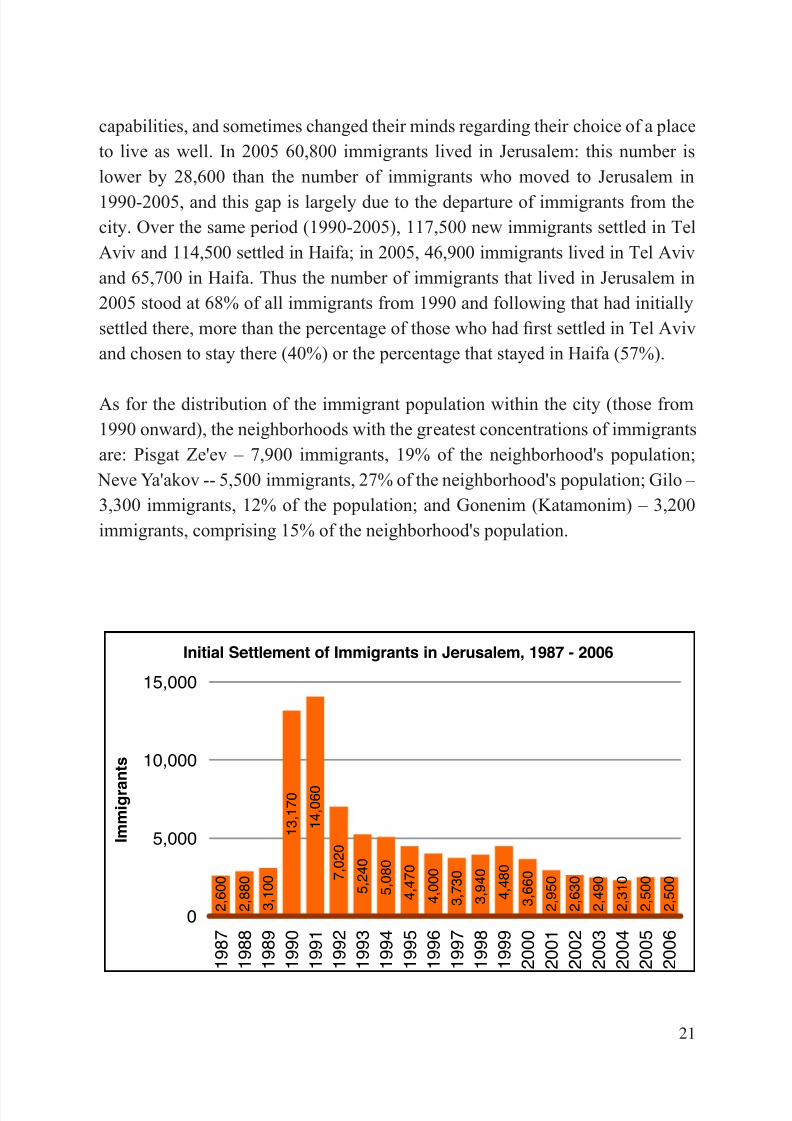
capabilities, and sometimes changed their minds regarding their choice of a placeto live as well. In 2005 60,800 immigrants lived in Jerusalem: this number islower by 28,600 than the number of immigrants who moved to Jerusalem in1990-2005, and this gap is largely due to the departure of immigrants from thecity. Over the same period (1990-2005), 117,500 new immigrants settled in TelAviv and 114,500 settled in Haifa; in 2005, 46,900 immigrants lived in Tel Avivand 65,700 in Haifa. Thus the number of immigrants that lived in Jerusalem in2005 stood at 68% of all immigrants from 1990 and following that had initiallysettled there, more than the percentage of those who had rst settled in Tel Avivand chosen to stay there (40%) or the percentage that stayed in Haifa (57%).
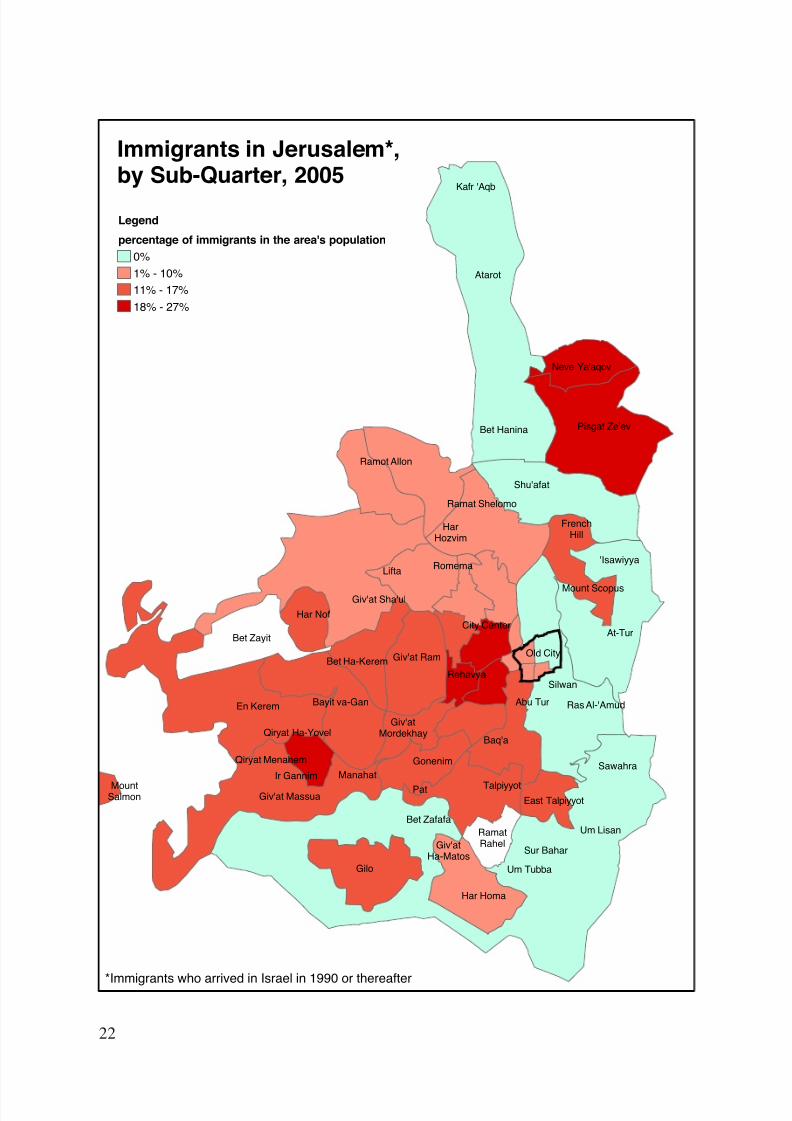
As for the distribution of the immigrant population within the city (those from1990 onward), the neighborhoods with the greatest concentrations of immigrantsare: Pisgat Ze'ev – 7,900 immigrants, 19% of the neighborhood's population;
Neve Ya'akov -- 5,500 immigrants, 27% of the neighborhood's population; Gilo – 3,300 immigrants, 12% of the population; and Gonenim (Katamonim) – 3,200immigrants, comprising 15% of the neighborhood's population.
Initial Settlement of Immigrants in Jerusalem, 1987 - 2006
1 4
, 0 6 0
7 , 0
2 0
5 , 2 4 0
5 , 0
8 0
4 , 4
7 0
4 , 0
0 0
3 , 7 3 0
3 , 9
4 0
4 , 4 8 0
3 , 6
6 0
2 , 5
0 0
1 3
, 1 7 0
2 , 5
0 0
2 , 3
1 0
2 , 4
9 0
2 , 6
3 0
2 , 9
5 0
3 , 1
0 0
2 , 8
8 0
2 , 6
0 0
0
5,000
10,000
15,000
1 9 8 7
1 9 8 8
1 9 8 9
1 9 9 0
1 9 9 1
1 9 9 2
1 9 9 3
1 9 9 4
1 9 9 5
1 9 9 6
1 9 9 7
1 9 9 8
1 9 9 9
2 0 0 0
2 0 0 1
2 0 0 2
2 0 0 3
2 0 0 4
2 0 0 5
2 0 0 6
I m m
i g r a n
t s
8/7/2019 Jerusalem - Facts and Trends 2005-2006
http://slidepdf.com/reader/full/jerusalem-facts-and-trends-2005-2006 22/72
22
Qiryat Menahem
Giv'atHa-Matos
Giv'at Sha'ul
PatIr Gannim
Giv'atMordekhay
FrenchHill
Giv'at Ram
City Center
Silwan
Lifta
Ramat Shelomo
East Talpiyyot
Ras Al-'Amud
Um Lisan
Sur Bahar
Manahat
Talpiyyot
Qiryat Ha-Yovel
Bet Zafafa
Abu TurBayit va-Gan
Kafr 'Aqb
Har Homa
Giv'at Massua
Sawahra
'Isawiyya
En Kerem
Um Tubba
MountSalmon
Gilo
Baq'a
Gonenim
HarHozvim
Rehavya
RamatRahel
Atarot
Neve Ya'aqov
Bet Hanina Pisgat Ze'ev
Shu'afat
Ramot Allon
Mount Scopus
At-Tur
Old City
Romema
Har Nof
Bet Zayit
Bet Ha-Kerem
Legend
percentage of immigrants in the area's population0%1% - 10%11% - 17%18% - 27%
Immigrants in Jerusalem*,by Sub-Quarter, 2005
*Immigrants who arrived in Israel in 1990 or thereafter
8/7/2019 Jerusalem - Facts and Trends 2005-2006
http://slidepdf.com/reader/full/jerusalem-facts-and-trends-2005-2006 23/72
23
Migration Between Settlements
In 2006 17,300 residents of Jerusalem left the city to relocate to other places in
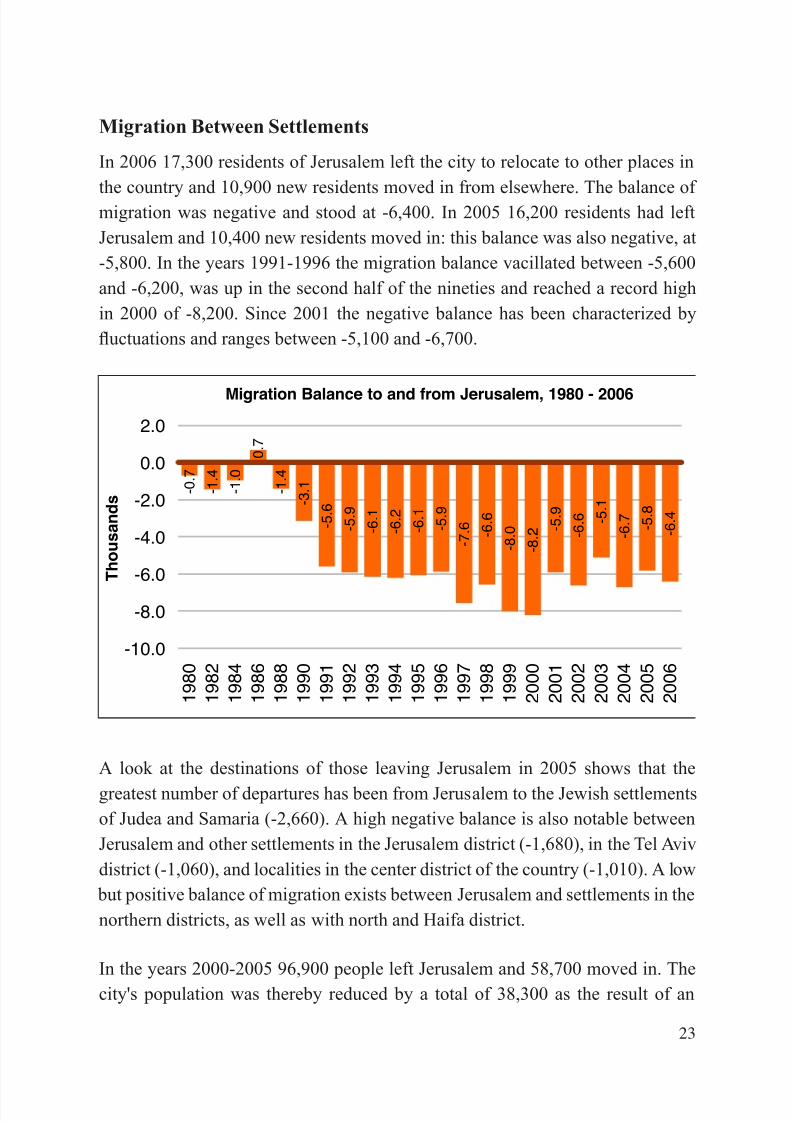
the country and 10,900 new residents moved in from elsewhere. The balance of migration was negative and stood at -6,400. In 2005 16,200 residents had leftJerusalem and 10,400 new residents moved in: this balance was also negative, at-5,800. In the years 1991-1996 the migration balance vacillated between -5,600and -6,200, was up in the second half of the nineties and reached a record highin 2000 of -8,200. Since 2001 the negative balance has been characterized by
uctuations and ranges between -5,100 and -6,700.
A look at the destinations of those leaving Jerusalem in 2005 shows that thegreatest number of departures has been from Jerusalem to the Jewish settlementsof Judea and Samaria (-2,660). A high negative balance is also notable betweenJerusalem and other settlements in the Jerusalem district (-1,680), in the Tel Avivdistrict (-1,060), and localities in the center district of the country (-1,010). A low
but positive balance of migration exists between Jerusalem and settlements in thenorthern districts, as well as with north and Haifa district.
In the years 2000-2005 96,900 people left Jerusalem and 58,700 moved in. Thecity's population was thereby reduced by a total of 38,300 as the result of an
Migration Balance to and from Jerusalem, 1980 - 2006
- 0 . 7
- 1 . 4
- 1 . 0
0 . 7
- 1 . 4
- 3 . 1
- 5 . 6
- 5 . 9
- 6 . 1
- 6 . 2
- 6 . 1
- 5 . 9
- 7 . 6 - 6
. 6
- 8 . 0
- 8 . 2 - 5
. 9
- 6 . 6 - 5
. 1
- 6 . 7
- 5 . 8
- 6 . 4
-10.0
-8.0
-6.0
-4.0
-2.0
0.0
2.0
1 9 8 0
1 9 8 2
1 9 8 4
1 9 8 6
1 9 8 8
1 9 9 0
1 9 9 1
1 9 9 2
1 9 9 3
1 9 9 4
1 9 9 5
1 9 9 6
1 9 9 7
1 9 9 8
1 9 9 9
2 0 0 0
2 0 0 1
2 0 0 2
2 0 0 3
2 0 0 4
2 0 0 5
2 0 0 6
T h o u s a n
d s
8/7/2019 Jerusalem - Facts and Trends 2005-2006
http://slidepdf.com/reader/full/jerusalem-facts-and-trends-2005-2006 24/72
24
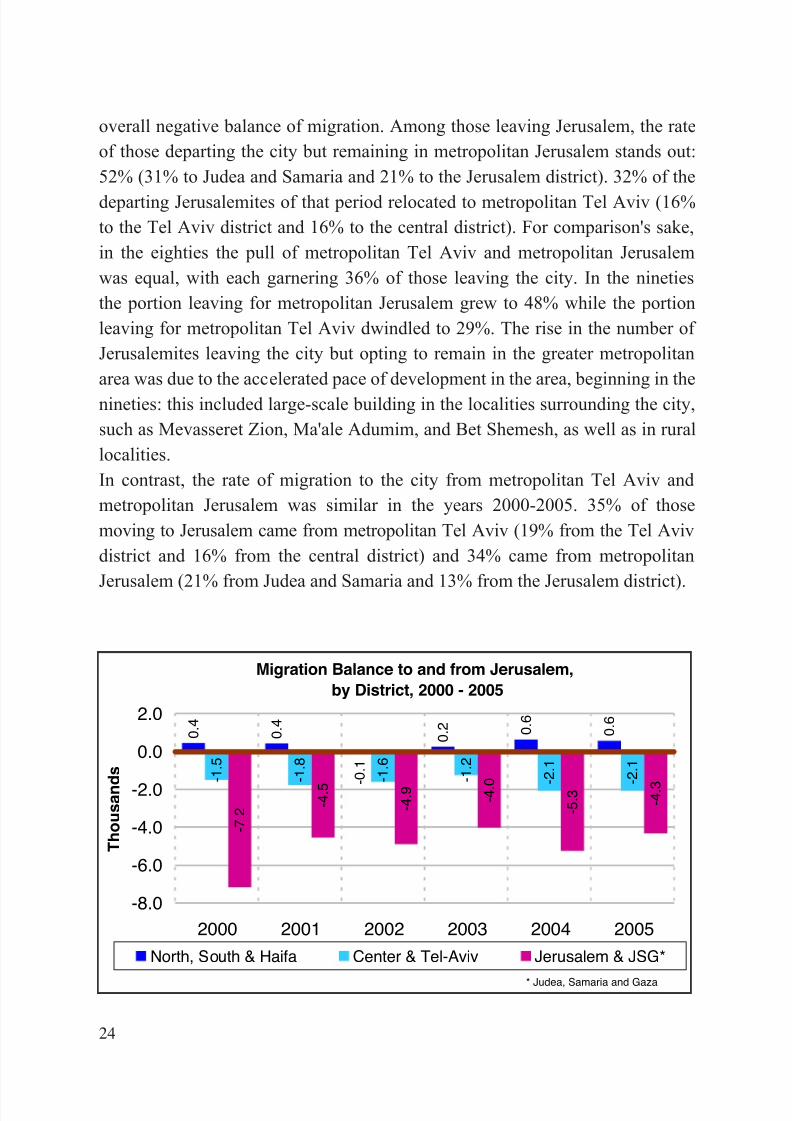
overall negative balance of migration. Among those leaving Jerusalem, the rateof those departing the city but remaining in metropolitan Jerusalem stands out:52% (31% to Judea and Samaria and 21% to the Jerusalem district). 32% of thedeparting Jerusalemites of that period relocated to metropolitan Tel Aviv (16%to the Tel Aviv district and 16% to the central district). For comparison's sake,in the eighties the pull of metropolitan Tel Aviv and metropolitan Jerusalemwas equal, with each garnering 36% of those leaving the city. In the ninetiesthe portion leaving for metropolitan Jerusalem grew to 48% while the portionleaving for metropolitan Tel Aviv dwindled to 29%. The rise in the number of Jerusalemites leaving the city but opting to remain in the greater metropolitanarea was due to the accelerated pace of development in the area, beginning in thenineties: this included large-scale building in the localities surrounding the city,such as Mevasseret Zion, Ma'ale Adumim, and Bet Shemesh, as well as in rurallocalities.In contrast, the rate of migration to the city from metropolitan Tel Aviv andmetropolitan Jerusalem was similar in the years 2000-2005. 35% of thosemoving to Jerusalem came from metropolitan Tel Aviv (19% from the Tel Avivdistrict and 16% from the central district) and 34% came from metropolitan
Jerusalem (21% from Judea and Samaria and 13% from the Jerusalem district).
Migration Balance to and from Jerusalem,by District, 2000 - 2005
0 . 4
0 . 4
- 0 . 1
0 . 2 0
. 6 0
. 6
- 1 . 5
- 1 . 8
- 1 . 6
- 1 . 2
- 2 . 1
- 2 . 1
- 7 . 2
- 4 . 5 - 4 . 9 - 4 .
0
- 5 . 3 - 4 . 3
-8.0
-6.0
-4.0
-2.0
0.0
2.0
2000 2001 2002 2003 2004 2005
T h o u s a n
d s
North, South & Haifa Center & Tel-Aviv Jerusalem & JSG*
* Judea, Samaria and Gaza
8/7/2019 Jerusalem - Facts and Trends 2005-2006
http://slidepdf.com/reader/full/jerusalem-facts-and-trends-2005-2006 25/72
25
The localities that drew the greatest number of former Jerusalem residents in2005 were: Tel Aviv (1,610), Bet Shemesh (1,440), Ma'ale Adumim (1,110),Modi'in-Maccabim-Reut (1,050), and Beitar Illit (880). The localities from whomJerusalem drew the greatest number of former residents were: Bnei Brak (610),Tel Aviv (600), Bet Shemesh (550), Ma'ale Adumim (430), and Mevasseret Zion(410).
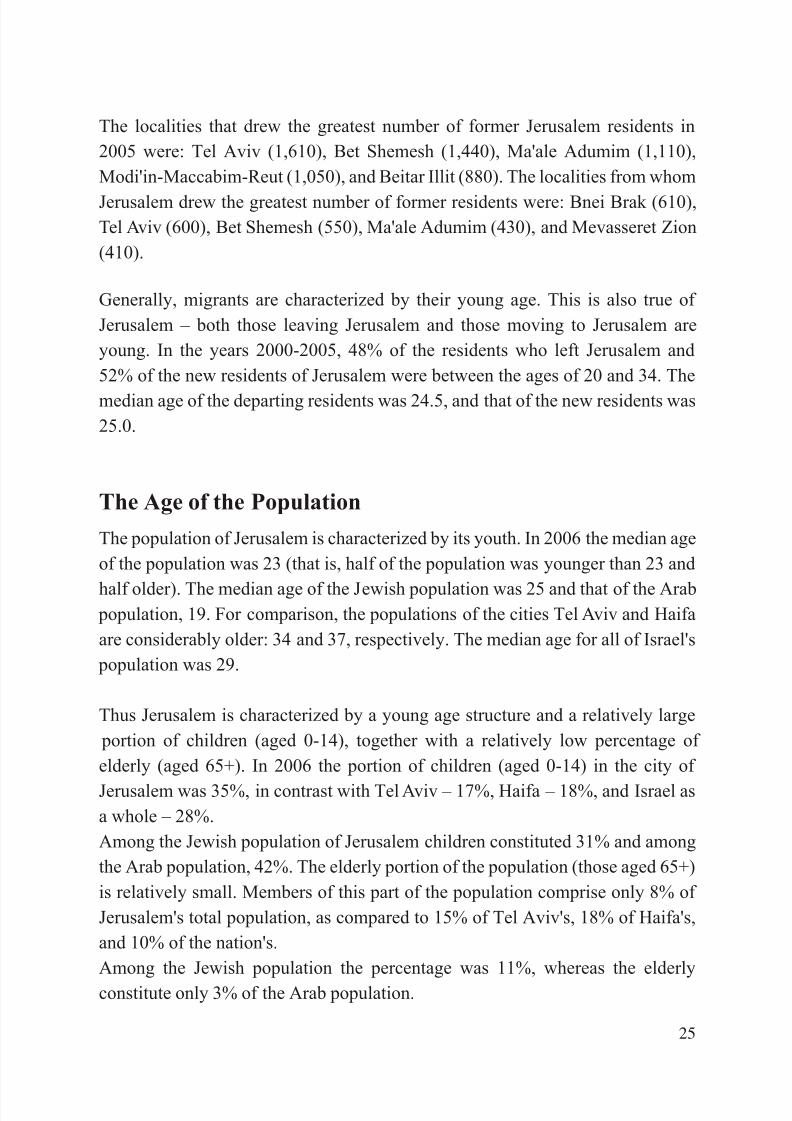
Generally, migrants are characterized by their young age. This is also true of Jerusalem – both those leaving Jerusalem and those moving to Jerusalem areyoung. In the years 2000-2005, 48% of the residents who left Jerusalem and52% of the new residents of Jerusalem were between the ages of 20 and 34. Themedian age of the departing residents was 24.5, and that of the new residents was25.0.
The Age of the Population
The population of Jerusalem is characterized by its youth. In 2006 the median ageof the population was 23 (that is, half of the population was younger than 23 and
half older). The median age of the Jewish population was 25 and that of the Arab population, 19. For comparison, the populations of the cities Tel Aviv and Haifaare considerably older: 34 and 37, respectively. The median age for all of Israel's
population was 29.
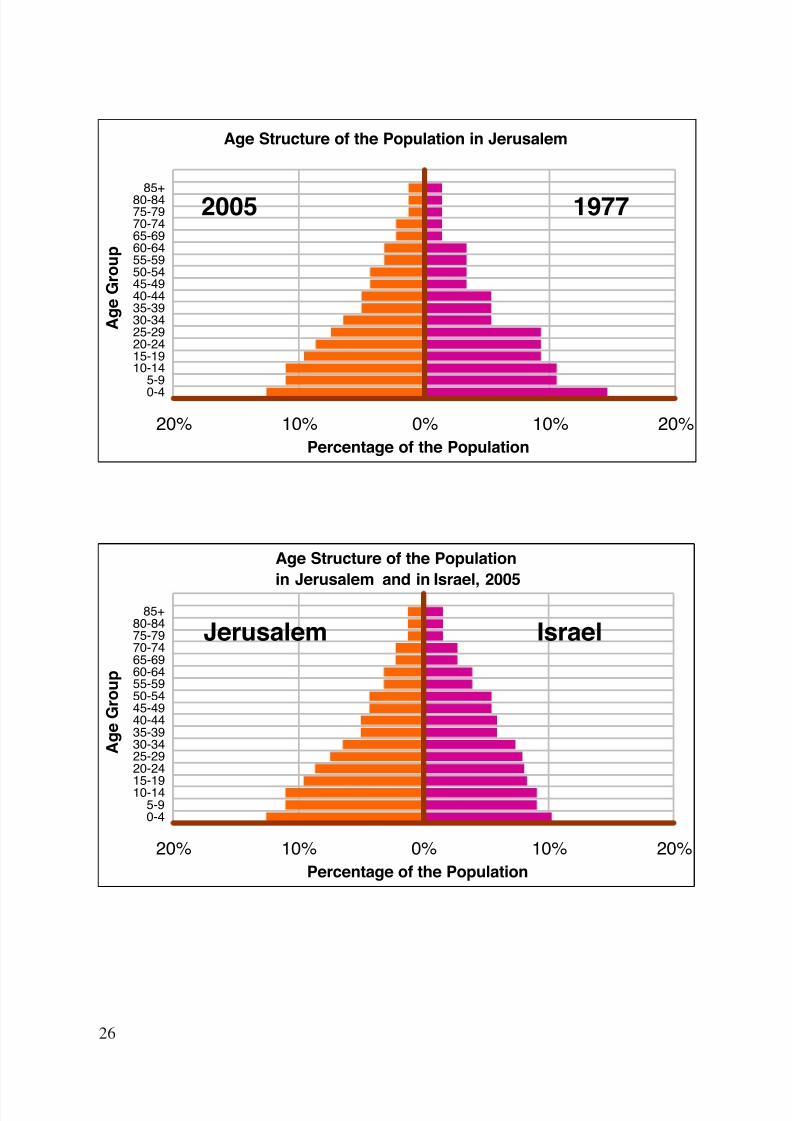
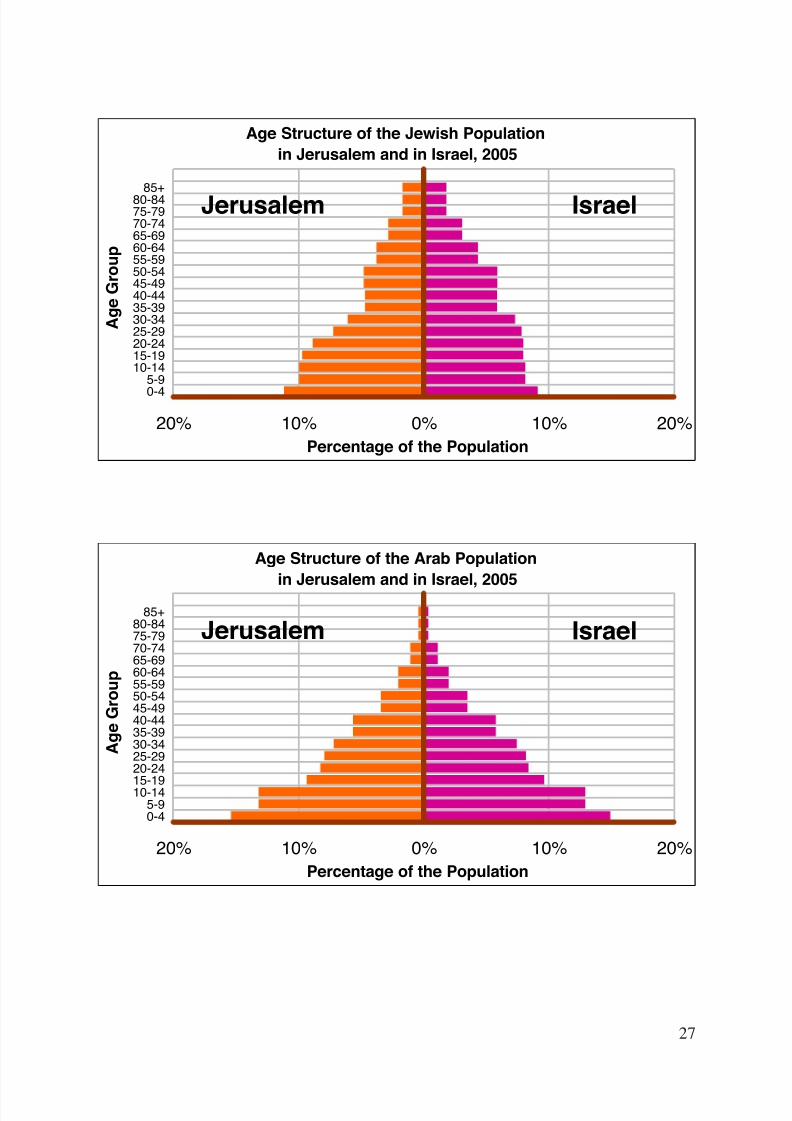
Thus Jerusalem is characterized by a young age structure and a relatively large portion of children (aged 0-14), together with a relatively low percentage of elderly (aged 65+). In 2006 the portion of children (aged 0-14) in the city of
Jerusalem was 35%, in contrast with Tel Aviv – 17%, Haifa – 18%, and Israel asa whole – 28%.Among the Jewish population of Jerusalem children constituted 31% and amongthe Arab population, 42%. The elderly portion of the population (those aged 65+)is relatively small. Members of this part of the population comprise only 8% of Jerusalem's total population, as compared to 15% of Tel Aviv's, 18% of Haifa's,and 10% of the nation's.Among the Jewish population the percentage was 11%, whereas the elderlyconstitute only 3% of the Arab population.
8/7/2019 Jerusalem - Facts and Trends 2005-2006
http://slidepdf.com/reader/full/jerusalem-facts-and-trends-2005-2006 26/72
26
Age Structure of the Population in Jerusalem
20% 10% 0% 10% 20%
0-45-9
10-1415-1920-2425-2930-3435-3940-4445-4950-5455-5960-6465-6970-7475-7980-84
85+
A g e
G r o u p
Percentage of the Population
19772005
Age Structure of the Populationin Jerusalem and in Israel, 2005
20% 10% 0% 10% 20%
0-45-9
10-1415-19
20-2425-2930-3435-3940-4445-4950-5455-5960-6465-6970-7475-7980-84
85+
A g e
G r o u p
Percentage of the Population
IsraelJerusalem
8/7/2019 Jerusalem - Facts and Trends 2005-2006
http://slidepdf.com/reader/full/jerusalem-facts-and-trends-2005-2006 27/72
2
Age Structure of the Jewish Populationin Jerusalem and in Israel, 2005
20% 10% 0% 10% 20%0-45-9
10-1415-1920-2425-2930-3435-3940-4445-4950-5455-5960-6465-6970-7475-7980-84
85+
A g e
G r o u p
Percentage of the Population
IsraelJerusalem
Age Structure of the Arab Populationin Jerusalem and in Israel, 2005
20% 10% 0% 10% 20%
0-45-9
10-1415-19
20-2425-2930-3435-3940-4445-4950-5455-5960-6465-6970-7475-7980-84
85+
A g e
G r o u p
Percentage of the Population
IsraelJerusalem
8/7/2019 Jerusalem - Facts and Trends 2005-2006
http://slidepdf.com/reader/full/jerusalem-facts-and-trends-2005-2006 28/72
28
Age Structure of the Population in Ma'ale Adumimand in Mevasseret Zion, 2005
20% 10% 0% 10% 20%
0-45-9
10-1415-19
20-2425-2930-3435-3940-4445-4950-5455-5960-6465-6970-7475-7980-84
85+
A g e
G r o u p
Percentage of the Population
MevasseretZion
Ma'aleAdumim
Age Structure of the Population in Jerusalem,by Population Group, 2005
20% 10% 0% 10% 20%
0-45-9
10-1415-1920-2425-2930-3435-3940-4445-4950-5455-5960-6465-6970-7475-7980-84
85+
A g e
G r o u p
Percentage of the Population
JewishPopulation
ArabPopulation
8/7/2019 Jerusalem - Facts and Trends 2005-2006
http://slidepdf.com/reader/full/jerusalem-facts-and-trends-2005-2006 29/72
2
Age Structure of the Population in Haifa and in Tel-Aviv, 2005
20% 10% 0% 10% 20%
0-45-9
10-1415-1920-2425-2930-3435-3940-4445-4950-5455-5960-6465-6970-7475-7980-84
85+
A g e
G r o u p
Percentage of the Population
Tel-AvivHaifa
Age Structure of the Population in Beitar Illitand in Modi'in-Maccabim-Re'ut, 2005
30% 20% 10% 0% 10% 20% 30%
0-45-9
10-1415-19
20-2425-2930-3435-3940-4445-4950-5455-5960-6465-6970-7475-7980-84
85+
A g e
G r o u p
Percentage of the Population
Modi'in -Maccabim - Re'ut
BeitarIllit
8/7/2019 Jerusalem - Facts and Trends 2005-2006
http://slidepdf.com/reader/full/jerusalem-facts-and-trends-2005-2006 30/72
30
The Ultra-Orthodox Jewish population 6 is characterized by its especiallyyoung age. In this segment of the population children (aged 0-14) comprise44%, compared with 23% among the general Jewish population (religiousand secular). The percentage of elderly (aged 65+) among the Ultra-Orthodox
population was 6%, compared with 13% among the general Jewish population.The Muslim Arab population is also characterized by its youth. In this segment of the population children (aged 0-14) comprise 43%, compared with 21% amongthe Christian Arab population. The percentage of elderly (aged 65+) among theMuslim Arab population is 3%, compared with 13% among the Christian Arab
population.
Population of Jerusalem by Age, 2006
Median ageAged 65+Aged 0-14
238%35%Total Population
2511%31%Jewish Population
193%42%Arab Population
186%44%Ultra-Orthodox Jewish Population
193%43%Muslim-Arab Population
3213%23%General Jewish Population
3413%21%Christian-Arab Population
4117%16% Non-Arab Christian Population
In 2005, in neighborhoods with a general Jewish population (including bothreligious and secular), those with the lowest median age are Morasha (Musrara)(20), Har Homa (22), and Givat Masoua (24). The neighborhoods with the highestmedian ages are Kiryat Wolfson (66), Neve Shaanan, Nayot, and Neve Grannot(together) (48), and Talbiyeh (47).Among the Ultra-Orthodox neighborhoods, those with the lowest median agesare Ramat Shlomo and Kiryat Kaminetz in Neve Ya'akov (14), and Mea Shearim
6
The Jewish population that lives in neighborhoods in which most of the residents are Ultra-Orthodox.
8/7/2019 Jerusalem - Facts and Trends 2005-2006
http://slidepdf.com/reader/full/jerusalem-facts-and-trends-2005-2006 31/72
31
Qiryat Menahem
Giv'atHa-Matos
Giv'at Sha'ul
PatIr Gannim
Giv'atMordekhay
FrenchHill
Giv'at Ram
City Center
Silwan
Ramat Shelomo
East Talpiyyot
Ras Al-'Amud
Um Lisan
Sur Bahar
ManahatTalpiyyot
Qiryat Ha-Yovel
Bet Zafafa
Abu TurBayit va-Gan
Kafr 'Aqb
Har Homa
Giv'at Massua
Sawahra
'Isawiyya
En Kerem
Um Tubba
MountSalmon
Gilo
Baq'aGonenim
Rehavya
RamatRahel
Atarot
Neve Ya'aqov
Bet HaninaPisgat Ze'ev
Shu'afat
Ramot Allon
Mount Scopus
At-Tur
Old City
Romema
Har Nof
Bet Zayit
Bet Ha-Kerem
Legend
median age17 - 1920 - 2526 - 3435 - 43
Median Age and Age Structurein Jerusalem,
by Sub-Quarter, 2005
Moslem Qu.Christian Qu.
Armenian Qu.Jewish Qu
Old City
low high
Age Structure
children
elderly
percentageof population
8/7/2019 Jerusalem - Facts and Trends 2005-2006
http://slidepdf.com/reader/full/jerusalem-facts-and-trends-2005-2006 32/72
32
Qiryat Menahem
Giv'atHa-Matos
Giv'at Sha'ul
Pat
Ir Gannim
Giv'atMordekhay
FrenchHill
Giv'at Ram
City Center
Silwan
Lifta
Ramat Shelomo
East Talpiyyot
Ras Al-'Amud
Um Lisan
Sur Bahar
Manahat
Talpiyyot
Qiryat Ha-Yovel
Bet Zafafa
Abu TurBayit va-Gan
Kafr 'Aqb
Har Homa
Giv'at Massua
Sawahra
'Isawiyya
En Kerem
Um Tubba
MountSalmon
Gilo
Baq'a
Gonenim
HarHozvim
Rehavya
RamatRahel
Atarot
Neve Ya'aqov
Bet Hanina Pisgat Ze'ev
Shu'afat
Ramot Allon
Mount Scopus
At-Tur
Old City
Romema
Har Nof
Bet Zayit
Bet Ha-Kerem
Legend36% - 94%
26% - 35%
19% - 25%
10% - 18%
area of sparse settlementor lacking statistical data
Young People, Aged 20-34,as a Percentage
of the Total Populationof Statistical Area, 2005
8/7/2019 Jerusalem - Facts and Trends 2005-2006
http://slidepdf.com/reader/full/jerusalem-facts-and-trends-2005-2006 33/72
33
(15). The neighborhoods with the highest median ages are Shaarei Hesed (31),Knesset and Batei Broyda (24).Among the Arab neighborhoods, those with the lowest median ages are Ras Al-Amud and Wadi Kadum (14), Silwan and Wadi Joz (15). The neighborhoods withthe highest median ages are Bab A-Zahara and the American Colony (34), theChristian Quarter (32) and the Armenian Quarter (28).
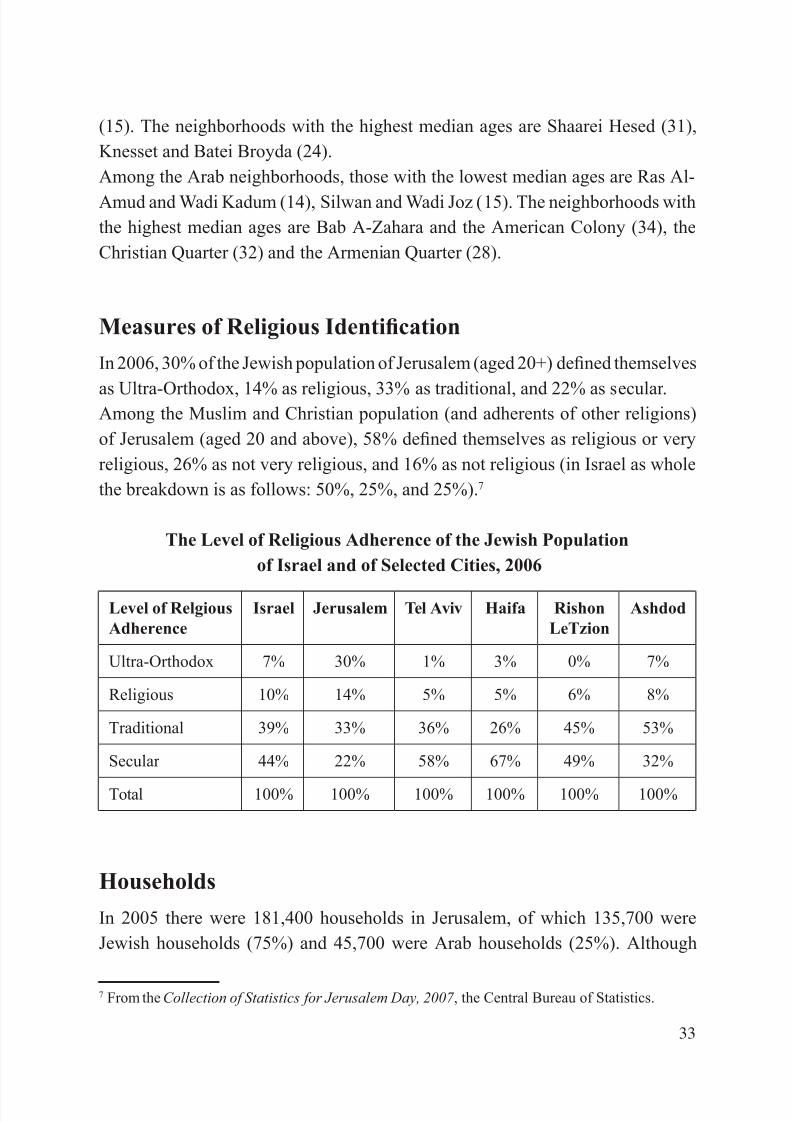
Measures of Religious Identi cation
In 2006, 30% of the Jewish population of Jerusalem (aged 20+) de ned themselves
as Ultra-Orthodox, 14% as religious, 33% as traditional, and 22% as secular.Among the Muslim and Christian population (and adherents of other religions)of Jerusalem (aged 20 and above), 58% de ned themselves as religious or veryreligious, 26% as not very religious, and 16% as not religious (in Israel as wholethe breakdown is as follows: 50%, 25%, and 25%). 7
The Level of Religious Adherence of the Jewish Populationof Israel and of Selected Cities, 2006
AshdodRishonLeTzion
HaifaTel AvivJerusalemIsraelLevel of RelgiousAdherence
7%0%3%1%30%7%Ultra-Orthodox
8%6%5%5%14%10%Religious
53%45%26%36%33%39%Traditional
32%49%67%58%22%44%Secular
100%100%100%100%100%100%Total
Households
In 2005 there were 181,400 households in Jerusalem, of which 135,700 wereJewish households (75%) and 45,700 were Arab households (25%). Although
7 From the Collection of Statistics for Jerusalem Day, 2007 , the Central Bureau of Statistics.
8/7/2019 Jerusalem - Facts and Trends 2005-2006
http://slidepdf.com/reader/full/jerusalem-facts-and-trends-2005-2006 34/72
34
the Jewish (and other) population constituted only 66% of the city's population,its portion of the households was larger (75%) due to the tendency of Jewishhouseholds to include a smaller number of people than Arab ones. The averagenumber of people in a household (including single person households) was 3.3among the Jewish population as opposed to 5.2 among the Arab population.21% of the Jewish households were of single people, compared to only 4%among the Arab population. At the other extreme, households of six and more
people constituted only 14% of the Jewish households but 46% of all the Arabhouseholds.
A signi cant difference exists between the number of people in Jewish householdsin Jerusalem and that in Tel Aviv and Haifa. In 2005 17% of the households inJerusalem were comprised of only one person, as compared with 37% in Tel Avivand 25% in Haifa. In Jerusalem 22% of the households were comprised of six or more people, compared with 4% in Haifa and only 2% in Tel Aviv.
The Jewish population of Jerusalem is characterized by large households ascompared with the Jewish population in Israel as a whole or in other large cities.
In 2005 the average-sized household (including those of one person only) amongthe Jewish population in Jerusalem was 3.3, compared with 3.1 in Israel as awhole, 2.6 in Haifa and 2.2 in Tel Aviv.
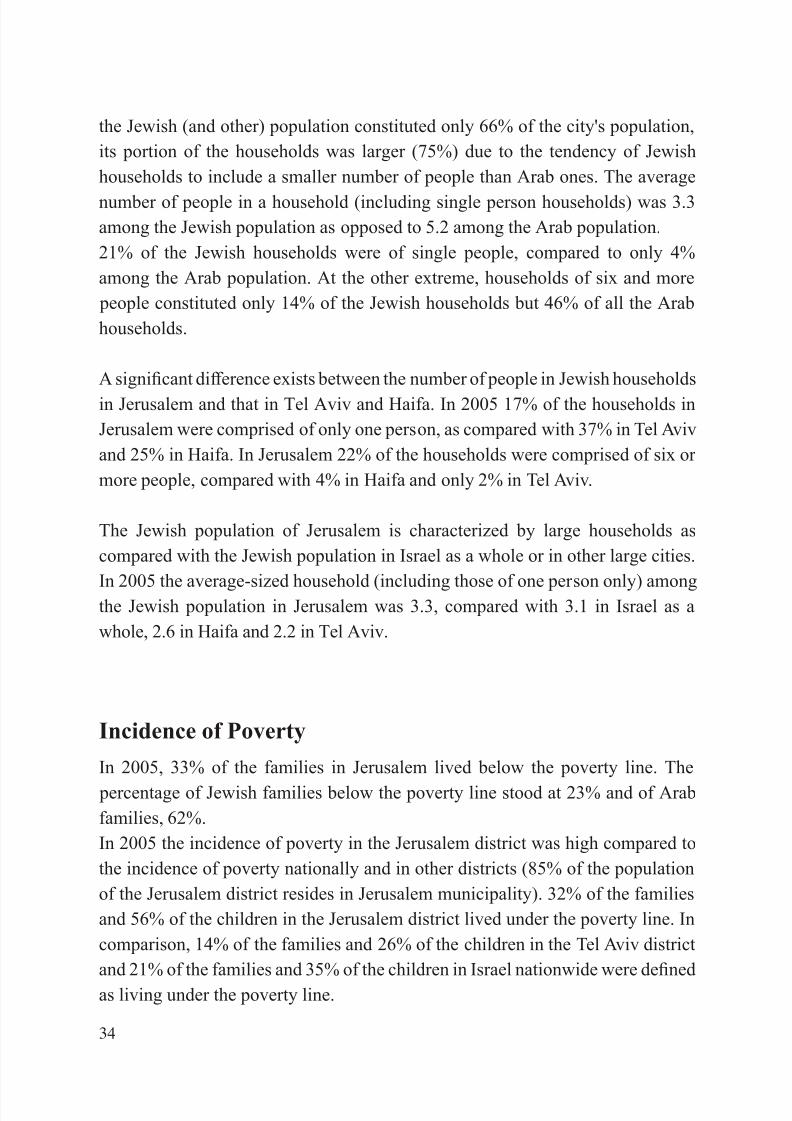
Incidence of Poverty
In 2005, 33% of the families in Jerusalem lived below the poverty line. The percentage of Jewish families below the poverty line stood at 23% and of Arabfamilies, 62%.In 2005 the incidence of poverty in the Jerusalem district was high compared tothe incidence of poverty nationally and in other districts (85% of the populationof the Jerusalem district resides in Jerusalem municipality). 32% of the familiesand 56% of the children in the Jerusalem district lived under the poverty line. Incomparison, 14% of the families and 26% of the children in the Tel Aviv districtand 21% of the families and 35% of the children in Israel nationwide were de nedas living under the poverty line.
8/7/2019 Jerusalem - Facts and Trends 2005-2006
http://slidepdf.com/reader/full/jerusalem-facts-and-trends-2005-2006 35/72
35
The incidence of poverty among the Arab population of the Jerusalem districtwas signi cantly higher than that of the Jewish population of the district. 62% of the families and 76% of the children among the Arab population lived below the
poverty line, compared with 23% of the families and 44% of the children of theJewish population.
Socio-economic status
Another indicator that sheds light on the characteristics of the population in theregional districts is a measure of socio-economic status. This measurement iscalculated by the Central Bureau of Statistics and takes into account social andeconomic factors from different elds, including demographics, standard of living, education, occupation, unemployment, and pensions.In order to prepare the indicator the local councils were grouped into ten clusters.Cluster 1 includes the councils whose residents live at the lowest socio-economiclevel and cluster 10 those with the highest. In 2003 Jerusalem was categorizedas belonging to cluster 4, Haifa and Rishon LeZion to cluster 7, with Tel Aviv incluster 8. Between 1999 and 2003 Jerusalem fell from cluster 5 to 4.
Extent of Poverty, by District, 2005
67%
30%
42%
32%
25%19%
16%
12%
0% 20% 40% 60% 80%
Arabs
Jews
Thereof:
Jerusalem
North
SouthHaifa
Tel-Aviv
Central
D i s t r i c t
Percentage of Population Below Poverty line
8/7/2019 Jerusalem - Facts and Trends 2005-2006
http://slidepdf.com/reader/full/jerusalem-facts-and-trends-2005-2006 36/72
36
The population of metropolitan Jerusalem is heterogeneous in terms of socio-economic status when taken as a whole, but homogeneous on the level of individual localities. The population of the Ultra-Orthodox localities and theArab locality of Abu Ghosh are characterized by a very low socio-economiclevel. Beitar Illit, for example, an Ultra-Orthodox city, belongs to cluster 1 – thecategory of lowest levels. Kiryat Yearim, also Ultra-Orthodox, was categorizedas cluster 2, and Abu Ghosh as cluster 3. Bet Shemesh (a quarter of whoseresidents are Ultra-Orthodox) was cluster 4. Cluster 6 included Ma'ale Adumim,Efrata and the regional council of Mate Yehuda. Rating highest in the area wereMevasseret Zion in cluster 8 and Har Adar in cluster 9.
Ownership of Consumer GoodsAnother indicator of the socio-economic status of Jerusalem's population is therate of household ownership of consumer goods (primary goods): in 2005, 10%of Jerusalem's households owned two or more cars, compared to 15% in Israelas a whole, 13% in Tel Aviv and 16% in Haifa. 60% of Jerusalem's householdsowned computers, as compared with 62% nationwide, 68% in Tel Aviv and57% in Haifa. 34% of the households in Jerusalem had home internet access,as compared to 49% over all of Israel, 58% in Tel Aviv and 47% in Haifa. Only77% of the homes in Jerusalem had televisions; this low rate is the result of the tendency of the Ultra-Orthodox not to have televisions in their homes andnot make use of the internet. In Israel as a whole, 92% of the households havetelevisions, with 95% in Tel Aviv and 91% in Haifa. The rate of cable televisionin Jerusalem is also very low – 40%, compared with 69% in Israel, 77% in TelAviv and 70% in Haifa.
Monthly Consumer Expenditures
In 2005 the average monthly consumer expenditures of a Jerusalem householdstood at 10,911 IS. In Israel the monthly expenditure was 10,816 IS and in Tel Aviv11,172 IS. The major type of expenditure was housing (23%), then transportationand communications (19%), food (17%), education, culture and entertainment(12%). The distribution of expenditures in Tel Aviv was similar – rst, housing
8/7/2019 Jerusalem - Facts and Trends 2005-2006
http://slidepdf.com/reader/full/jerusalem-facts-and-trends-2005-2006 37/72
3
(28%), transportation and communications (19%), food (15%), and education,culture, and entertainment (13%).
Housing density
In 2005 the average housing density in Jerusalem was 1.0 person per room amongthe Jewish population and 1.8 person per room among the Arab population. The
population density among Jews in Jerusalem (1 person per room) was higher thanthat in Tel Aviv (0.7 person per room) or in Haifa (0.8 person per room).
Over the years there has been a decrease in the housing density among Arabs inJerusalem: in 1990 it was 2.3 person per room, falling by 2005 to 1.8. Over thesame fteen year period Jewish population density fell only slightly, from 1.1
person per room to 1.0.
8/7/2019 Jerusalem - Facts and Trends 2005-2006
http://slidepdf.com/reader/full/jerusalem-facts-and-trends-2005-2006 38/72
38
- Employment 8 -
Rate of Participation in the Civilian Labor Force
In 2006 the rate of participation in the civilian labor force (the percentage of the employed and the unemployed actively seeking employment among the
population over age 15) was 45% in Jerusalem. This rate is low compared to therate of participation in the labor force in all of Israel (56%), in Tel Aviv (64%),or in Haifa (56%). The rate of participation in the labor force among the Jewish
population of Jerusalem was 50% (compared to 59% among the Jewish populationin Israel) and among the Arab population 35% (compared with 43% among allof Israel's Arab population). The low rate of participation in the labor force inJerusalem is largely the result of the low rates of employment of Ultra-Orthodoxmen and of Arab women.
The percentage of the unemployed (people who did not work at all during therelevant week and actively sought work over the previous four weeks) in Jerusalem
in 2006 was 9% (8% in Israel overall) – 9% among the Jewish population (8%among the Jewish population of all of Israel) and 12% among the Arab population(11% among the Arab population in all of Israel).
In 2005 there were employed people in 69% of Jerusalem's households, comparedwith 74% in Israel as a whole. Among the Jewish population there were employeesin 69% of the households, whereas among the Arab population there were in71%.
There is a signi cant gap in the participation of men and women in the labor force. In 2006 the rate of participation of men in Jerusalem in the labor force wasonly 52%, compared to 69% in Tel Aviv, 60% in Haifa, and 61% in Israel. Thelow rate of men's participation in the labor force in Jerusalem is attributable to thelow rate of employment of Ultra-Orthodox men.The rate of participation of women in the labor force in Jerusalem was only 39%in 2006, compared with 59% in Tel Aviv, 52% in Haifa, and 50% in Israel. The
8 In this chapter some of the data is for 2005 and some for 2006.
8/7/2019 Jerusalem - Facts and Trends 2005-2006
http://slidepdf.com/reader/full/jerusalem-facts-and-trends-2005-2006 39/72
3
low rate of women's participation in the labor force in Jerusalem is attributable tothe low rate of employment among Arab women.
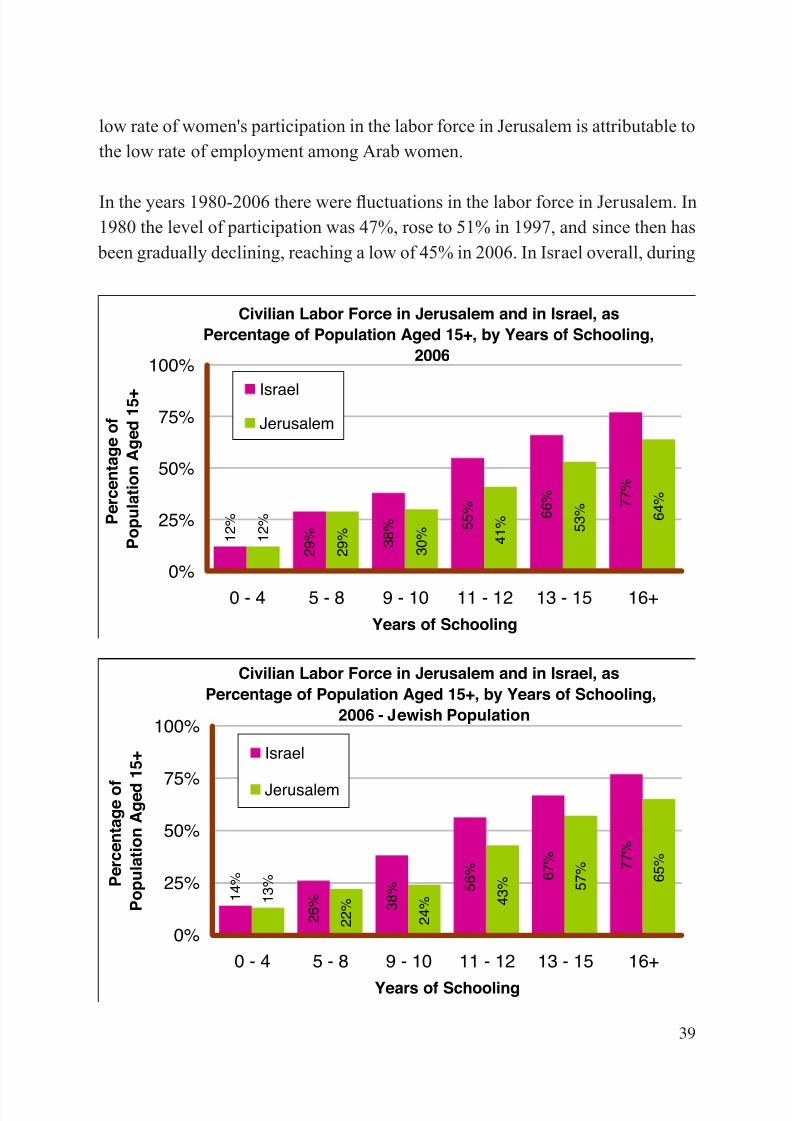
In the years 1980-2006 there were uctuations in the labor force in Jerusalem. In1980 the level of participation was 47%, rose to 51% in 1997, and since then has
been gradually declining, reaching a low of 45% in 2006. In Israel overall, during
Civilian Labor Force in Jerusalem and in Israel, asPercentage of Population Aged 15+, by Years of Schooling,
2006
2 9 % 3
8 % 5
5 % 6
6 % 7
7 %
2 9 %
3 0 % 4
1 % 5
3 % 6
4 %
1 2 %
1 2 %
0%
25%
50%
75%
100%
0 - 4 5 - 8 9 - 10 11 - 12 13 - 15 16+Years of Schooling
P e r c e n
t a g e o
f
P o p u
l a t i o n
A g e d
1 5 + IsraelJerusalem
Civilian Labor Force in Jerusalem and in Israel, asPercentage of Population Aged 15+, by Years of Schooling,
2006 - Jewish Population
2 6 % 3
8 % 5
6 % 6
7 % 7
7 %
2 2 %
2 4 % 4
3 % 5
7 % 6
5 %
1 4 %
1 3 %
0%
25%
50%
75%
100%
0 - 4 5 - 8 9 - 10 11 - 12 13 - 15 16+
Years of Schooling
P e r c e n
t a g e o
f
P o p u
l a t i o n
A g e d
1 5 + Israel
Jerusalem
8/7/2019 Jerusalem - Facts and Trends 2005-2006
http://slidepdf.com/reader/full/jerusalem-facts-and-trends-2005-2006 40/72
40
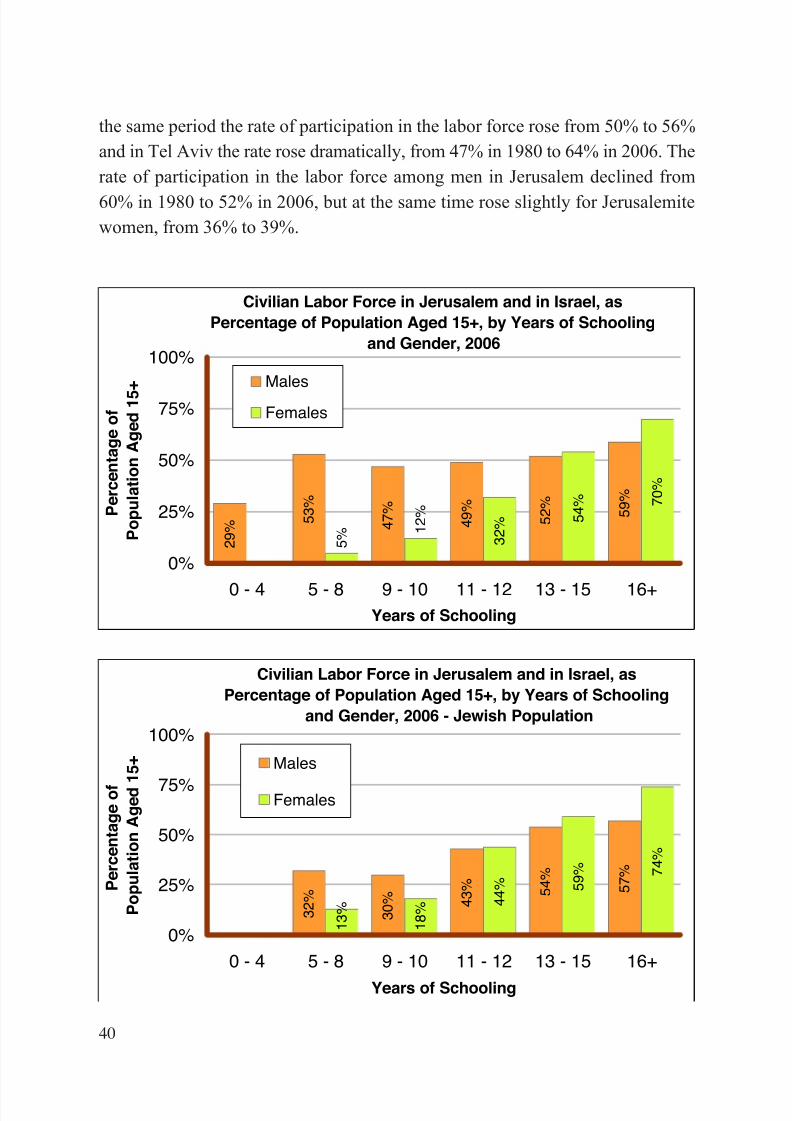
the same period the rate of participation in the labor force rose from 50% to 56%and in Tel Aviv the rate rose dramatically, from 47% in 1980 to 64% in 2006. Therate of participation in the labor force among men in Jerusalem declined from60% in 1980 to 52% in 2006, but at the same time rose slightly for Jerusalemitewomen, from 36% to 39%.
Civilian Labor Force in Jerusalem and in Israel, asPercentage of Population Aged 15+, by Years of Schooling
and Gender, 2006
5 3 %
4 7 %
4 9 %
5 2 %
5 9 %
3 2 % 5
4 % 7
0 %
2 9 %
5 % 1
2 %
0%
25%
50%
75%
100%
0 - 4 5 - 8 9 - 10 11 - 12 13 - 15 16+Years of Schooling
P e r c e n
t a g e o
f
P o p u
l a t i o n
A g e d
1 5 + Males
Females
Civilian Labor Force in Jerusalem and in Israel, asPercentage of Population Aged 15+, by Years of Schooling
and Gender, 2006 - Jewish Population
3 2 %
3 0 % 4
3 % 5
4 %
5 7 %
4 4 % 5
9 % 7
4 %
1 8 %
1 3 %
0%
25%
50%
75%
100%
0 - 4 5 - 8 9 - 10 11 - 12 13 - 15 16+
Years of Schooling
P e r c e n
t a g e o f
P o p u
l a t i o n
A g e d
1 5 + Males
Females
8/7/2019 Jerusalem - Facts and Trends 2005-2006
http://slidepdf.com/reader/full/jerusalem-facts-and-trends-2005-2006 41/72
41
There is a positive correlation between the rate of participation in the labor forceand level of education – as the number of years of education increases, so doesthe rate of participation in the labor force.In Jerusalem in 2006 the participation in the labor force among those with 0-4years of education was 12%, for those with 5-8 years of study, 30%, 11-12 yearsof study, 41%, and for those with 16 or more years of study – 64% participation.Statistics also show that the rates of employment rise with age – up to 54. In 20067% of Jerusalem's 15-17 year-olds were in the labor force, 34% of the 18-24year-olds, 62% of the 25-34 year-olds, and a peak of 65% of 45-54 year-olds. Inthe age group 55-64, participation in the labor force fell to 50% and dwindled to11% among those over 65.
Employment by Economic Branch
In 2006 the number of people employed in Jerusalem stood at 232,600, 9%of all people employed in Israel. In Tel Aviv, by comparison, 352,300 peoplewere employed, 14% of the employed in Israel. The comparison between thenumber of people employed and the size of the city's population re ects the
relatively low level of attraction of Jerusalem to employers and employeesalike. In Jerusalem, the number of people employed is 32% of the total number of residents (232,600 employed versus 733,300 residents). In comparison, thenumber of people employed in Tel Aviv is only slightly lower (92%) than thenumber of its inhabitants – 352,300 employed compared to 384,400 residents; inHaifa, the number of people employed was 60% of the number of all the city'sresidents (158,900 employed, in a city population of 266,300).The city of Tel Aviv acts as a center for the metropolitan area, which encompassesa population of 3.1 million residents, 12% of whom are residents of the city itself;as is Haifa, with 1 million residents, 27% of whom are city residents. Jerusalemserves as a metropolitan center as well, with a total population of 1.7 million people,43% residents of the city. Metropolitan Jerusalem is a bi-national metropolitanarea – Jewish and Arab – but over the past several years ties between the Arabmetropolitan area and the city have weakened and shrunk, due to restrictionsimposed by Israel on the entrance of Palestinians to Jerusalem. Blockades setup at the city entrances and in particular the construction of the separation fencearound the city have severely limited the ability of Palestinians from the West
8/7/2019 Jerusalem - Facts and Trends 2005-2006
http://slidepdf.com/reader/full/jerusalem-facts-and-trends-2005-2006 42/72
42
Bank to gain access to Jerusalem, and thus the connections between Jerusalemand the surrounding Palestinian localities have lessened considerably.
In 2005 90% of the employed Jerusalem residents work in the city in which theylive, as compared to only 76% of the residents of Haifa and 68% of the residentsof Tel Aviv.
Because of Jerusalem's status as the capital of Israel and a governmental andmanagerial center in which many governmental of ces and national institutionsare located, the percentage of public employees is very high. In 2006 48% of those employed in the city were in public service (public management, education,health services, welfare, community, social and personal services) compared with26% in Tel Aviv and 32% of the employed in Israel.In the branches of banking, insurance, and nancing, and in the eld of businessservices, a particularly low level of employment in Jerusalem is clear incomparison with Tel Aviv. 3% of those employed in Jerusalem worked in the
eld of banking, insurance, or nancing and 13% worked in business services.In contrast, the percentages in Tel Aviv were 9% and 24% , respectively, and 3%
and 14% in Israel nationwide.The percentage of Jerusalemites employed in industry was 7%, compared with8% in Tel Aviv and 16% nationally.
In 2006, the economic branches in which the largest numbers of Jewishemployees were employed were: public service (52%), banking, insurance, and
business and nancial services (19%), commerce (9%). The largest numbers of Arab employees were employed in: public service (28%), commerce (17%), and
construction (13%).
Income and Wages
The average gross monthly income 9 for Jerusalem households whose head isemployed was lower than the average income of households in Israel as a whole,
9
Both from salary and from income that is not from work (from assets, property, pensions, or stipends).
8/7/2019 Jerusalem - Facts and Trends 2005-2006
http://slidepdf.com/reader/full/jerusalem-facts-and-trends-2005-2006 43/72
43
or in Tel Aviv, or Haifa. In 2005 the average monthly income for householdswhose head was an employee was 11,419 IS in Jerusalem, compared to 15,918 ISin Tel Aviv, 14,110 IS in Haifa, and 14,014 IS in Israel. Furthermore, the averagenumber of people in a Jerusalem household was higher – 4.2, compared with 2.6in Tel Aviv, 3.0 in Haifa, and 3.7 in Israel.The relatively low average monthly income of the Jerusalem household stemsfrom the characteristics of the population and from the structure of employmentin the city; the low rate of participation in the labor force that characterizes theArab population and the Ultra-Orthodox population has a signi cant effect onthe average income of the city's residents. In addition, almost half of the city'semployees work in the public sector, where salaries are not high, and there is arelatively small number of employees in elds where pay is relatively high (suchas in high-tech companies and nancial services).
The average gross monthly income of Jerusalem households headed by anunemployed person was 4,969 IS, compared with 6,119 IS in Tel Aviv, 5,091 IS inHaifa, and 4,789 IS nationwide. In Jerusalem, the average age of an unemployed
person heading a household was 58, whereas in Tel Aviv it was 65, in Haifa 64,
and in all of Israel, 61.
The average gross monthly salary of a wage-earner in Jerusalem was low incomparison to non-Ultra-Orthodox localities adjacent to it. In 2004 the averagemonthly wage in Jerusalem was 5,567 IS, in Mevasseret Zion 9,206 IS, Tsur Hadassah 9,173 IS, Efrat 7,512, Givat Ze'ev 7,195 IS, in the localities of MateYehuda 6,682 IS and Ma'ale Adumim 6,498 IS. In the Ultra-Orthodox locality of Kiryat Yearim the average salary was 5,039 IS ( relatively high compared to other
Ultra-Orthodox localities), in Bet Shemesh (of which a quarter of the residents areUltra-Orthodox) 4,896 IS, in Kochav Ya'akov 3,397 IS, and in Betar Illit 3,156 IS.In the Arab locality of Abu Ghosh the average salary was 3,639 IS.
An examination of salaries according to gender reveals a considerable gap betweenmen and women's salaries. In 2005 the average gross monthly salary among menin Jerusalem was 7,491 IS, compared with 5,363 IS among Jerusalemite women.Thus men's pay is 40% higher than that of women's. In Tel Aviv and Haifa thegap between men and women's pay is even greater. In Tel Aviv men's average
8/7/2019 Jerusalem - Facts and Trends 2005-2006
http://slidepdf.com/reader/full/jerusalem-facts-and-trends-2005-2006 44/72
44
salary was 10,351 IS, 59% higher than women's – 5,610 IS. In Haifa men's salarywas 66% higher than women's: 9,292 IS versus 6,511 IS, respectively. In Israeloverall men's average salary was 8,575 IS, 58% higher than women's, which was5,419 IS.
Another difference between employees in Jerusalem and their counterparts in TelAviv lies in the difference in the number of hours they work. In 2005, the averagenumber of weekly work hours for a Jerusalem man was 43, compared with 44 inTel Aviv, 45 in Haifa, and 46 in Israel. The average number of weekly work hoursfor women in Jerusalem was 33, compared with 37 in Tel Aviv, 34 in Haifa, and35 nationwide.In 2005 the average gross income per hour among men in Jerusalem was 42 IS,compared with 57 IS in Tel Aviv, 49 IS in Haifa, and 45 IS in Israel. The averagegross income per hour among women in Jerusalem was 40 IS, compared to 42IS in Tel Aviv, 40 IS in Haifa, and 37 IS in Israel overall. It is important to pointout that the differences in monthly pay between men and women and among thedifferent localities are the result of differences in the number of work hours andin the rate of pay per hour.
8/7/2019 Jerusalem - Facts and Trends 2005-2006
http://slidepdf.com/reader/full/jerusalem-facts-and-trends-2005-2006 45/72
45
- Education -
Jerusalem's Educational System
Jerusalem's educational system is the largest, most heterogeneous, and mostcomplex in Israel. This system must provide solutions for a variety of populationswith different needs.There are four major types of schools: state schools, state-religious schools, Ultra-Orthodox schools (which since 1993 are run by a separate department within themunicipality) and Arab schools. The Ultra-Orthodox schools are divided between
talmudei torah and independent schools, which are also divided up amongdifferent hatzerot and communities. Arab schools are divided between municipalschools and non-municipal ones; the latter includes religious schools belongingeither to churches or to the Muslim waqf (religious authorities ) or to other private
bodies. In most of the Arab schools boys and girls are separated.
In the school year 2006/2007 the Jerusalem school system was responsible for 223,345 pupils. Under the Jerusalem Education Authority (JEA), which runs
both the state and the state-religious schools there were 115,204 pupils: 60,138in Hebrew education and 55,066 in Arab education. In the Ultra-Orthodox sector there were 85,937 pupils, constituting 59% of the Hebrew education system. Inthe non-municipal Arab sector (private schools, waqf schools and church schools),there were 21,000 pupils (estimated in 2000/2001).
In the last ve years, the number of pupils in Jerusalem has grown by 9%, from204,457 in 2002/2003 to 223,345 pupils in 2006/2007. The number of pupils inthe Hebrew education for which the Jerusalem Educational Authority (JEA) isresponsible (in state and state-religious schools) has shrunk by 7% (from 64,595to 60,138) while the number of pupils in the Ultra-Orthodox sector has grown by8% (from 79,516 to 85,937). The Arab municipal sector has grown by 40% (from39,229 to 55,066) in the number of pupils.
The most common structure for schools in Jerusalem is a six year one, 1 st to 6 th grade, and 7 th to 12 th grade. However, some of the schools are structured differently,so the gures on the numbers of pupils in 1 st to 6 th grade is different from the
8/7/2019 Jerusalem - Facts and Trends 2005-2006
http://slidepdf.com/reader/full/jerusalem-facts-and-trends-2005-2006 46/72
46
number of children in elementary schools; similarly, there are differences in thenumbers of pupils in grades 7 through 12 and the number of pupils in secondaryschools.In the year 2006/2007 4,155 children were enrolled in compulsory Hebrewkindergartens under the auspices of the JEA, 23,102 pupils were in grades 1-6,and 27,992 pupils were in grades 7-12.In this year the number of pupils in grades 1-6 in Hebrew education was lower than the number of pupils in grades 7-12 by 4,890. This difference indicates thatin the coming years the number of pupils in lower and upper secondary schoolswill continue to drop.Under the auspices of the Ultra-Orthodox educational branch there were 7,883children in compulsory kindergarten (almost twice the number in all the other Hebrew kindergartens), 31,800 pupils in grades 1-6 and 31,845 pupils in grades7-12. From this one may conclude that the number of pupils in the upper andlower secondary schools of the Ultra-Orthodox sector will remain steady in thecoming years.In the Arab municipal sector 4,471 children were enrolled in kindergarten(compulsory and pre-compulsory), 28,777 pupils were in grades 1-6, and 21,818
pupils were in grades 7-12 (more on Arab education in the section devoted to thatsubject).
Hebrew Education
In the school year 2006/2007 147,275 pupils studied in Jerusalem's Hebreweducation system: 61,338 pupils (42%) were enrolled in school run by the JEA
and 85,937 (58%) were enrolled in the Ultra-Orthodox education division. In thisyear the trend continued by which the number of pupils in the Ultra-Orthodoxsector grew and the number of pupils in the state and state-religious schoolsshrank.Up until the year 1997/1998 the number of pupils studying in the Hebreweducation schools of the JEA (69,990) was higher than the number of pupils inthe Ultra-Orthodox schools (66,930). In 1998/1999 the number of pupils in JEAschools (67,160) and the number in Ultra-Orthodox schools (67,730) were aboutthe same. But beginning in the year 1999-2000 the percentage of pupils in Ultra-
8/7/2019 Jerusalem - Facts and Trends 2005-2006
http://slidepdf.com/reader/full/jerusalem-facts-and-trends-2005-2006 47/72
4
Orthodox schools surpassed that of the JEA, and since then the gap between themhas been growing.
The primary reasons for the rise in the number of pupils in the Ultra-Orthodoxschools and the drop in the number of pupils in state and state-religious schoolsare as follows:
1. The age structure of the general Jewish population (religious and secular) ascompared to the younger age structure of the Ultra-Orthodox community;
2. The relatively small number of children among the religious and secular Jewish families as compared to the large number of children in families of
the Ultra-Orthodox community.
An analysis of the trends of change in the number of children according tograde also reveals something of the differences among the educational sectors inJerusalem. Over the last three years (2004/2005 – 2006/2007) there has been a2% decrease in the number of pupils in the JEA's Hebrew schools, from 62,536to 61,338. A separate analysis of the state and state-religious schools shows thatwhile there has been a decline in the number of pupils in the state schools therehas been a slight increase in the number of pupils in the state-religious schools.The number of pupils in the state schools dropped by 5%, from 34,167 to 32,437,while the number enrolled in state-religious schools registered a rise of 1%, from25,341 to 25,720. In the state schools there was a decrease in the number of
pupils in all grades: 1% in the number in kindergarten, 4% in the number in1st-6 th grades, 6% in the number in 7 th-9 th grades, and 7% in the number in 10 th-
12th
grades. In state-religious schools, in contrast, there was 4% growth in thenumber of children in kindergarten and in 1 st-6 th grades, in 7 th-9 th grades there wasdecrease of 2%, and in 10 th-12 th grades the number of pupils remained stable.In Ultra-Orthodox schools over these years there was a 3% rise in the number of
pupils, from 83,268 to 85,937. The highest rate of growth – 7% -- was in grades10-12, with 5% growth in 7 th-9 th grades, 3% growth in kindergartens, and only2% growth in grades 1-6.
8/7/2019 Jerusalem - Facts and Trends 2005-2006
http://slidepdf.com/reader/full/jerusalem-facts-and-trends-2005-2006 48/72
48
Arab Education
In the school year 2006/2007, 76,066 pupils studied in the Arab education system
of Jerusalem, of whom 55,066 studied in the municipal schools.10
The number of pupils in private schools (church, waqf , and other) stood at 21,000 (estimated for 2000/2001). Pupils in Arabic schools constituted 34% of all pupils in Jerusalem'seducational system.In 2006/2007 the distribution of Arab pupils was as follows: 4,355 in kindergarten,28,504 in elementary schools and 21,479 in secondary schools. In schools for special education 677 pupils were studying.
Over the last several years there has been a signi cant increase in the number of pupils in the Arab municipal schools. In the year 2001/2002 the number of
pupils in Arab municipal schools was 33,200, rising to 39,229 in 2002/2003,and by 2006/2007 reached 55,066. From the year 1995/1996 to 2001/2002 therewas a 32% increase in the number of pupils (from 23,390 to 30,989) and from2001/2002 to 2006/2007 there was an increase of 66% in the number of pupils(from 33,200 to 55,066).
There are a number of reasons for the rapid growth in the number of pupils in themunicipals schools, the primary of which are as follows:
1. Economic crisis among the Arab population, which became worse during thetwo Intifadas (uprisings of 1987/1988 and 2000/2002) and made it dif cultfor parents to cover the costs of private schools;
2. An increase in the investments in the physical conditions of the statemunicipal schools, including the construction of new schools and the
expansion of existing ones. The growth in the number of classrooms enabledthe municipal schools to register more pupils;
3. An increase in the investment in education (in addition to the investmentsin physical conditions). Over the course of several years large sums wereinvested in an effort to bring up the standards in the Arab schools to that of theHebrew ones. The investments were in the elds of organization, management,methods of teaching, and other educational aspects, but the curriculum itself
10 Both of cial and recognized non-of cial schools.
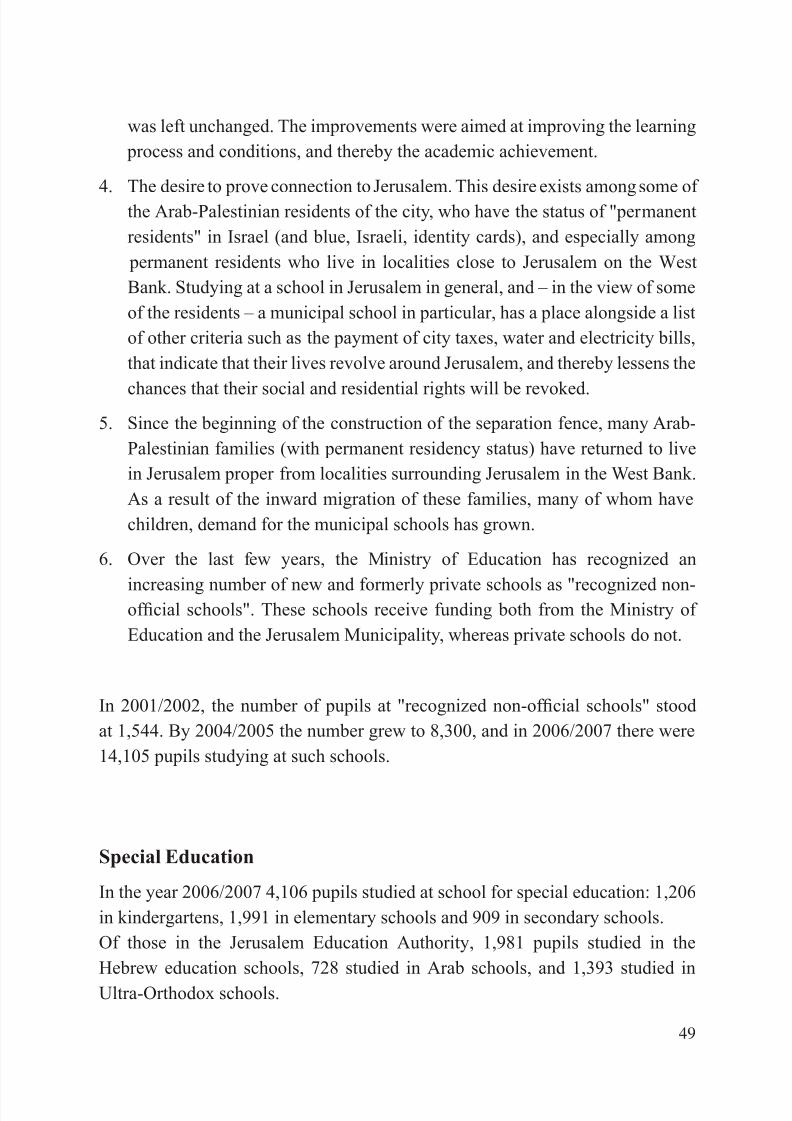
8/7/2019 Jerusalem - Facts and Trends 2005-2006
http://slidepdf.com/reader/full/jerusalem-facts-and-trends-2005-2006 49/72
4
was left unchanged. The improvements were aimed at improving the learning process and conditions, and thereby the academic achievement.
4. The desire to prove connection to Jerusalem. This desire exists among some of the Arab-Palestinian residents of the city, who have the status of "permanentresidents" in Israel (and blue, Israeli, identity cards), and especially among
permanent residents who live in localities close to Jerusalem on the WestBank. Studying at a school in Jerusalem in general, and – in the view of someof the residents – a municipal school in particular, has a place alongside a listof other criteria such as the payment of city taxes, water and electricity bills,that indicate that their lives revolve around Jerusalem, and thereby lessens the
chances that their social and residential rights will be revoked.5. Since the beginning of the construction of the separation fence, many Arab-
Palestinian families (with permanent residency status) have returned to livein Jerusalem proper from localities surrounding Jerusalem in the West Bank.As a result of the inward migration of these families, many of whom havechildren, demand for the municipal schools has grown.
6. Over the last few years, the Ministry of Education has recognized an
increasing number of new and formerly private schools as "recognized non-of cial schools". These schools receive funding both from the Ministry of Education and the Jerusalem Municipality, whereas private schools do not.
In 2001/2002, the number of pupils at "recognized non-of cial schools" stoodat 1,544. By 2004/2005 the number grew to 8,300, and in 2006/2007 there were14,105 pupils studying at such schools.
Special Education
In the year 2006/2007 4,106 pupils studied at school for special education: 1,206in kindergartens, 1,991 in elementary schools and 909 in secondary schools.Of those in the Jerusalem Education Authority, 1,981 pupils studied in theHebrew education schools, 728 studied in Arab schools, and 1,393 studied inUltra-Orthodox schools.
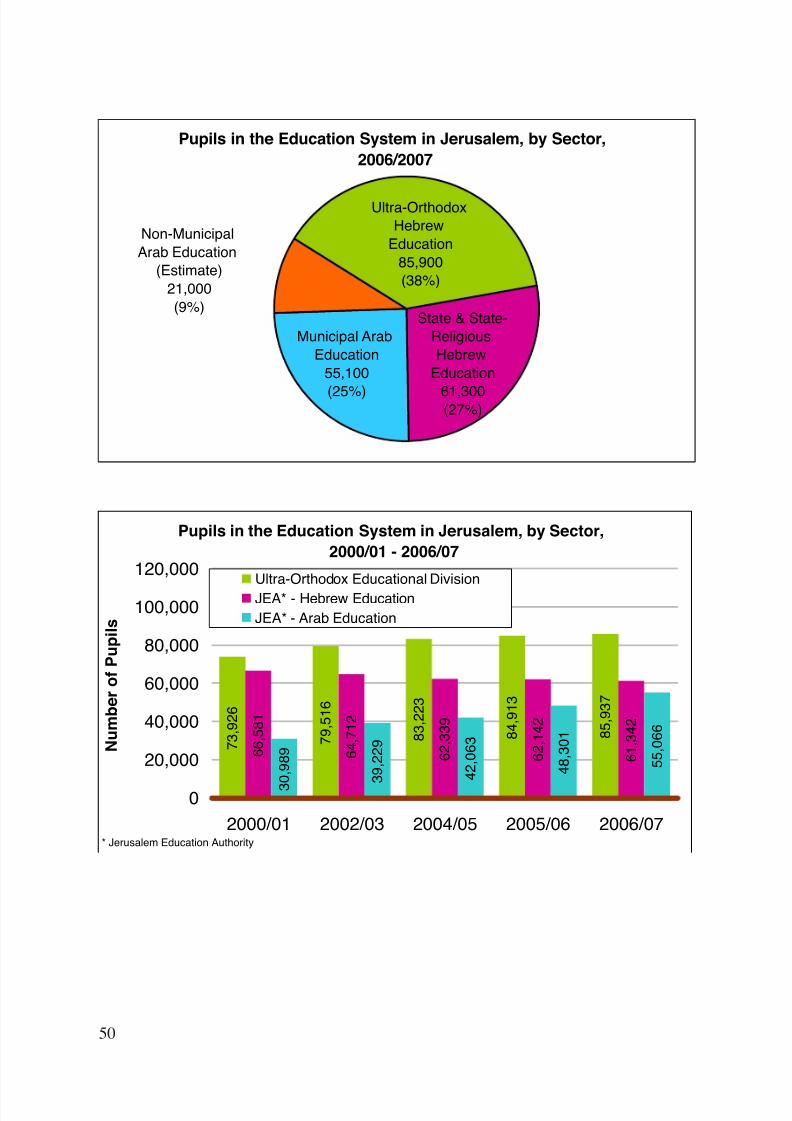
8/7/2019 Jerusalem - Facts and Trends 2005-2006
http://slidepdf.com/reader/full/jerusalem-facts-and-trends-2005-2006 50/72
50
Pupils in the Education System in Jerusalem, by Sector,2000/01 - 2006/07
7 3
, 9 2 6
7 9
, 5 1 6
8 3
, 2 2 3
8 4
, 9 1 3
8 5
, 9 3 7
6 6
, 5 8 1
6 4
, 7 1 2
6 2
, 3 3 9
6 2
, 1 4 2
6 1
, 3 4 2
3 0
, 9 8 9
3 9
, 2 2 9
4 2
, 0 6 3
4 8
, 3 0 1
5 5
, 0 6 6
0
20,000
40,000
60,000
80,000
100,000
120,000
2000/01 2002/03 2004/05 2005/06 2006/07
N u m
b e r o
f P u p
i l s
Ultra-Orthodox Educational DivisionJEA* - Hebrew EducationJEA* - Arab Education
* Jerusalem Education Authority
Pupils in the Education System in Jerusalem, by Sector,2006/2007
State & State-ReligiousHebrew
Education
61,300(27%)
Municipal ArabEducation
55,100
(25%)
Non-MunicipalArab Education
(Estimate)21,000(9%)
Ultra-OrthodoxHebrew
Education85,900(38%)
8/7/2019 Jerusalem - Facts and Trends 2005-2006
http://slidepdf.com/reader/full/jerusalem-facts-and-trends-2005-2006 51/72
51
Entitlement to Matriculation Certi cates
In 2004/2005 7,700 pupils who resided in Jerusalem studied in the 12 th grade of
Jerusalem's Hebrew education system. Only about half (53%) took matriculationexams (over half of the city's pupils study in the Ultra-Orthodox school system,which usually doesn’t prepare its pupils for the matriculation exams). The
percentage of pupils earning matriculation certi cates in Jerusalem stood at 35%of those studying in 12 th grade. Of the pupils who took the exams, 66% receivedcerti cates, compared with 67% nationwide 11. 90% of the pupils who receivedcerti cates in Jerusalem also proved eligible for entrance to university, comparedwith 87% in all of Israel.
The percentages of pupils (in 12 th grade) entitled to matriculation certi catesin localities surrounding Jerusalem were as follows: Efrata, 81%; MevasseretZion, 73%; Har Adar, 68%; Ma'ale Adumim, 64%; the localities of Mate YehudaRegional Council, 58%; Givat Ze'ev, 56%; and Beit Shemesh, 40% (a quarter of the population of Beit Shemesh is Ultra-Orthodox).
There is a connection between the socio-economic status of a population and the
rate of entitlement to matriculation certi cates: the higher the socio-economicstatus, the higher the percentage of entitlement. Among Jewish localities (with a
population of over 10,000) of high socio-economic status, 62% of the 12 th graderswere entitled to matriculation certi cates; among localities of middle socio-economic status, the rate was 57%; among low status localities the rate was 52%(the categorization of socio-economic status is based on a system calculated bythe Ministry of Education).
Higher Education
In the year 2004/2005 124,044 students studied at universities in Israel. 21,919students were enrolled at the Hebrew University of Jerusalem, 18% of all theuniversity students in Israel.
11 From the Collection of Statistics for Jerusalem Day, 2007 , the Central Bureau of Statistics.
8/7/2019 Jerusalem - Facts and Trends 2005-2006
http://slidepdf.com/reader/full/jerusalem-facts-and-trends-2005-2006 52/72
52
54% of the students at the Hebrew University studied towards a rst degree,34% towards a second, 12% towards a third degree and 0.5% studied towards acerti cate. The distribution of students according to faculty was as follows: 29%in the Humanities, 25% in the Social Sciences, 20% in the Natural Sciences andMathematics, 14% in Medicine (including professions associated with it), 8% inAgriculture, 5% in Law, and 0.6% in Engineering and Architecture.
Of all the universities in Israel, the highest number of students was enrolled at TelAviv University – 28,671. Second to Tel Aviv was Bar Ilan University, at which24,983 students were enrolled. Third was the Hebrew University of Jerusalem, atwhich, as was noted, 21,919 students were enrolled in 2004/2005.
The University with the greatest number of students registered for studiesfor a third degree was the Hebrew University of Jerusalem – 2,541 students,representing 27% of all the students studying for a third degree in Israel.In comparison, 1,954 students were studying for a third degree at Tel AvivUniversity (21% of all those in Israel), 1,580 at Bar Ilan University (17%), 930students at Ben-Gurion University (10%), 817 at the Technion (9%) and 802students (9%) at Haifa University. Regarding gender, it turns out that the number of female university students isgreater than the number of male students. In the year 2004/2005, 56% of theuniversity students in Israel were women. At the Hebrew University the percentageof women stood at 58%. The highest percentage of female students was at theUniversity of Haifa, where women comprised 65% of the student body. At theTechnion there was the lowest percentage of women enrolled: 35%.
University Enrollment
In the year 2005/2006 7,761 students applied to the Hebrew University, downfrom 8,639 in 2004/2005 (a drop of 10%) and 8,746 in 1999/2000. 72% of thosewho applied were accepted to the University, and 56% of those accepted chose toattend. In 2005/2006 there were 3,930 applicants to study for a second degree, ascompared to 3,555 applicants in 2004/2005 (a rise of 11%). 79% of the applicantswere accepted, and 75% of those accepted chose to enroll.
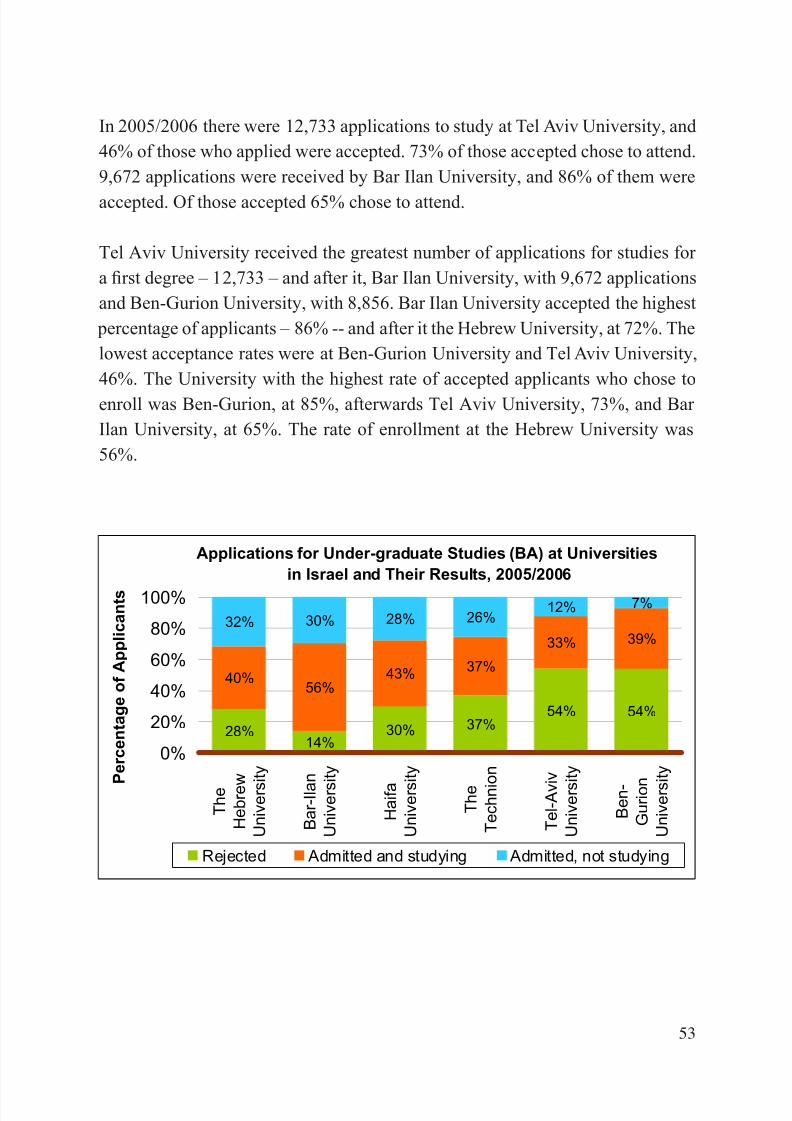
8/7/2019 Jerusalem - Facts and Trends 2005-2006
http://slidepdf.com/reader/full/jerusalem-facts-and-trends-2005-2006 53/72
53
In 2005/2006 there were 12,733 applications to study at Tel Aviv University, and46% of those who applied were accepted. 73% of those accepted chose to attend.9,672 applications were received by Bar Ilan University, and 86% of them wereaccepted. Of those accepted 65% chose to attend.
Tel Aviv University received the greatest number of applications for studies for a rst degree – 12,733 – and after it, Bar Ilan University, with 9,672 applicationsand Ben-Gurion University, with 8,856. Bar Ilan University accepted the highest
percentage of applicants – 86% -- and after it the Hebrew University, at 72%. Thelowest acceptance rates were at Ben-Gurion University and Tel Aviv University,46%. The University with the highest rate of accepted applicants who chose toenroll was Ben-Gurion, at 85%, afterwards Tel Aviv University, 73%, and Bar Ilan University, at 65%. The rate of enrollment at the Hebrew University was56%.
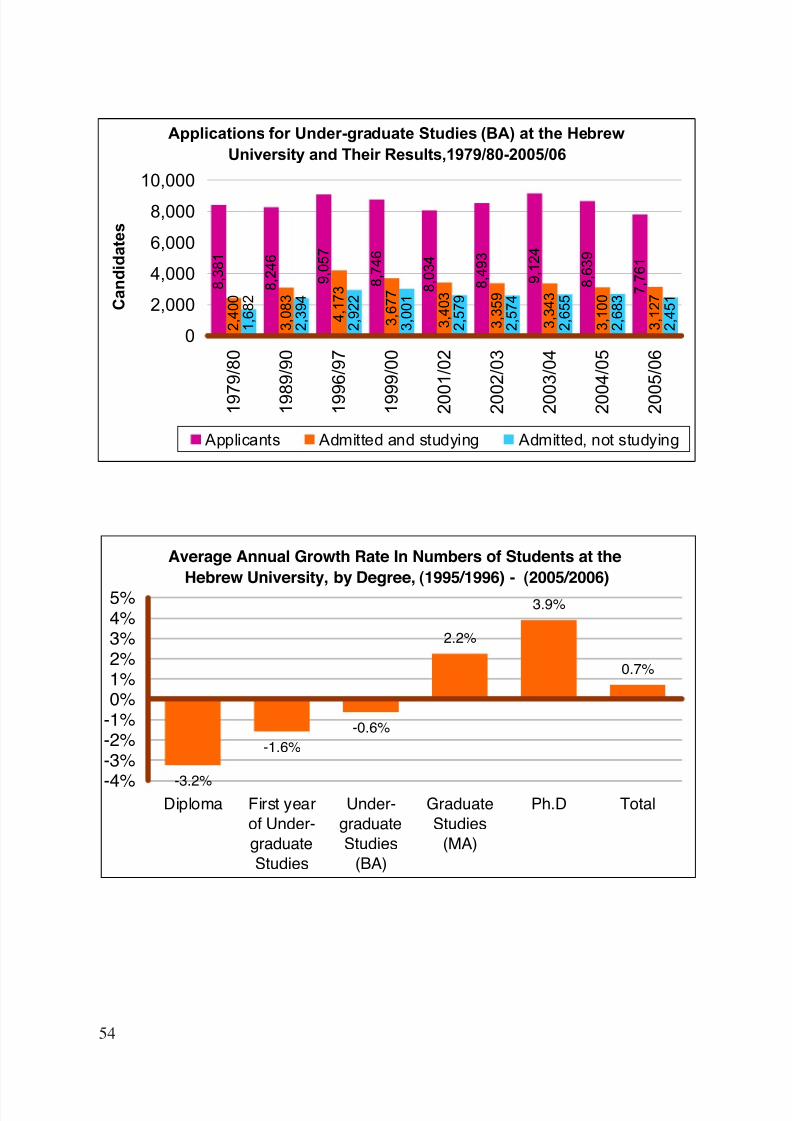
8/7/2019 Jerusalem - Facts and Trends 2005-2006
http://slidepdf.com/reader/full/jerusalem-facts-and-trends-2005-2006 54/72
54
Average Annual Growth Rate In Numbers of Students at theHebrew University, by Degree, (1995/1996) - (2005/2006)
-3.2%
-1.6%-0.6%
2.2%
3.9%
0.7%
-4%
-3%-2%-1%0%1%2%3%4%5%
Diploma First yearof Under-graduateStudies
Under-graduateStudies
(BA)
GraduateStudies
(MA)
Ph.D Total
8/7/2019 Jerusalem - Facts and Trends 2005-2006
http://slidepdf.com/reader/full/jerusalem-facts-and-trends-2005-2006 55/72
55
- Construction -
Apartments
At the end of 2006 there were 184,006 apartments in Jerusalem (according torecords on residential municipal taxes), of which 146,539 (80%) were apartmentsin Jewish neighborhoods and 37,467 (20%) were in Arab neighborhoods.The average apartment size was 77 square meters: 77 sq. meters in Jewishneighborhoods and 74 sq. meters in Arab neighborhoods. Thus there is a small
gap between the average size of apartments in Jewish and Arab neighborhoods.However, in terms of housing density (sq. meter per person) the average in Jewishneighborhoods is signi cantly lower than in Arab neighborhoods. The averagehousing density in Jerusalem was 19 sq. meters per person; 24 sq. meters per
person in Jewish neighborhoods as compared to 11 sq. meters per person in Arabones.Between 1992 and 2006 there was a rise of 12% in the average area of apartmentsin Jerusalem, from 69 sq. meters to 77.
Among the Jewish population, the average density in neighborhoods with anUltra-Orthodox majority was 17 sq. meters per person, whereas the density inneighborhoods of the general Jewish population (religious and non-religious)was 27 sq. meters per person.The neighborhoods of the general Jewish population with the smallest averageapartment size were Givat Hamatos, 26 sq. meters, Nahlaot (Rehov Hamadragot),45 sq. meters, and Zichron Tuvia and Nahlat Zion, 47 sq. meters. The neighborhoodswith the largest average apartment size were Yemin Moshe and Derech Hahoreshin Ramot, 138 sq. meters, Ramat Motza and Motza Illit, 136 sq. meters, andMalcha, 126 sq. meters.Among Arab neighborhoods, the smallest average apartment sizes were in theShouafat Refugee Camp, 35 sq. meters, the Muslim Quarter and the ChristianQuarter, 41 sq. meters. The neighborhoods with the largest average apartmentsize were Beit Hanina (East), 97 sq. meters, Kfar Aqeb, 92 sq. meters, and SheikhJarrah, 90 sq. meters.
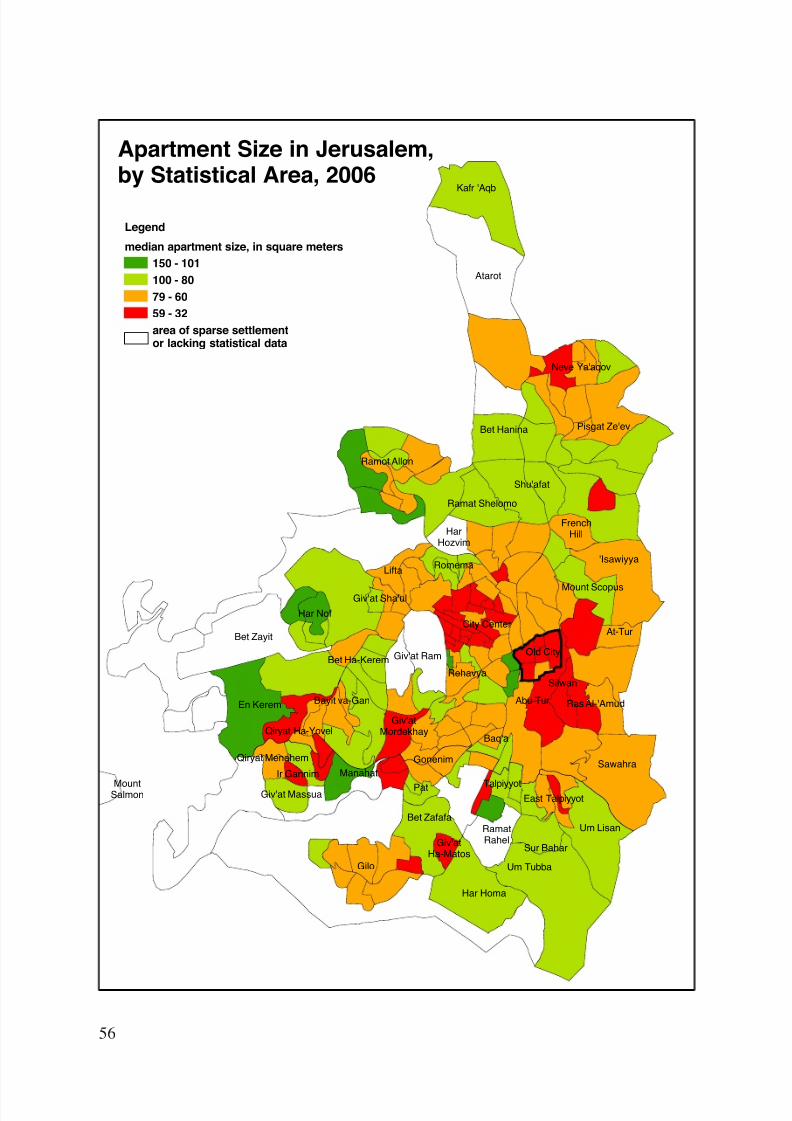
8/7/2019 Jerusalem - Facts and Trends 2005-2006
http://slidepdf.com/reader/full/jerusalem-facts-and-trends-2005-2006 56/72
56
Qiryat Menahem
Giv'atHa-Matos
Giv'at Sha'ul
Pat
Ir Gannim
Giv'atMordekhay
FrenchHill
Giv'at Ram
City Center
Silwan
Lifta
Ramat Shelomo
East Talpiyyot
Ras Al-'Amud
Um Lisan
Sur Bahar
Manahat
Talpiyyot
Qiryat Ha-Yovel
Bet Zafafa
Abu TurBayit va-Gan
Kafr 'Aqb
Har Homa
Giv'at Massua
Sawahra
'Isawiyya
En Kerem
Um Tubba
MountSalmon
Gilo
Baq'a
Gonenim
HarHozvim
Rehavya
RamatRahel
Atarot
Neve Ya'aqov
Bet Hanina Pisgat Ze'ev
Shu'afat
Ramot Allon
Mount Scopus
At-Tur
Old City
Romema
Har Nof
Bet Zayit
Bet Ha-Kerem
Legend
median apartment size, in square meters101-15080-100
60-7932-59
area of sparse settlementor lacking statistical data
Apartment Size in Jerusalem,by Statistical Area, 2006
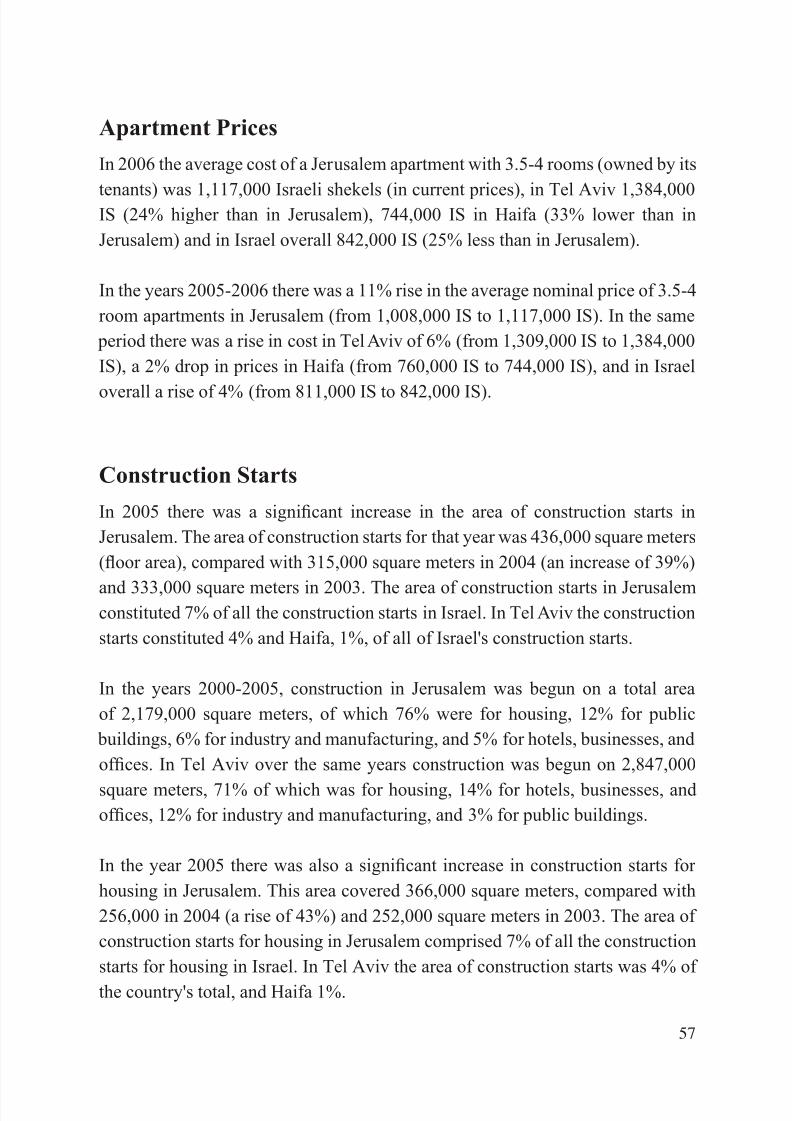
8/7/2019 Jerusalem - Facts and Trends 2005-2006
http://slidepdf.com/reader/full/jerusalem-facts-and-trends-2005-2006 57/72
5
Apartment Prices
In 2006 the average cost of a Jerusalem apartment with 3.5-4 rooms (owned by its
tenants) was 1,117,000 Israeli shekels (in current prices), in Tel Aviv 1,384,000IS (24% higher than in Jerusalem), 744,000 IS in Haifa (33% lower than inJerusalem) and in Israel overall 842,000 IS (25% less than in Jerusalem).
In the years 2005-2006 there was a 11% rise in the average nominal price of 3.5-4room apartments in Jerusalem (from 1,008,000 IS to 1,117,000 IS). In the same
period there was a rise in cost in Tel Aviv of 6% (from 1,309,000 IS to 1,384,000IS), a 2% drop in prices in Haifa (from 760,000 IS to 744,000 IS), and in Israel
overall a rise of 4% (from 811,000 IS to 842,000 IS).
Construction Starts
In 2005 there was a signi cant increase in the area of construction starts inJerusalem. The area of construction starts for that year was 436,000 square meters( oor area), compared with 315,000 square meters in 2004 (an increase of 39%)
and 333,000 square meters in 2003. The area of construction starts in Jerusalemconstituted 7% of all the construction starts in Israel. In Tel Aviv the constructionstarts constituted 4% and Haifa, 1%, of all of Israel's construction starts.
In the years 2000-2005, construction in Jerusalem was begun on a total areaof 2,179,000 square meters, of which 76% were for housing, 12% for public
buildings, 6% for industry and manufacturing, and 5% for hotels, businesses, andof ces. In Tel Aviv over the same years construction was begun on 2,847,000
square meters, 71% of which was for housing, 14% for hotels, businesses, andof ces, 12% for industry and manufacturing, and 3% for public buildings.
In the year 2005 there was also a signi cant increase in construction starts for housing in Jerusalem. This area covered 366,000 square meters, compared with256,000 in 2004 (a rise of 43%) and 252,000 square meters in 2003. The area of construction starts for housing in Jerusalem comprised 7% of all the constructionstarts for housing in Israel. In Tel Aviv the area of construction starts was 4% of the country's total, and Haifa 1%.
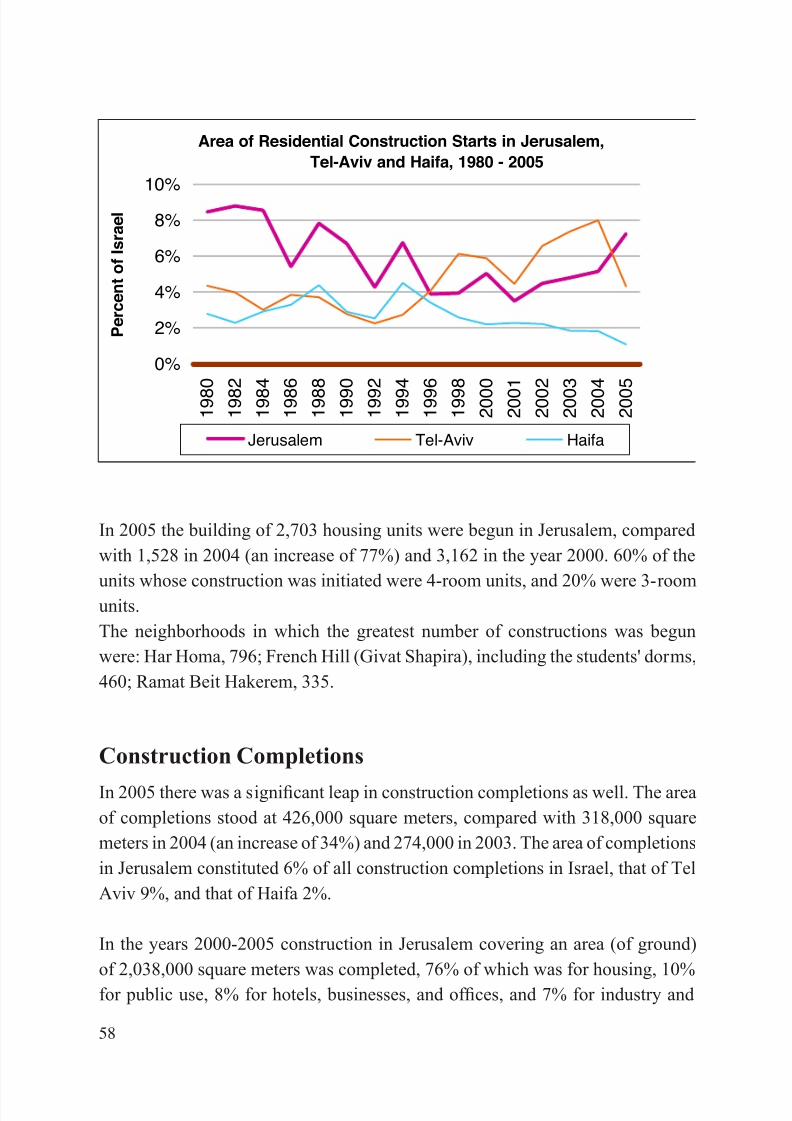
8/7/2019 Jerusalem - Facts and Trends 2005-2006
http://slidepdf.com/reader/full/jerusalem-facts-and-trends-2005-2006 58/72
58
In 2005 the building of 2,703 housing units were begun in Jerusalem, comparedwith 1,528 in 2004 (an increase of 77%) and 3,162 in the year 2000. 60% of the
units whose construction was initiated were 4-room units, and 20% were 3-roomunits.The neighborhoods in which the greatest number of constructions was begunwere: Har Homa, 796; French Hill (Givat Shapira), including the students' dorms,460; Ramat Beit Hakerem, 335.
Construction Completions
In 2005 there was a signi cant leap in construction completions as well. The areaof completions stood at 426,000 square meters, compared with 318,000 squaremeters in 2004 (an increase of 34%) and 274,000 in 2003. The area of completionsin Jerusalem constituted 6% of all construction completions in Israel, that of TelAviv 9%, and that of Haifa 2%.
In the years 2000-2005 construction in Jerusalem covering an area (of ground)of 2,038,000 square meters was completed, 76% of which was for housing, 10%for public use, 8% for hotels, businesses, and of ces, and 7% for industry and
Area of Residential Construction Starts in Jerusalem,Tel-Aviv and Haifa, 1980 - 2005
0%
2%
4%
6%
8%
10%
1 9 8 0
1 9 8 2
1 9 8 4
1 9 8 6
1 9 8 8
1 9 9 0
1 9 9 2
1 9 9 4
1 9 9 6
1 9 9 8
2 0 0 0
2 0 0 1
2 0 0 2
2 0 0 3
2 0 0 4
2 0 0 5
P e r c e n
t o
f I s r a e l
Jerusalem Tel-Aviv Haifa
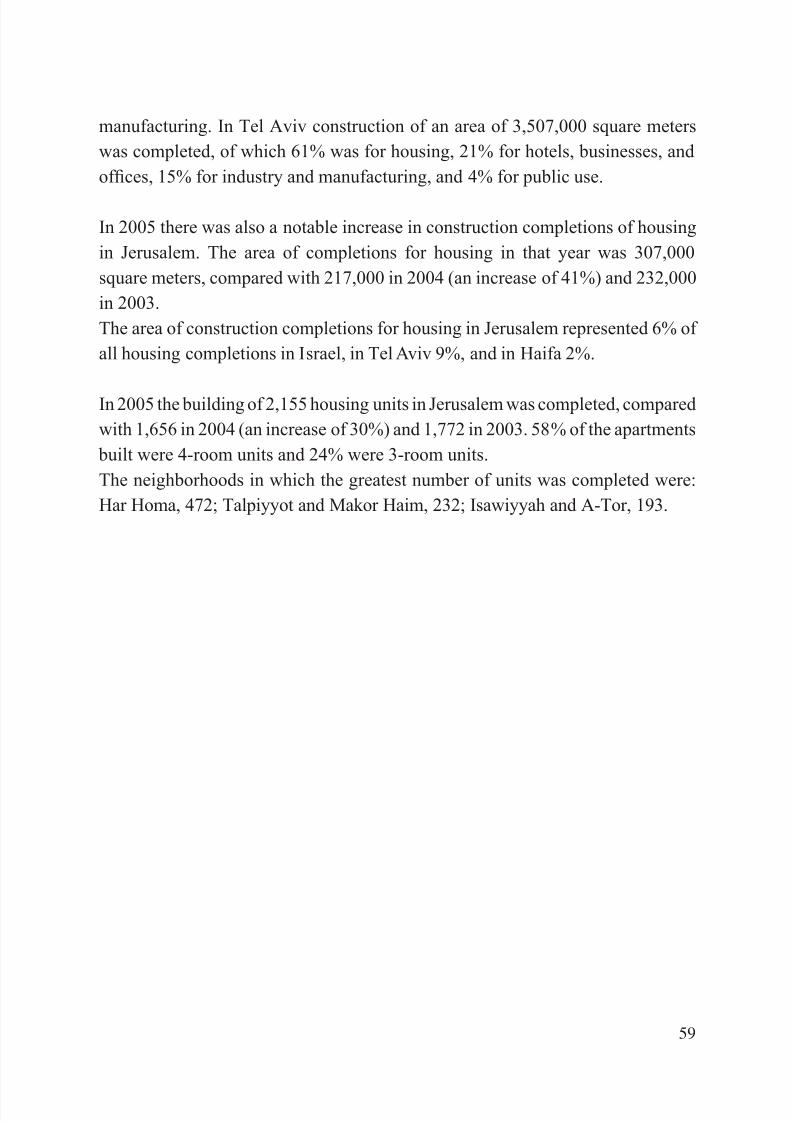
8/7/2019 Jerusalem - Facts and Trends 2005-2006
http://slidepdf.com/reader/full/jerusalem-facts-and-trends-2005-2006 59/72
5
manufacturing. In Tel Aviv construction of an area of 3,507,000 square meterswas completed, of which 61% was for housing, 21% for hotels, businesses, andof ces, 15% for industry and manufacturing, and 4% for public use.
In 2005 there was also a notable increase in construction completions of housingin Jerusalem. The area of completions for housing in that year was 307,000square meters, compared with 217,000 in 2004 (an increase of 41%) and 232,000in 2003.The area of construction completions for housing in Jerusalem represented 6% of all housing completions in Israel, in Tel Aviv 9%, and in Haifa 2%.
In 2005 the building of 2,155 housing units in Jerusalem was completed, comparedwith 1,656 in 2004 (an increase of 30%) and 1,772 in 2003. 58% of the apartments
built were 4-room units and 24% were 3-room units.The neighborhoods in which the greatest number of units was completed were:Har Homa, 472; Talpiyyot and Makor Haim, 232; Isawiyyah and A-Tor, 193.
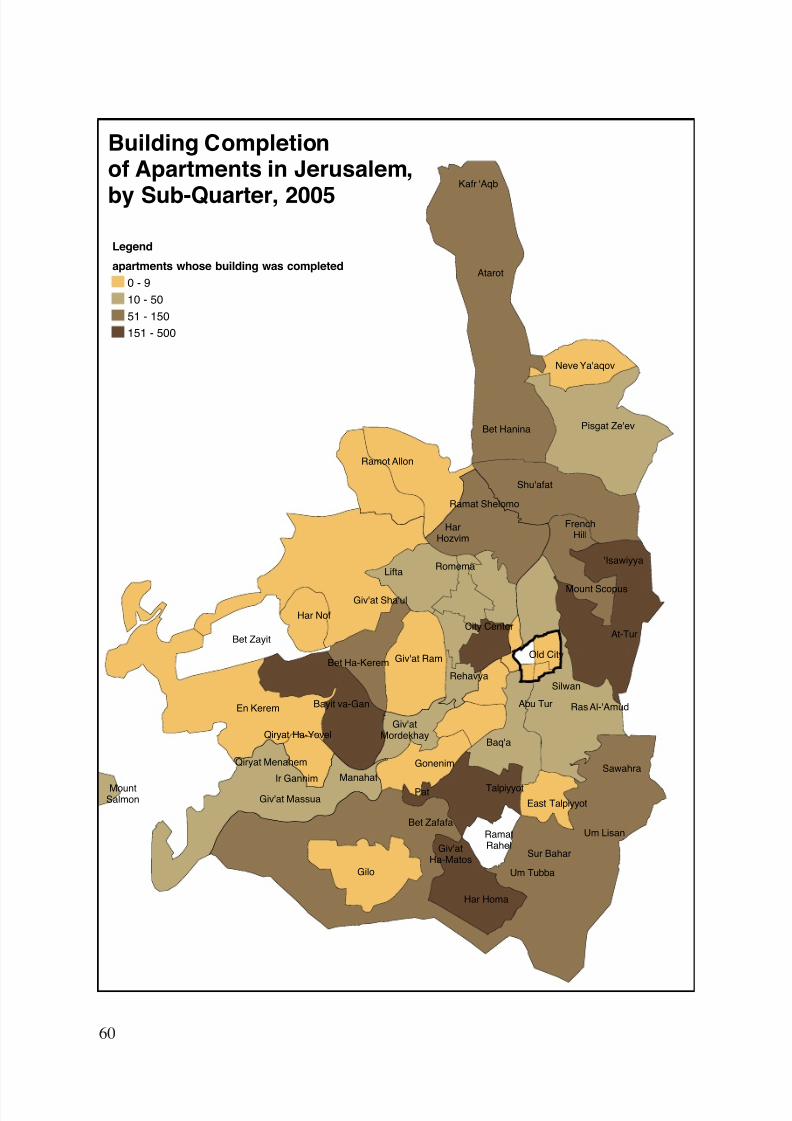
8/7/2019 Jerusalem - Facts and Trends 2005-2006
http://slidepdf.com/reader/full/jerusalem-facts-and-trends-2005-2006 60/72
60
Qiryat Menahem
Giv'atHa-Matos
Giv'at Sha'ul
PatIr Gannim
Giv'atMordekhay
FrenchHill
Giv'at Ram
City Center
Silwan
Lifta
Ramat Shelomo
East Talpiyyot
Ras Al-'Amud
Um Lisan
Sur Bahar
ManahatTalpiyyot
Qiryat Ha-Yovel
Bet Zafafa
Abu TurBayit va-Gan
Kafr 'Aqb
Har Homa
Giv'at Massua
Sawahra
'Isawiyya
En Kerem
Um Tubba
MountSalmon
Gilo
Baq'a
Gonenim
HarHozvim
Rehavya
RamatRahel
Atarot
Neve Ya'aqov
Bet Hanina Pisgat Ze'ev
Shu'afat
Ramot Allon
Mount Scopus
At-Tur
Old City
Romema
Har Nof
Bet Zayit
Bet Ha-Kerem
Legend
apartments whose building was completed0 - 910 - 5051 - 150151 - 500
Building Completionof Apartments in Jerusalem,
by Sub-Quarter, 2005
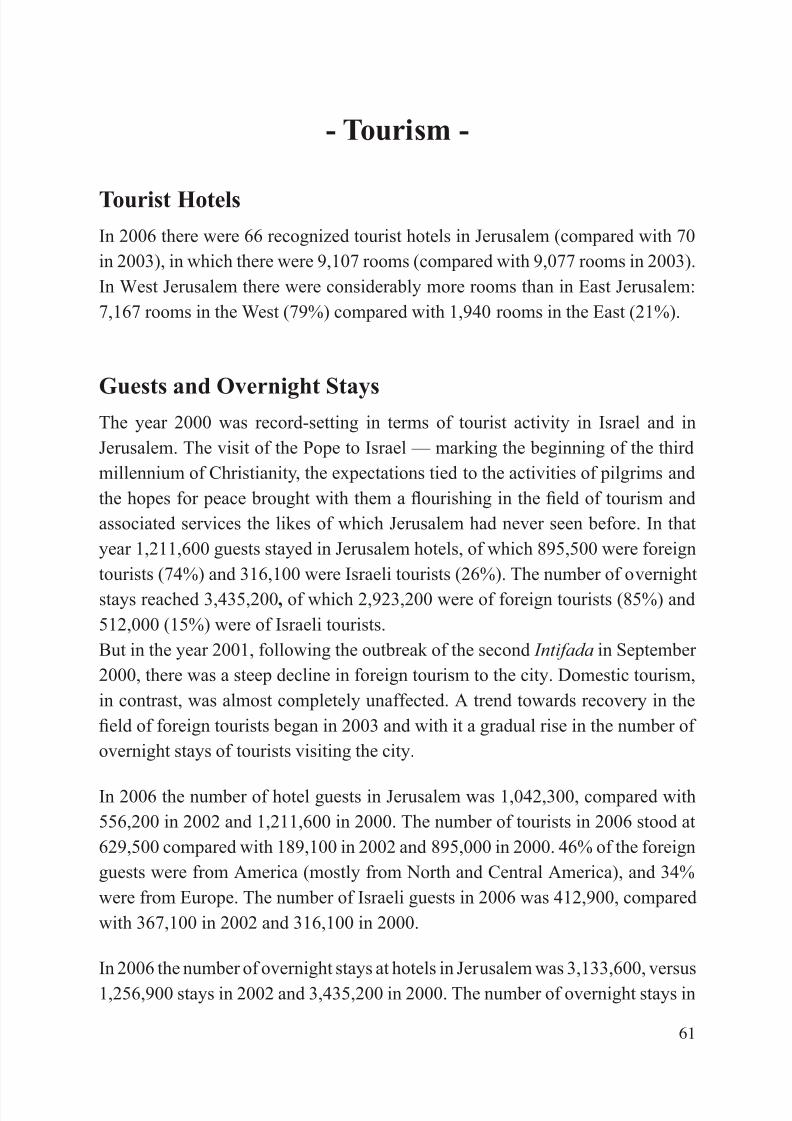
8/7/2019 Jerusalem - Facts and Trends 2005-2006
http://slidepdf.com/reader/full/jerusalem-facts-and-trends-2005-2006 61/72
61
- Tourism -
Tourist HotelsIn 2006 there were 66 recognized tourist hotels in Jerusalem (compared with 70in 2003), in which there were 9,107 rooms (compared with 9,077 rooms in 2003).In West Jerusalem there were considerably more rooms than in East Jerusalem:7,167 rooms in the West (79%) compared with 1,940 rooms in the East (21%).
Guests and Overnight StaysThe year 2000 was record-setting in terms of tourist activity in Israel and inJerusalem. The visit of the Pope to Israel — marking the beginning of the thirdmillennium of Christianity, the expectations tied to the activities of pilgrims andthe hopes for peace brought with them a ourishing in the eld of tourism andassociated services the likes of which Jerusalem had never seen before. In thatyear 1,211,600 guests stayed in Jerusalem hotels, of which 895,500 were foreigntourists (74%) and 316,100 were Israeli tourists (26%). The number of overnightstays reached 3,435,200 , of which 2,923,200 were of foreign tourists (85%) and512,000 (15%) were of Israeli tourists.But in the year 2001, following the outbreak of the second Intifada in September 2000, there was a steep decline in foreign tourism to the city. Domestic tourism,in contrast, was almost completely unaffected. A trend towards recovery in the
eld of foreign tourists began in 2003 and with it a gradual rise in the number of overnight stays of tourists visiting the city.
In 2006 the number of hotel guests in Jerusalem was 1,042,300, compared with556,200 in 2002 and 1,211,600 in 2000. The number of tourists in 2006 stood at629,500 compared with 189,100 in 2002 and 895,000 in 2000. 46% of the foreignguests were from America (mostly from North and Central America), and 34%were from Europe. The number of Israeli guests in 2006 was 412,900, comparedwith 367,100 in 2002 and 316,100 in 2000.
In 2006 the number of overnight stays at hotels in Jerusalem was 3,133,600, versus1,256,900 stays in 2002 and 3,435,200 in 2000. The number of overnight stays in
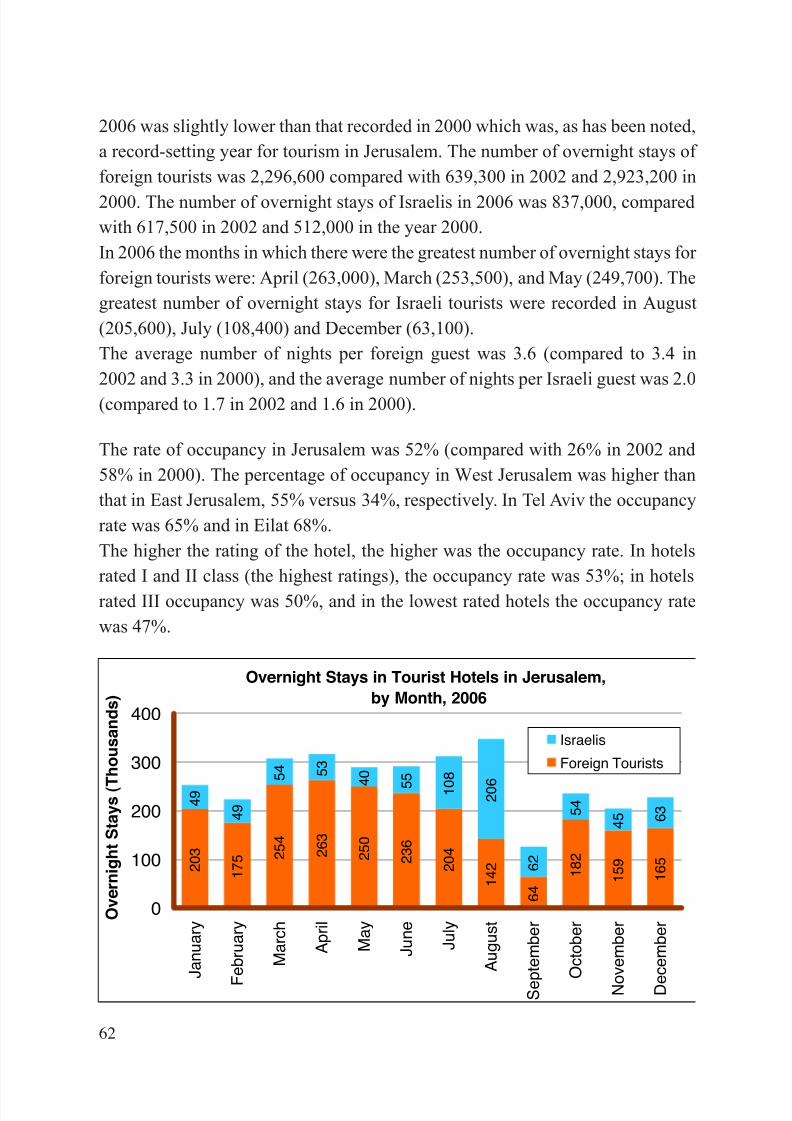
8/7/2019 Jerusalem - Facts and Trends 2005-2006
http://slidepdf.com/reader/full/jerusalem-facts-and-trends-2005-2006 62/72
62
2006 was slightly lower than that recorded in 2000 which was, as has been noted,a record-setting year for tourism in Jerusalem. The number of overnight stays of foreign tourists was 2,296,600 compared with 639,300 in 2002 and 2,923,200 in2000. The number of overnight stays of Israelis in 2006 was 837,000, comparedwith 617,500 in 2002 and 512,000 in the year 2000.In 2006 the months in which there were the greatest number of overnight stays for foreign tourists were: April (263,000), March (253,500), and May (249,700). Thegreatest number of overnight stays for Israeli tourists were recorded in August(205,600), July (108,400) and December (63,100).The average number of nights per foreign guest was 3.6 (compared to 3.4 in2002 and 3.3 in 2000), and the average number of nights per Israeli guest was 2.0(compared to 1.7 in 2002 and 1.6 in 2000).
The rate of occupancy in Jerusalem was 52% (compared with 26% in 2002 and58% in 2000). The percentage of occupancy in West Jerusalem was higher thanthat in East Jerusalem, 55% versus 34%, respectively. In Tel Aviv the occupancyrate was 65% and in Eilat 68%.The higher the rating of the hotel, the higher was the occupancy rate. In hotelsrated I and II class (the highest ratings), the occupancy rate was 53%; in hotelsrated III occupancy was 50%, and in the lowest rated hotels the occupancy ratewas 47%.
Overnight Stays in Tourist Hotels in Jerusalem,by Month, 2006
2 0 3
1 7 5 2
5 4
2 6 3
2 5 0
2 3 6
2 0 4
1 4 2
6 4
1 8 2
1 5 9
1 6 5
4 9
4 9
5 4 5
3 4 0
5 5
1 0 8
2 0 6
6 2
5 4
4 5 6
3
0
100
200
300
400
J a n u a r y
F e b r u a r y
M a r c h
A p r i l
M a y
J u n e
J u l y
A u g u s t
S e p t e m b e r
O c t o b e r
N o
v e m b e r
D e
c e m b e r O
v e r n i g h t S t a y s ( T h o u s a n
d s )
Israelis
Foreign Tourists
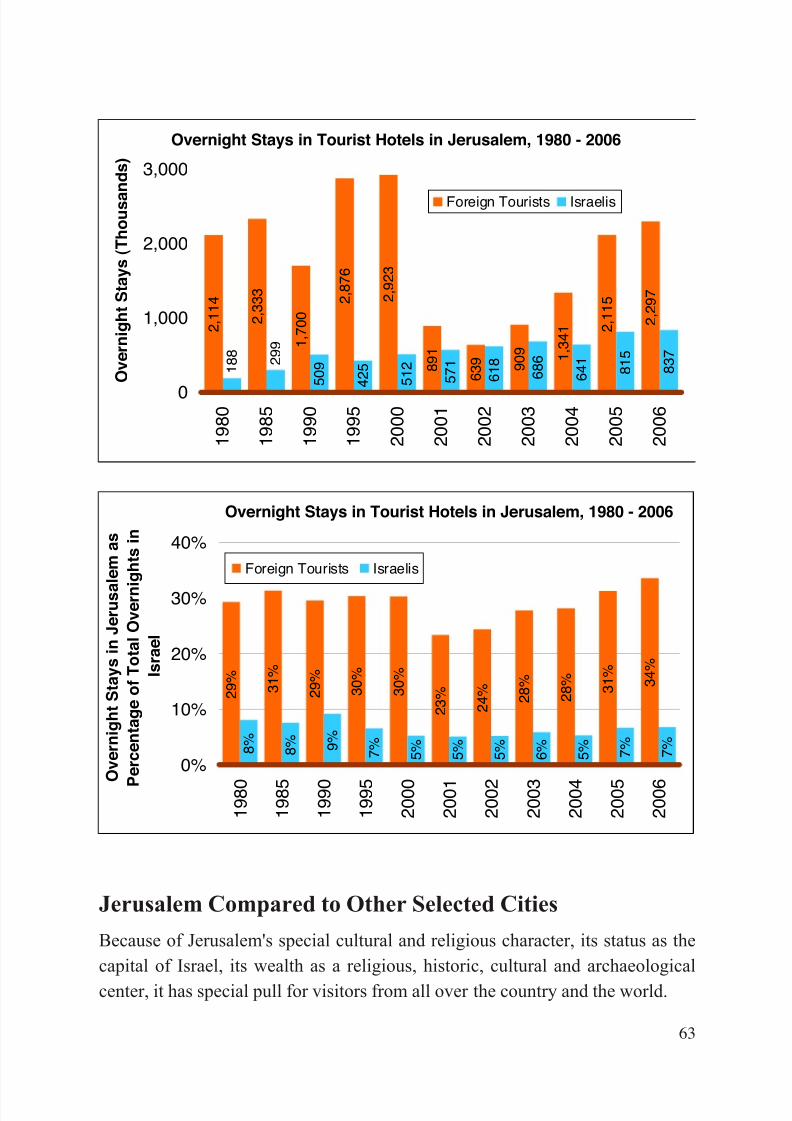
8/7/2019 Jerusalem - Facts and Trends 2005-2006
http://slidepdf.com/reader/full/jerusalem-facts-and-trends-2005-2006 63/72
63
Jerusalem Compared to Other Selected Cities
Because of Jerusalem's special cultural and religious character, its status as thecapital of Israel, its wealth as a religious, historic, cultural and archaeologicalcenter, it has special pull for visitors from all over the country and the world.
Overnight Stays in Tourist Hotels in Jerusalem, 1980 - 2006
2 , 1
1 4
2 , 3
3 3
1 , 7
0 0
2 , 8
7 6
2 , 9
2 3
8 9 1
6 3 9 9
0 9 1
, 3 4 1 2
, 1 1 5
2 , 2
9 7
5 0 9
4 2 5
5 1 2
5 7 1
6 1 8
6 8 6
6 4 1
8 1 5
8 3 7 2
9 9
1 8 8
0
1,000
2,000
3,000
1 9 8 0
1 9 8 5
1 9 9 0
1 9 9 5
2 0 0 0
2 0 0 1
2 0 0 2
2 0 0 3
2 0 0 4
2 0 0 5
2 0 0 6
O v e r n
i g h t S t a y s ( T h o u s a n
d s )
Foreign Tourists Israelis
Overnight Stays in Tourist Hotels in Jerusalem, 1980 - 2006
2 9 %
3 1 %
2 9 %
3 0 %
3 0 %
2 3 %
2 4 % 2
8 %
2 8 % 3
1 %
3 4 %
8 %
8 % 9
% 7 %
5 %
5 %
5 %
6 %
5 % 7
% 7 %
0%
10%
20%
30%
40%
1 9 8 0
1 9 8 5
1 9 9 0
1 9 9 5
2 0 0 0
2 0 0 1
2 0 0 2
2 0 0 3
2 0 0 4
2 0 0 5
2 0 0 6
O v e r n
i g h t S t a y s i n J e r u s a l e m a s
P
e r c e n t a g e o
f T o
t a l O v e r n
i g h t s i n
I s r a e l
Foreign Tourists Israelis
8/7/2019 Jerusalem - Facts and Trends 2005-2006
http://slidepdf.com/reader/full/jerusalem-facts-and-trends-2005-2006 64/72
64
In 2006 1,042,300 guests stayed at Jerusalem hotels (14% of all the guests athotels in Israel), compared with 804,700 guests in Tel Aviv (11%) and 2,285,000guests in Eilat (31%). The number of foreign guests who stayed in recognizedtourist hotels in Jerusalem stood at 629,500 (30% of all the foreign guests inIsrael), compared with 478,600 in Tel Aviv (22%) and 231,500 in Eilat (11%).
In 2006 the total number of overnight stays in Jerusalem was 3,133,600 (16%of all overnight stays in Israel), compared with 2,191,900 such stays in Tel Aviv(11%) and 6,651,600 in Eilat (34%). The number of foreign tourist overnightstays in Jerusalem was 2,296,600 (34% of all overnight stays in Israel), 1,581,300in Tel Aviv (23%) and 767,800 in Eilat (11%). Before the second intifada thenumber of overnight stays of foreign tourists in Jerusalem was signi cantlyhigher than that in Tel Aviv, but after the outbreak of the intifada the gap betweenthe two gradually shrank. Over the years 1995-2000 the percentage of foreigntourist stays in Jerusalem comprised between 27% and 30% of all the overnightstays in Israel, compared with 17% to 18% in Tel Aviv.
The number of overnight stays of Israelis in Jerusalem hotels and the percentageof these versus all the hotel stays of Israelis is signi cantly lower than those of foreign tourists. In 2006 the number of overnights stays of Israelis in Jerusalem
Overnight Stays in Tourist Hotels in Selected Localities,
1980 - 2006
0%5%
10%15%20%25%30%35%40%45%
1 9 8 0
1 9 8 5
1 9 9 0
1 9 9 5
2 0 0 0
2 0 0 1
2 0 0 2
2 0 0 3
2 0 0 4
2 0 0 5
2 0 0 6
P e r c e n
t a g e o
f T o
t a l
O v e r n
i g h t S t a y s i n I s r a e l Jerusalem
Elat
Haifa
Tel-Aviv
8/7/2019 Jerusalem - Facts and Trends 2005-2006
http://slidepdf.com/reader/full/jerusalem-facts-and-trends-2005-2006 65/72
65
stood at 837,000 (7% of all Israeli overnights in Israel) versus 610,600 in Tel Aviv(5%) and 5,883,900 in Eilat (47%).
West Jerusalem – East Jerusalem
In 2006 943,400 guests (of whom 58% were foreign guests) stayed in hotels inWest Jerusalem , as compared with 529,800 guests in 2002 (32% of whom wereforeign guests), and 1,040,800 guests in 2000 (71% of whom were foreigners).The number of overnight stays was 2,820,900 (72% were foreign touristovernights), compared with 1,154,400 overnights in 2002 (47% of foreigners)
and 2,844,600 overnights in 2000 (83% foreign tourists).The occupancy rate was 55% in 2006, compared with 26% in 2002 and 61% in2000.
In 2006 98,900 guests stayed in hotels in East Jerusalem (80% of whom wereforeign guests), compared with 26,300 guests in 2002 (76% foreigners) and170,800 guests in 2000 (94% foreign guests).The number of overnight stays in East Jerusalem stood at 312,700 (87% foreignguests) compared with 102,500 stays in 2002 (89% foreigners) and 590,600 staysin 2000 (97% of which were foreign guests).The occupancy rate in 2006 was 34%, compared with 22% in 2002 and 47% in2000.
Revenue
In 2006 the total revenues of Jerusalem hotels from foreign and Israeli touristswas 1,136,805,000 IS (most of this – 90% -- went to hotels in West Jerusalem). InTel Aviv the revenues amounted to 1,137,853,000 IS and in Eilat 1,815,608,000IS. In comparison with 2005 there was a 12% rise in the revenues of Jerusalemhotels, a 7% rise in Tel Aviv hotels and 10% in Eilat's.
8/7/2019 Jerusalem - Facts and Trends 2005-2006
http://slidepdf.com/reader/full/jerusalem-facts-and-trends-2005-2006 66/72
66
- Museums -
Jerusalem is known for its wide range of museums, its wealth of exhibitionsand the displays that it offers to millions of visitors from all over Israel andthe world. In 1999 4 million people visited the following museums: the IsraelMuseum (including the Rockefeller Archaeological Museum and the Ticho HouseMuseum), the Tower of David, Yad Vashem, The Isaac Kaplan Old Yishuv CourtMuseum, the Nature Museum, the L.A. Mayer Museum for Islamic Art, TheBloom eld Science Museum, the Bible Lands Museum and the Underground
Prisoners Museum. Yet as a result of the second Intifada in 2000 there was aconsiderable decline in the number of visitors to Jerusalem's museums, as alreadynoted. In 2001, 1.5 million people visited the listed museums, in 2002 1.2 million,and in 2005 the number of visitors climbed back to 2 million.
In 2005 the three museums with the highest number of visitors were Yad Vashem,the Israel Museum, and the Bloom eld Science Museum. The Museum YadVashem, which documents the Jewish Holocaust, draws visitors from all over
Israel and the world. In 2005 there were one million visitors to the museum(compared with 567,000 in 2002 and 2 million in 1999). The Israel Museumdrew 409,000 visitors (in contrast with 364,000 in 2002 and 821,000 in 1999).There were 178,000 visitors to the Science Museum (compared with 135,000 in2002 and 139,000 in 1999).
8/7/2019 Jerusalem - Facts and Trends 2005-2006
http://slidepdf.com/reader/full/jerusalem-facts-and-trends-2005-2006 67/72
6
- Transportation -
VehiclesIn 2005 there were 146,451 motorized vehicles registered in Jerusalem, 77%of which were private cars. In Tel Aviv, by comparison, there were 220,739registered motorized vehicles (most of the country’s company vehicles are listedin Tel Aviv), 70% of which were private cars.
In 2005 the level of motorization (number of vehicles per 1,000 residents) inJerusalem was 203. The level of motorization of private vehicles in Jerusalemstood at 157, compared with 182 nationwide, 409 in Tel Aviv and 286 in Haifa.
Jerusalem is characterized by a low percentage of new cars and a high percentageof old ones. In 2005 40% of the cars in Jerusalem had manufacture dates of 1995or before, compared to 30% in Israel overall, 21% in Tel Aviv and 24% in Haifa.7% of the cars in Jerusalem were manufactured in 2005 or later, compared with14% in Israel overall, 24% in Tel Aviv and 14% in Haifa. The average age of acar in Jerusalem was 8.2 years old, compared with 6.7 in all of Israel, 5.3 in TelAviv and 6.1 in Haifa.
Road Accidents
In Jerusalem in 2005 there were 1,255 road accidents with injuries, compared with1,284 such accidents in 2004 and 1,142 accidents in 2003. The number of roadaccidents in Jeruaslem in 2005 (1,255) was lower than the number of accidents inTel Aviv (2,252) and higher than the number in Haifa (805).90% of the accidents that took place in Jerusalem were considered light, 9%moderate, and 1% fatal.
2,276 people were injured in road accidents: 94% were light injuries, 5% wereserious injuries, and 1% were fatalities. The distribution in the severity of theinjuries was similar to that of previous years. Most of those injured in traf caccidents (85%) were drivers or passengers in cars, 14% were pedestrians, and1% were bicyclists. The highest number of injuries was recorded in the age group20-24.
8/7/2019 Jerusalem - Facts and Trends 2005-2006
http://slidepdf.com/reader/full/jerusalem-facts-and-trends-2005-2006 68/72
68
- Health -
In 2005 there were 2,681 hospital beds authorized according to standards(compared with 2,557 beds in 2004): 24% of the beds were at Hadassah EinKerem, 16% were at Shaarei Tzedek, 12% at Ezrat Nashim-Herzog, 11% atHadassah Mt. Scopus, 9% at El Makassid, 7% at Bikur Holim, and 21% at therest of the city's hospitals. 79% of the authorized beds (according to standard)were in the Jewish areas of the city. The total number of days of hospitalization inthe city was 886,506 days, 86% of which were in the Jewish areas of the city.
In the institutions for the mentally ill there were 458 beds authorized according tostandards, and the number of hospitalization days in them was 122,443.
In 2005 195,963 people were cared for in the city's hospitals: 165,743 of themwere treated in hospitals in the Jewish parts of the city (85%) and approximately30,220 in hospitals in the Arab parts of the city.In 2005 there were 344,745 requests for care in emergency rooms, 32% of whichwere to the TEREM clinic, 22% were to Shaarei Tzedek and 21% to Hadassah
Ein Kerem.
8/7/2019 Jerusalem - Facts and Trends 2005-2006
http://slidepdf.com/reader/full/jerusalem-facts-and-trends-2005-2006 69/72
6
- Jerusalem as a Component of National Strength 12 -
This chapter is based on ndings of a telephone survey 13 whose aim was to learnabout the importance of the status of Jerusalem as a component of Israel's nationalstrength, as perceived by the Israeli public. The survey was executed in 2006 14 and included a representative sampling of 500 people from the adult (aged 18+)Jewish population of Israel. A similar survey was executed in 2005. 15
In 2006, 66% of those surveyed were women. 5% de ned themselves as Ultra-Orthodox, 21% as religious, 29% as traditional, and 44% secular. 28% were aged18-30, 22% 31-45, 23% 46-60, and 27% aged 61 or over.In 2006 most of the public (92%) considered it important or very important thatthere be a strong Jewish majority in Jerusalem, compared with 95% who heldthat opinion in 2005. Despite the slight decline in the importance attributed to aJewish majority in Jerusalem, more than 90% still ascribed importance or greatimportance to the issue. 6% thought that a Jewish majority in Jerusalem is notvery important, and only 3% thought it is not at all important.In accordance with these ndings, 81% believed that Jerusalem based on a clear Jewish majority contributes to the national strength of Israel, compared with 77%that supported this in 2005.Regarding Jewish settlement in the Jerusalem region, 62% believed that Jewishsettlement in Ma'ale Adumim, Gush Etzion and its surroundings contribute to thestrengthening of Jerusalem, and 66% believed that settlement west of the city – inthe Jerusalem hills – contribute to its strength.
While a majority of the country's Jewish residents (92%) attributed importance toa Jewish majority in Jerusalem, it is interesting to note that in the framework of a real peace agreement there is willingness to make compromises on Jerusalem,concessions that might contribute to the attainment of a peace agreement. 58% of the adult Jewish population is willing to make certain concessions in Jerusalem in
12 This section is based on a survey conducted by Israel Kimhi, Maya Choshen, and Yair Assaf-Shapira.13 This survey was conducted by the Tatzpit Institute under the direction of Dr. Aharon Fein.14
At the end of the year.15 At the end of the year.
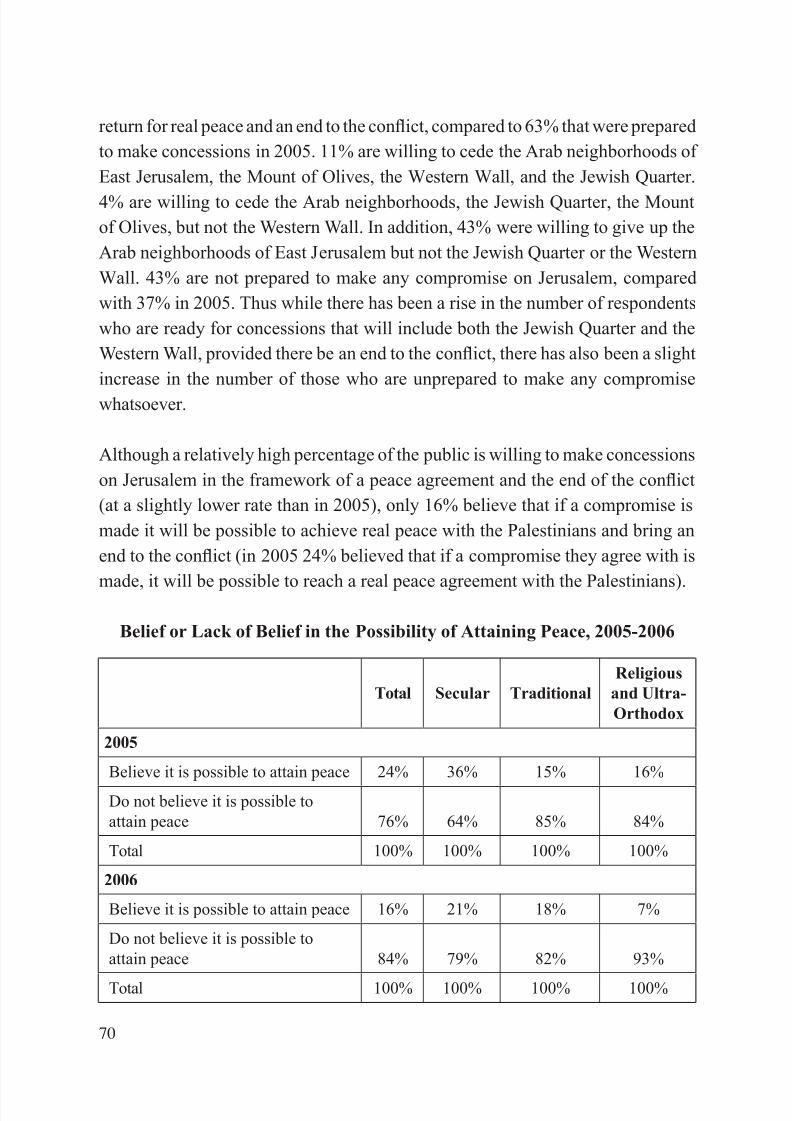
8/7/2019 Jerusalem - Facts and Trends 2005-2006
http://slidepdf.com/reader/full/jerusalem-facts-and-trends-2005-2006 70/72
0
return for real peace and an end to the con ict, compared to 63% that were preparedto make concessions in 2005. 11% are willing to cede the Arab neighborhoods of East Jerusalem, the Mount of Olives, the Western Wall, and the Jewish Quarter.4% are willing to cede the Arab neighborhoods, the Jewish Quarter, the Mountof Olives, but not the Western Wall. In addition, 43% were willing to give up theArab neighborhoods of East Jerusalem but not the Jewish Quarter or the WesternWall. 43% are not prepared to make any compromise on Jerusalem, comparedwith 37% in 2005. Thus while there has been a rise in the number of respondentswho are ready for concessions that will include both the Jewish Quarter and theWestern Wall, provided there be an end to the con ict, there has also been a slightincrease in the number of those who are unprepared to make any compromisewhatsoever.
Although a relatively high percentage of the public is willing to make concessionson Jerusalem in the framework of a peace agreement and the end of the con ict(at a slightly lower rate than in 2005), only 16% believe that if a compromise ismade it will be possible to achieve real peace with the Palestinians and bring anend to the con ict (in 2005 24% believed that if a compromise they agree with is
made, it will be possible to reach a real peace agreement with the Palestinians).
Belief or Lack of Belief in the Possibility of Attaining Peace, 2005-2006
Religiousand Ultra-Orthodox
TraditionalSecularTotal
2005
16%15%36%24%Believe it is possible to attain peace
84%85%64%76%Do not believe it is possible toattain peace
100%100%100%100%Total
2006
7%18%21%16%Believe it is possible to attain peace
93%82%79%84%Do not believe it is possible toattain peace
100%100%100%100%Total
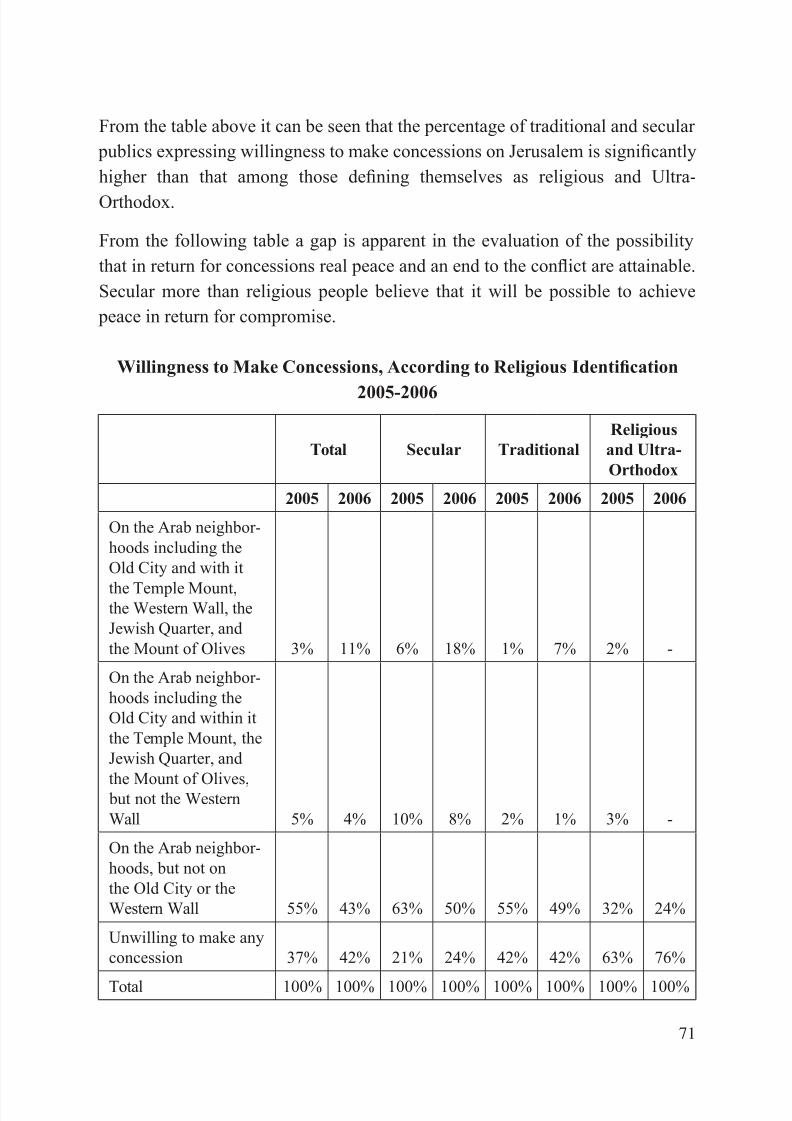
8/7/2019 Jerusalem - Facts and Trends 2005-2006
http://slidepdf.com/reader/full/jerusalem-facts-and-trends-2005-2006 71/72
1
From the table above it can be seen that the percentage of traditional and secular publics expressing willingness to make concessions on Jerusalem is signi cantlyhigher than that among those de ning themselves as religious and Ultra-Orthodox.
From the following table a gap is apparent in the evaluation of the possibilitythat in return for concessions real peace and an end to the con ict are attainable.Secular more than religious people believe that it will be possible to achieve
peace in return for compromise.
Willingness to Make Concessions, According to Religious Identi cation
2005-2006
Religiousand Ultra-Orthodox
TraditionalSecularTotal
20062005200620052006200520062005
-2%7%1%18%6%11%3%
On the Arab neighbor-hoods including theOld City and with it
the Temple Mount,the Western Wall, theJewish Quarter, andthe Mount of Olives
-3%1%2%8%10%4%5%
On the Arab neighbor-hoods including theOld City and within itthe Temple Mount, theJewish Quarter, and
the Mount of Olives, but not the WesternWall
24%32%49%55%50%63%43%55%
On the Arab neighbor-hoods, but not onthe Old City or theWestern Wall
76%63%42%42%24%21%42%37%Unwilling to make anyconcession
100%100%100%100%100%100%100%100%Total
8/7/2019 Jerusalem - Facts and Trends 2005-2006
http://slidepdf.com/reader/full/jerusalem-facts-and-trends-2005-2006 72/72
A relatively high percentage of adult residents of the country visited Jerusalemin recent years. Of the whole population 61% noted that they had visited the OldCity or the Western Wall in the last year (compared to 56% in 2005), 14% notedthat they had been to the Western Wall between one and two years previously, 7%
paid a visit in more than two but less than ve years, and 5% did so 5 years ago or more. This distribution is very similar to the data from the survey from 2005.